Copyright 0 1991 by the Genetics Society f America Pairwise Comparisons of Mitochondrial DNA Sequences in Stable and Exponentially Growing Populations Montgomery Slatkin* and Richard R . Hudsont *Department o f Integrative Biology, University o California, Berkeley, Calgornia 94720, and +Department o f Ecology and Evolutionary Biology, University o f California, Imine, California 9271 7 Manuscript received February 1, 199 1 Accepted for publication June 6 , 199 1 ABSTRACT We consider the distribution of pairwise sequence differences of mitochondrial DNA or of other nonrecombining portions of the genome in a population that has been of constant size and in a population that has been growing in size exponentially for a long time. We show that, in a population of constant size, the sample distributi on of pairwise differences will typic ally deviate substantially from the geometric distribution expected, because the history of coalescent events in a single sample of genes imposes a substantial correlation on pairwise differences. Consequently, a goodness-of-fit test of observed pairwise differences to the geometric dis tribution , which assumes that each pairwise comparison is independent, is not a valid test of the hypothesis that the genes were sampled from a panmictic population of constant size. In an exponentiall y growing population in whi ch the prod uct of the curren t population siz e and the growth rate i s substantial ly larger than one, ou r analyt ical and simulation results show that most coalescent events occur relatively early and in a restricted range of times. Hence, the “gene ree” will be nearly a“star phylogeny” and he distribution of pairwise differences will be nearly a Poisson distribution. In th at case, it is poss ible to estimat e r , the population growth rate, if the mutation rate, p, and curren t population size, No, ar e assu med known . T he estimate of r is the solution to ri/p = In(N0r) - 7 , where i is the average pairwise diff erence and = 0.577 is Euler’s constant. T E analysis of within-species variation in DNA sequences has th e potential fo r providing insight into population enetic processes. New statistical methods ar e nee ded o analyze within-species se- quence data, however, because DNA sequences pro- vide new kinds of information about the genome. In this paper, w e point out some features of a commonly used way to describe within-species varia- tion in DNA sequences, particularly of mitochondrial DNA (mtDNA). We will be concerned with t wo re- lated questions: first, is it possible to use the sample distribution of pairwise differences in DNA sequence to test the hypothesis that the sequences were drawn from a panmictic population of constant size, an d second, can the sample distribution of pairwise differ- ences indicate that the genes sequenced were drawn from a population that has been growing exponen- tial ly in siz e for a long time? T o answer these ques- tions, we will review and develop the necessary ana- lytic theory for pairs of genes and then present resu lts obtained from a simulation program that yields the distribution of pairwise differences for samples of genes. A typical data set consists of the sequences or fine scale restriction maps of mtDN A from several individ- uals. The numbers of differences in sequence between all pairs of individuals can be used to summarize Genetics 129: 555-562 October, 1991) information in the dat a (AVISE, BALL and ARNOLD 1988). It i s also possible to estimate the times until each pair of mtDNA had a most recent common ancestor by using an estimate of the substitution rate per bas e pair. For mtDNA n animals, the rate of 0.01 substitutions per base pair per million years is usually used (BROWN, GEORGE nd WILSON 1979; AVISE, BALL nd ARNOLD 1988). T o illustrate this procedure we generated a sample data set using a simulation program described below. In Figure 1, w e plot the fre quencies of sample pairs that differ at i sites, i 3 0. The conversion to diver- gence times would be obtained by multiplying i/L by 10’ years where L is the number of base pairs in the sequence examined. Thi s wa y of describing differ- ences among sequences provides a convenient wa y to summarize some of the information in the data set. CONSTANT POPULATION SIZE Whether the graph f pairwise differences in Figure 1 is consistent with the hypothesis that the sample of mtDNAs is drawn from a panmictic population of constant size dep ends on what the null hypothesi s predicts. WATTERSON 1975) and others have shown that under a neutral infinite-sites model with constant population size and no ecombination among he sites, the distribution of the numbe r of differences between

Welcome message from author
This document is posted to help you gain knowledge. Please leave a comment to let me know what you think about it! Share it to your friends and learn new things together.
Transcript

8/3/2019 Slatkin Hudson
http://slidepdf.com/reader/full/slatkin-hudson 1/8
Copyright 0 1991by the Genetics Society f America
Pairwise Comparisonsof Mitochondrial DNA Sequences in Stable and
Exponentially Growing Populations
Montgomery Slatkin* and RichardR.Hudsont
*Department of Integrative B iology, University o California, Berkeley, C algornia 94720, and +Department of Ecology andEvolutionary Biology, University of California, Imine, California 9271 7
Manuscript received February 1, 199 1
Accepted for publication June 6, 1991
ABSTRACT
We consider the distribution of pairwise sequence differences of mitochondrial DNA or of other
nonrecombining portions of the genome in a population that has been of constant size and in a
population that has been growing in size exponentially for a long time. We show that, in a population
of constant size, the sample distribution of pairwisedifferences will typically deviate substantially from
the geometric distribution expected, because the history of coalescent events in a single sample of
genes imposes a substantial correlation on pairwise differences. Consequently, a goodness-of-fit test
of observed pairwise differences to the geometric distribution, which assumes that each pairwisecomparison is independent, is not a valid test of the hypothesis that the genes were sampled from a
panmictic population of constant size. In an exponentially growing population in which the product
of the current population size and the growth rate is substantially larger than one, our analytical and
simulation results show that most coalescent events occur relatively early and in a restricted range of
times. Hence, the “gene ree” will be nearly a “star phylogeny” and he distribution ofpairwise
differences will be nearly a Poisson distribution. In that case, it is possible to estimate r , the population
growth rate, if the mutation rate, p, and current population size, No, are assumed known. The
estimate of r is the solution to r i / p = In(N0r)- 7 ,where i is the average pairwise difference and =0.577 is Euler’s constant.
TE analysis of within-species variation in DNA
sequences has the potential for providing insight
into population enetic processes. New statistical
methodsareneeded o analyze within-species se-
quence data, however, because DNA sequences pro-
vide new kinds of information about the genome.
In this paper, w e pointout some features of a
commonly used way to describe within-species varia-
tion in DNA sequences, particularly of mitochondrial
DNA (mtDNA). We will be concerned with two re-
lated questions: first, is it possible to use the sample
distribution of pairwise differences in DNA sequence
to test the hypothesis that the sequences were drawn
from a panmictic populationofconstant size, and
second, can the sample distribution of pairwise differ-
ences indicate that the genes sequenced were drawn
from a population that has been growing exponen-
tially in size for a long time? T o answer these ques-
tions, we will review and develop the necessary ana-
lytic theory for pairs of genes and then present results
obtained from a simulation program that yields the
distribution of pairwise differences for samples of
genes.
A typical data set consists of the sequences or fine
scale restriction maps of mtDNA fromseveral individ-
uals. Th e numbers of differences in sequence between
all pairs of individuals canbe used to summarize
Genetics 129: 555-562 October, 1991)
information in the data (AVISE,BALLand ARNOLD
1988). It is also possible to estimate the times until
each pair of mtDNAhada most recentcommon
ancestor by using an estimate of the substitution rate
per base pair. For mtDNA n animals, the rateof 0.01
substitutions per base pair per million years is usually
used (BROWN,GEORGE nd WILSON 1979; AVISE,
BALL nd ARNOLD 1988).
To illustrate this procedure we generated a sample
data set using a simulation program described below.
In Figure 1, we plot the frequencies of sample pairs
that differ at i sites, i 3 0. The conversion to diver-
gence times would be obtained by multiplying i / L by
10’ years where L is the number of base pairs in the
sequenceexamined. This way of describingdiffer-
ences among sequences provides a convenientway to
summarize some of the information in the data set.
CONSTANTPOPULATION SIZE
Whether the graphf pairwise differences in Figure
1 is consistent with the hypothesis that the sample of
mtDNAs is drawnfroma panmictic population of
constant size depends on what the null hypothesis
predicts. WATTERSON1975) and others have shown
that undera neutral infinite-sites model with constant
population size and noecombination among he sites,
the distribution of the numberof differences between
8/3/2019 Slatkin Hudson
http://slidepdf.com/reader/full/slatkin-hudson 2/8
556 M . Slatkin and R.R.Hudson
o-21
- ll Pairs--” WithoutReplacement-xpectation
0.00 10 20 30
i
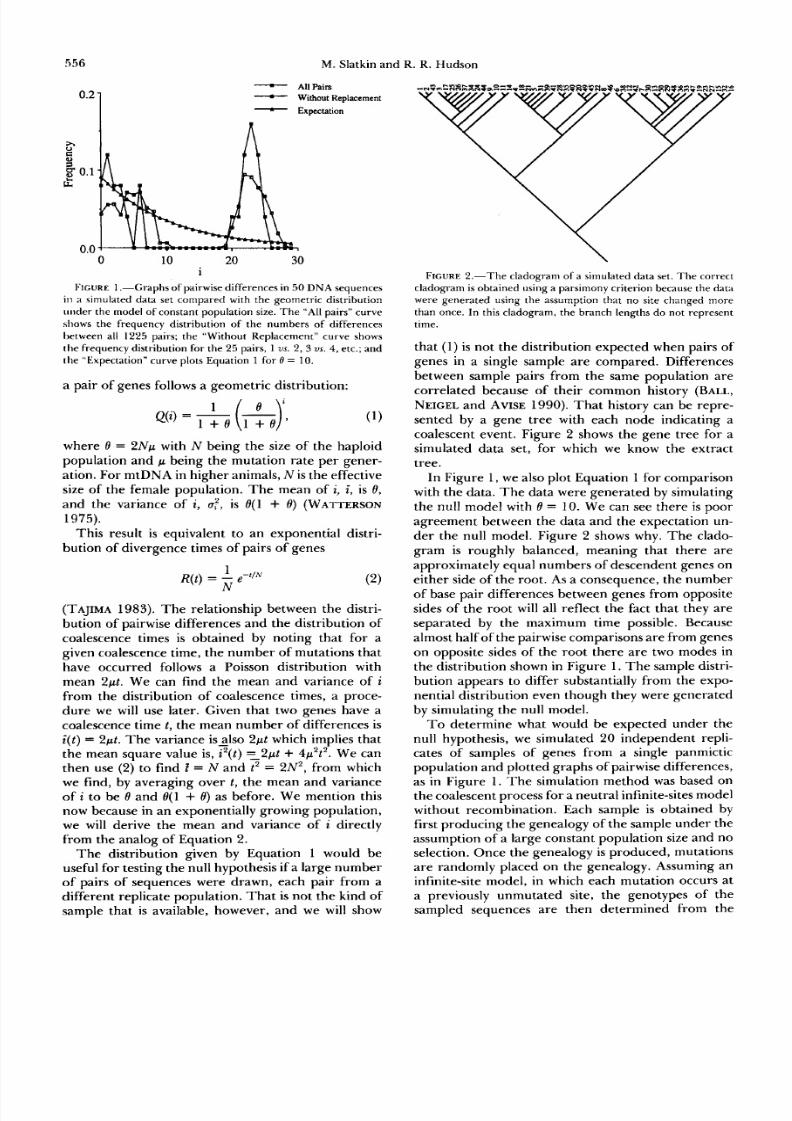
FIGURE .“G rap hs of pairwise differences in 50 D N A sequences
in a simulated data set compared with the geometric distribution
under the model of const ant population ize. The “All pairs” curve
shows the frequency distribution of he numbers of differences
between all 1225 pairs; the “Without Replacement” curve shows
the frequency distribution for the 5 pairs, 1vs. 2, 3 us. 4, tc.; and
the “Expectation” curveplots Equation 1 for 0 = 10.
a pair of genes follows a geometric distribution:
where 8 = 2 N p with N being the size of the haploid
population and p being the mutation rate per gener-
ation. For mtDNAn higher animals, N is the effective
size of the female population. T he mean of i, i, is 8,
and he variance of i, a:, is 8(1 + 8) (WATTERSON
1975).
This result is equivalent to an exponential distri-bution of divergence times of pairs of genes
(TAJIMA983). The relationship between the distri-
bution of pairwise differences and the distribution of
coalescence times is obtained by noting hatfora
given coalescence time, the number of mutations that
have occurred follows a Poisson distribution with
mean 2 p t . We can find the mean and variance of i
from the distribution of coalescence times, a proce-
dure we will use later. Given that two genes have acoalescence time t, the mean number of differences is
i ( t )= 2 p t . The variance is&o 2 p t which implies that
the mean square value is, i ’ ( t ) ~ 2 p t 4 p 2 t 2 . We can
then use ( 2 ) to find t = N and t 2 = 2 N 2 , from which
we find, by averaging over t , the mean and variance
of i to be 8 and 8(l + 0) as before. We mention this
now because in an exponentially growing population,
we will derive he mean and variance of i directly
from the analogof Equation 2.The distribution given by Equation1 would be
useful for testing he null hypothesis if a largenumber
of pairs of sequences were drawn, each pair from a
different replicate population. Th at is not the kind of
sample that is available, however, and we will show
FIGURE2.-The cladogram of a simulated data set. The correct
cladogram is obtained using a parsimony criterion because the data
were generated using the assumption t hat no site changed more
than once. In this cladogram, the branch leng ths do not represent
time.
that (1 ) is not the distribution expected when pairs of
genes in a single sample are compared. Differences
between sample pairs from the same population are
correlated because of their common history (BALL,
NEICEL nd AVISE1990). That history can be repre-
sented by a gene ree with each node indicating a
coalescent event. Figure 2 shows the gene tree for a
simulateddataset,for which we know theextract
tree.
In Figure 1, we also plot Equation 1 forcomparison
with the data. The data were generated by simulating
the null model with 8 = 10. We can see there is poor
agreement between the data and the expectation un-
der the null model. Figure 2 shows why. The clado-gram is roughlybalanced,meaning hat thereare
approximately equal numbersof descendent genes on
either side of the root.As a consequence, the number
of base pair differences between genes fromopposite
sides of the root will all reflect the fact that they are
separated by the maximum time possible. Because
almost half of the pairwise comparisons ar e from genes
on opposite sides of the root there are two modes in
the distribution shown in Figure 1. The sample distri-
bution appears to differ substantially from the expo-
nential distribution even though they were generated
by simulating the null model.To determine what would be expected under the
null hypothesis, we simulated 2 0 independent repli-
cates of samples of genesfroma single panmictic
population and plotted graphs of pairwise differences,
as in Figure 1. The simulation method was based on
the coalescent process for a neutralnfinite-sites model
without recombination. Each sample is obtained by
first producing the genealogy of the sample under the
assumption of a large constant population ize and no
selection. Once the genealogy is produced, mutations
are randomly placed on the genealogy. Assuming an
infinite-site model, in which each mutation occurs at
a previously unmutated site, the genotypes of he
sampled sequences are hendetermined rom he

8/3/2019 Slatkin Hudson
http://slidepdf.com/reader/full/slatkin-hudson 3/8
557
0.121
Pairwise Analysis of Sequence Data
0.21 0.21
0.06 A o.lk 0 . I h
0.000 20 40 0 20 40
0.00.0
0 20 40
0.21
o.lL.00 20 40
0.21
o.lh0.0
0 20 40
o. 2I
o..0 IO 20 30
0.101 0.21
o ' 1 2 L ! L.06.00 20 40 60 0.0l!JL20 40
0.21
0.1
0.0. k ! " 20 40 0.0l!L10 20 u)
o.21
o0.0 20 400 . 1 2 k.06.0 20 40 0.0"k- 20 -0
o.2
0.0. l l ! ! ! L10 20 30 40
:::k0.0
0 20 40
::h0.0 "0 20 40
FIGURE 3,"Frequen cy distributions of pairwise differences for20 replicate simulations. Th e distributions of all 1225 pairs in samples of
50 genes froma panmictic population are p lotted.The data were gener ated using a simulation program described in the te xt. In each graph,
the abscissa is the num ber of sites at which two samples differ and the ordin ate s the frac tionof pairs that differ.
genealogy with its mutations. T he method is described
in the appendix to HUDSON1983), and described in
greater detail in HUDSON1990). We would be happyto distribute copies of the programs written in C ) hat
generated these results.
The simulation results are shown in Figure 3, for
the case where 0 = 2Np was 10. If we assume p = 2 X
10-4 (corresponding to a region 1000 nucleotides long
with a per site neutralmutation rate of 0.01 per
million years and 20-year generations) hen 0 = 10
corresponds to N = 25,000. In Figure 3, w e can see
that a variety of shapes can be found, including bi-
modal and even trimodal distributions and distribu-
tions with modes at zero or athigher values. None of
them resembles the geometric distribution shown in
Figure 1. Evenwith this small sample of simulated
results, we found a wide variety of distributions of
pairwise differences are consistent with the predic-
tions of the null hypothesis.
Bimodal distributions of sequence differences arereasonably common indicating that roughly balanced
trees, such as the one shown in Figure 2, ar e common.
TAJIMA1983) showed that the number of genes on
the right (or left) side of the root in a random gene
tree generated y the coalescent process in a panmictic
population follows a uniform distribution: that is , if
there are n genes sampled, the probability of i genes
on the left branch is l / (n - 1) fo ri = 1 , . . .,n - 1 .
EXPONENTIALLYGROWINGPOPULATION
It is likely that many species have undergonea
sustained increase in population size, possibly because
of a prior catastrophic decline in size or because a
8/3/2019 Slatkin Hudson
http://slidepdf.com/reader/full/slatkin-hudson 4/8
558 M. latkin and R. R.Hudson
species is expanding its geographic range for the first
time. For such species, a model of exponential growth
at a constant rate is simple and reasonable. A model
of exponential growth of human populations was sug-
gested to us by J. BROOKFIELDpersonal communica-
tion).We examined the consequences of exponential pop-
ulation growth by considering first the theory of pairs
of genes, for which relatively simple analytic results
can be obtained, and a simulation model of the coa-
lescent process for samples ofn genes, as w e did above.
We will show that, in contrast to he model with
constant population size, sample distributions of pair-
wise differences do provide useful information about
the history of coalescent events and that under some
conditions, the averagepairwise difference, i, leads to
an estimate of the population growth rates.
Assume that the (haploid) population of interest is
of current effective size N o and has beengrowing
exponentially at a rate r. The population size at time
t in the past is then N( t )= NOe-". Following the usual
theory of coalescent processes (KINGMAN 1982), the
probability that two genes sampled do not coalesce in
generation t given that they did not coalesce before t
is approximately [1 - /N(t)] and theprobability that
they do coalesce in generation t is approximately
l/N(t). Therefore the robability that the irst coales-
cence is in generation t, P ( t ) , s approximately
or approximately
where now P(t )d t is the probability of a coalescent
event between t and t + dt. Assuming exponential
growth, Equation 4 educes to
e''
NoP ( t ) d t =- xp (5)
as was pointed out to us by J. BROOKFIELDpersonal
communication). This distribution is related to he
Gompertzhazarddistribution (JOHNSON an d KOTZ
1970). It is convenient to simplify ( 5 ) by measuring
time in units of l/r (T= r t ) and defining a = Nor to
obtain
P ( T ) ~ T - xp --r ( ')dT. (6)
a
We can compute the mean coalescence time from(6):
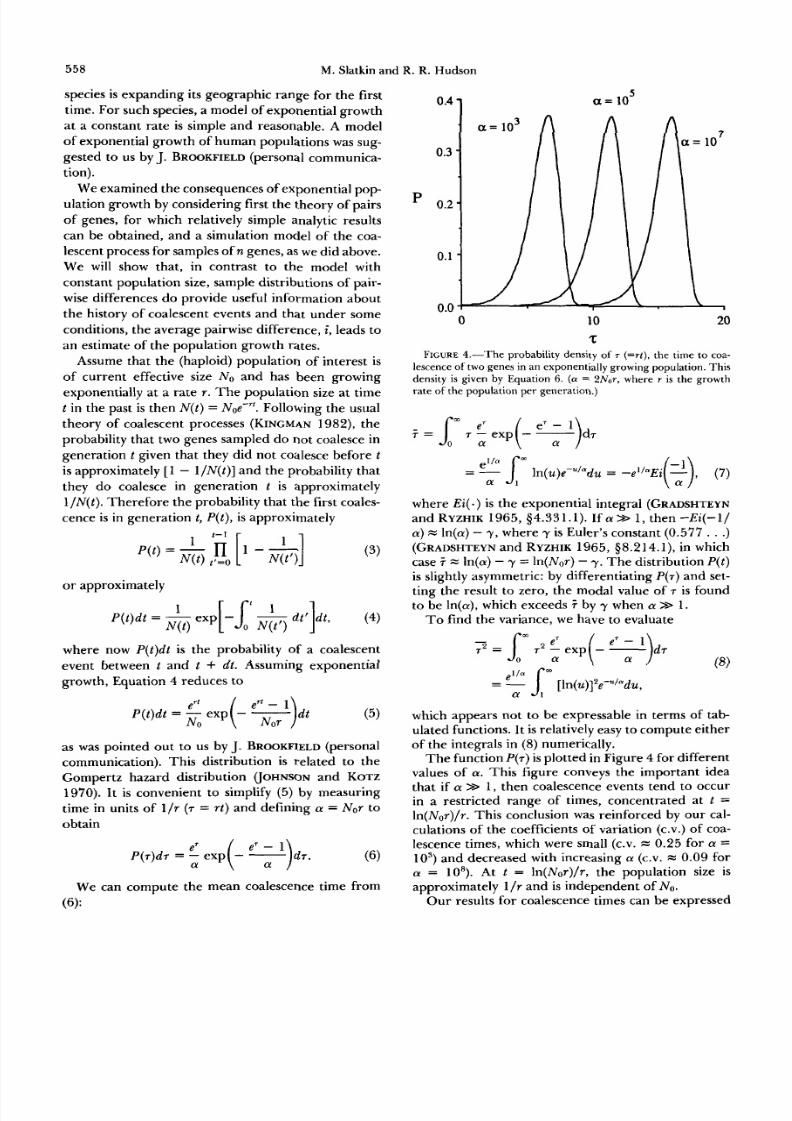
0.4 15
a = 0
P
0 10 20
z
FIGURE4.-The probability density of T (=r t ) , the time to coa-lescence of two genes in an exponentially growing population. This
density is given by Equation 6. (a= 2Nor, where r is the growth
rate of the population per generation.)
where Ei( ) is the exponential integral (GRADSHTEYN
and RYZHIK1965, 44.331.1). If a>> 1, then -Ei(-l/
a) n(a) - y, where y is Euler's constant (0.577 . . .)(GRADSHTEYN and RYZHIK 965, §8.214.1), in which
case 7 z n(a)- y = ln(Nor)- y. The distribution P ( t )is slightly asymmetric: by differentiating P ( T ) nd set-
ting the result to zero, the modal value of T is found
to be ln(a), which exceeds .T by y when a >> 1.
To find the variance, we have to evaluate
which appears not to be expressable in terms of tab-ulated functions. It is relatively easy to compute either
of the integrals in (8) numerically.
Th e functionP(T) s plotted in Figure 4 for different
values of a.This figure conveys the important idea
that if a >> 1, then coalescence events tend to occur
in a restricted range of times, concentrated at t =
In(Nor)/r. This conclusion was reinforced by our cal-
culations of the coefficients of variation (c.v.) of coa-
lescence times, which were small (c.v. z 0.25 for a =
lo3)and decreased with increasing a (c.v. = 0.09 for
a = 10'). At t = ln(Nor)/r, the population size is
approximately l/r and is independent of No.Our results for coalescence times can be expressed

8/3/2019 Slatkin Hudson
http://slidepdf.com/reader/full/slatkin-hudson 5/8
Pairwise Analysis of Sequence Data 559
in terms of the numbers of pairwise differences be-
tween samples if w e assume a constant mutation rate.
As discussed above, the average number of differences
given a coalescence time of t, i(t), is 2 ~ t , nd he
mean square number of differences given t is i2(t) is
2pt + 4/1't2, because the distribution of the numbersof mutations is assumed to be Poisson. Averaging
these values _over t , We find L= 2pt and the variance
in i, 0; is 2pt + 4p2t2- 4p2t2.We can express ut in
terms of the_ mean and variance of t : 6,'= 2pt += i + i2(ut/l)'.We contrast his result with that
for a population of constant ize for which 0,'= i+ 2.
In an exponentially growing population, the value of
ue differs from the variance under a Poisson distribu-
tion, i, by a term that depends on the square of the
coefficient of variation of t , which is small if a >> 1 .
Therefore, if a >> 1 , the distribution of i is nearly
Poisson which is the distribution of i if the phylogenyof genes sampled were a "star" phylogeny with all
genes coalescing at the ame time. Hence w e conclude
that in an exponentially growing population, he phy-
logeny of genes is likely to be nearly a starphylogeny,
meaning that all coalescent events will occur near the
root and few if any will occur later. In that case, w e
might guess that correlations induced by the phylo-
geny are relatively unimportant. Our simulations will
support that guess.
As an illustration of our result, consider a naive
model of human population growth.Assume N O= 1O9
and assume that 50,000 years ago, he size of thefemale population was 5000. Age structure will make
the effective sizes smaller but we will assume by the
same proportion at every time. If exponential growth
had been occurring at a constant rate and the gener-
ation time is 20 years, then r = 0.00488 per genera-
tion. Under these assumptions, a = 4.88 X lo6 and f
x (in(&)- y ) / r= 3 0 3 0 generations or approximately
6 0 , 6 0 0 years ago. T he standard deviation of coales-
cent times for theseparameter values is approximately
3 3 3 generations or 6 , 7 0 0 years.
The function P(t) describes the distribution of the
coalescence time for a single pair of genes sampled
from an exponentially growing population. For rea-
sons we discussed above, that does not provides with
the joint distribution of coalescence times between
pairs of genes in a sample of n genes because that
requires taking into account the correlation imposed
by their common history. To examine the effects of
this correlation w e carried out the same kind of sim-
ulation that w e did for the constant population size
case. The simulations of the coalescent process with
an exponentially growing population are very similar
to those with a constant population size except that
the distribution of the times between coalescent events
ar e different. The required generalization of Equa-tions 3-6 follows from the fact that the probability
that the first coalescence among i lineages occurs in
generation t is approximately
Recall that as one traces the genealogy of the sam-
pled sequences back in time, coalescent events occur
and the number of linages that are being traced de-
creases by one for each coalescent event. Th e time
interval, t,, measured in units of l / r , during which
there are i lineages can be generated by
1+ ae"'-2
i(i + 1)
where
i+
Ti = 2 t k
h= n
is the time of the coalescent event that reduced the
number of lineages to i and U is a random variable
uniformly distributed on the interval 0, l) .
In ten replicate simulations, with a = lo 4 and 0 =
1 . 1 X 1 04, w e found that the distribution of pairwise
differences is unimodal and approximately Poisson in
form. Two of the ten replicates are shown in Figure
5 . As our analytic results suggest, a history of expo-
nential growth ends to force coalescent events o
occur in a relatively restricted range of times. As aconsequence, correlations between coalescence times
created by their history are relatively unimportant.
Another consequence of having a "star" genealogy is
that each mutation that occurs on the genealogy is
likely to be nherited by only a single gene in the
sample. In otherwords, the polymorphisms at individ-
ual nucleotide sites will consist of one mutant nucleo-
tide and the rest of the sample will have the ancestral
nucleotide at he site. A significant excess of this
pattern of polymorphism is potentially detectable by
the test of TAJIMA1989) which is based on the total
number of segregating sites and the average pairwise
difference to the simulated data. In fact, for each of
our ten replicates, TAJIMA'Sest indicated hat the
data were not consistent with the hypothesis that they
were drawn from a randomly mating population of
constant size.
To illustrate how similar the distributions of pair-
wise differences are, in our replicates, to a Poisson
distribution, w e show results from two replicates in
Figure 5 . The distribution in part A was chosen be-
cause its mean and variance were similar ( i= l l 474,
a2 = 10.254)and because the distribution looked most
like a Poisson. We can use the standard x2 tatistic as
a description of goodness of tit. Fo r part A , x 2 =
3 2 . 6 7 ,which, if used in a statistical test, would indicate

8/3/2019 Slatkin Hudson
http://slidepdf.com/reader/full/slatkin-hudson 6/8
560 M. Slatkin and R. R.Hudson
A B - bserved-xpected
0 5 10 15 20 25 0 5 10 15 20 25
i 1
FIGURE5.-Comparison of the observed numbers of pairwise differences in two simulations with the numbers expected under a Poisson
distribution with the same mean. The two data sets are two of ten replicate samples generated as described in the text. In these simulations,
LY = lo4 and 0 = 1.1 X lo4. In part A , i = 11.474 and u = 10.254 and in part B, i = 11.814 and 6 = 16.331. Both distributions differ
significantly from a Poisson, for par t A, x: , = 32.67 (P< 0.025) and for part B, X?!,= 135.1 ( p< 0.005).
a marginally significant deviation17 d.f.; P < 0.025).
The distribution in part B was chosenbecause it
appeared to differ substantially from a Poisson (i =
1 1.8 14, a? = 16.33 1) and indeed the differences be-
tween the observed and expected distributions are
much greater (x’ = 135.1; 19 d.f.;P < 0.005). TheseP values are meaningful only as a measure of fit to a
Poisson because the pairwise differences are of course
not independent. Even for the distribution shown in
Figure 5B,however, the observed distribution does
not appear to be very different from a Poisson.
Another way to interpret these results is to note
that in Figure 5, one of the pairwise differences were
zero, which means that there were no short branches
in the gene tree. In the other replicates, less than one
in one thousand pairwise comparisons hadero differ-
ences. In contrast, there were always large fractions
of the pairwise comparisons with ero differences forthe model of constant population size, as shown in
Figure 3.We conclude then that if the observed distribution
of pairwise differences is close to a Poisson, that it is
consistentwith the hypothesis that he population
from which those genes were sampled haseen grow-
ing exponentially in size.
Estimating population growth rates: Our results
for the model of exponential population growth sug-
gest that it is possible to estimate the population
growth rate, r , under some conditions. In particular,
if the distribution of pairwise differences were similarto a Poisson distribution, that would indicate that the
gene tree is nearly a star phylogeny which we have
shown is consistentwith a model of exponential
growth with a = N or >> 1.
T o estimater, we have to assume that N o and p are
known. Then we use the approximate estimate of the
mean pairwise coalescent time, t = (In(Nor)- ~ ) / r ,oobtain the estimate of the mean pairwise difference,
r = 2p[ln(Nor)- T]/T-. (9)
If the valueof i is estimated from the data, then
Equation 9 can be solved numerically for r . To illus-
trate this result, we again use hypothetical data. As-
sume that 2000 base pairs have been sequenced and
that i = 10.5. Assume that the population from which
the sample was taken has an effective size of he female
population of No = lo6. If the mutation rate per site
per year is the mutation rateper generation is
2 X lo”, when the generation time is 20 years, andthe value of p in (9) is 2000 X 2 X lo-’ = 4 X
Using a program that solves (9) numerically, we find
that r is approximately 4.15 x 1O-4. We will distribute
a copy of this program upon request.
In making such an estimate of r , it is important to
realize that an approximately Poisson distribution of
pairwise differences does not imply that here has
been exponential growth of the population at a con-
stant rate. There are other possible explanations as
well. A very rapid increase inpopulation size followed
by a period of large and constant population size
would also result in a starlike gene tree because allcoalescent events would occur relatively quickly be-
8/3/2019 Slatkin Hudson
http://slidepdf.com/reader/full/slatkin-hudson 7/8
Pairwise Analysis
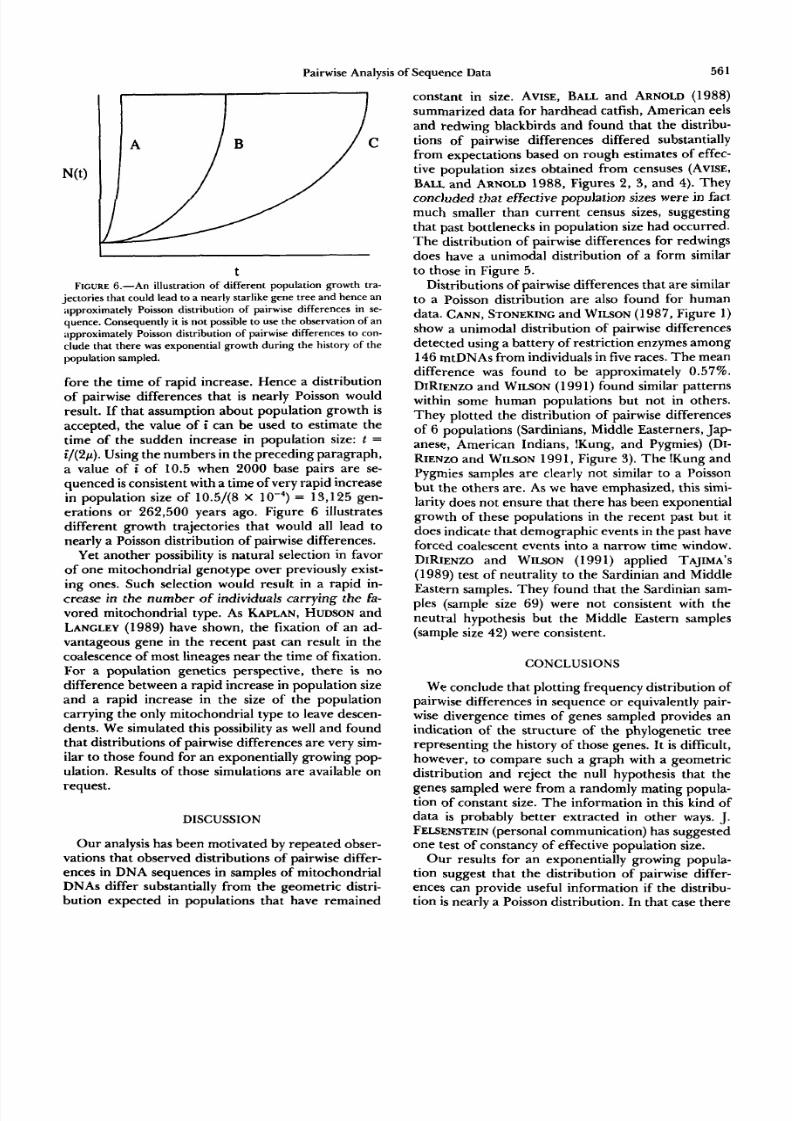
tFIGURE .-An illustration of different population growth tra-
jectories that could lead to a nearly starlike gen e tree andhence an
;Ipproximately Poisson distribution of pairwise differences in se-
quence. Consequently it is no t possible to use the observation of an
approximately Poisson distribution of pairwise differences to con-
clude that there was exponential growth du ring the h istory of th e
population sampled.
fore the time of rapid increase. Hence a distribution
of pairwise differences that is nearly Poisson would
result. If that assumption about population growth is
accepted, the value of i can be used to estimate the
time of the sudden increase in population size: t =
i/(2p). Using the numbers in the preceding paragraph,
a value of i of 10.5 when 2000 base pairs are se-
quenced is consistent with time of very rapid increase
in population sizef 10.5/(8 X = 13,125 gen-
erations or 262,500 years ago. Figure 6 illustrates
different growth trajectories that would all ead to
nearly a Poisson distribution of pairwise differences.
Yet another possibility is natural selection in favor
of one mitochondrial genotype over previously exist-
ing ones. Such selection would result in a rapid in-
crease in the number of individuals carrying the fa-
vored mitochondrial type. As KAPLAN, UDSON nd
LANGLEY1989) have shown, the fixation of an ad-
vantageous gene in the recent past can result in the
coalescence of most lineagesear the ime of fixation.
For a population genetics perspective, there is no
difference between a rapid increase in population size
and a rapid increase n the sizeof the population
carrying the only mitochondrial type to leave descen-dents. We simulated this possibility as well and found
that distributions of pairwisedifferences are very sim-
ilar to those found for an exponentially growing pop-
ulation. Results of those simulations are available on
request.
DISCUSSION
Our analysis hasbeen motivated by repeated obser-
vations that observed distributions of pairwise differ-
ences in DNA sequences in samplesof mitochondrial
DNAs differ substantially from the geometric distri-bution expected in populations that have remained
of Sequence Data 56 1
constant in size. AVISE, BALLand ARNOLD1988)
summarized data for hardhead atfish, American eels
and redwing blackbirds and found that the distribu-
tions of pairwise differences differed substantially
from expectations based on rough estimates of effec-
tive population sizes obtained from censuses (AVISE,
BALL nd ARNOLD988, Figures 2, 3 , and 4). They
concluded that effective population sizes were in fact
much smaller than current censussizes,suggesting
that past bottlenecks in population size had occurred.
The distribution of pairwise differences for redwings
does have a unimodal distribution of a form similar
to those in Figure 5.
Distributionsof pairwise differences that are similar
to a Poisson distribution are also found for human
data. CANN, TONEKINGnd WILSON1 987, Figure 1 )
show a unimodal distribution of pairwise differences
detected using a battery of restriction enzymes among
146 mtDNAs from individuals in five races.he meandifference was found to be approximately 0.57%.
DIRIENZOnd WILSON 199 1) found similar patterns
withinsome human populations but not in others.
They plotted the distribution of pairwise differences
of 6 populations (Sardinians, Middle Easterners, Jap-
anese, American Indians, !Kung, and Pygmies)(DI-
RIENZOand WILSON991 , Figure 3). Th e !Kung and
Pygmies samples are clearly not similar to a Poisson
but the others are.As we have emphasized, this simi-
larity does not ensure that therehas been exponential
growth of these populations in the recent past but it
does indicate that demographic events in the past haveforced coalescent events into a narrow time window.
DIRIENZO nd WILSON(1991) applied TAJIMA’S
( 1989) test of neutrality to the Sardinian and Middle
Eastern samples. They found that the Sardinian sam-
ples samplesize 69) were not consistentwith the
neutral hypothesis but he MiddleEasternsamples
(sample size42) were consistent.
CONCLUSIONS
We conclude that plotting frequency distribution of
pairwise differences in sequence or equivalently pair-
wise divergence times of genes sampled provides an
indication of the structure of the phylogenetic tree
representing the history of those genes. It is difficult,
however, to compare such a graph with a geometric
distribution and reject the null hypothesis that the
genes sampled were from a randomly mating popula-
tion of constant size. The information in this kind of
data is probably better extracted in other ways. J.FELSENSTEINpersonal communication) has suggested
one test of constancy of effective opulation size.
Our results for an exponentially growing popula-
tion suggest that the distribution of pairwise differ-
ences can provide useful information if the distribu-tion is nearly a Poisson distribution. In that case there

8/3/2019 Slatkin Hudson
http://slidepdf.com/reader/full/slatkin-hudson 8/8
562 M. Slatkin and R. R. Hudson
is a star-like gene tree with all the nodes clustered in
time. That pattern would also be detected in the gene
tree directly if branch lengths were known. It is pos-
sible then to use our analytic results to estimate the
population growth rate under the ssumption that the
population has been growing exponentially for a ong
time. The observation of a nearly Poisson distribution
of pairwise differences does not however imply that
there has been exponential growth. Tha t distribution
would be consistent with other models of population
growth that force most of the coalescent events into a
narrow time period.
We thank J. C. AVISE, A. DIRIENZO,. FELSENSTEIN,. C.
WILSONnd two anonymous referees for helpful discussions of this
topic and for useful comments on earlier versions of this paper.
This research has been supported in part by National Institutes of
Health grants GM40282 to M. S. and GM42447 to R . R. H.
L I T E R A T U R EC I T E D
AVISE, . C., R. M. BALL nd J. ARNOLD, 1988 Current versus
historial population sizes in vertebrate species with high gene
flow: a comparison based on mitochondrial DNA lineages and
inbreeding theory for neutral mutations. Mol.Biol.Evol. 5:
331-344.
BALL, . M. , J. E. NEIGELnd J. C. AVISE, 990 Gene genealogies
within the organismal pedigrees of random-mating populations.
Evolution 4 4 360-370.
BROWN,W.M., M. GEORGE,R . and A. C. WILSON, 979 Rapid
evolution of animal mitochondrial DNA. Proc. Natl. Acad. Sci.
CANN, R . L., M. STONEKING nd A . C. WILSON, 1987
Mitochondrial DNA and human evolution. Nature 325: 31-
36.
DIRIENZO, ., and A. C. WILSON, 991 Th e pattern of mitochon-
drial DNA variation is consistent with an early expansion of
the human population. Proc. Natl. Acad. Sci. USA 88: 1597-
1601.
GRADSHTEYN,. S., and I. W. RYZHIK, 1965 Tables $Integrals,
Series and Products. Academic Press, New York.
HUDSON, . R. , 1983 Testing the constant-rate neutral model
with protein sequence data. Evolution37: 203-21 7.
HUDSON, . R.,1990 Gene genealogies and the coalescent proc-
ess. Oxf. Surv. Evol. Biol. 7: 1-44.
JOHNSON, N . L., and S. KOTZ, 1970 Continuous Univariate Distri-
butions. Houghton & Mifflin, New York.
KAPLAN, N. , R. R . HUDSON nd C. H. LANGLEY,1989 The
“hitchhiking effect” revisited. Genetics 123: 887-899.
KINGMAN,. F. C., 1982 On the genealogy of large populations.
J. Appl. Prob. 19A 27-43.
TAJIMA,. , 1983 Evolutionary relationship of DNA sequences in
finite populations. Genetics 105: 437-460.
TAJIMA, . , 1989 Statistical method for testing the neutral muta-
tion hypothesis by DNA polymorphism. Genetics 123: 585-
595.
WATTERSON,. A., 1975 On the number of segregating sites n
genetical models without recombination. Theor. Popul. Biol.
7:256-276.
USA 7 6 1967-1971.
Communicating editor: A. G. CLARK
Related Documents