Service Quality Analytics and Visualizations SLA Suite

Welcome message from author
This document is posted to help you gain knowledge. Please leave a comment to let me know what you think about it! Share it to your friends and learn new things together.
Transcript

improving the quality and efficiency of ICT services Service Quality Analytics and Visualizations
SLA Suite
NETvisor Ltd.1119 Budapest, HungaryPetzval Jozsef utca. 56.
Telephone: (+36-1) 371 2700 Fax: (+36-1) 204 1664E-mail: [email protected]
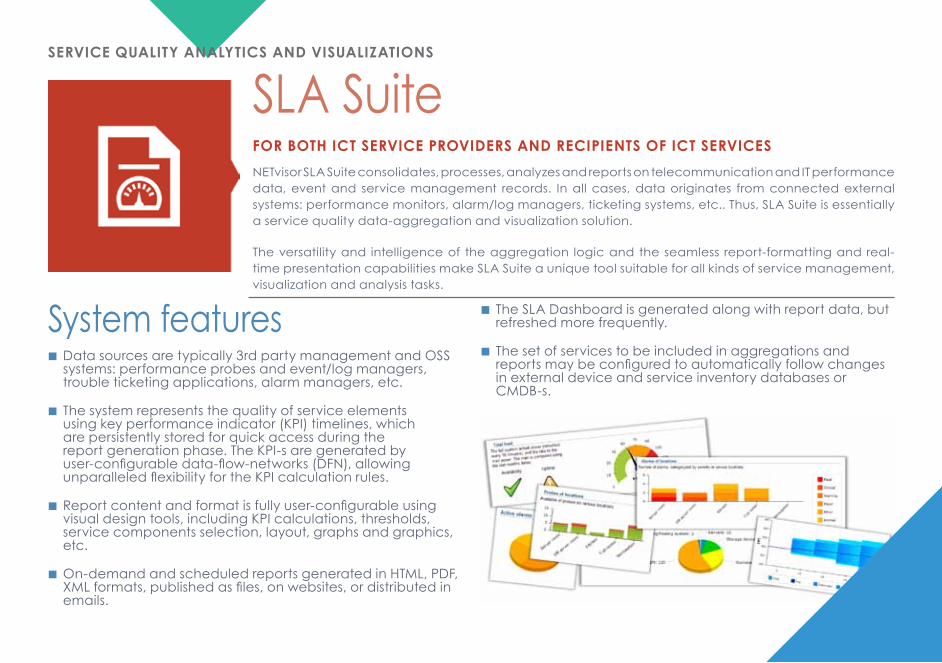
System features � Data sources are typically 3rd party management and OSS systems: performance probes and event/log managers, trouble ticketing applications, alarm managers, etc.
� The system represents the quality of service elements using key performance indicator (KPI) timelines, which are persistently stored for quick access during the report generation phase. The KPI-s are generated by user-configurable data-flow-networks (DFN), allowing unparalleled flexibility for the KPI calculation rules.
� Report content and format is fully user-configurable using visual design tools, including KPI calculations, thresholds, service components selection, layout, graphs and graphics, etc.
� On-demand and scheduled reports generated in HTML, PDF, XML formats, published as files, on websites, or distributed in emails.
� The SLA Dashboard is generated along with report data, but refreshed more frequently.
� The set of services to be included in aggregations and reports may be configured to automatically follow changes in external device and service inventory databases or CMDB-s.
SLA SuiteService Quality analyticS and viSualizationS
for both ict Service providerS and recipientS of ict ServiceSNETvisor SLA Suite consolidates, processes, analyzes and reports on telecommunication and IT performance data, event and service management records. In all cases, data originates from connected external systems: performance monitors, alarm/log managers, ticketing systems, etc.. Thus, SLA Suite is essentially a service quality data-aggregation and visualization solution.
The versatility and intelligence of the aggregation logic and the seamless report-formatting and real-time presentation capabilities make SLA Suite a unique tool suitable for all kinds of service management, visualization and analysis tasks.

3
Architecture of SLA Suite
Service Quality analyticS and viSualizationS
SLA / KPI Configuration
Report Data Definition
Report Format Definition
Report DataGenerator
SQLXML
Data-flowNetwork
Data Adaptor
Data Adaptor
Data Adaptor
Event Adaptor
CMDB Adaptor
SLA Suite GUI
ReportBundle
XML
HTMLPDF
MailServer
TroubleTicketing
Web Client
Report DocumentRendering
BIRT /Jasper Reports
XSLT
Event Adaptor
Common Execution and Control Layer
Data-flowDesigner
Report Data & FormatDesigner
ServiceContract
WebPublishing
CMDB
KPI Store
SLA Dashboard
Alarm Manager
PerformanceManager
SLA Reports
SLA Reports

The principal function of SLA Suite is the comprehensive evaluation of service quality, either to prove compliance to SLA-s, or for internal purposes like trend, usage or problem analysis, or various reports on the infrastructure or on service management activities.
The system supports the modeling of quality requirements or key performance indicators (KPI-s), which are either defined in the SLA contract, or based on subjective criteria. KPI values are periodically calculated and recorded as KPI timelines. These timelines are further combined, filtered and aggregated as needed before they are presented as event lists, tables, various charts, aggregate values, etc.
The results of SLA Suite’s evaluations have several possible uses:
� The most evident feature is the capability to generate ready-to-present SLA report documents (in HTML, PDF, XML formats) and to publish them through files, Web content or Email. Reports are either generated on demand (from the Web GUI), or scheduled for automatic creation and distribution (e.g. monthly SLA reports).
� The system also supports the compilation of consolidated reports from multiple sub-reports (such as XML reports received from sub-contractors). SLA Suite digitally signs the reports processed ensuring the reports’ authenticity.
� SLA Suite data can also be displayed as configurable Dashboard portlets, enabling the creation of nearly real-time SLA dashboard views.
� The Web GUI also enables the tracking of SLA results as they evolve, and the investigation of potential problems at deeper levels, even down to raw measurement data.
� SLA-related alarms also supported for a timely warning on potential violations.
� SLA Suite not only displays actual and recent SLA data, it is also able to visualize the historical trends behind SLA indicators. Such longer-term overviews are very well suited for baselining, capacity planning, and for the evaluation of long-term quality effects of technical or organizational changes.
Applications and Use CasesService Quality analyticS and viSualizationS

5Service Quality analyticS and viSualizationS
NETvisor SLA Suite report

The Dashboard module within SLA Suite offers an easily comprehensible portal interface to visualize service KPI-s and the underlying data from the source systems on a real-time basis. The dashboard pages makes it possible for operators and managers. Dashboard pages allow operators and managers to inspect current state of their services and the evolution of service levels before the end of a reporting period and in to intervene before the problems actually violate contracted service levels.
Each SLA Suite Dashboard page is a mosaic of small reports, a visualization – a table, a chart or a map – of some KPI-s. These reports are refreshed frequently to reflect up-to-date system state. Further typical dashboard features are:
� User-definable KPI-based alarms for early warning on possible SLA degradations or violations. Alarms can be seen on the dashboard or propagated to 3rd party systems.
� Dashboard portlets (tables, charts) support drill-down to the sources of the data displayed, for a quick investigation of potential problems and identification of the root causes.
� Dashboard pages are user-customizable, so each user will access the information in optimal scope resolution and format.
SLA Dashboard
NETvisor SLA Suite dashboards
Service Quality analyticS and viSualizationS

7Service Quality analyticS and viSualizationS
SLA Suite has open interfaces to connect to other telecommunication and IT management systems. Interfaces are either available or under development for the following systems:
System Interface to below data
HP ServiceManager / Service Desk Trouble tickets
IBM Tivoli SD (SCCD) Trouble tickets
HP Unified CMDB CMDB
NETvisor PVSR (PerformanceVisor) Performance monitoring
IBM Tivoli Provisio Performance monitoring
IBM Tivoli NetCool Alarm management
HP Operations Manager Alarm data
HP NNM Alarm & performance data
NETvisor Memoria Log management
NETvisor NETinv/IPExplorer Technical inventory
System Interface to below data
CiscoView IPM Performance monitoring
Trendium ServicePath Performance monitoring
Telcordia granite Technical records
EMC Ionix/ITOPS (Smarts) Alarm data
MS SCOM Alarm management
Nagios Alarm management
ZEN OSS / Zabbix / RRDtool Performance monitoring
LDAP User & Configuration management
Generic TT Interface (Batch and GUI)
Ticketing data
Generic SQL connector Trouble tickets, time series
Generic CSV and XML connector
Trouble tickets, time series
Interfacing to data source OSS & management systems

Service Quality analyticS and viSualizationS
The strength of SLA Suite is based on an innovative data-driven architecture that allows for truly flexible KPI and report definitions and calculations. (Please refer to the figure above for an overview)
Raw measurements and management data are evaluated by a high-performance Data Flow Network (DFN). Computed SLA parameters, i.e. KPI-s are defined by assembling an arbitrary network of processing nodes readily available in the DFN node library, or custom developed for special, complex calculations (using the supplied API). KPI timelines calculated on the DFN are stored in a database, from which they are retrieved as XML document fragments. These fragments are selected, filtered, sorted, and combined into consolidated XML documents, which contain all data required for reports.
XML reports can be published (for machine processing), or, for human readers, the formatting module converts the XML data into user-friendly document formats, including charts, graphs, etc. Formatting is again based on user-defined templates, thus formatted reports’ presentation (such as logos, page layout, texts and fonts, colors etc.) can be highly customized or branded.
SLA Suite processing logic and configuration is defined in XML files, with visual design tools provided for all processing steps:
� Data flow logic (i.e. define KPI calculation rules from raw measurement data)
� Report data selection and aggregation logic (i.e. define XML reports from KPI-s)
� Report layout definition (i.e. define PDF or HTML rendering of XML report data)
SLA Suite is based on modern, open software technologies including AJAX, J2EE, SOA, Web Services, etc. Configuration and KPI data is safely and efficiently stored using an Oracle RDBMS, resulting in a robust, scalable solution that support the massive data handling requirements of large-scale services (i.e. over 100 000 service elements).
� Present informative, accurate and appealing SLA and OLA reports to your customers and users.
� Visualize the real-time status of your service performance using the SLA Dashboard.
� Consolidate service quality information from multiple sources like 3rd party performance management tools, alarm and incident managers and trouble ticketing applications.
� Use visual design tools to define and configure your report contents, data calculation algorithms and report layout.
� Additional Benefits
� Define service performance indicators (KPI-s) of arbitrary complexity using the intuitive SLA Suite Data Flow processing model.
� Versatile 3rd party application connector modules are available to use data in your existing management applications.
� Automatically adjust reporting to changes of service and infrastructure items in your technical inventory or CMDB.
� The solid security architecture supports reporting compliant to various directives (SOX, ISO/IEC 27001, etc.)
SLA Suite Operation & Architecture
Notable Advantages

3
Sla Suitein an operationS Support Solution
reports in pdf, htMl, doc and/or XlS format.
both quasi real-time data and long-term trends on-demand on the dashboard.
service quality based on automatic measurements and trouble tickets.
Generate & publish
visualize
evaluate
Service Quality analyticS and viSualizationS
2
1
9

improving the quality and efficiency of ICT services Service Quality Analytics and Visualizations
SLA Suite
NETvisor Ltd.1119 Budapest, HungaryPetzval Jozsef utca. 56.
Telephone: (+36-1) 371 2700 Fax: (+36-1) 204 1664E-mail: [email protected]
Related Documents