Cedar Rapids/Iowa City Technology Corridor ™ Report Assessment of Employers’ Skill and Employment Needs Winter 2008

Skills2010
Mar 06, 2016
Skills Study Report
Welcome message from author
This document is posted to help you gain knowledge. Please leave a comment to let me know what you think about it! Share it to your friends and learn new things together.
Transcript
Cedar Rapids/Iowa City
Technology Corridor™ ReportAssessment of Employers’ Skill and Employment Needs
Winter 2008

� | Skills 2010 Technology Corridor Report
February 2008
We are fortunate in the Cedar Rapids/Iowa City Technology Corridor™ our area continues to prosper and receive national recognition for its quality growth and economic successes. The Skills 2010 Technology Corridor Report reflects industry’s forecast for our region regarding future workforce needs and skill set demands. This comprehensive and timely study allows us to properly prepare and strategically plan for shifts in an increasingly knowledge-based economy.
The Skills 2006 report, undertaken by the Technology Corridor Committee, made five recommendations, the most innovative being for businesses to require assessments and/or certificates for hiring in the area of essential and technical skills. This led to the creation of the Skills Advantage program, a first in the nation regional employer-led skills certification. Currently 93 Corridor-based companies use the assessment tools in their hiring process and more than 1,200 individuals have used Skills Advantage testing, with more than 1,000 certificates awarded.
If we are going to continue shaping our region’s future, we must take bold steps. This third report, Skills 2010, assumes a leadership role to determine replacement and new job growth projections by occupational categories and industry cluster sectors. This forward-looking report encompasses business needs and employee skills.
The report makes strong recommendations to continue investment in training to increase essential and technical skills, and suggests businesses build relationships with area schools to match skill requirements with curricula. Businesses are vigorously encouraged to develop internships and job shadowing experiences for high school and college students to educate our region’s youth to the variety of employment opportunities here in the Technology Corridor.
We know the quality of life in the Cedar Rapids/Iowa City Technology Corridor is excellent, but could be even better. We must all invest in efforts to continue to improve economic opportunities in order to preserve the quality of life that acts as a magnet to attract workers to our area.
Advancing technology has virtually changed the way we do business and it will accelerate our globalization process. If we expect the Cedar Rapids/Iowa City Technology Corridor to be the number one place to live, work and play in Iowa, if not the Midwest, we must be willing to critically review programming, develop even stronger partnerships, create more robust business relationships and further enhance the livability of our region.
Sincerely,
Jeff Disterhoft, Co-chair Jim Tinker, Co-chair Technology Corridor Committee Technology Corridor Committee
Skills 2010 Technology Corridor Report | �
Executive Summary
The Skills 2010 Study In the past few years, we have seen considerable change in the economy in Eastern Iowa, the state and the nation. As the economy continues to evolve, so do workforce needs of area employers. For the region to be successful in economic development efforts, it is important that information be obtained from area employers regarding workforce needs. It is for this reason the Technology Corridor Committee sponsored the Skills 2010 survey. The Technology Corridor Committee, consisting of representatives from Kirkwood Community College and the economic development organizations-Iowa City Area Development Group and Priority One, along with Kirkwood Community College and their regional economic develop-ment partners, collaborated to develop the Skills 2010 study, which updates the Corridor’s ongoing workforce needs. This important study provides current information about employment trends and employee training needs for continued success among Corridor employers. The Skills 2010 report builds on the Corridor’s continued efforts to identify and develop the finest workforce tools to build the greatest business success. In addition, the Skills 2010 report will reflect the successes of the recommendations outlined in the Skills 2006 report and build on the first Skills 2000 report.
Previous Research Studies In 1998, the Skills 2000 survey was conducted by a commission of local executives with a primary focus on determining future employment and workforce skill needs. In this initial study, 33 large employers participated, predominately located on the north end of the Cedar Rapids/Iowa City Technology Corridor. The Skills 2006 survey provided a reassessment of the original report but expanded the scope and size of the project. The most substantial differences between the Skills 2000 and Skills 2006 studies included the number of employers surveyed and the expansion of the geographic region.
Research Methods The Skills 2010 study is modeled on the Skills 2006 study to provide the region with data to identify differences and trends regarding workforce issues. The study uses a mixed methods research design involving both quantitative and qualitative measures. In partnership with the economic development partners, twelve industry sectors were identified, which represents two more than the Skills 2006 study. This decision incorporates the evolution of targeted industry sector research as well as acknowledges the growth and expansion of the region’s employer base. Employers were chosen based on industry sector, size of organization and geographic location within the corridor all in an attempt to provide an equal representation of organizations in the sample. Following this method, 286 employers were invited to participate in the study. The Skills 2010 study is a two part survey. The first part asks employers to identify their current employment levels as well as anticipated replacement and new job growth from 2008 to 2010 by Standard Occupational Classifications. Employers are also asked to indicate minimum educational
� | Skills 2010 Technology Corridor Report
levels desired for the replacement and new job projections. The second part of the survey asks employers to determine satisfaction levels and skill needs of their job applicants and incumbent workers. Questions to identify investment in training programs, training program trends, as well as work-based learning opportunities, are also included. Of the 286 surveyed companies, 84 completed the employee projections of the survey and 148 completed the skills and training information..
Goals of the Study 1. Determine replacement and new job growth projections by occupational categories and industry cluster sectors for the next three years. 2. Identify educational levels desired. 3. Determine if any skill gaps exist. 4. Identify whether organizations are investing in training and what methods are being used. 5. Determine factors impeding growth. 6. Determine employer needs and any gaps in regional higher education programs. 7. Identify utilization of internship and job shadowing programs.
Employer Workforce Needs: 2008–2010 The projections of the 84 employers who participated in this part of the survey identified 5,117 new and 11,355 replacement workers — a total of 16, 472 — will be needed in the next three years. Currently, the respondent employer’s represent 25% of the region’s workforce based on Iowa Workforce Development’s employment statistics as of January 2008. The projection for replacement workers is defined as normal turnover and retirements.
Employee Skills Profile Needs: 2008–2010 Overall, the theme among employer respondents is related to missing skill profiles among job applicants and existing workers in the region. The highlights include: > Seventy-three percent indicated critical skills were missing from their applicant pools > Fifty-nine percent of the respondents indicated skills were missing from their incumbent worker pool > Employers identify technical and essential foundational and soft skills as lacking in both applicant pool and among their existing workers. > Seventy-three percent of all replacement and new jobs as a percentage of the total will require education beyond a high school diploma > Of the employers surveyed, only 60 percent of the employers provide work-based learning opportunities for students and only 16 percent provide internships for high school students. > Almost all of the employers surveyed provide training for their employees. Forty-eight percent indicated using online training tools.

Skills 2010 Technology Corridor Report | �
Recommendations 1. Corridor employers must continue to stress the importance of foundational skills for future and in cumbent employees by requiring or recommending the Skills Advantage Work Ready Certificate. In addition, movement towards recommending or requiring the Skills Advantage Core + certificate and personality tests should be made. Educational institutions need to adapt curriculum and graduation requirements accordingly.
2. More work-based linkages for K-12 and postsecondary students will result in a prepared and engaged workforce. There must be additional emphasis placed on the importance of a seamless system delivery between K-12 and regional higher education institutions.
3. More efforts need to be made within Eastern Iowa to educate high school and college students about the employment opportunities available within the Corridor.
4. Corridor employers must be proactive in recruiting new employees from outside the region and the State of Iowa. Regional and state population growth will not keep pace with the workforce demands of local employers. Develop and implement more tools to attract workers with college degrees and certification
5. Provide wage and benefit data on a regular basis to our existing companies to aid them in their recruitment and retention work.
6. Area employers must work to create workplace cultures which embrace many generations of workers and diversity.
Conclusion Increased global competition will continue to affect the type of work being done in American workplaces, creating new high-skilled jobs and lessening demand for unskilled work. The impact will continue to grow as more of the economy is involved in producing exports or competing with imports. Contributing factors to economic expansion internationally include new technologies, increased trade, multinational brands and companies, and international finance. While the Internet and other new technologies have created a more open market for promoting products and services, the same international market, open for all to explore, is also creating new workforce challenges. All of these influencers create critical dynamics for employers in our region. Responding to rapid workplace change in relationship to the number of educated and skilled workers to fill current and future workforce needs is imperative. The Skills 2010 survey results and recommendations will continue to provide the region with critical direction to meet the changing dynamics of an international economy’s impact on workplace requirements.

� | Skills 2010 Technology Corridor Report
Skills 2010—The Full Report
Study Design and Research Methods To respond to ongoing workforce issues identified by employers in the region, the Skills 2010 study used a combination of quantitative and qualitative research questions in order to obtain a better understanding of critical workforce issues. The survey consisted of two primary components. Purposeful sampling techniques were used selecting employers from twelve industry clusters, with careful consideration of including small, medium and large employers as well as geographic representation from throughout Kirkwood Community College’s seven-county service area. The research team used purposeful sampling to determine the 286 employers who were asked to participate. Letters were sent to the CEO of the organization and the lead Human Resource professional asking them to participate. The first part of the survey asked employers to provide current employment figures along with projections for replacement positions, including normal turnover and anticipated retirements, as well as new job growth. Of the 286 who were invited to participate, 84 returned the survey providing a 29% return rate. The second part of the survey asked the employer a series of questions regarding training trends, skill profiles missing as well as utilization of work-based learning programs. Independent contractors were hired to conduct phone and face-to-face meetings to conduct interviews to gather this data. Of the 286 employers invited to participate, 148 provided information for 51% response rate. Employers were selected from twelve industry sectors. These sectors were chosen based on the business attraction and retention efforts of the economic development organizations, as well as other large sectors that represent significant segments of our regional economy.
The industry sectors used for the study are as follows:
• advanced manufacturing • information solutions
• bioprocessing/biotechnology • logistics/distribution
• consumer products • other selected industries
• education • packaging/plastics
• government • printing
• healthcare • trades
Skills 2010 Technology Corridor Report | �
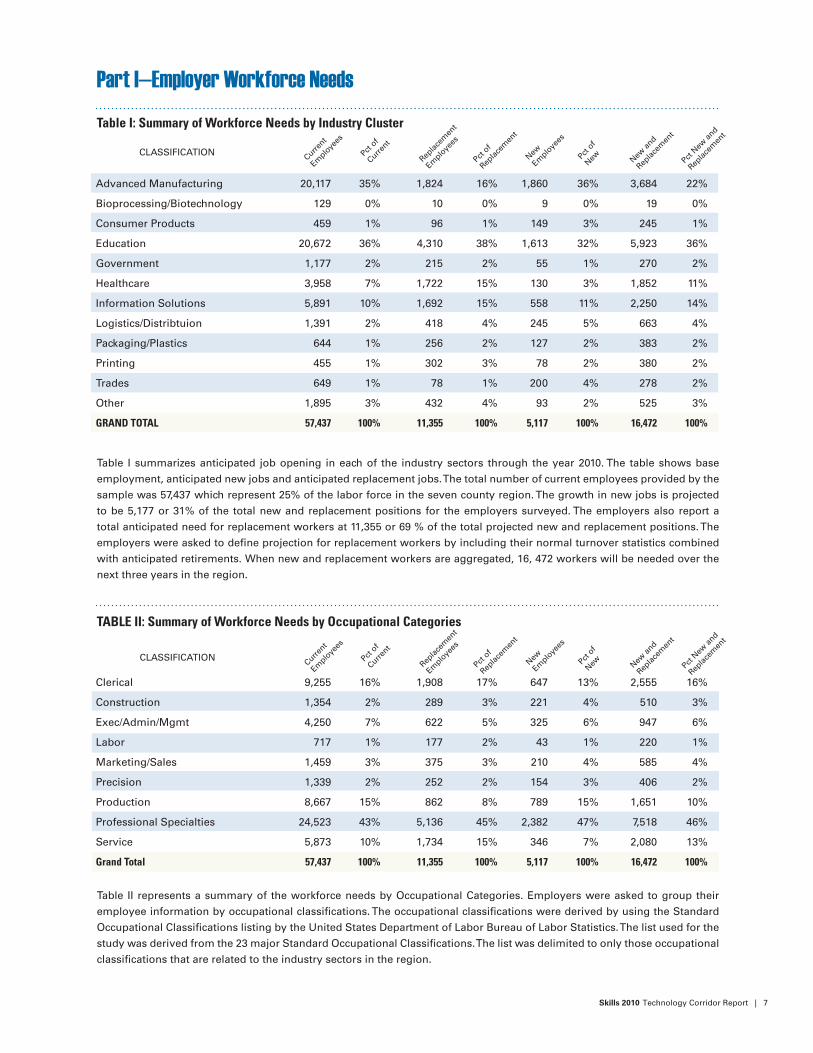
Part I—Employer Workforce NeedsTable I: Summary of Workforce Needs by Industry Cluster
Table I summarizes anticipated job opening in each of the industry sectors through the year �010. The table shows base
employment, anticipated new jobs and anticipated replacement jobs. The total number of current employees provided by the
sample was ��,��� which represent ��% of the labor force in the seven county region. The growth in new jobs is projected
to be �,1�� or �1% of the total new and replacement positions for the employers surveyed. The employers also report a
total anticipated need for replacement workers at 11,��� or �9 % of the total projected new and replacement positions. The
employers were asked to define projection for replacement workers by including their normal turnover statistics combined
with anticipated retirements. When new and replacement workers are aggregated, 1�, ��� workers will be needed over the
next three years in the region.
TABLE II: Summary of Workforce Needs by Occupational Categories
Table II represents a summary of the workforce needs by Occupational Categories. Employers were asked to group their
employee information by occupational classifications. The occupational classifications were derived by using the Standard
Occupational Classifications listing by the United States Department of Labor Bureau of Labor Statistics. The list used for the
study was derived from the �� major Standard Occupational Classifications. The list was delimited to only those occupational
classifications that are related to the industry sectors in the region.
Advanced Manufacturing �0,11� ��% 1,8�� 1�% 1,8�0 ��% �,�8� ��%
Bioprocessing/Biotechnology 1�9 0% 10 0% 9 0% 19 0%
Consumer Products ��9 1% 9� 1% 1�9 �% ��� 1%
Education �0,��� ��% �,�10 �8% 1,�1� ��% �,9�� ��%
Government 1,1�� �% �1� �% �� 1% ��0 �%
Healthcare �,9�8 �% 1,��� 1�% 1�0 �% 1,8�� 11%
Information Solutions �,891 10% 1,�9� 1�% ��8 11% �,��0 1�%
Logistics/Distribtuion 1,�91 �% �18 �% ��� �% ��� �%
Packaging/Plastics ��� 1% ��� �% 1�� �% �8� �%
Printing ��� 1% �0� �% �8 �% �80 �%
Trades ��9 1% �8 1% �00 �% ��8 �%
Other 1,89� �% ��� �% 9� �% ��� �%
GRAND TOTAL 57,437 100% 11,355 100% 5,117 100% 16,472 100%
CLASSIfICATIOnCurre
nt
Emplo
yees
Pct of
Current
Replac
emen
t
Emplo
yees
Pct of
Replac
emen
t
new
Emplo
yees
Pct o
f new new
and
Replac
emen
t
Pct new
and
Replac
emen
t
Clerical 9,��� 1�% 1,908 1�% ��� 1�% �,��� 1�%
Construction 1,��� �% �89 �% ��1 �% �10 �%
Exec/Admin/Mgmt �,��0 �% ��� �% ��� �% 9�� �%
Labor �1� 1% 1�� �% �� 1% ��0 1%
Marketing/Sales 1,��9 �% ��� �% �10 �% �8� �%
Precision 1,��9 �% ��� �% 1�� �% �0� �%
Production 8,��� 1�% 8�� 8% �89 1�% 1,��1 10%
Professional Specialties ��,��� ��% �,1�� ��% �,�8� ��% �,�18 ��%
Service �,8�� 10% 1,��� 1�% ��� �% �,080 1�%
Grand Total 57,437 100% 11,355 100% 5,117 100% 16,472 100%
CLASSIfICATIOnCurre
nt
Emplo
yees
Pct of
Current
Replac
emen
t
Emplo
yees
Pct of
Replac
emen
t
new
Emplo
yees
Pct o
f new new
and
Replac
emen
t
Pct new
and
Replac
emen
t

8 | Skills 2010 Technology Corridor Report
Of the occupational classifications provided to the employers, the largest category of need identified is Professional
Specialties. The number of replacement jobs is �,1�� (��%) and the number of new jobs is �,�8� (�� %t) for a total of �,�18
(��%) of the replacement and new positions. The positions found in this category represent engineers, architects, education,
healthcare practitioners, financial specialists and legal positions. The second highest category reported is Clerical, which
demonstrated a need of 1,908 (1�%) replacement positions and ��� (1�%) new jobs projected. finally, the third highest cat-
egory was services which reported a need of 1,��� (1�%) of replacement positions and ��� (� %) of new positions for a total
of �,080 (1�%) of replacement and new positions. It should also be noted that production occupations showed the second
highest level of new job growth
Table III: Summary of Workforce Needs by Educational Level
Seventy-three percent of all replacement and new jobs as a percentage of the total will require education beyond a high
school diploma. In addition, �1% will require a four year or graduate degree. An interesting finding to note is in the category
of new jobs, ��% are requiring a four-year degree or greater and ��% of newly created jobs will require education beyond
high school. It is clear from the survey responses that education is a high priority among area employers whether they are
replacing or expanding positions.
Part II—Skill Profile NeedsExisting Employee Training Programs
Question One — How are your current employee training programs being met? Count Percent In-house 71 48% External 11 7% In-house & External 48 32% Other 16 11% No training provided 2 1% Total 148 100%
Many of the respondents indicate they do provide training for their employees. A large percentage of employers offer in-house training with the second highest category representing a combination of in-house and external training programs. Only two of the employers indicate they do not provide training.
High School 18,0�� ��% �,0�� ��% 1,�9� ��% �,��9 ��%
Associates Degree 10,�9� 18% �,��� ��% 91� 18% �,��� ��%
Bachelors Degree ��,��0 ��% �,��� �9% �,��9 ��% �,�9� �1%
Masters Degree �,�0� 8% 1,1�9 10% �89 10% 1,��8 10%
Doctorate Degree �� 0% � 0% � 0% � 0%
Grand Total 56,511 100% 11,199 100% 5,058 100% 16,257 100%
EDUCATIOn LEvELCurre
nt
Emplo
yees
Pct of
Current
Replac
emen
t
Emplo
yees
Pct of
Replac
emen
t
new
Emplo
yees
Pct o
f new new
and
Replac
emen
t
Pct new
and
Replac
emen
t

Skills 2010 Technology Corridor Report | 9
Question Two — Does your company use any online training programs? Count Percent Yes 71 48% No 74 50% Unknown 3 2% Total 148 100%
The response to this question indicates an almost equal split between employers who use online training programs and those who do not.
Question Three — If you use online training programs, which ones? Count Percent Off-the-shelf 10 14% Customized 31 44% Combination Off-the-shelf & Customized 18 25% Other 12 17% Total 71 100%
Of the 71 employers who indicated they do provide online training programs, forty-four percent use customized products. The next highest category use a combination of customized and off-the shelf products. The lowest category was off-the-shelf programs.
Question Four —What are the barriers to using online training? Count Percent Technology 26 35% Cost 9 12% No personnel to oversee 3 4% Other 28 38% Unknown 8 11% Total 74 100%
In general, employers indicate barriers to be other issues outside of technology or cost, although technology continues to represent a barrier to area companies.
Question Five —What areas do you use online training? Count Percent Technical training 24 39% Soft skills training 9 15% Technical & Soft Skills 21 34% Other 8 13% Total 62 100%
Of the employers who provided responses to the types of online training programs, the largest response category was technical training followed by a combination of technical and soft skills training.

10 | Skills 2010 Technology Corridor Report
Question Six — If you do not use online training, what are the barriers? Count Percent Technology 5 10% Cost 3 6% No personnel to oversee 2 4% Other 28 56% None 12 24% Total 50 100%
Overall, just under half of the employers who responded to this part of the survey indicate they use online training programs. The largest categories of online training programs include technical and a combination of technical and soft skills. Of those who do use online training programs the responses are varied related to concerns and barriers of this type of training. Of those employers who reported they do not use online training programs, the responses are varied as well.
Question Seven — What skills are missing from your pool of applicants?Of the responses received, 73% indicated critical skills were missing from their applicant pools, with 20 % indicating no concerns and 7% not providing an answer. Of those indicating they were missing critical skills, 53% of the comments focused on essential foundational and soft skills and 47% were in the technical skills area.
Essential Skills— Foundational: GED/HS Diploma/Appropriate education/training programs, Grammar/spelling and Problem solving Soft:Communication, Customer Service and Work Ethic Technical:Computer Applications, Industry Experience, Math
Question Eight—What skills are missing from your current workforce?Overall, 59% of the respondents indicated skills were missing from their incumbent worker pool, with another 36% of the respondents indicating no concerns and 5% indicating they were unable to answer the question. Of those who did list concerns the list was equally split regarding skills lacking in technical and essentials skill areas. The largest categories shared by respondents are listed as follows.
Technical: Computers Applications, Technology, Skills related to specific industry
Essential Foundational: Conflict Resolution, Writing Soft: Communication, Work Ethic and Customer Service
Question Nine—What are the top three workforce factors impeding your ability to grow or expand in this region?In the study, two questions were asked regarding overarching workforce issues and business growth in the region. Of the three most important factors identified by area employers, two are related to the importance of an available, productive and education workforce. The last factor identified is one

Skills 2010 Technology Corridor Report | 11
that is indicative of the economic climate employers are currently competing in on a regional, state, national and international level. 1. Lack of skilled or qualified candidates. 2. Small labor and low unemployment in the region 3. Wage and benefits are a concern as it relates to the cost of doing business by employers.
Question Ten—Are you currently utilizing internships? Count Percent Yes 86 60% No 57 40% Total 143 100%
Question Eleven—Will you be using college or high school interns and how many? Count Percent College 58 84% High School 11 16% Total 69 100%
Overall, 60 percent of the employers indicating offering work-based learning programs as a part of their workforce strategies. Of those employer who defined whether their internships were for college or high school students, only 16 percent offer opportunities for high school students. More than the majority offer internships for college students.
Question Twelve—Are there any other comments you would like to share regarding workforce needs in this region?The final question for the study allowed the participants to share more open-ended comments regarding workforce needs in the region. Many of the same issues which surfaced regarding workforce issues impeding growth also surfaced in this question with the exception of the role of Kirkwood Community College to continue to be a community resource for employers and workers alike.
Overall, employers are concerned about: 1. A skilled and qualified candidate pool to hire from. 2. A tight labor market and low unemployment in the region.
Skills 2010 Human Resources Advisory Panel The Iowa City Area Development Group and Priority One convene a group of Human Resource professionals in the region regularly. This group provided direction to the project directors to shape the research methods and surveys.

1� | Skills 2010 Technology Corridor Report
Skills 2010 Resarch Team and Project Directors Dee Baird, Kirkwood Community College Kari Lammer, Priority One Joe Raso, Iowa City Development Group Mark Seckman, Priority One Jodie Stoessel, Kirkwood Community College DaLayne Williamson, Iowa City Area Development Group
A Special Note of Thanks RuffaloCody was hired to conduct the phone interviews of employers as they did in the Skills 2006 study. In partnership with Kirkwood Community College, RuffaloCody provides these services at a significantly reduced price as a service to the college. It is through the generosity of this partnership, that the study is able to be done on a regular basis. On behalf of the project team, we wish to thank the leadership team at RuffaloCody and their employees for their continued support of this project.
Skills 2010 Participating Companies and Organizations
2nd Story Software IncACTActera GroupADMAdvanced MillworkAEGON USAAmerican Color GraphicsAmerican ProfolApplied Tech ProductsArcadian Engineering SolutionsATPAW Welt AmbriscoBarnes ManufacturingBenco ManufacturingBenton County Board of SupervisorsBusiness Radio Sales & Service, IncCargillCarPac Publishing CoCedar County Board of SupervisorsCedar GraphicsCedar ManorCedar Rapids Community School DistrictCedar Rapids Inc
Cedar River Paper, a Weyerhaeuser BusinessCedar Valley FarmsCenter Point-Urbana Community School DistrictCentro IncCity of Cedar RapidsCity of CoralvilleCity of HiawathaCity of Iowa CityCity of MarionCity of MonticelloCivcoClear Creek Amana Community School DistrictClifton GundersonCole’s Quality FoodsCollege Community School DistrictCommunications Data Service IncCompleWareCooper TireCorrflex Display & PackagingCottage GroveCrescent Electric Supply CompanyDC Taylor

Skills 2010 Technology Corridor Report | 1�
Destinations Unlimited/Carlson WagonlitDKM ManufacturingEnergy Manufacturing IncEpley Marketing Services IncF&M BankFeedom Security BankFive Rivers CarpentersFoundation 2Four OaksFrank N Magid Associates IncFrontier Natural ProductsGarling ConstructionGazette Communications IncGE CapitalGEICOGenecor, A Danisco DivisionGeonetric LLCGeorgia PacificGoodwillGraham PackagingGSTC LogisticsHawkeye Foodservice DistributionHighway Equipment CompanyHigley Mansion Care CenterHJ HeinzHolden’s Foundation SeedHolmes Murphy & Associates Inc.Horizons Family ServicesHospers & Brothers PrintersHunter Specialties, IncIBEW Local Union #405Innovative Software EngineeringIntegrated DNA TechnologiesIntermec TechnologiesIowa City Community School DistrictIowa City Press CitizenIowa City Telecommunications CorporationIowa GlassIowa Renewable EnergyIowa State Bank & TrustJM SwankJones Regional Medical CenterJ-TEC Associates, Inc.Julin Printing CompanyKeystone Assisted Living
Kirkwood Community CollegeKlein ToolsKZIALinn Area Credit UnionLinn County RECLinn County Board of SupervisorsLinn Mar Community SchoolsLL PellingLMS North America (formerly CADSI)Mercer AdministrationMercy Iowa CityMercy Medical CenterMillhiser-Smith Agency IncMillstream Brewing CompanyMMS ConsultantsModine ManufacturingNetwork Microdesign CorporationNordstrom DirectNorthwestern MutualOaknoll Retirement ResidenceOral BOrbisPatient Education Institute, Inc.Physicians Clinic of IowaPickwickPlastic Products Co., Inc.Plumbers & Pipefitters Local 125PMX Industries, IncPoint BuildersPrincipal FinancialQuaker OatsRM BoggsRoberts Dairy CompanyRockwell CollinsRohrback AssociatesRR DonnelleyRuffaloCODY, LLCRyan CompaniesSaxtonSchenker LogisticsSchneider ElectricShive HatterySouth Slope CooperativeSt. Luke’s HospitalSunopta
1� | Skills 2010 Technology Corridor Report
Systems Unlimited, IncTanager PlaceThe University of IowaThe Weitz CompanyToyota Financial ServicesTrue North CompaniesTwin City OpticalUnited Fire GroupUnited Natural Foods (Blooming Prairie)Universal EngineeringUniversity of Iowa Hospitals and ClinicsUS CorrugatedVector Corporation
Veterans Medical CenterViraquestVirginia Gay HospitalWabash Transformer, IncWashington Community School DistrictWest MusicWest Ridge Care CenterWhirlpool Corporation, Amana DivisionWolfe Eye ClinicWorley WarehousingXethanol BioFuels, LLCYellow BookYeoman & Company
Skills 2010 Technology Corridor Report | 1�
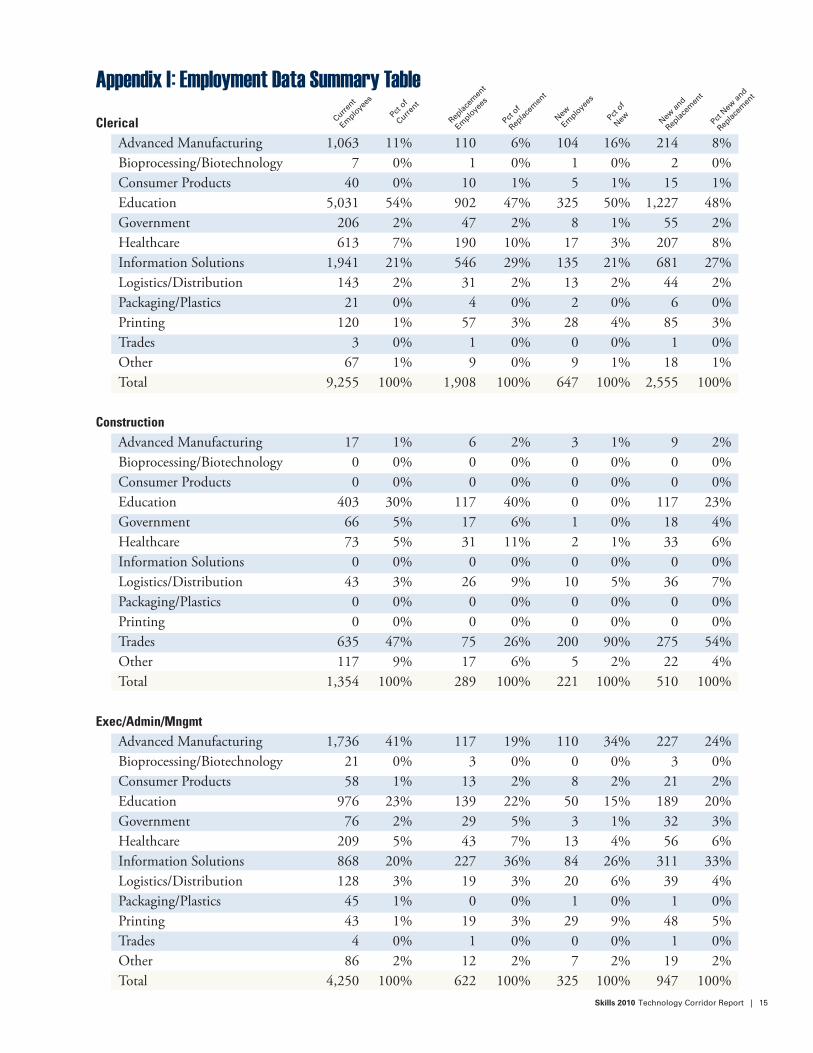
Appendix I : Employment Data Summary Table Clerical Advanced Manufacturing 1,063 11% 110 6% 104 16% 214 8% Bioprocessing/Biotechnology 7 0% 1 0% 1 0% 2 0% Consumer Products 40 0% 10 1% 5 1% 15 1% Education 5,031 54% 902 47% 325 50% 1,227 48% Government 206 2% 47 2% 8 1% 55 2% Healthcare 613 7% 190 10% 17 3% 207 8% Information Solutions 1,941 21% 546 29% 135 21% 681 27% Logistics/Distribution 143 2% 31 2% 13 2% 44 2% Packaging/Plastics 21 0% 4 0% 2 0% 6 0% Printing 120 1% 57 3% 28 4% 85 3% Trades 3 0% 1 0% 0 0% 1 0% Other 67 1% 9 0% 9 1% 18 1% Total 9,255 100% 1,908 100% 647 100% 2,555 100% Construction Advanced Manufacturing 17 1% 6 2% 3 1% 9 2% Bioprocessing/Biotechnology 0 0% 0 0% 0 0% 0 0% Consumer Products 0 0% 0 0% 0 0% 0 0% Education 403 30% 117 40% 0 0% 117 23% Government 66 5% 17 6% 1 0% 18 4% Healthcare 73 5% 31 11% 2 1% 33 6% Information Solutions 0 0% 0 0% 0 0% 0 0% Logistics/Distribution 43 3% 26 9% 10 5% 36 7% Packaging/Plastics 0 0% 0 0% 0 0% 0 0% Printing 0 0% 0 0% 0 0% 0 0% Trades 635 47% 75 26% 200 90% 275 54% Other 117 9% 17 6% 5 2% 22 4% Total 1,354 100% 289 100% 221 100% 510 100% Exec/Admin/Mngmt Advanced Manufacturing 1,736 41% 117 19% 110 34% 227 24% Bioprocessing/Biotechnology 21 0% 3 0% 0 0% 3 0% Consumer Products 58 1% 13 2% 8 2% 21 2% Education 976 23% 139 22% 50 15% 189 20% Government 76 2% 29 5% 3 1% 32 3% Healthcare 209 5% 43 7% 13 4% 56 6% Information Solutions 868 20% 227 36% 84 26% 311 33% Logistics/Distribution 128 3% 19 3% 20 6% 39 4% Packaging/Plastics 45 1% 0 0% 1 0% 1 0% Printing 43 1% 19 3% 29 9% 48 5% Trades 4 0% 1 0% 0 0% 1 0% Other 86 2% 12 2% 7 2% 19 2% Total 4,250 100% 622 100% 325 100% 947 100%
Current
Emplo
yees
Pct of
Current
Replac
emen
t
Emplo
yees
Pct of
Replac
emen
t
new
Emplo
yees
Pct o
f new new
and
Replac
emen
t
Pct new
and
Replac
emen
t

1� | Skills 2010 Technology Corridor Report
Labor Advanced Manufacturing 32 4% 3 2% 4 9% 7 3% Bioprocessing/Biotechnology 0 0% 0 0% 0 0% 0 0% Consumer Products 91 13% 4 2% 1 2% 5 2% Education 201 28% 8 5% 7 16% 15 7% Government 91 13% 4 2% 8 19% 12 5% Healthcare 49 7% 21 12% 2 5% 23 10% Information Solutions 1 0% 0 0% 0 0% 0 0% Logistics/Distribution 17 2% 3 2% 1 2% 4 2% Packaging/Plastics 34 5% 13 7% 9 21% 22 10% Printing 144 20% 114 64% 8 19% 122 55% Trades 0 0% 0 0% 0 0% 0 0% Other 57 8% 7 4% 3 7% 10 5% Total 717 100% 177 100% 43 100% 220 100% Marketing/Sales Advanced Manufacturing 627 43% 103 27% 100 48% 203 35% Bioprocessing/Biotechnology 0 0% 0 0% 1 0% 1 0% Consumer Products 31 2% 5 1% 6 3% 11 2% Education 21 1% 2 1% 2 1% 4 1% Government 0 0% 0 0% 0 0% 0 0% Healthcare 15 1% 6 2% 3 1% 9 2% Information Solutions 281 19% 83 22% 20 10% 103 18% Logistics/Distribution 469 32% 169 45% 74 35% 243 42% Packaging/Plastics 4 0% 0 0% 0 0% 0 0% Printing 2 0% 0 0% 1 0% 1 0% Trades 0 0% 0 0% 0 0% 0 0% Other 9 1% 7 2% 3 1% 10 2% Total 1,459 100% 375 100% 210 100% 585 100% Precision Advanced Manufacturing 249 19% 40 16% 11 7% 51 13% Bioprocessing/Biotechnology 16 1% 4 2% 0 0% 4 1% Consumer Products 14 1% 2 1% 4 3% 6 1% Education 416 31% 54 21% 54 35% 108 27% Government 57 4% 11 4% 2 1% 13 3% Healthcare 32 2% 11 4% 1 1% 12 3% Information Solutions 46 3% 5 2% 1 1% 6 1% Logistics/Distribution 409 31% 101 40% 66 43% 167 41% Packaging/Plastics 65 5% 19 8% 3 2% 22 5% Printing 23 2% 5 2% 10 6% 15 4% Trades 0 0% 0 0% 0 0% 0 0% Other 12 1% 0 0% 2 1% 2 0% Total 1,339 100% 252 100% 154 100% 406 100%

Skills 2010 Technology Corridor Report | 1�
Production Advanced Manufacturing 7,590 88% 396 46% 520 66% 916 55% Bioprocessing/Biotechnology 62 1% 2 0% 4 1% 6 0% Consumer Products 180 2% 50 6% 116 15% 166 10% Education 5 0% 3 0% 2 0% 5 0% Government 19 0% 5 1% 0 0% 5 0% Healthcare 0 0% 0 0% 0 0% 0 0% Information Solutions 118 1% 41 5% 0 0% 41 2% Logistics/Distribution 96 1% 39 5% 35 4% 74 4% Packaging/Plastics 473 5% 219 25% 110 14% 329 20% Printing 121 1% 107 12% 2 0% 109 7% Trades 0 0% 0 0% 0 0% 0 0% Other 3 0% 0 0% 0 0% 0 0% Total 8,667 100% 862 100% 789 100% 1,651 100% Professional Specialties Advanced Manufacturing 8,800 36% 1,048 20% 1,006 42% 2,054 27% Bioprocessing/Biotechnology 23 0% 0 0% 2 0% 2 0% Consumer Products 27 0% 6 0% 6 0% 12 0% Education 10,326 42% 2,329 45% 990 42% 3,319 44% Government 204 1% 28 1% 5 0% 33 0% Healthcare 2,254 9% 1,076 21% 86 4% 1,162 15% Information Solutions 2,457 10% 572 11% 245 10% 817 11% Logistics/Distribution 69 0% 23 0% 22 1% 45 1% Packaging/Plastics 0 0% 0 0% 2 0% 2 0% Printing 2 0% 0 0% 0 0% 0 0% Trades 7 0% 1 0% 0 0% 1 0% Other 354 1% 53 1% 18 1% 71 1% Total 24,523 100% 5,136 100% 2,382 100% 7,518 100% Service Advanced Manufacturing 3 0% 1 0% 2 1% 3 0% Bioprocessing/Biotechnology 0 0% 0 0% 1 0% 1 0% Consumer Products 18 0% 6 0% 3 1% 9 0% Education 3,293 56% 756 44% 183 53% 939 45% Government 458 8% 74 4% 28 8% 102 5% Healthcare 713 12% 344 20% 6 2% 350 17% Information Solutions 179 3% 218 13% 73 21% 291 14% Logistics/Distribution 17 0% 7 0% 4 1% 11 1% Packaging/Plastics 2 0% 1 0% 0 0% 1 0% Printing 0 0% 0 0% 0 0% 0 0% Trades 0 0% 0 0% 0 0% 0 0% Other 1,190 20% 327 19% 46 13% 373 18% Total 5,873 100% 1,734 100% 346 100% 2,080 100%

18 | Skills 2010 Technology Corridor Report
Appendix II : Standard Occupational ClassificationsSkills 2010 STANDARD OCCUPATIONAL CLASSIFICATION
Executive, Administrative and Managerial Occupations Executives Advertising, Marketing, Public Relations and Sales Managers Operations Specialties Managers—Administrative, CIS, Financial, HR Purchasing Other Management Occupations
Professional Specialty Occupations Business Operations Specialists Financial Specialists Computer and Mathematical Architecture and Engineering Life, Physical and Social Science Community and Social Services Legal Education, Training and Library Primary, Secondary and Other Education Teachers Arts, Design, Entertainment, Sports and Media Healthcare Practitioners and Technologists and Technicians
Service Occupations Healthcare Support Protective Service Food Preparation and Serving Building and Grounds Cleaning and Maintenance Personal Care and Service—Entertainment, Transportation and Tourism, Child Care
Marketing and Sales Occupations Supervisors, Sales Workers Retail Sales Workers Sales Representatives, Services Sales Representatives, Wholesale and Manufacturing Other Sales and Related Workers
Administrative Support and Clerical Occupations Supervisors, Office and Administrative Support Workers Communications and Equipment Operators Financial Clerks Information and Record Clerks: Customer Service Representatives Receptionists Material Recording, Scheduling, Dispatching and Distributing Workers

Skills 2010 Technology Corridor Report | 19
Secretaries and Administrative Assistants Other Office and Administrative Support Workers
Precision Production, Craft and Repair Occupations Installations, Maintenance and Repair Supervisors and Workers Electrical and Electronic Equipment Mechanics, Installers and Repairers Vehicle and Mobile Equipment Mechanics, Installers and Repairers Other Installers and Repairers: Control and Valve Industrial Machinery Line Precision Instrument and Equipment Miscellaneous
Production Occupations Supervisors, Production Workers Assemblers and Fabricators Food Processing Workers Metal Workers and Plastic Workers Printing Workers Textile, Apparel and Furnishings Workers Woodworkers Plant and System Operators
Operators, Fabricators and Laborers Occupations Transportation and Material Moving Occupations Supervisors, Transportation and Material Moving Workers
Construction and Extraction Occupations Construction and Extraction Supervisors Brickmasons, Blockmasons and Stonemasons Carpenters Carpet, Floor and Tile Installers and Finishers Cement Masons, Concrete Finishers and Terrazzo Workers Construction Laborers Construction Equipment Operators Drywall Installers, Ceiling Tile Installers and Tapers Electricians Extraction Workers Glaziers Inspectors Insulation Workers Painters and paperhangers Pipelayers, Plumbers, Pipefitters and Steamfitters Roofers Sheet Metal Workers

TomAllerPresidentInterstate Power & Light Co., an Alliant Energy Company
SteveCavesIowa Regional PresidentU.S. Bank NA
JeffreyDisterhoftPresident/CEO University of Iowa Community Credit Union
ScottFisherSenior Vice President Mercer Administration
KellyHayworthCity AdministratorCity of Coralville
MarkLongPresidentWells Fargo Bank
ChuckPetersPresident & COOGazette Communications RonaldR.ReedPresident/CEOMercy Iowa City
KyleSkogmanPresidentSkogman Homes
JimTinkerPresident AmeritusMercycare Service Corp
Committe Members