Skills Studies Tourism sector 2018 Research and Projects RP 02/18

Welcome message from author
This document is posted to help you gain knowledge. Please leave a comment to let me know what you think about it! Share it to your friends and learn new things together.
Transcript
Skills Studies
Tourism sector
2018
Research and Projects
RP 02/18

1 | P a g e
Disclaimer: This report is published under the responsibility of the Human Resource Development Council
(HRDC). The opinions expressed and arguments employed herein do not necessarily reflect the official views of
HRDC.

2 | P a g e
TABLE OF CONTENTS
1. BACKGROUND OF THE SECTOR ........................................................................................... 6
1.1 OBJECTIVES OF THE STUDY ......................................................................................................... 6
1.2 DEFINITION OF THE SECTOR AND SUB-SECTORS ..................................................................... 7
1.3 INTERNATIONAL CONTEXT - WORLD TOURISM TREND ............................................................ 8
1.4 TOURISM'S CONTRIBUTION TO EMPLOYMENT WORLDWIDE ................................................... 9
1.5 Long-term perspective of world tourism .......................................................................................... 10
1.6 TOURISM SECTOR – LOCAL PERSPECTIVE .............................................................................. 11
1.6.1 CONTRIBUTION OF THE TOURISM SECTOR TO THE ECONOMY ............................................ 11
1.6.2 CONTRIBUTION OF THE TOURISM SECTOR TO GDP ............................................................... 12
1.6.3 EMPLOYMENT IN THE TOURISM SECTOR ................................................................................. 12
1.6.4 NUMBER OF HOTELS, ROOMS AND BED PLACES .................................................................... 13
1.6.5 FUTURE TOURIST ARRIVALS ...................................................................................................... 15
1.6.6 TOURISM EARNINGS & EXPENDITURE ...................................................................................... 16
1.7 FUTURE OF THE TOURISM INDUSTRY IN MAURITIUS .............................................................. 17
1.7.1 CRUISES SECTOR ........................................................................................................................ 17
1.8 EDUCATION AND SKILLS LANDSCAPE ....................................................................................... 20
1.8.1 THE GLOBAL EDUCATION AND SKILLS LANDSCAPE ............................................................... 20
1.8.2 THE LOCAL EDUCATION AND SKILLS LANDSCAPE .................................................................. 21
1.9 LINKAGES BETWEEN EDUCATION AND TRAINING SYSTEMS AND THE WORKPLACE ........ 25
1.9.1 THE NATIONAL TRAINING FUND .................................................................................................25
1.9.2 SECTORAL SKILLS DEVELOPMENT SCHEME (SSDS) ...............................................................27
1.9.3 NATIONAL SKILLS DEVELOPMENT PROGRAMME (NSDP) .......................................................27
1.9.4 GRADUATE TRAINING FOR EMPLOYMENT SCHEME (GTES) ...................................................29
1.9.5 YOUTH EMPLOYMENT PROGRAMME (YEP) ...............................................................................29
1.9.6 SECTORAL COMMITTEE FOR THE TOURISM SECTOR ..............................................................30
1.10 STRATEGY LANDSCAPE FOR THE DEVELOPMENT OF THE TOURISM SECTOR .................. 30
1.10.3 BUDGET SPEECH 2018/2019 ............................................................................................................ 32
SKILLS ISSUES: AN INTERNATIONAL PERSPECTIVE ................................................................................. 33
2. METHODOLOGY .......................................................................................................................................38
2.1 DEFINING THE SECTOR ............................................................................................................... 38
2.2 DATA COLLECTION APPROACH .................................................................................................. 39
3. SURVEY FINDINGS .................................................................................................................................45
3.1 SECTOR PROFILE ......................................................................................................................... 45
3.1.1 BUSINESS PROFILE ...................................................................................................................... 45
3.1.2 EMPLOYMENT PROFILE ............................................................................................................... 46
3.1.2.1 Reasons for employing expatriates ................................................................................................. 48
3.1.3 SYSTEM FOR TRANSFER OF SKILLS .......................................................................................... 48
3.2 RECRUITMENT AND JOB READINESS ........................................................................................ 49
3.3 WHAT MAKES VACANCIES HARD TO FILL AND WHAT ARE THE CRITICAL VACANCIES FOR THE
SECTOR? 55
3.3.1 OCCUPATIONAL ANALYSIS ......................................................................................................... 55

3 | P a g e
3.4 FUTURE SKILLS REQUIREMENTS ............................................................................................... 65
3.4.1 FUTURE BUSINESS SCENARIO ................................................................................................... 65
3.5 FUTURE VACANCIES .................................................................................................................... 68
3.6 TOP SKILLS IN DEMAND IN NEXT 5 YEARS ............................................................................... 70
3.7 INDUSTRY - EDUCATION LINKAGES ........................................................................................... 71
3.7.1 STATUS OF LINKAGES OF ENTERPRISES WITH THE EDUCATION SYSTEM ......................... 71
3.7.2 ENTERPRISE AFFILIATIONS ........................................................................................................ 72
3.7.3 SKILLS DEVELOPMENT INITIATIVES ........................................................................................... 73
3.7.4 BARRIERS TO BUILD LINKS WITH EDUCATION AND TRAINING PROVIDERS ........................ 76
3.8 SKILLS DEVELOPMENT ................................................................................................................ 76
3.8.1 DIFFICULTIES IN TRAINING EMPLOYEES .................................................................................. 76
3.8.2 PREFERRED WAY FOR ACQUIRING SKILLS .............................................................................. 77
3.8.3 STEM AND OTHER SKILLS .......................................................................................................... 78
3.8.4 LANGUAGES .................................................................................................................................. 80
3.8.5 FOREIGN LANGUAGE USAGE...................................................................................................... 81
3.9 SKILLS BAROMETER .................................................................................................................... 82
3.9.1 GAUGING THE LEVEL OF SKILLS MISMATCH IN ENTERPRISES ............................................. 82
3.10 SKILLS SHORTAGE ....................................................................................................................... 84
3.11 Qualitative Analysis ......................................................................................................................... 87
Future of the sector: .......................................................................................................................................... 87
Labour/employment .......................................................................................................................................... 87
Reorganising the institutional and legal set-up of the tourism sector ................................................................ 88
Tourism products and services ......................................................................................................................... 88
Branding/Image/security ................................................................................................................................... 88
Training/skills development .............................................................................................................................. 89
Cultural tourism and Mauritian product ............................................................................................................. 89
4. RECOMMENDATIONS .............................................................................................................................90
References ..................................................................................................................................................... 101

4 | P a g e
LIST OF TABLES
Table 1: Contribution of the Tourism sector to GDP .................................................................................... 12
Table 2: Employment in the Tourism sector ................................................................................................. 13
Table 3: Tourist accommodation 2000 - 2017 .............................................................................................. 14
Table 4: Hotel Classifications ........................................................................................................................ 15
Table 5: Tourist arrivals 2006-2021 .............................................................................................................. 15
Table 6: Tourism Earnings ............................................................................................................................. 16
Table 7: Tourist arrivals by sea and air ......................................................................................................... 18
Table 8: SC Results in Travel & Tourism by gender, 2016 ............................................................................. 21
Table 9: HSC results 2016 by grade achieved, Travel & Tourism .................................................................. 22
Table 10: Enrolment as per field of studies 2016 ......................................................................................... 22
Table 11: New admissions on taught programmes as at December 2016 ................................................... 23
Table 12: Approved training programmes under NSDP ............................................................................... 28
Table 13: Distribution of establishments in the population by size and sector of activity ........................... 40
Table 14: Distribution of establishment by sector in the sample, with respective blowing up factors and
population weight adjustments .................................................................................................................... 43
Table 15: Holders of Work and Occupational permits (n=152) .................................................................... 47
Table 16: Reasons for employing expatriates by respondents for holders of Occupational permits (%) .... 48
Table 17: Reasons for employing expatriates by respondents for holders of Work permits (%) ................. 48
Table 18: Preparedness of employees to enter the world of work as per educational background (%) ..... 51
Table 19: Satisfaction of enterprises with the skills mix of school leavers in the past 2 years .................... 52
Table 20: Satisfaction of enterprises with the skills mix of TVET holders in the past 2 years (n = 112) ...... 53
Table 21: Satisfaction of enterprises with the skills mix of university graduates in the past 2 years (n = 112)
...................................................................................................................................................................... 54
Table 22: Common occupations by occupation groups in the Tourism sector ............................................ 56
Table 23: List of hard to fill vacancies as per occupational groups .............................................................. 58
Table 24: Main causes for having hard to fill vacancies ............................................................................... 60
Table 25: Reasons difficult to recruit for occupational groups ..................................................................... 60
Table 26: Consequences of hard-to-fill vacancies on establishments .......................................................... 62
Table 27: Measures to remedy “hard-to-fill vacancies” ............................................................................... 63
Table 28: Skills requirements for different occupational groups ................................................................. 64
Table 29: Future size of labour and business activities in case business environment remain same or
improves ....................................................................................................................................................... 65
Table 30: Skills and support requirements of enterprises in case of expansion .......................................... 66
Table 31: Vacancies as per occupational groups for the sample .................................................................. 68
Table 32: Most in-demand occupations ....................................................................................................... 69
Table 33: Six most skills in demand for the sector........................................................................................ 70
Table 34: Skills requirements and subjects/fields for the sector .................................................................. 70
Table 35: Membership of respondents (n=59) ............................................................................................. 73
Table 36: Main difficulties encountered while training employees ............................................................. 77
Table 37: Measures to improve training ....................................................................................................... 78

5 | P a g e
LIST OF FIGURES
Figure 1: Trend in tourist arrivals up to 2030 ............................................................................................... 11
Figure 2: Sectoral growth rate 2012 – 2015 ................................................................................................. 11
Figure 3: Contribution to GDP of the Tourism sector 2006-2017 ................................................................. 12
Figure 4: Number of rooms and bed places .................................................................................................. 14
Figure 5: Tourist arrivals ............................................................................................................................... 15
Figure 6: Average Expenditure per tourist .................................................................................................... 16
Figure 7: Tourist arrivals and earnings (forecast) ......................................................................................... 17
Figure 8: Training incentives under the NTF ................................................................................................. 25
Figure 9: Programmes approved (n=133) ..................................................................................................... 28
Figure 10: Tourism sector strategic plan ...................................................................................................... 31
Figure 11: Economic activities of respondents ............................................................................................. 45
Figure 12: Number of years in operation ...................................................................................................... 46
Figure 13: Whether the only organisation or part of a larger organisation ................................................. 46
Figure 14: Employment of expatriates .......................................................................................................... 47
Figure 15: Existence of system of transfer of skills from expatriates to local employees (n=45) ................ 49
Figure 16: Percentage of organisations which recruited over the past 2 years (n=132) .............................. 49
Figure 17: Recruitment of new employees as per their educational background (n=112) .......................... 50
Figure 18: Preparedness of employees entering the world of work as per educational background ......... 51
Figure 19: Skills mix of school leavers listed under 'not satisfied at all.' ...................................................... 53
Figure 20: Skills mix of university graduates listed under 'fully satisfied.' ................................................... 55
Figure 21: Distribution of employees as per occupational groups for the sample (n=8136) ....................... 56
Figure 22: Future size of labour and business activities in case business environment remain same or
improves ....................................................................................................................................................... 66
Figure 23: Vacancies in the short-term ......................................................................................................... 68
Figure 24: Percentage of enterprises linked of with schools, TVET, professional bodies or universities. .... 72
Figure 25: Whether establishment is a member of any industry associations/councils (local or
international) (n=132) ................................................................................................................................... 72
Figure 26: Do you benefit through membership from any skills development opportunities (n = 60) ....... 73
Figure 27: Participation of enterprises in skills development initiatives ...................................................... 75
Figure 28: Major barriers to build links with education and training providers ........................................... 76
Figure 29: Awareness for the STEM skills (n=132) ........................................................................................ 79
Figure 30: Importance of STEM as per establishments (n=132) ................................................................... 79
Figure 31: Measures to be taken to promote acquisition of STEM skills ..................................................... 80
Figure 32: Importance of foreign language in establishments (n=132) ........................................................ 80
Figure 33: Needs for foreign language in establishments ............................................................................ 81
Figure 34: Mismatch for all occupational groups in terms of skills and qualifications ................................. 83
Figure 35: Skills obsolescence as per occupational groups .......................................................................... 84
Figure 36: Level of skills shortage as per occupational groups ..................................................................... 85
6 | P a g e
1. BACKGROUND OF THE SECTOR
1.1 OBJECTIVES OF THE STUDY
The aim of this latest edition in this series of studies is to provide new insights on skills requirements
for the Tourism and Hospitality sector from a demand perspective. This study attempts to provide
evidence on skills requirements to help informed decision making and project development. The
main objectives of the study are:
To map current and future skills requirements in the Tourism and Hospitality sector;
To identify the critical skills and hard-to-fill posts by occupational groups in the Tourism
and Hospitality sector;
To analyze the education and industry linkages to foster employability; and
To assess the perception of skills mismatch across occupational groups in the sector.
The past few years are considered as a landmark for the Tourism and Hospitality industry for
Mauritius as for the first time, more than one million tourists visited the country. This achievement
has been the result of a continuously prosperous Tourism and Hospitality industry since the 1970s.
The sector has been constantly increasing in importance for the Mauritian economy and its
contributions in terms of GDP and employment is not negligible.
Mauritius is famous worldwide for its tropical climate, blend of white flour sand beaches
accompanied with turquoise lagoon, lush vegetation, multiculturalism and of course hospitality
which plays a pivotal role in marketing the sector. Beside its natural beauties, the country is also
renowned for its hospitability and services. These assets have contributed to project the Mauritian
destination at the 8th position by the Trip Advisor website and at the 3rd position among African
countries (Travel and Tourism Competitiveness Report 2015).
These achievements have rest on few important pillars which have been aggressive marketing,
stable political environment and most importantly the Mauritian hospitality with the people working
in the sector. The last point has a huge bearing on the development of the sector as Mauritius is
renowned for its hospitality and services.

7 | P a g e
Today the Tourism and Hospitality sector is at the crossroad of its development. With more than
four decades of operation, the sector needs to revamp itself in many areas to sustain its importance
as an engine of growth and employment. With new markets opening up and better air connectivity,
the sector has moved to another level in its development. However to keep pace with the
development in the sector worldwide, various initiatives and adjustments need to be made.
The sector is predominantly a service oriented sector and the contribution of its human resources
determine the success of the sector. We have seen that operators in the sector are facing numerous
issues especially in terms of availability of human resources. This survey aims mainly at identifying
the different HR issues, especially skills, being faced by operators. The report will make an in-depth
analysis of the various issues pertaining to human resources and it will also provide us with a status
of where the sector stand in terms of skills. It will also try to address other issues of human resource
development for the sector in the future.
1.2 DEFINITION OF THE SECTOR AND SUB-SECTORS
For this study, a parallel with the breakdown of activities used by Statistics Mauritius has been done.
This is line with the National Standard Classification (NSIC) - adapted from the UN International
Standard Industrial Classification of Economic Activities. The tourism sector is defined by the
following two sub-sectors, based upon NSIC 2007 under codes 55 and 56:
DIVISION 55: ACCOMMODATION
Short term accommodation activities
Large hotels (more than 80 rooms)
Small hotels(up to 80 rooms)
Guest house
Tourist residence
Short term accommodation activities
Camping grounds, recreational vehicle parks and trailers
Parks
DIVISION 56: FOOD AND BEVERAGES SERVICE ACTIVITIES
Food and beverage service activities
Restaurants and mobile food service activities

8 | P a g e
Restaurants (including liquor)
Restaurant (Excluding liquor)
Tour operator activities
Activities of tourist guides
Sport fishing
Activities for amusement parks and theme parks.
Ticket sale activities for theatrical, sports and others.
Amusement and entertainment events
Operation of excursion, cruise or sightseeing boats
Renting of pleasure boats with crew or fishing cruises.
1.3 INTERNATIONAL CONTEXT - WORLD TOURISM TREND
Sixty years ago, since the tourism sector started to emerge as a global economic sector, few could
have forecasted the speed and strength of its development both in terms of the number of people
crossing borders and its economic impact as a generator of foreign exchange, income and
employment opportunities.
Despite the different issues and problems which have emerged at regional and global level, the
tourism sector has always been able to overcome its issues. It has become the most flourishing
industry in the world. According to Mr Rifai, the United Nations World Tourism Organisation
(UNWTO) Secretary General, “Tourism is one of the most resilient and fastest growing economic
sectors but also very sensitive to risks, both actual and perceived. As such, the sector must continue
to work together with governments and stakeholders to minimise risks, respond effectively and build
confidence among travelers.” 1
The number of tourists worldwide has been increasing with a positive constant gradient for the past
6 years. According to statistics from UNWTO, the year 2016 was expected to become the sixth
consecutive year of robust growth. In the year 1950, at the embryonic stage, the tourism sector had
only made a receipt of around USD 2 billion with 25 million tourists’ arrivals. In the Annual Report
2015 of the UNWTO2, it was stated that the number has crossed the 1 billion USD mark threshold
1 United Nations World Tourism Organisation, World Tourism Barometer, Volume 14, November 2017 2 United Nations World Tourism Organisation, Annual Report 2015
9 | P a g e
in year 2013 and has improved by 8.8 percent in 2015. It is expected that a threshold of 1.8 billion
USD is expected to be crossed by the year 2030.
The strength and health of the sector can be illustrated by the figures provided by the UNWTO.
Likewise, international tourism receipts earned by destinations worldwide have surged from 2
billion USD in 1950 to 104 billion USD in 1980, USD 495 billion in 2000, and USD 1260 billion
in 2015. It should be also noted that international tourism now represents 7 percent of the world’s
exports in terms of goods and services, up from 6 percent in 2014. It was noticed that tourism has
grown faster than world trade over the past four years. As a worldwide export category, tourism
ranks third after fuels and chemicals and ahead of food and automotive products. In many
developing countries, tourism ranks as the first export sector (UNWTO Annual Report 2016).
1.4 TOURISM'S CONTRIBUTION TO EMPLOYMENT WORLDWIDE
Travel and tourism generated around 107,833,000 jobs directly in 2015 and this was forecasted to
grow by 1.9 percent in 2016 to 109,864,000 which represented 3.6 percent of total employment
(World Travel and Tourism Council Economic Impact Report 2016).
These employments include those employed in hotels, travel agents, airlines and other passenger
transportation services excluding commuter services. It also includes, for example, the activities of
restaurants and leisure industries directly supported by tourists. By 2026, travel and tourism is
expected to account for around 135,884,000 jobs directly. This represent an increase of 2.1 percent
over the next ten years, according to the World Travel and Tourism Council3.
The total contribution of travel and tourism to employment including the wider effects from
investment, the supply chain and induced income impacts was 283,578,000 jobs in 2015 which
represented 9.5 percent of total employment. According to the World Travel and Tourism Council
Economic Impact Report 2016, this was expected to increase by 2.2 percent in 2016 to reach
289,756,000 jobs, representing 9.6 percent of total employment. Furthermore, by 2026, travel and
tourism is forecasted to support 370,204,000 jobs amounting to 11 percent of total employment.
3 World Travel and Tourism Council, Travel and Tourism Economic Impact 2016 World
10 | P a g e
1.5 Long-term perspective of world tourism
The UNWTO Tourism Towards 2030 is UNWTO’s long-term outlook and it makes an assessment
of the development of the sector over the two decades from 2010 to 2030 with an aim to provide a
global reference on tourism future development. The key outputs of Tourism Towards 2030 are
quantitative projections for international tourism demand over a 20-year period, with 2010 as the
base year and ending in 2030. The updated forecast has been enriched with an analysis of the social,
political, economic, environmental and technological factors that have shaped tourism in the past,
and which are expected to influence the sector in the future.
According to the UNWTO Tourism Towards 2030, the number of international tourist arrivals
worldwide is expected to increase by an average of 3.3 percent a year over the period 2010 to 2030.
In absolute numbers, international tourist arrivals will increase by some 43 million a year, compared
with an average increase of 28 million a year during the period 1995 to 2010. At that projected rate
of growth, international tourist arrivals worldwide are expected to reach 1.4 billion by 2020 and 1.8
billion by the year 2030. International tourist arrivals in the emerging economies of Asia, Latin
America, Central and Eastern Europe, Eastern Mediterranean Europe, the Middle East and Africa
will grow faster compared to that of advanced economy destinations. The strongest growth by
region will be seen in Asia and the Pacific regions (UNWTO Tourism Towards 2030). Figure 1
shows the trend in terms of tourist arrivals worldwide up to 2030.

11 | P a g e
Figure 1: Trend in tourist arrivals up to 2030
1.6 TOURISM SECTOR – LOCAL PERSPECTIVE
1.6.1 CONTRIBUTION OF THE TOURISM SECTOR TO THE ECONOMY
The tourism sector has been continuously developing since the 1970s and its share to the Mauritian
economy has continuously been an important one making it an essential pillar of the economy. This
can be seen by the constant increase in the number of people being employed in the sector, its
increase in terms of revenue for the country and also its share of the GDP. Henceforth, to be at par
with Statistics Mauritius classifications and definitions, the tourism industry will also be referred to
as the ‘accommodation and food service activities’. According to Statistics Mauritius, the
‘accommodation and food service activities’ was forecasted for 2017 to grow by 3.2 percent and
tourist arrivals for 2017 was 1341860. Figure 2 shows the sectoral growth rate of the sector between
the periods of 2012 to 2015.
Figure 2: Sectoral growth rate 2012 – 2015
Source: Statistics Mauritius
12 | P a g e
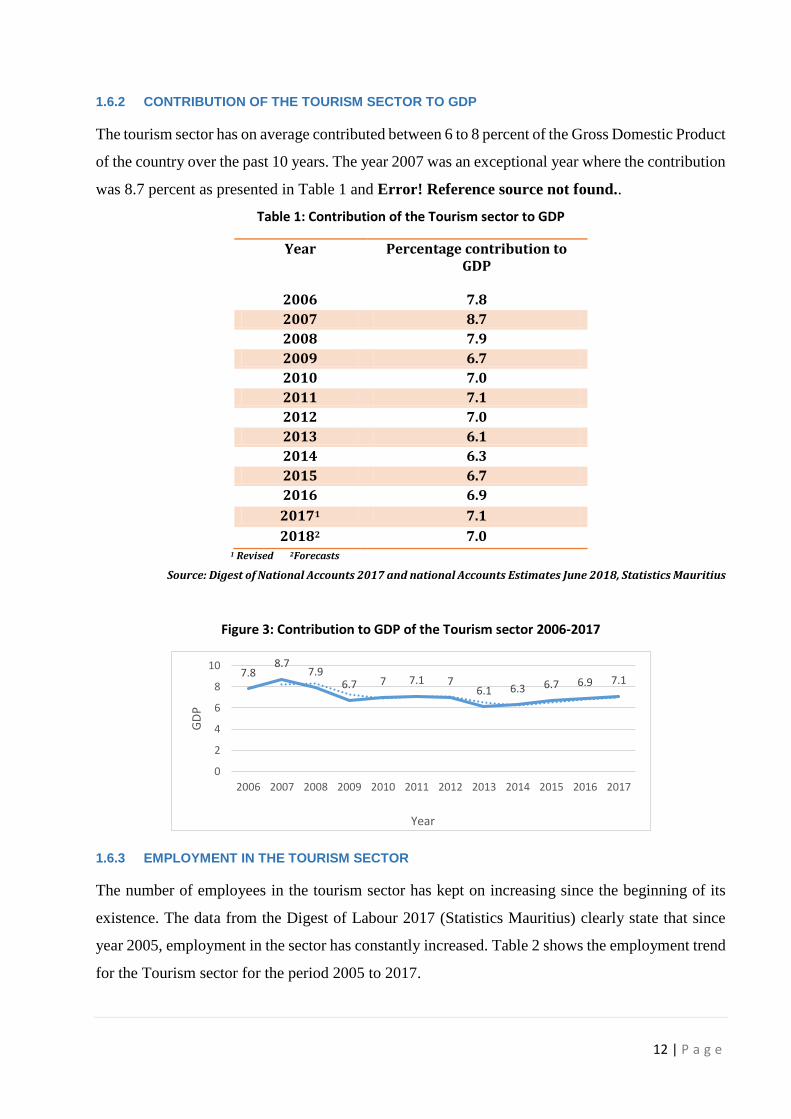
1.6.2 CONTRIBUTION OF THE TOURISM SECTOR TO GDP
The tourism sector has on average contributed between 6 to 8 percent of the Gross Domestic Product
of the country over the past 10 years. The year 2007 was an exceptional year where the contribution
was 8.7 percent as presented in Table 1 and Error! Reference source not found..
Table 1: Contribution of the Tourism sector to GDP
Year Percentage contribution to GDP
2006 7.8
2007 8.7
2008 7.9
2009 6.7
2010 7.0
2011 7.1
2012 7.0
2013 6.1
2014 6.3
2015 6.7
2016 6.9
20171 7.1
20182 7.0 1 Revised 2Forecasts
Source: Digest of National Accounts 2017 and national Accounts Estimates June 2018, Statistics Mauritius
Figure 3: Contribution to GDP of the Tourism sector 2006-2017
1.6.3 EMPLOYMENT IN THE TOURISM SECTOR
The number of employees in the tourism sector has kept on increasing since the beginning of its
existence. The data from the Digest of Labour 2017 (Statistics Mauritius) clearly state that since
year 2005, employment in the sector has constantly increased. Table 2 shows the employment trend
for the Tourism sector for the period 2005 to 2017.
7.88.7
7.96.7 7 7.1 7
6.1 6.3 6.7 6.9 7.1
0
2
4
6
8
10
2006 2007 2008 2009 2010 2011 2012 2013 2014 2015 2016 2017
GD
P
Year

13 | P a g e
Table 2: Employment in the Tourism sector
YEAR LARGE ESTABLISHMENT
SMALL ESTABLISHMENT
TOTAL EMPLOYEMENT
2005 21.0 9.9 30.9
2006 21.3 10.3 31.6
2007 21.4 10.3 31.7
2008 24.9 11.1 36.0
2009 23.6 12.1 35.7
2010 24.4 12.9 37.3
2011 25.1 12.7 37.8
2012 25.2 13.2 38.4
2013 25.2 14.4 39.6
2014 25.7 13.3 39.0
2015* 26 13.9 39.9
2016* 26.8 14 40.8
2017** 26.8 14.8 41.6
Source: Statistics Mauritius * Revised ** Provisional
According to the World Travel and Tourism Council 20184, the tourism sector directly supported
41600 jobs in 2017 and this is expected to rise to 51000 jobs in 2028. Furthermore, the report
highlighted that the total contribution of the Travel and Tourism to employment, including jobs
indirectly supported by the industry was 131000 in 2017 and this is expected to rise to 156000 in
2028.
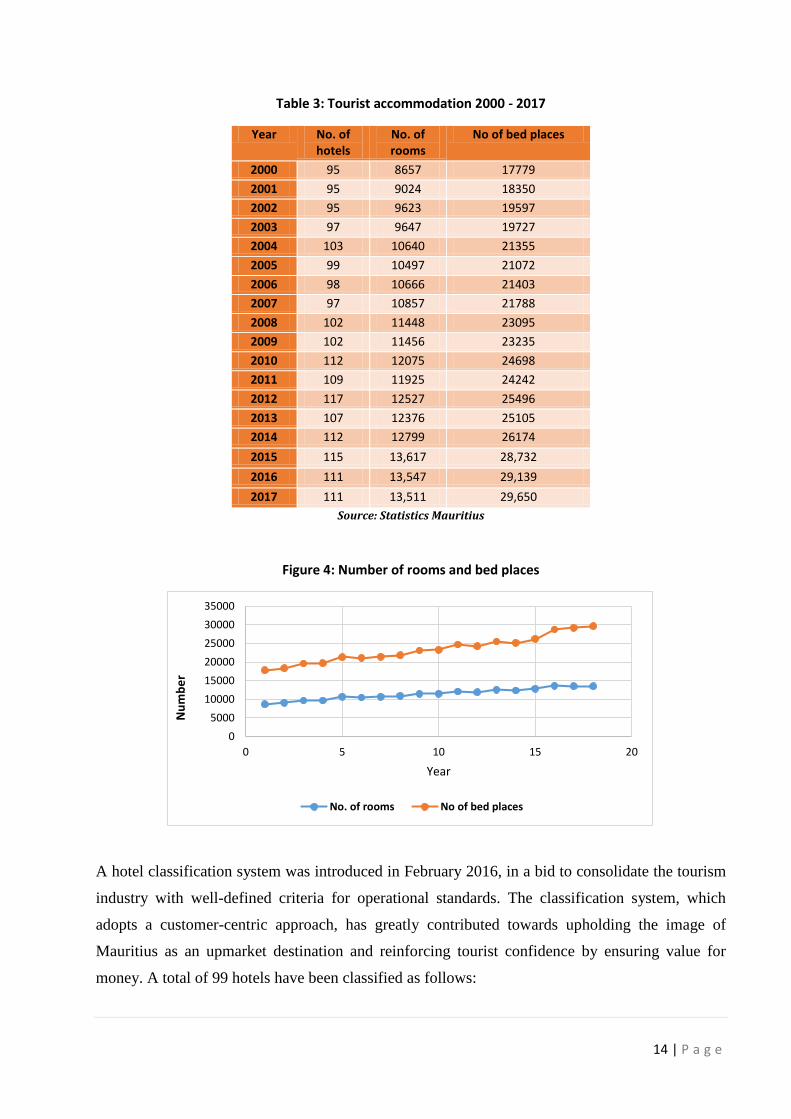
1.6.4 NUMBER OF HOTELS, ROOMS AND BED PLACES
Looking at the rise in tourist arrival figures for the past 15 years, it can be deduced that this growth
has been accompanied by an increase in tourism accommodation. Thus, to be able to accommodate
the visitors the number of hotel has kept on growing. Table 3 gives a better illustration of this growth
from 2000 to 2017 in terms of accommodation.
4 World Travel and Tourism Council 2018, Travel and Tourism Economic Impact 2018 Mauritius Report
14 | P a g e
Table 3: Tourist accommodation 2000 - 2017
Year No. of hotels
No. of rooms
No of bed places
2000 95 8657 17779
2001 95 9024 18350
2002 95 9623 19597
2003 97 9647 19727
2004 103 10640 21355
2005 99 10497 21072
2006 98 10666 21403
2007 97 10857 21788
2008 102 11448 23095
2009 102 11456 23235
2010 112 12075 24698
2011 109 11925 24242
2012 117 12527 25496
2013 107 12376 25105
2014 112 12799 26174
2015 115 13,617 28,732
2016 111 13,547 29,139
2017 111 13,511 29,650
Source: Statistics Mauritius
Figure 4: Number of rooms and bed places
A hotel classification system was introduced in February 2016, in a bid to consolidate the tourism
industry with well-defined criteria for operational standards. The classification system, which
adopts a customer-centric approach, has greatly contributed towards upholding the image of
Mauritius as an upmarket destination and reinforcing tourist confidence by ensuring value for
money. A total of 99 hotels have been classified as follows:
0
5000
10000
15000
20000
25000
30000
35000
0 5 10 15 20
Nu
mb
er
Year
No. of rooms No of bed places

15 | P a g e
Table 4: Hotel Classifications
Star Category Number of Hotels
Five Star Luxury 7
Five Star 25
Four Star Superior 3
Four Star 23
Three Star Superior 7
Three Star 25
Two Star 9
Source: Ministry of Tourism, Mauritius
1.6.5 FUTURE TOURIST ARRIVALS
The past ten years has seen a constant rise in the number of tourist visiting Mauritius, with the
exception of 2009 due to the world economic crisis. In 2018, it is expected that 1410000 tourists
will visit Mauritius and by 2020, the number of tourist visits is expected to grow to 1,625000 as
depicted in Error! Reference source not found..
Table 5: Tourist arrivals 2006-2021
Year Number of tourists
2006 788,276
Figure 5: Tourist arrivals
2007 906,971 2008 930,456 2009 871,356 2010 934,827 2011 964,642 2012 965,441 2013 992,503 2014 1038334 2015 1151252 20161 1275227 20171 1341860 20182 1410000
20192 1515000
20202 1575000
20212 1625000 1 Revised 2 Forecasts
Sources: Statistics Mauritius, Ministry of Finance and Economic Development, PricewaterhouseCoopers LLP, Wilkofsky Gruen
Associates
0
200,000
400,000
600,000
800,000
1,000,000
1,200,000
1,400,000
1,600,000
1,800,000
2,000,000
2005 2010 2015 2020 2025

16 | P a g e
1.6.6 TOURISM EARNINGS & EXPENDITURE
One of the most important gain from the tourism industry is its earnings. The past decade has seen,
with the exception of 2013, an increase in the earnings from the tourism sector. This trend is
expected to continue with earnings of Rs 60.3 billion for 2017 and expected earnings of 64 billion
for the year 2018 as presented in Table 6.
Table 6: Tourism Earnings
2009 2010 2011 2012 2013 2014 2015 1 2016 2017* 2018**
Tourism Earnings* (Rs million)
35,7 39,5 42,7 44,4 40,5 44,3 50,2 55.8 60.3 64
* Gross tourism earnings are estimated from banking records.
1 Effective January 2015, gross tourism earnings are estimated from banking records as well as returns submitted by Money-changers and Foreign exchange dealers.
* Revised ** Forecast
Source: Economic and Social Indicators (1st semester 2018) Statistics Mauritius
The average expenditure per tourist increased to around Rs 44,900 in 2017 from around Rs 43,800
in 2016. During the 1st semester of 2017, it was noted that tourists from Russia were the highest
spenders followed by those from Switzerland, UK, China and the US5. Some 60 percent of total
expenditure was on accommodation, 12 percent on food and beverages, 9 percent on shopping, 7
percent on sightseeing and 4 percent on entertainment and recreation. The trend of tourists spending
is presented in Error! Reference source not found..
Figure 6: Average Expenditure per tourist
Source: Budget Supplement 2018-2019
5 Statistics Mauritius, Survey of Inbound Tourism

17 | P a g e
Figure 7: Tourist arrivals and earnings (forecast)
Source: Three Year Strategic Plan, Budget 2018/19
1.7 FUTURE OF THE TOURISM INDUSTRY IN MAURITIUS
The tourism industry has not been spared from the effect of globalization of the world economy.
There is an inevitable paradigm shift occurring in the tourism industry in the world. A new breed
of sophisticated and highly demanding tourists are driving industry changes. Digitalization of the
sector is opening up an astonishing array of travel and vacation options for the new tourists. Even
destinations that have performed extremely well in the past are radically re-thinking their
development and strategy. With the different and huge development happening in the sector and as
Mauritius builds on the good performance of the tourism sector during the past years, the
government came up with different initiatives to sustain and further develop the sector in other
avenues. The main idea is to develop new markets, which include penetrating new countries and
new client profiles.
1.7.1 CRUISES SECTOR
The cruise sector is one where major changes are happening and it has taken a giant leap in its
development in the recent years. Therefore, special attention to the development of cruise traffic
and cruise linked activities in Mauritius has been taken to promote the sector. One of the initiative
is the construction of a cruise terminal. The benefits that our economy will reap from a fully
dedicated cruise terminal are significant, especially for our tourism and port industries, with
enormous multiplier effects. This will also add to more job creations in this field.
Today, beside our traditional tourist market, we are welcoming tourists from practically all countries
of the world. This has been possible through a better transport connection whether air or sea. This
change has been experienced during the past decade as a growing number of cruise vessels have

18 | P a g e
chosen Port Louis harbour as a port of call. Mauritius is regularly being scheduled on the circuit of
world renowned cruise ships such as Queen Mary and Queen Elizabeth. A new terminal is now
operational which offer quality services to all cruise passengers. Thus, this has led to the accelerated
development of the cruise sector in Mauritius and the development of the cruise sector has been
enormous as this has brought revenues to the country.
Statistics Mauritius started separating the tourists’ arrival figures by air and sea in 1997. Since then,
the number of cruise passengers visiting Mauritius has been showing an up and down trend year on
year off with a fluctuated number of cruise ships calling to the island, as shown in
Table 7.
Table 7: Tourist arrivals by sea and air
Year Sea Air Total 2009 23,265 848,091 871,356 2010* 23,648 911,179 934,827 2011 25,047 939,595 964,642 2012 16,930 948,511 965,441 2013 12,815 979,688 992,503 2014 3,336 1,034,998 1,038,334 2015 19,425 1,131,827 1,151,252 2016 28,365 1,246,862 1,275,227
2017** 29,565 1,312,295 1,341,860 *As from 2010, a new methodology for computation of tourist nights is being used. "Tourist nights" for year Y refer to nights spent by tourists departing in year Y. ** Provisional
In 2017, 30 cruise ships arrived in the country and carried some 45,914 cruise travelers which
included 29,565 tourists, 7,188 excursionists, 662 Mauritian residents and 15,381 crew members
(Statistics Mauritius). With the development and expansion of the cruise sector, more and more
Mauritians are now being employed in cruise ships. We have experienced the emergence of many
cruise recruitment agencies in the past years with the number of Mauritians being employed by big
cruise ship liners via the local cruise recruitment agencies has increased considerably over the past
few years.
However, this development has not been solely beneficial to the sector as this has affected skills for
the tourism sector. With the development of the cruise sector, this has led to the opening of
employment opportunities for Mauritians in cruise ships. More and more cruise companies are
recruiting Mauritians who are renowned for their skills to work in cruise ships. With the

19 | P a g e
attractiveness of the cruise ships and the pay package being offered, Mauritians already working in
the hotel sector are moving to cruise ships. This is putting an enormous pressure on the hotel sector
in terms of skills availability as many hotel operators are claiming in different forum that the cruise
sector is depleting the local skills in certain trades.
There exist many reasons why Mauritians are being recruited by international cruise liners. The
reasons are the ability of Mauritians to adapt easily to any environment or to people from different
countries. Mauritians are renowned for their capabilities to communicate in different languages. A
hardworking reputation and its legendary smile and innate hospitality make the Mauritian people a
very attractive workforce for the cruise industry. Therefore, cruise ships are recruiting massively
and hence depleting employees from the hotels. This is mainly the case for certain trades like waiter,
bartender, cook and housekeeper, amongst others.
20 | P a g e
1.8 EDUCATION AND SKILLS LANDSCAPE
1.8.1 THE GLOBAL EDUCATION AND SKILLS LANDSCAPE
Education has been identified as an important determinant of economic growth. Higher levels of
educational attainment lead to a more skilled and productive workforce, producing more efficiently
a higher standard of goods and services, which in turn forms the basis for faster economic
development. The OECD G20 training strategy prioritized education, lifelong learning, job training
and skills development strategies linked to growth strategies (ILO, 2011). After wide consultations
with stakeholders and the examination of the body of knowledge, the critical elements which
emerged were:
Broad availability of quality education as a foundation for future training which implies that
education for all and children in school and not at work, is an essential foundation of future
training.
Continuous workplace training and lifelong learning enable workers and enterprises to
adjust to an increasingly rapid pace of change.
Building solid bridges between the world-of-work and training providers in order to match
skills provision to the needs of enterprises. This is often done best at the sectoral level where
the direct participation of employers and workers together with government and training
providers can ensure the relevance of training.
Anticipating and building competencies for future needs. Sustained dialogue between
employers and trainers, coordination across government institutions, labour market
information, employment services and performance reviews are steps to an early
identification of skill needs.
Tourism education, as a major platform for human capital development for the tourism industry has
a very close relationship with the economic development of the tourism industry (Ladkin, 2005).
However, despite rapid growth in the past 40 years, tourism higher education still faces uncertainties
in terms of the content and nature of tourism degrees and this restricts employment opportunities
for tourism graduates (Dale and Robinson, 2001).
In some countries, there is a lack of provision of Travel and Tourism courses from education
institutions. This is often due to a lack of qualified tourism educators. Where Travel and Tourism
courses are offered, the curricula can be poorly designed and outdated. There often needs to be a

21 | P a g e
greater balance between theory and practice, a change from a traditional teaching mode to a more
modernised, international, innovative, and interactive teaching mode, and in general greater
responsiveness to and alignment with the sector’s needs.
1.8.2 THE LOCAL EDUCATION AND SKILLS LANDSCAPE
Education is one of the key growth enablers of socio-economic development. Government spending
on education has averaged 3.4 percent of GDP during the past few years. In 2016, nine out of every
ten children aged between 11 and 17 years were enrolled in general and pre-vocational secondary
education. Around 15 percent of a cohort sitting for the Certificate of Primary Education
examination did not reach the required level to pursue general secondary education and were
channelled to a pre-vocational programme. Of these, one quarter would not make it to the end of
the programme. Children’s inability to acquire the minimum level of education explains the
widening literacy gap between the better educated and the rest of the population which results in
unskilled and low skilled labour, unemployment and rising inequality.
In 2016, out of 3602 students examined at SC level in Travel and Tourism, 2588 passed with a
credit as grading (1 – 6). Table 8 provides the detailed information on the results.
Table 8: SC Results in Travel & Tourism by gender, 2016
Cambridge School Certificate 2016 Performance in Travel & Tourism
Total Examined Pass Rate
Boys 1381 851
100% 61.62%
Girls 2221 1737
100% 78.21%
Total 3602 2588
100% 71.85%
At HSC level, 911 students passed (including both principal and subsidiary level), out of a total of
1136 students examined. Table 9 provides the detailed information on the results.

22 | P a g e
Table 9: HSC results 2016 by grade achieved, Travel & Tourism
Cambridge HSC/GCE 'A' Level 2016 Grade Distribution and % Pass – Travel & Tourism
Grade Achieved Total Examined
Principal Pass
Subsidiary Pass A+ A B C D E U b c d e
Number 18 124 306 337 225 15 111 1136 785 126
Percentage 1.58 10.9 26.9 29.7 19.8 1.3 9.8 100 69.1 11.9
Enrolment at Tertiary Level
As at December 2016, there were ten publicly-funded institutions operating in Mauritius. These
included four public universities, namely, the University of Mauritius (UoM), University of
Technology, Mauritius (UTM), Open University of Mauritius (OU) and Université des
Mascareignes (UdM). The other publicly-funded institutions were the Mauritius Institute of
Education (MIE), Mahatma Gandhi Institute (MGI), Rabindranath Tagore Institute (RTI), Fashion
and Design Institute (FDI), Mauritius Institute of Training and Development (MITD) and Mauritius
Institute of Health (MIH). In addition to the publicly-funded institutions, there are 54 private
institutions registered locally and out of these 54 private institutions, 37 were fully operational.
The Tertiary Education Commission (TEC) publishes on a yearly basis the report entitled
‘Participation in Tertiary Education’ where statistics on enrolment at private and public tertiary
level institutions are provided as per field of studies, as shown in Table 10.
Table 10: Enrolment as per field of studies 2016
Field of studies Number enrolled Percentage of enrollment
Accounting 10,912 22.7%
Administration/Management 6,117 12.7%
Information Technology 3,866 8.0%
Engineering 3,550 7.4%
Banking/Finance 2,424 5.0%
Medicine 2,537 5.3%
Education 2,544 5.3%
Law 1,856 3.9%
Business/ Commerce/ Marketing 1,968 4.1%

23 | P a g e
Languages 1,422 3.0%
Travel/Hotel/ Tourism 1,460 3.0%
Science 968 2.0%
Source: (TEC, 2017)
New admissions for year 2016 have been presented at Table 11. It can be observed that 4.6 percent
of all students enrolled, studied Travel & Tourism and related courses in 2016.
Table 11: New admissions on taught programmes as at December 2016
Institutions All courses Travel & Tourism
related courses
Publicly funded institutions 7,315 324
Private institutions 4,250 174
Overseas 2,604 158
TOTAL 14,169 656
Source: Participation in Tertiary Education (2017), TEC, 2017
Among the key goals of the country’s vision towards 2030 is to ensure inclusive and equitable
quality education whilst promoting lifelong learning opportunities for all. All learners should be
equipped with knowledge, skills and right attitudes for future learning, their personal development
and well-being as well as future employment. Improvement of teacher quality and the enhancement
of innovative learning environments will accelerate the acquisition of deep skills to face the 21st
century challenges.
Further, to position Mauritius as an education hub, higher learning opportunities will need be
expanded, alongside a renewed focus on research and innovation. By 2030, all students will
complete secondary education either with “generic” skills or “technical” skills. The tertiary
enrolment rate, which was 47.4 percent in 2015, is targeted to increase to 50 percent by 2020 and
60 percent by 2030 (Three-Year Strategic Plan 2017/18 – 2019/20).
Education being the key ingredient for economic development, the sector is being called upon to
emerge as a strong pillar of the economy in the future. It accordingly requires profound and
transformative changes with innovation, entrepreneurship and competitiveness being central to that
change. The strategic decisions announced in the Three Year Strategic Plan 2017/18-2019/20 by
the government for the education sector are as follows:

24 | P a g e
Rolling out the Nine Year Continuous Basic Education Reform: The focus will be on
quality basic education for the consolidation of foundational skills and holistic development
of learners, thus preparing them for upper secondary schooling.
Introducing E-learning platforms that will serve as a powerful lever to accelerate and
enhance student learning with the acquisition of higher-order skills. In addition, E-learning
reduces reliance upon private tuition. Digital learning contents will enable students to study
at their own pace after school hours.
Developing a Special Education Needs (SEN) Strategy with the aim to achieve full
inclusion of all learners, irrespective of their disabilities, by creating and providing a
disability-friendly environment commensurate with their specific needs.
Rebranding TVET: A TVET Strategy will be
developed to focus on implementation of a new
framework for TVET with focus on review of
training programmes and strengthening of
capacity building. This will benefit the sector as
the majority of employees in the sector have TVET
as qualifications.
Strengthening Higher Education: The shift from
middle to high income economic status of
Mauritius will necessitate transformative changes in the higher education sector. The
diversity of offerings, both programmatic and institutional will necessitate a properly
regulated higher education system with strong emphasis on quality and relevance.
Polytechnic Education will provide a new and attractive pathway for the development of
advanced technical skills as well as training at the middle-management level. The
involvement of industry in programmatic conceptualization and delivery will guarantee
relevance and employability.
25 | P a g e
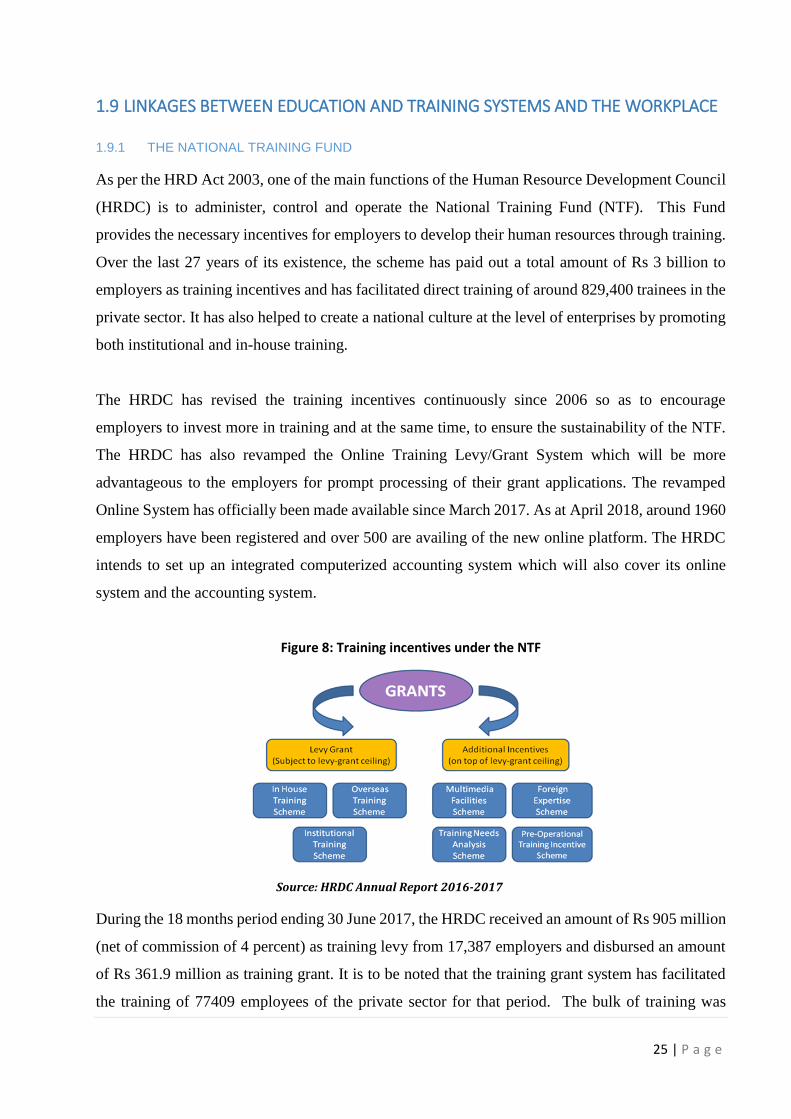
1.9 LINKAGES BETWEEN EDUCATION AND TRAINING SYSTEMS AND THE WORKPLACE
1.9.1 THE NATIONAL TRAINING FUND
As per the HRD Act 2003, one of the main functions of the Human Resource Development Council
(HRDC) is to administer, control and operate the National Training Fund (NTF). This Fund
provides the necessary incentives for employers to develop their human resources through training.
Over the last 27 years of its existence, the scheme has paid out a total amount of Rs 3 billion to
employers as training incentives and has facilitated direct training of around 829,400 trainees in the
private sector. It has also helped to create a national culture at the level of enterprises by promoting
both institutional and in-house training.
The HRDC has revised the training incentives continuously since 2006 so as to encourage
employers to invest more in training and at the same time, to ensure the sustainability of the NTF.
The HRDC has also revamped the Online Training Levy/Grant System which will be more
advantageous to the employers for prompt processing of their grant applications. The revamped
Online System has officially been made available since March 2017. As at April 2018, around 1960
employers have been registered and over 500 are availing of the new online platform. The HRDC
intends to set up an integrated computerized accounting system which will also cover its online
system and the accounting system.
Figure 8: Training incentives under the NTF
Source: HRDC Annual Report 2016-2017
During the 18 months period ending 30 June 2017, the HRDC received an amount of Rs 905 million
(net of commission of 4 percent) as training levy from 17,387 employers and disbursed an amount
of Rs 361.9 million as training grant. It is to be noted that the training grant system has facilitated
the training of 77409 employees of the private sector for that period. The bulk of training was

26 | P a g e
conducted through the institutional training (55 percent), in-house training (35 percent), and
overseas training (7 percent). However, refund to training institutions and employers under the
other incentives schemes namely Multimedia Facilities Scheme, TNA Scheme and Foreign
Expertise Scheme represented 3 percent of total grant refund. It is to be noted that the HRDC did
not disburse any refund under the POTI Scheme despite that Council of the HRDC had extended
the said Scheme to other sectors as per the list of the Business Mauritius in the financial year 2014.
On average, 45,000 trainees have benefited yearly under the training incentive schemes as from
2006. As per statistics, five main sectors of the economy namely: Financial Services; Wholesale
and Retail; Manufacturing sector; Community, Social and Personal Services and Hotel and Tourism
have been making maximum use of the Training Grant System, as shown in Figure 9. Out of a total
of Rs 351 million disbursed for the period Jan 2016-Jun 2017, Rs 37 million was for the tourism
sector, representing 11 percent of the total number of trainees (HRDC Annual report 2016- 2017).
Figure 9: Analysis of grant disbursement by economic sectors for 18 months to 30 June 2017
Apart from the Levy Grant scheme, the HRDC has formulated and manages a number of other skills
development initiatives and programmes for enterprises of the private sector. The HRDC regularly
works in concertation with stakeholders to come up with tools to better suit the needs of the industry.
One such programme is the Sectoral Skills Development Scheme (SSDS).

27 | P a g e
1.9.2 SECTORAL SKILLS DEVELOPMENT SCHEME (SSDS)
The SSDS has been developed to assist group of employers from the same sector or sub-sector to
initiate skills development proposals which are validated and submitted by their industry
associations. A co-funding philosophy is adopted (cash or in kind), where the HRDC may provide
funding up to 80 percent of the total amount disbursed on skill development. This scheme is over
and above whatever the employer may already be benefitting through Levy Grant Schemes and is
not subject to that ceiling. As at date, there has been no projects approved under the SSDS for the
tourism sector.
1.9.3 NATIONAL SKILLS DEVELOPMENT PROGRAMME (NSDP)
Skills development for the youths plays an important role in the transition from school to work.
Realizing the importance of the linkage, the
Government of Mauritius initiated the National
Skills Development Programme (NSDP) to train
unemployed youth in high demand areas. In the
Budget Speech 2016/2017, government
announced the measure that “Government will
enlist 4,000 persons under the National Skills
Development Programme for training in
technical skills that are in high demand. This will
include training for 1,000 young people in each of
the following sectors: ICT, tourism and
hospitality; nursing and paramedics and construction and other industries.”
Since the start of the NSDP, for the Tourism sector, approval has been granted for a total number
of 1996 trainees as at June 2018, out of which 537 have already completed training, 335 are still in
training while the rest is about to start training in due course. As at June 2018, a total number of
133 courses has been completed under the NSDP scheme, as shown in Figure 9, where most of the
courses were from the ICT and Tourism sector.

28 | P a g e
Figure 9: Programmes approved (n=133)
Table 12 shows the training programmes which were approved under the NSDP for the tourism
sector as at June 2018.
Table 12: Approved training programmes under NSDP
Course title No of trainees
approved
Barman 48
Cook-Food production 48
Waiter 48
Housekeeping 98
Front office 32
F&B 50
Bar Operations 36
Food production 72
Front Office Operations 48
Restaurant Services 132
Housekeeping Operations 72
Serveur sur Mesure Training Programme 20
Hotel Housekeeping Technique for Attitude Resort 44
Restaurant and Bar Services for Attitude Resort 80
Culinary Skills and Techniques 40
Kitchen Operations 230
Restaurant and Bar Service 2 50
41 43
13
4 6 5 41 3 4 3 1
5
05
101520253035404550
Un
its

29 | P a g e
Housekeeping Attendant Course 80
Food and Beverage Service Attendant Course 40
Original Italian Cuisine Course: Basic Level 48
Principles of hospitality and service training programme 84
Hotel Housekeeping Technique 20
Culinary Skills 20
Restaurant and bar services techniques 20
Food and beverage services 25
Food & Beverage Attendant Course 40
Restaurant & Bar Service 50
Introductory course in Food Production for the Hospitality sector 20
Introductory course in Restaurant and Bar Service for the Hospitality
sector
20
TOTAL 1615
1.9.4 GRADUATE TRAINING FOR EMPLOYMENT SCHEME (GTES)
The issue of graduate unemployment is a complex one as tackling this issue is more than just
offering employment to graduates. HRDC has come up with the GTES to try to complement the
issue of skills need for graduates through a series of measures. The main objective of GTES is to
enhance the employability prospects of unemployed graduates by providing them with skills as per
the requirements of an evolving job market. Such initiative has as objective to up-skill or reskill
existing unemployed graduates, thus improving their chances of getting a job. Only one course
(ARHIM Graduate Innovative Learning - AGILE) has been approved under this scheme for the
tourism sector as at April 2018, which has benefited a total number of 17 graduates.
1.9.5 YOUTH EMPLOYMENT PROGRAMME (YEP)
The integration of youth into the labour market has always been one of the biggest challenges facing
an economy. Without experience, youth are unable to penetrate the labour market and are more
likely to be caught in the “no job-no experience and no experience-no job” cycle. To be able to
tackle this phenomenon affecting many countries, the YEP was initiated with the objective to
promote work placement and training for the youth aged between 16 and 35 years. This measure is
implemented by the Ministry of Labour, Employment and Industrial Relations. Since October 2015,
the YEP has been extended to the public sector. According to the YEP Secretariat, there is a total
number of 24,710 (10,795 males and 13,915 females) youth registered with YEP as at 31 July 2017.

30 | P a g e
1.9.6 SECTORAL COMMITTEE FOR THE TOURISM SECTOR
As per Section 11 (1) and (2) of the HRD Act 2003, the HRDC established a Sectoral Committee
for the tourism sector. Under the Sectoral Committee, various projects have been undertaken for the
tourism and hospitality sector. The Sectoral Committee comprises of people from the industry and
projects which emanates from the Sectoral Committee are mostly for the development of HRD for
the sector. The roles and functions of the Committee are as follows:
serve as liaison between the Council of the HRDC and its sector;
advise the Council on emerging economic trends and relevant training needs in the sector;
assist in identifying and forecasting skills needs for the sector;
assist in the mounting and implementation of skills development projects in the sector;
assist in assessing the relevance of skills development projects for the sector and make
appropriate recommendations to Council ; and
advise on policies and strategies for skills development for the sector.
1.10 STRATEGY LANDSCAPE FOR THE DEVELOPMENT OF THE TOURISM SECTOR
1.10.1 ECONOMIC VISION 2030
The Economic Vision 2030 of the Government of Mauritius aims to jumpstart a new phase of high
growth with shared prosperity and enhanced quality of life, ultimately transforming Mauritius into
an inclusive, high-income country by 2030. This Vision 2030 Development Model has identified
growth sectors that have the potential to accelerate growth. As such, growth enablers have also been
identified with accompanying strategies to develop a range of Mauritian industries with the aim to
improve the productivity of the growth sectors and to enhance the capacity to compete on an
international scale. To keep development of these growth sectors and enablers on track, the Three-
Year Strategic Plan has been prepared to provide short to medium term strategic directions and
targets against which progress can be evaluated.
To further develop the sector, the government has taken the following strategic decisions:
Broadening the tourist base: Open Skies agreements will be negotiated to increase flight
routes and tap into the rising middle-income group in Asia. The SSR International Airport
will be developed into a major regional logistics and aviation hub. For this purpose, major
work will be undertaken at the SSR International Airport to cater for increases in both
passenger and cargo traffic. The passenger terminal handling capacity will be increased to
4.5 million by 2020 with the refurbishment of the old passenger terminal and to 6 million in
2030 with an extension of a new terminal.

31 | P a g e
Promoting local products and handicrafts: Linkages between small enterprises in the
handicraft sector and the tourism sector will be reinforced to provide an outlet for local
artisans to sell their products and to promote authentic Mauritian products.
Upholding quality of services: Front-liners will be equipped with the right skills and
attitude to be the brand ambassadors of Mauritius.
Enhancing quality assurance of service delivery: A quality label, similar to the Hotel
Classification System, will be developed for non-hotel accommodations. In addition, all tour
operators will be regulated to ensure high service standard and customer safety.
Diversifying the tourism product: The range of tourism activities will be expanded to
include:
Adventure sports such as bike trails and marked hiking trails;
Cruise tourism;
Cultural tourism and cultural themed discovery tours, with rehabilitation or
construction of museums, galleries and historical monuments;
Events such as International Chef Competition and Rugby-10 Tournament,
especially during low tourist season;
Medical tourism; and
Yacht tourism through the creation of marinas.
Adopting eco-friendly infrastructure: The tourism sector will mainstream eco-friendly
practices such as the adoption of energy-saving technology, renewable energy and rain-
water harvesting.
Figure 10: Tourism sector strategic plan
Source: Three Year Strategic Plan, Budget 2018/19

32 | P a g e
By diversifying the tourist base and tourism product portfolio through economic diplomacy to
establish more flight routes and increase the country’s connectivity, the tourism sector will be able
to enjoy sustained growth, both in terms of visitor arrivals and earnings. The goal is to enhance the
reputation of Mauritius as a leading island destination. At the same time, tourism products will be
diversified to expand the range of our offerings to complement our pristine natural assets such as
beaches and coral reefs.
1.10.2 HOSPITALITY AND PROPERTY DEVELOPMENT
Mauritius has successfully positioned itself on the international scene as a renowned up-market
tourist destination. The Property Development Scheme (PDS) is attracting investment from abroad
by allowing non-citizens to acquire residential properties under the PDS. Letter of approvals or
certificates issued to companies to develop an IRS or RES project will continue to remain in force.
Non-citizens acquiring immovable property under IRS or RES, for more than USD 500,000 or its
equivalent, will still be eligible to apply for a residence permit. The Property Development Scheme
will offer numerous high-return investment opportunities.
Mauritius enjoys a tropical climate and boasts a hospitable multi-cultural population and is known
for its clean environment and pristine coastline. Investment in tourism in Mauritius is boosted by
an excellent range of supporting infrastructure including a well-established network of roads, an
efficient seaport and a modern international airport. Current opportunities include:
Hotel Development
Invest Hotel Scheme
Marinas
Leisure/Amusement Parks
Health Tourism
Heritage Tourism
Green Tourism
1.10.3 BUDGET SPEECH 2018/2019
Some of the measures announced in the Budget Speech 2018/2019 to further strengthen the
dynamism of our tourism industry are as follows:
33 | P a g e
First, the coming of KLM Royal Dutch Airlines in Mauritius will further open up air access
not only to the Netherlands but also to neighboring regions namely, Germany, Scandinavian
countries and Eastern Europe. This will further diversify markets in Europe.
Second, the Asia-Africa air corridor initiative is now fully embedded in the Mauritian air
access policy. It has given positive results in terms of Asia connection. To maintain that
dynamism and meet rising demand, Air Mauritius will operate an additional weekly flight
to Singapore.
Third, concerning Africa connection, the Mauritius Tourism Promotion Authority will
promote the twin destinations offer of Bush & Beach Tourism of Kenya and Mauritius.
Fourth, Government will give a voucher that will entitle a tourist to a Rs 200 discount on a
minimum purchase of Rs 1,000 of Mauritian handicraft products. This should increase
expenditure per tourist while at the same time giving a boost to Mauritian handicraft.
Fifth, to attract more Asian tourists, hotels will be allowed to host gaming machines within
their premises, subject to access being restricted to non-residents and foreigners only and
against payment of the appropriate license fee and betting tax.
Sixth, in the same spirit of attracting more visitors, a noncitizen acquiring a residential
property for an amount below USD 500 000 will be entitled to a Multi-Entry Visa for a
maximum of 180 days per year for a consecutive period of 5 years and renewable every 5
years depending on the status of ownership.
SKILLS ISSUES: AN INTERNATIONAL PERSPECTIVE
According to the Global Talent Trends and Issues for the Travel and Tourism Sector 20156, the
rapid pace and extent of change in global and national markets for talent will be significant across
economies as a whole and specifically for Travel and Tourism sector. The market for Travel and
Tourism talent is already challenged with high staff turnover and competition with other industry
sectors for the best people. In some cases, adverse supply trends such as declining demographics,
new regulations and new technology are threatening the labour supply for the sector. There has been
a global shift in terms of customer service preferences and changing visitor markets and these have
led to changes in the skills of required labour for the sector. All these require a new brand of skills
for the sector to develop and prosper. The sector need new talents.
6 Global Talent Trends and Issues for the Travel and Tourism Sector 2015, World Travel and Tourism Council

34 | P a g e
Planning for and meeting future talent demand in Travel and Tourism sector is going to require all
stakeholders including the government to implement and promote proactive and careful talent
supply management policies and together with education and training, develop stronger and more
coordinated talent efforts. A flourishing Travel and Tourism sector will also require regular
monitoring and projecting of talent demand, supply and imbalances to predict in advance any
looming shortages.
Although there are many talent commonalities facing the Travel and Tourism sector globally, the
talent required is far from uniform across countries in terms of demand and supply. There is huge
diversity across countries in terms of the general development and maturity of Travel and Tourism.
So an understanding of the talent picture for different countries is vital as a ‘one-size fits all’ will
be incorrect and ineffective.
Understanding the sector’s outlook, issues and scope will be crucial if Travel and Tourism is to
realise its growth potential over the next decade. The Global Talent Trends and Issues for the Travel
and Tourism Sector 2015 looked into these issues and it concerned 46 countries. The countries are
geographically diverse, encompass all of the world’s major economies and include countries such
as Barbados, Morocco and Thailand where Travel and Tourism is a particularly important sector.
The 46 countries account for 81 percent and 88 percent of direct world Travel and Tourism
employment and GDP respectively.
Impacts of talent imbalances
One aspect which was highlighted and which has an important bearing on the industry is impacts
of Travel and Tourism talent gaps and deficiencies. This issue was emphasized through the current
and potential future jobs for the sector and consequently creating imbalances in talents for the sector.
For example, it was seen that the main effects of talent shortages on Travel and Tourism businesses
in the UK have been an increase in the workload of other staff and leading difficulties to meet
customer service objectives.
Skill shortages have also caused significant numbers of tourism establishments not able to meet
quality standards. Increasing operating costs and losing business to competitors were also
commonly mentioned by tourism establishments as negative impacts of skill shortages. The impact
of difficulties in recruiting is causing lower morale and less creativity among the existing workforce.
35 | P a g e
The tourism sector in Europe
Tourism is a major economic activity in the European Union with wide-ranging impact on economic
growth, employment, and social development. It has the capacity to be a powerful tool to fight
economic decline and unemployment. However, being the fact that this sector is very dynamic, the
tourism sector faces a series of challenges. The European Commission has been working on ways
to address the challenges which the sector is facing. The main challenges for the sector in Europe
nowadays are:
Security and safety - environmental, political, and social security
Economic competitiveness - seasonality, regulatory and administrative burdens
Employment - difficulty of finding and keeping skilled staff
Technological – keeping up to date with advances in technologies and IT developments
caused by the globalisation of information. (IT tools for booking holidays, social media
providing advice on tourism services, etc.)
Markets and competition - growing demand for customised and new products and also
growing competition from other EU and non-EU destinations.
In this vein, the European Commission has come up with few policies and actions. The EU policy
aims to maintain Europe's standing as a leading tourist destination while maximising the industry's
contribution to growth and employment. It also promotes cooperation between EU countries,
particularly through the exchange of good practices. The EU's competence in the tourism sector is
one of support and coordination the actions of member countries. Few of the EU proposed policies
are:
Enhancing on the products that European tourism sector has to offer, that is to work on a
number of initiatives to diversify and improve the range of tourism products and services
such as sustainable tourism, accessible tourism, tourism for seniors and tackling low-season
tourism.
Enhancing existing and expanding new tourism in Europe - Supporting tourism businesses
to maintain Europe’s position as a leading tourist destination. The quality of its services
needs to be continuously improved. The European Commission is involved in initiatives that
improve the mobility and skills of workers, particularly for IT skills, and help tourism
entrepreneurs to manage their businesses.
Promoting destination Europe - To enhance the visibility of Europe as a tourist destination
and increase tourism to the EU, the Commission is implementing a wide range of

36 | P a g e
communication and promotion activities. It is also taking measures to make it easier to travel
to Europe.
Regional Skills Needs – Finland and the Baltic region
The development of tourism in the Baltic Sea region and especially in Finland has become more
international even though, the region faces global competition which has to be responded to by the
destinations. Tourism already contributes significantly to the economy of the Baltic Sea region.
Growth in the tourism industry has supported the economic recovery in the region for several years.
According to Baltic Sea Tourism Forum 2015 of the European Commission, the number of
international tourist arrivals around the Baltic Sea increased significantly by almost 50 percent since
the millennium to more than 106 million in 2013. Arrivals for example from China, India and Russia
have increased at a double-digit rate. However, tourism in the Baltic Sea region will only be able to
continue its growth in the long run, if the efforts will be oriented to international markets and
marketing will be coordinated accordingly.
To support and sustain the growth of the sector, skills development and similar professional skills
enhancement programme is essential across the region. This therefore need to combine efforts to
improve skills and to promote tourism education without borders in the region in order to maintain
and to boost competitiveness of the region. According to the European Commission (2016), higher
education institutions need to ensure that they equip graduates with relevant and up-to-date skills,
because relevant skills are a pathway to employability and prosperity.
The new Skills Agenda for Europe (European Commission, 2016) aims at making better use of the
skills that are available. The plan is to equip people with the new skills that are needed, to improve
the quality and relevance of skills formation and to make skills more visible and comparable. The
definition of skill by the European Commission (2014) means the ability to apply knowledge and
know-how to complete tasks and solve problems. The term skill refers typically to the use of
methods or instruments in a particular setting and in relation to defined tasks. Skills are studied
within the tourism industry and in the context of international tourism business development. Thus,
skills refer to professional skills, that is, the graduates’ ability to apply knowledge, know-how and
methods when working in the tourism industry to meet the challenges and tasks of their professions.

37 | P a g e
The relevant skills needed and identified for Finland are classified in five categories where it
describes the relevant skills for international tourism business development for Finland. These skills
are:
Product and experience design and development;
Digital marketing communication and sales;
Collaboration and networks;
Internationalisation; and
Managing business operations.

38 | P a g e
2. METHODOLOGY
2.1 DEFINING THE SECTOR
Before delving into the methodological aspects of the study it was vital to clearly define the
Tourism, Hospitality and Recreational Activities sector for the purpose of this study. The basis for
the classification of this sector was NSIC 2007 codes 55 and 56 of Statistics Mauritius. However,
amendments were made by either omitting industrial activities not relevant to the sector or adding
others relevant to the better reflect skills and labour profile of that sector. It is worth noting that the
final classification of the sector was vetted by Statistics Mauritius. The Tourism, Hospitality and
Recreational Activities sector was therefore defined by the following two classes:
Accommodation
Short term accommodation activities
Large hotels (more than 80 rooms)
Small hotels (up to 80 rooms)
Guest house
Tourist residence
Short term accommodation activities
Camping grounds, recreational vehicle parks and trailers
Parks
Food and Beverages Service Activities
Food and beverage service activities
Restaurants and mobile food service activities
Restaurants (including liquor)
Restaurant (Excluding liquor)
Tour operator activities
Activities of tourist guides
Sport fishing
Activities for amusement parks and theme parks.
Ticket sale activities for theatrical, sports and others.
Amusement and entertainment events
Operation of excursion, cruise or sightseeing boats
Renting of pleasure boats with crew or fishing cruises.

39 | P a g e
2.2 DATA COLLECTION APPROACH
In order to meet the research aims and objectives of the study, a mixed-method approach was
adopted, with slight adjustments in line with specificity of each particular sector. This is to provide
a comprehensive and more accurate picture of skills and training for that sector.
Data were collected via two main methods, namely:
Quantitative survey of sector employers via structured questionnaire and face-to-face
interviews
Qualitative interviews via focus group discussions with sector employers and industry
associations representatives as well as individual interviews with key actors, with long years
of experience and know how in that sector were also held.
QUANTITATIVE SURVEY: SAMPLING
SAMPLING FRAME
Ideally the sampling frame should be equal to the population covered by a survey. However, this is
rarely the case in practice and the quantitative survey for Skills Studies 2016-2017 was no exception
because the frame was constructed from two different secondary data sources where each had its
own limitations. In fact, the two sampling frames used were: Statistics Mauritius database for ‘large
establishments’, that is, those employing 10 or more people; and SMEDA database of small
establishments, that is, those employing less than 10 people (to cater for ‘other than large
establishments’ category). In order to obtain a representative sample, the population of
establishments was further stratified by sector of activity and number of employees.
This study was conducted for 10 different sectors. For large establishments, all establishments
falling under any one of the 10 sectors under study were considered as population. Enterprises
classified as non-operational or dormant were excluded from the frame. Hence, after cleaning the
Statistics Mauritius sampling frame of large establishments, 3871 entries were obtained. For other
than large establishments, a sampling frame comprising 3428 entries were obtained from SMEDA.
To extract the sample, both sampling frames were merged into one main database using NSIC Level
4 and Level 5 classification as basis, ensuring that other enterprise details were aligned.
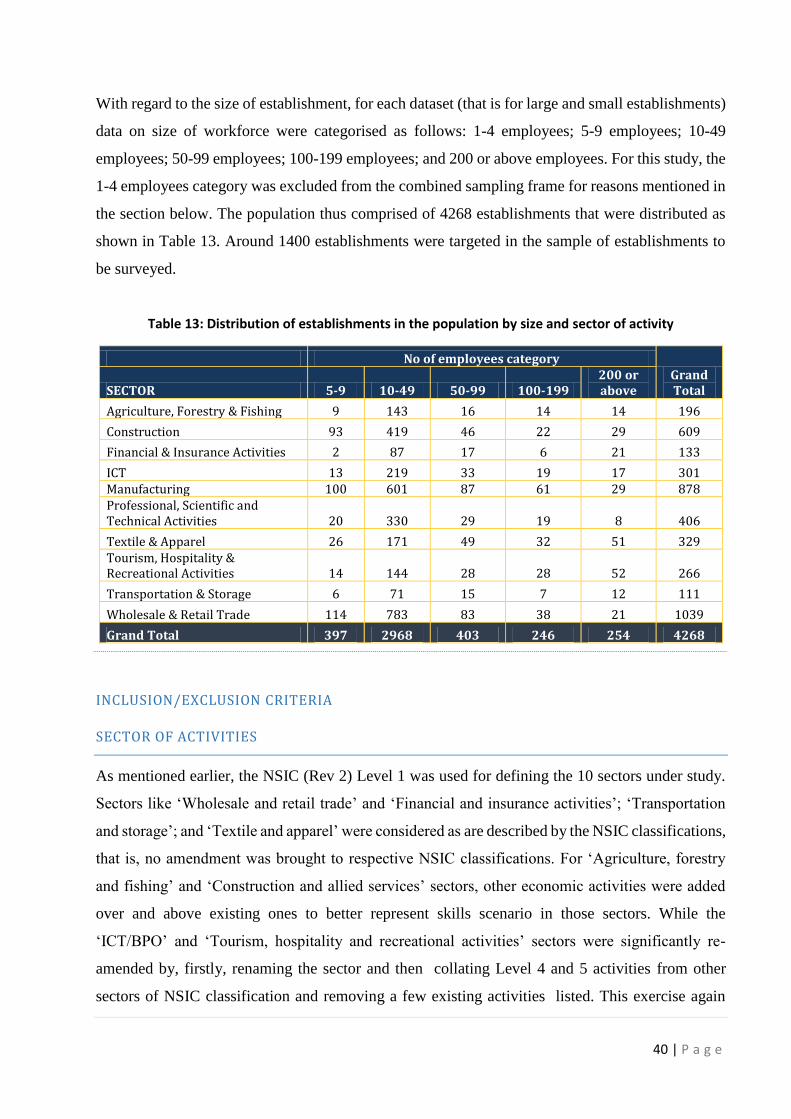
40 | P a g e
With regard to the size of establishment, for each dataset (that is for large and small establishments)
data on size of workforce were categorised as follows: 1-4 employees; 5-9 employees; 10-49
employees; 50-99 employees; 100-199 employees; and 200 or above employees. For this study, the
1-4 employees category was excluded from the combined sampling frame for reasons mentioned in
the section below. The population thus comprised of 4268 establishments that were distributed as
shown in Table 13. Around 1400 establishments were targeted in the sample of establishments to
be surveyed.
Table 13: Distribution of establishments in the population by size and sector of activity
No of employees category Grand Total SECTOR 5-9 10-49 50-99 100-199
200 or above
Agriculture, Forestry & Fishing 9 143 16 14 14 196
Construction 93 419 46 22 29 609
Financial & Insurance Activities 2 87 17 6 21 133
ICT 13 219 33 19 17 301 Manufacturing 100 601 87 61 29 878 Professional, Scientific and Technical Activities 20 330 29 19 8 406
Textile & Apparel 26 171 49 32 51 329 Tourism, Hospitality & Recreational Activities 14 144 28 28 52 266
Transportation & Storage 6 71 15 7 12 111
Wholesale & Retail Trade 114 783 83 38 21 1039
Grand Total 397 2968 403 246 254 4268
INCLUSION/EXCLUSION CRITERIA
SECTOR OF ACTIVITIES
As mentioned earlier, the NSIC (Rev 2) Level 1 was used for defining the 10 sectors under study.
Sectors like ‘Wholesale and retail trade’ and ‘Financial and insurance activities’; ‘Transportation
and storage’; and ‘Textile and apparel’ were considered as are described by the NSIC classifications,
that is, no amendment was brought to respective NSIC classifications. For ‘Agriculture, forestry
and fishing’ and ‘Construction and allied services’ sectors, other economic activities were added
over and above existing ones to better represent skills scenario in those sectors. While the
‘ICT/BPO’ and ‘Tourism, hospitality and recreational activities’ sectors were significantly re-
amended by, firstly, renaming the sector and then collating Level 4 and 5 activities from other
sectors of NSIC classification and removing a few existing activities listed. This exercise again

41 | P a g e
ensured representativeness of the skills and labour profile of those sectors (to be considered under
other sectors). The ‘Manufacturing’ sector was slightly modified with activities falling under
‘Textile and apparel’ division considered as a sector in itself and a few activities from ‘non-textile’
division, for example, those related to IT shifted to the ‘ICT/BPO’ sector. The detailed classification
of each sector is given in the annex of each respective sector report.
SIZE OF ESTABLISHMENT
From the database of SMEDA, one-man establishment represented nearly half of the total number
of establishments, that is, 47% (1595 units) and those accounting for less than 5 (including 1
employee) employees accounted for a staggering 87%. However, such small establishments are not
appropriate for surveys on skills as has been demonstrated by a number of international studies, for
example CEDEFOP Research Paper No 357. The main reasons for excluding very small
establishments (that is, those employing less than 5 employees) in the survey are as follows:
The smaller the sampled organisations, the more likely none of the pre-selected occupational
groups is present; organisations where none of the pre-selected groups is present need to be
filtered to END. This leads to enhanced screening costs.
In very small organisations, especially those employing less than 5 persons, there is often just
one employee within the selected occupational group; in such cases, it is difficult for the
respondent to answer the task and skill questions for the respective job or position without
having the individual job holder in mind. Strengths and weaknesses of individual employees
may therefore strongly influence the results in small establishments and may lead to a certain
distortion of the results.
These very small organisations, often referred as micro-enterprises, are often only poorly
covered by the available address registers and even where they are generally covered, the
address quality is usually much poorer than for the larger organisations. This is mainly due to
the considerably higher mortality and relocation rate among these smaller units. That is why it
is recommended to exclude these units, that is, those with less than 5 employees, totally by
setting a general size threshold. Otherwise, distortions of the results due to selectivity of the
entries in the address sources would have resulted.
7 User guide to developing an employer survey on skill needs. Research Paper No 35.CEDEFOP.2013

42 | P a g e
SAMPLING PROTOCOL – DETERMINING THE SAMPLE SIZE USING BLOWING UP TECHNIQUE
It can be observed that the number of establishments varies greatly across sector as well as size
category. Hence, using probability proportional to size across the sampling matrix will result in an
imbalanced establishment representation in the sample; with over-representation of small
establishment as well as over-representation of sectors like Manufacturing and Wholesale and retail
trade where the number of establishments are much higher. To counter this issue, a disproportionate
sampling method based on Neyman Allocation principle was adopted whereby at each stratum level
(that is, sector level), cells with large number of establishments were given less weight and vice
versa. Thus, in the purposely disproportionally designed samples the stratification table was not
only a simple allocation formula, but also an essential tool for controlling and steering the total
selection process. It was worth noting that there is no reference or guideline as to the choice of a
particular weight value.
Table 14 depicts the different weights or blow up factors that were applied at each stratum level for
each sector to obtain the sample. Thus the total sample size obtained was 1376 which represented
around one third of the population of establishments. Thus, for the survey, 132 enterprises were
targeted as sample for the Tourism, Hospitality & Recreational Activities.

43 | P a g e
Table 14: Distribution of establishment by sector in the sample, with respective blowing up factors and population weight adjustments
SECTOR
Workforce category
Population Sample 5-9 10-49
50-99 100-199
200 or above
Agriculture, Forestry & Fishing
0.56 0.59 0.56 0.57 0.57 0.59 115
Construction 0.25 0.25 0.26 0.27 0.24 0.25 152
Financial & Insurance Activities
1.00 0.91 0.88 0.83 0.90 0.91 121
ICT 0.46 0.44 0.45 0.42 0.47 0.45 134
Manufacturing 0.25 0.25 0.25 0.25 0.24 0.25 220
Professional, Scientific and Technical Activities
0.35 0.33 0.34 0.32 0.38 0.33 135
Textile & Apparel 0.38 0.40 0.41 0.41 0.39 0.40 132
Tourism, Hospitality & Recreational Activities
0.43 0.45 0.46 0.46 0.44 0.45 132
Transportation & Storage 0.83 0.83 0.80 0.86 0.83 0.83 92
Wholesale & Retail Trade 0.16 0.16 0.16 0.16 0.14 0.16 156
Grand Total 397 2968 403 246 254 4268 1376
At the analysis stage, due to a number of factors8 that were independent of steps taken at the
planning phase, 1252 enterprises were sampled. Sectors that were most affected were the
Financial & Insurance activities sector and the Textile & Apparel sector. Hence, a different
weighting protocol was adopted as per Annex 1.
STATISTICAL CONFIDENCE
The standard error associated with a given sample estimate is not determined by the size of the
population being observed (providing the population is reasonably large), but by the size of the
sample itself. In practice, once a sample size exceeds 100 cases (whatever the size of the total
population) it is likely to deliver an acceptable degree of accuracy provided it is a random sample.
The sample generated in this research had a standard error of less than 2.5% at the 95% level of
confidence.
QUESTIONNAIRE DESIGN AND ADMINISTRATION
The quantitative questionnaire and qualitative discussion guide were designed by the HRDC. The
structured questionnaire comprised 6 sections, namely, Section A: Firmographics; Section B:
8 Factors like cessation of business, change in main activity of an enterprise resulting in either change in workforce capacity and/or change in sector of activity resulted in modification of sampling protocol.

44 | P a g e
recruitment and recruitment difficulties; Section C: Future skills requirement; Section D: Industry
–education linkage; Section E: Skills and skills development; and Section F: Skills barometer. It
was administered face-to-face to heads or management level respondents of establishments and
responses were recorded using the CAPI (Computer Assisted Personal Interviewing) method. The
interviews were undertaken between November 2016 and May 2017.
All survey interviews were designed to take around an hour to complete (excluding questions 12 to
17 that required a separate and more in depth consultation). Potential respondents were called on a
range of days and times and on up to at least 8 occasions before being recorded as a non-respondent
and replaced by other establishment with similar business profile, that is, similar economic activity
and range of employees.
QUALITATIVE RESEARCH
A number of qualitative interviews were conducted at the same time as the structured interviews.
Such interviews were conducted, not only to complement the views obtained via quantitative survey
but also to address areas or issues that could not be tackled otherwise. Respondents were sector-
savvy people, usually members of industry associations, who had several years of experience and
good knowledge of current and future skills requirements of that sector. Qualitative interview for
each sector was carried out at 2 levels, namely, via individual interviews and via focus group
discussion. A triangular approach was adopted to complement the quantitative findings with the
qualitative ones.
PRESENTATION OF SURVEY DATA IN THE REPORT
Individual question bases are provided on the graphs and charts in this report. Cross-tabulations
were undertaken, based on key variables such as sub-sector, size of workforce and occupational
group. Numerical results are presented in the form of frequencies, indexes and percentages while
the same were usually presented in the form of charts, mostly pie charts, bar charts and line charts.
Most data used in this report are rounded to the nearest whole percentage or number. For this reason,
on occasion, data in tables or charts may not add up exactly to 100 per cent. The remainder of the
report now sets out research findings.

45 | P a g e
3. SURVEY FINDINGS
3.1 SECTOR PROFILE
3.1.1 BUSINESS PROFILE
There were 132 respondents for the survey which were distributed into nine activities, as presented
in Figure 11. Among the respondents, there were 39 restaurants (including liquor) representing 30
percent and 18 large hotels (more than 80 rooms), which represented 14 percent.
Figure 11: Economic activities of respondents
Number of years in operation
Among the organisations surveyed, two-third of the respondents said that they have been in
operation for more than 10 years, as shown in Figure 12. In addition, one quarter of organisations
were operating for more than five years in the sector. This give us an indication that more than 90
percent of respondents were more or less well settled in their different activities in the sector, that
is they have five or more years of operation.
39
18 1714
129
75 4 4
2 1
0
5
10
15
20
25
30
35
40
45
Re
stau
ran
ts (
incl
ud
ing
liqu
or)
Larg
e h
ote
ls (
mo
re t
han
80
ro
om
s)
Tou
rism
an
d R
ecr
eat
ion
al A
ctiv
itie
s
Sma
ll h
ote
ls (
up
to
80
ro
om
s)
Fast
Fo
od
Op
erat
or
Sho
rt-t
erm
acc
om
od
atio
nac
tivi
tie
s/To
uri
st r
esi
den
ces/
Gu
est
ho
use
s
Tou
r o
pe
rato
r ac
tivi
ties
Re
stau
ran
ts (
exc
lud
ing
liqu
or)
Cat
eri
ng
Serv
ices
Cat
amar
an c
ruis
es
Spa
and
We
llne
ss
Trav
el A
gen
cy
Distribution of respondents in numbers
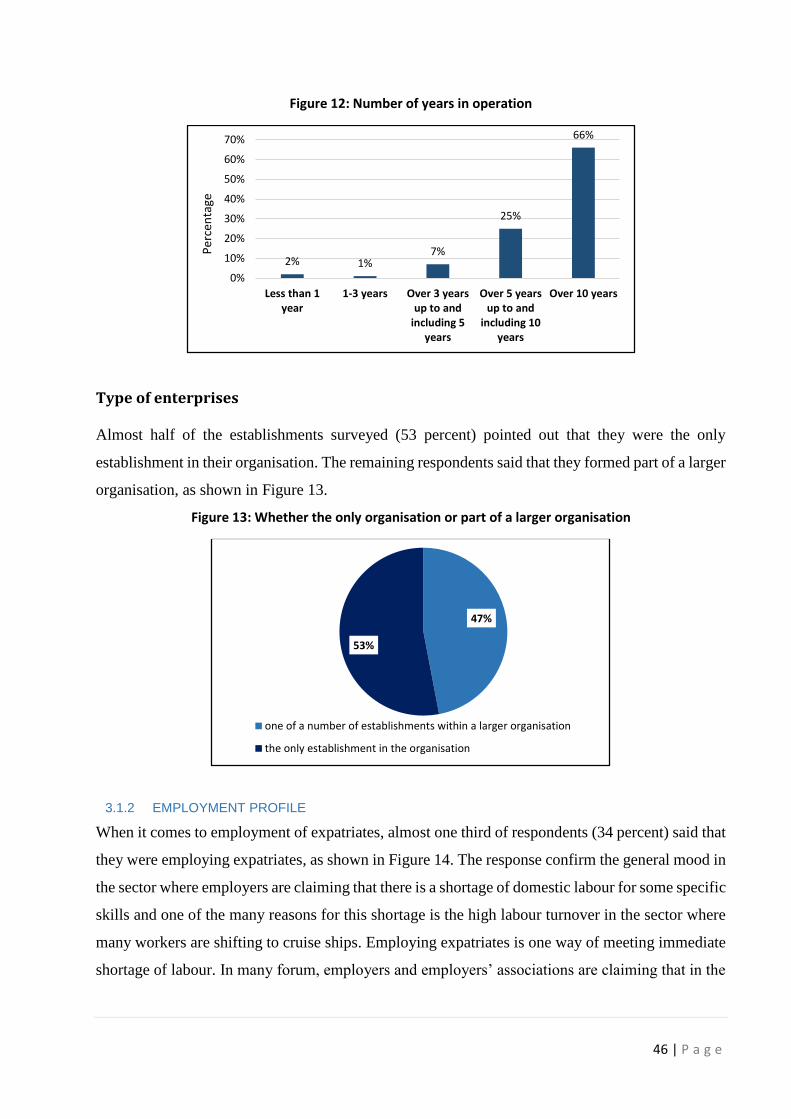
46 | P a g e
Figure 12: Number of years in operation
Type of enterprises
Almost half of the establishments surveyed (53 percent) pointed out that they were the only
establishment in their organisation. The remaining respondents said that they formed part of a larger
organisation, as shown in Figure 13.
Figure 13: Whether the only organisation or part of a larger organisation
3.1.2 EMPLOYMENT PROFILE
When it comes to employment of expatriates, almost one third of respondents (34 percent) said that
they were employing expatriates, as shown in Figure 14. The response confirm the general mood in
the sector where employers are claiming that there is a shortage of domestic labour for some specific
skills and one of the many reasons for this shortage is the high labour turnover in the sector where
many workers are shifting to cruise ships. Employing expatriates is one way of meeting immediate
shortage of labour. In many forum, employers and employers’ associations are claiming that in the
2% 1%7%
25%
66%
0%
10%
20%
30%
40%
50%
60%
70%
Less than 1year
1-3 years Over 3 yearsup to and
including 5years
Over 5 yearsup to and
including 10years
Over 10 years
Per
cen
tage
47%
53%
one of a number of establishments within a larger organisation
the only establishment in the organisation

47 | P a g e
years to come, some trades will have to be catered fully by expatriates as Mauritians are not ready
to work in those trades.
Figure 14: Employment of expatriates
From respondents’ data gathered, it was found that more employees having “work permit” were
employed in the organisations surveyed as compared to those having “occupational permit”. It was
also noticed that the majority of those having “work permit” were in the category of ‘Professionals’.
For “occupational permit”, ‘Managers’ were in higher numbers as shown in Table 15. In total, the
132 companies surveyed were employing 152 expatriates.
Table 15: Holders of Work and Occupational permits (n=152)
Occupational Groups Number of expatriates as at 30
September 2016
Work Permit
Occupation
Permit
Managers 6 24
Professionals 51 16
Technicians and associate professionals 16 0
Clerical support workers 0 0
Service and Sales workers 11 15
Skilled agricultural, forestry and fishery
workers
0 0
Craft and related trade workers 0 0
Plant and machine operators and
assemblers
0 0
Elementary occupations 8 5
Total 92 60
66%
34%
No Yes
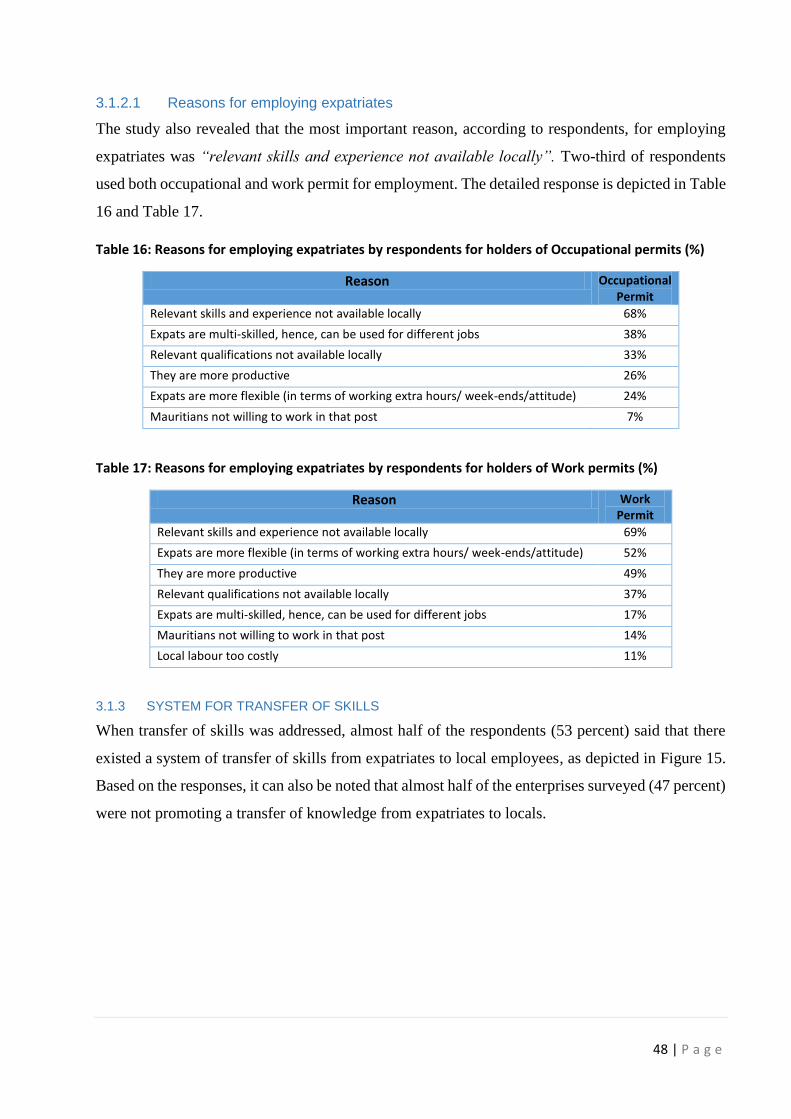
48 | P a g e
3.1.2.1 Reasons for employing expatriates
The study also revealed that the most important reason, according to respondents, for employing
expatriates was “relevant skills and experience not available locally”. Two-third of respondents
used both occupational and work permit for employment. The detailed response is depicted in Table
16 and Table 17.
Table 16: Reasons for employing expatriates by respondents for holders of Occupational permits (%)
Reason Occupational Permit
Relevant skills and experience not available locally 68%
Expats are multi-skilled, hence, can be used for different jobs 38%
Relevant qualifications not available locally 33%
They are more productive 26%
Expats are more flexible (in terms of working extra hours/ week-ends/attitude) 24%
Mauritians not willing to work in that post 7%
Table 17: Reasons for employing expatriates by respondents for holders of Work permits (%)
Reason Work Permit
Relevant skills and experience not available locally 69%
Expats are more flexible (in terms of working extra hours/ week-ends/attitude) 52%
They are more productive 49%
Relevant qualifications not available locally 37%
Expats are multi-skilled, hence, can be used for different jobs 17%
Mauritians not willing to work in that post 14%
Local labour too costly 11%
3.1.3 SYSTEM FOR TRANSFER OF SKILLS
When transfer of skills was addressed, almost half of the respondents (53 percent) said that there
existed a system of transfer of skills from expatriates to local employees, as depicted in Figure 15.
Based on the responses, it can also be noted that almost half of the enterprises surveyed (47 percent)
were not promoting a transfer of knowledge from expatriates to locals.

49 | P a g e
Figure 15: Existence of system of transfer of skills from expatriates to local employees (n=45)
Respondents were also requested to state the ways/methods which they were mostly using to
transfer knowledge from expatriate workers to local workers. According to the respondents, the
most common ways/methods of transferring the knowledge in order of preference were as follows:
Through technical training;
On the job coaching/learning;
Mentoring; and
On-the-job training.
3.2 RECRUITMENT AND JOB READINESS
Regarding recruitment among the enterprises surveyed within the past two years, a large majority
(85 percent) of enterprises surveyed said that they did make recruitment. This high percentage
illustrates that organisations in general in this sector continuously recruit as shown in Figure 16.
Figure 16: Percentage of organisations which recruited over the past 2 years (n=132)
When it comes to the recruitment of “fresher” - that is those without any work experience - almost
two-third of enterprises (63 percent) said that they did recruit “fresher” coming from the secondary
school. In addition, half of the enterprises (51 percent) said that they recruited “fresher” coming
from the TVET stream or other training institutions. It should be noted that 39 percent of those
47 53
0
20
40
60
80
100
No Yes
Pe
rce
nta
ge
15%
85%
0%
10%
20%
30%
40%
50%
60%
70%
80%
90%
No Yes
Per
cen
tage
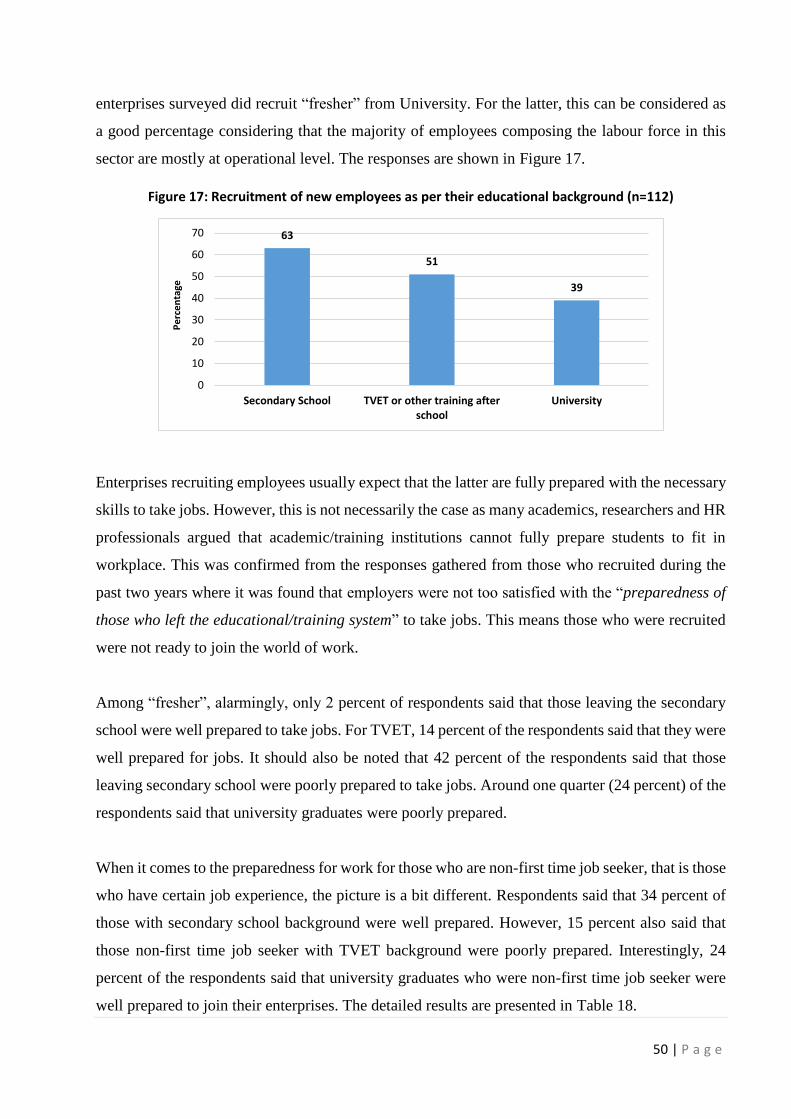
50 | P a g e
enterprises surveyed did recruit “fresher” from University. For the latter, this can be considered as
a good percentage considering that the majority of employees composing the labour force in this
sector are mostly at operational level. The responses are shown in Figure 17.
Figure 17: Recruitment of new employees as per their educational background (n=112)
Enterprises recruiting employees usually expect that the latter are fully prepared with the necessary
skills to take jobs. However, this is not necessarily the case as many academics, researchers and HR
professionals argued that academic/training institutions cannot fully prepare students to fit in
workplace. This was confirmed from the responses gathered from those who recruited during the
past two years where it was found that employers were not too satisfied with the “preparedness of
those who left the educational/training system” to take jobs. This means those who were recruited
were not ready to join the world of work.
Among “fresher”, alarmingly, only 2 percent of respondents said that those leaving the secondary
school were well prepared to take jobs. For TVET, 14 percent of the respondents said that they were
well prepared for jobs. It should also be noted that 42 percent of the respondents said that those
leaving secondary school were poorly prepared to take jobs. Around one quarter (24 percent) of the
respondents said that university graduates were poorly prepared.
When it comes to the preparedness for work for those who are non-first time job seeker, that is those
who have certain job experience, the picture is a bit different. Respondents said that 34 percent of
those with secondary school background were well prepared. However, 15 percent also said that
those non-first time job seeker with TVET background were poorly prepared. Interestingly, 24
percent of the respondents said that university graduates who were non-first time job seeker were
well prepared to join their enterprises. The detailed results are presented in Table 18.
63
51
39
0
10
20
30
40
50
60
70
Secondary School TVET or other training afterschool
University
Pe
rce
nta
ge

51 | P a g e
Table 18: Preparedness of employees to enter the world of work as per educational background (%)
Fresher Non-fresher
S.S.
(n=71)
TVET
(n=74)
UNI.
(n=45)
S.S.
(n=96)
TVET
(n=65)
UNI.
(n=58)
Well prepared 2 14 5 34 30 24
Poorly prepared 42 24 24 27 15 17
Don’t know 1 1 2 0 0 2
(Varies too much to say) 54 6 3 11 5 1
S.S.: Secondary school; TVET: Technical Vocational and Education training; UNI: university
N: number of respondents
The response clearly make us reflect on the education and training system and how far the Mauritian
education and training system is supporting enterprises in their search for skilled workers. Based on
the figures, it was noticed that work experience is crucial for employees to be more prepared to
enter the world of work, as shown in Error! Reference source not found..
Figure 18: Preparedness of employees entering the world of work as per educational background
For school leavers, based on the different requirements provided, it was seen that on average, less
than half of the enterprises were fully satisfied with different requirements listed. 48 percent were
fully satisfied with ‘team working’ of school leavers. Also, only around 10 percent were fully
satisfied with school leavers’ ‘self-management’, ‘problem solving’, ‘foreign language skills and
international cultural awareness’.
2
14
5
3430
24
42
24 24 27
15 17
1 1 2 0 0 2
54
6 3
115
10
10
20
30
40
50
60
(n=71) (n=74) (n=45) (n=96) (n=65) (n=58)
S.S. TVET UNI. S.S. TVET UNI.
Fresher Non-fresher
Pe
rce
nta
ge
Preparedness of employees to enter the world of work as per educational background (%)
Well prepared Poorly prepared Don’t know (Varies too much to say)

52 | P a g e
On average, as presented in Table 19, between half and one third of respondents were neither
satisfied nor dissatisfied with the requirements for school leavers. In addition, only one fifth of the
respondents were not satisfied at all with foreign language skills and international cultural
awareness of school leavers. The detailed responses are presented in Error! Reference source not
found.. Error! Reference source not found. shows the skills mix listed under ‘not satisfied at all.’
Table 19: Satisfaction of enterprises with the skills mix of school leavers in the past 2 years
(n = 112)
School Leavers
Fully
satisfied
Neither satisfied nor dissatisfied
Not satisfied
at all
Not
applicable
Basic literacy and use of English and French 28% 54% 9% 9%
Basic numeracy skills 34% 39% 13% 14%
Technical skills 22% 46% 21% 11%
Analytical skills 16% 46% 25% 13%
Good communication skills 29% 49% 13% 9%
Use of IT 41% 28% 4% 27%
Self-management 13% 41% 34% 12%
Team-working 48% 34% 10% 8%
Business and customer awareness 19% 39% 31% 11%
Problem solving 10% 42% 39% 9%
Positive attitude to work 36% 45% 11% 8%
Knowledge about their chosen job/career 21% 40% 31% 8%
Relevant work experience 29% 46% 10% 15%
Foreign language skills 12% 20% 25% 43%
International cultural awareness 14% 20% 34% 32%
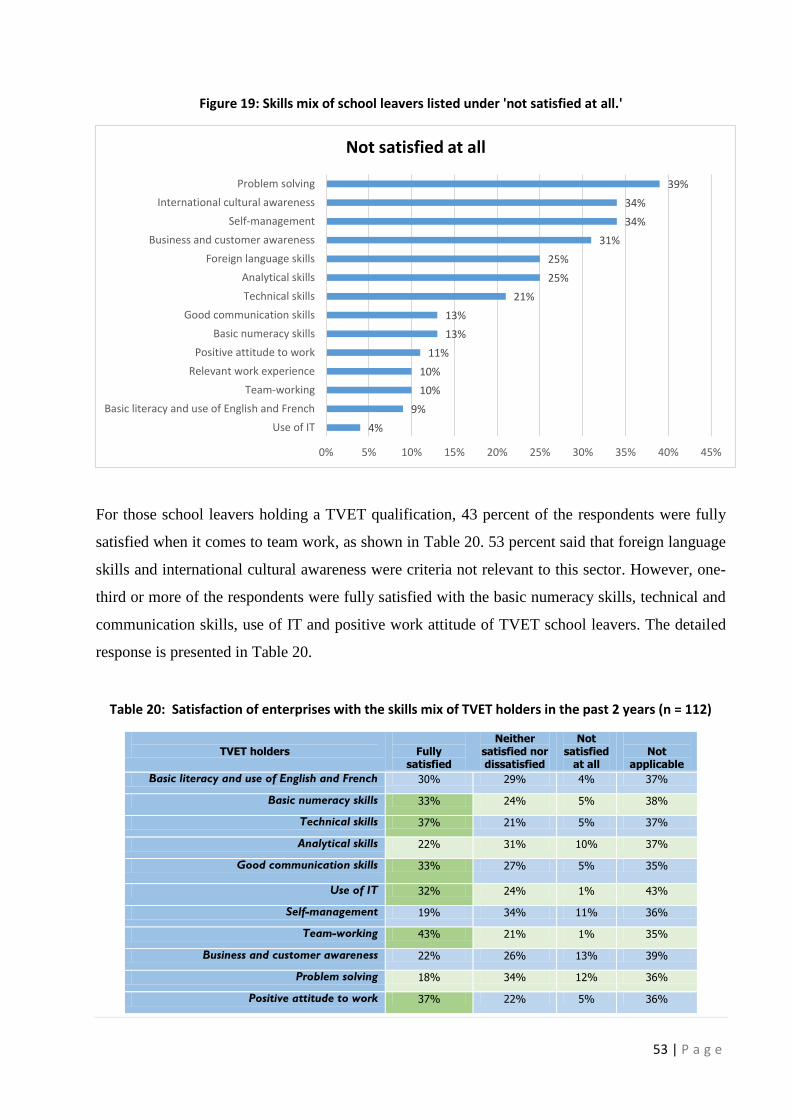
53 | P a g e
Figure 19: Skills mix of school leavers listed under 'not satisfied at all.'
For those school leavers holding a TVET qualification, 43 percent of the respondents were fully
satisfied when it comes to team work, as shown in Table 20. 53 percent said that foreign language
skills and international cultural awareness were criteria not relevant to this sector. However, one-
third or more of the respondents were fully satisfied with the basic numeracy skills, technical and
communication skills, use of IT and positive work attitude of TVET school leavers. The detailed
response is presented in Table 20.
Table 20: Satisfaction of enterprises with the skills mix of TVET holders in the past 2 years (n = 112)
TVET holders
Fully
satisfied
Neither satisfied nor dissatisfied
Not satisfied
at all
Not
applicable
Basic literacy and use of English and French 30% 29% 4% 37%
Basic numeracy skills 33% 24% 5% 38%
Technical skills 37% 21% 5% 37%
Analytical skills 22% 31% 10% 37%
Good communication skills 33% 27% 5% 35%
Use of IT 32% 24% 1% 43%
Self-management 19% 34% 11% 36%
Team-working 43% 21% 1% 35%
Business and customer awareness 22% 26% 13% 39%
Problem solving 18% 34% 12% 36%
Positive attitude to work 37% 22% 5% 36%
4%
9%
10%
10%
11%
13%
13%
21%
25%
25%
31%
34%
34%
39%
0% 5% 10% 15% 20% 25% 30% 35% 40% 45%
Use of IT
Basic literacy and use of English and French
Team-working
Relevant work experience
Positive attitude to work
Basic numeracy skills
Good communication skills
Technical skills
Analytical skills
Foreign language skills
Business and customer awareness
Self-management
International cultural awareness
Problem solving
Not satisfied at all

54 | P a g e
Knowledge about their chosen job/career 30% 23% 11% 36%
Relevant work experience 27% 30% 2% 41%
Foreign language skills 15% 18% 14% 53%
International cultural awareness 14% 25% 14% 47%
For university graduates, ii was found that more that 40 percent of respondents said that they were
fully satisfied with the following; basic literacy and use of English and French, basic numeracy
skills and use of IT, as shown in Table 21.
Table 21: Satisfaction of enterprises with the skills mix of university graduates in the past 2 years (n = 112)
Graduates
Fully
satisfied
Neither satisfied nor dissatisfied
Not satisfied
at all
Not
applicable
Basic literacy and use of English and French 41% 11% 3% 45%
Basic numeracy skills 48% 5% 1% 46%
Technical skills 27% 20% 8% 45%
Analytical skills 26% 22% 7% 45%
Good communication skills 36% 16% 4% 44%
Use of IT 47% 6% 1% 46%
Self-management 20% 26% 9% 45%
Team-working 37% 15% 4% 44%
Business and customer awareness 25% 21% 9% 45%
Problem solving 22% 25% 8% 45%
Positive attitude to work 31% 19% 5% 45%
Knowledge about their chosen job/career 25% 20% 11% 44%
Relevant work experience 23% 22% 9% 46%
Foreign language skills 17% 12% 15% 56%
International cultural awareness 19% 19% 11% 51%

55 | P a g e
Figure 20: Skills mix of university graduates listed under 'fully satisfied.'
3.3 WHAT MAKES VACANCIES HARD TO FILL AND WHAT ARE THE CRITICAL VACANCIES FOR THE SECTOR?
3.3.1 OCCUPATIONAL ANALYSIS
In terms of the number of employees in the tourism sector, as per Statistics Mauritius, in 2017, there
were around 41,600 people working in the sector. The total contribution of the Travel and Tourism
to employment, including jobs indirectly supported by the industry was 131,000 in 2017 (Travel &
Tourism Economic Impact 2018, Mauritius). For the study, there were 132 enterprises which were
surveyed and as per the information gathered, there was a total 8136 employees in the 132
enterprises. The employees were distributed in the nine occupational groups as per National
Classification Standards (NASCO) and this is presented in Figure 21. Given the nature of the sector,
it was no surprise to see that the majority of employees were in the occupational group ‘Service and
sales workers’ (49 percent). This was followed by ‘Elementary occupations’ (14 percent),
‘Managers’ (11 percent), ‘Professionals’ (8 percent), ‘Technicians and associate professionals’ (7
percent) and ‘Clerical support workers’ (7 percent). The lowest number of employees were in the
occupational group ‘Craft and related trade workers’ (2 percent), ‘Plant & machinery operators’
(1%) and ‘Skilled agricultural & fishery workers’ (1 percent).
17%
19%
20%
22%
23%
25%
25%
26%
27%
31%
36%
37%
41%
47%
48%
0% 10% 20% 30% 40% 50% 60%
Foreign language skills
International cultural awareness
Self-management
Problem solving
Relevant work experience
Business and customer awareness
Knowledge about their chosen job/career
Analytical skills
Technical skills
Positive attitude to work
Good communication skills
Team-working
Basic literacy and use of English and French
Use of IT
Basic numeracy skills
Fully satistied

56 | P a g e
Figure 21: Distribution of employees as per occupational groups for the sample (n=8136)
There are many “generic” jobs or common jobs which exist in all sectors, that is, jobs which are
not specific to any sector and example are IT administrator, accountant, clerk and driver. However,
like in all sectors, this sector has a number of specialised jobs that exist and few examples are food
and beverage manager, chef, bar supervisor, waiter and housekeeper. Table 22 shows a list of some
of the most common jobs found in each occupational group for the Tourism and Hospitality sector.
Most of these jobs are specific for the sector.
Table 22: Common occupations by occupation groups in the Tourism sector
Occupational groups Job titles
Resident Director
Kitchen Manager
Food and Beverage Manager
Restaurant Manager
Front Office Manager
Boathouse Manager
Head of Department
Sales and Marketing Manager
Tours Manager
Professionals
Spa Therapist
Chef
Fitness Coach
Graphic Designer
Guest Relations Executive
Yoga Teacher
Managers11%
Professionals 8%
Associate Professionals &
Technicians7%
Clerical support workers
7%Service & sales
workers49%
Skilled agricultural,
forestry & fishery workers
1%
Craft & related trade workers
2%
Plant & machinery operators
1%
Elementary occupations
14%

57 | P a g e
Pastry Chef
Associate Professionals & Technicians
Skipper/Boatman
Frigorist
Health & Safety Officer
Maintenance Technician
Restaurant Supervisor
HVAC Technician
Bar Supervisor
Clerical support workers
Storekeeper
Reservation Clerk
Payroll Clerk
Front Office Clerk
F&B Secretary
Service & sales workers
Waiter
Housekeeper
Cook
Barman
Tourist Guide
Labourer
Craft & related trade workers
Diver
Butcher
Carpenter
Plumber
Plant & machinery operators
Driver
Machinist
Brewer
Elementary occupations
Kitchen helper
Maintenance worker
Porter
Housekeeping attendant
Maid Gardener
One of the main issues raised by employers is the inability to recruit the right persons with the right
skills. One of the main objectives of this study is to try to find out what are the different jobs where
employers are finding it difficult to recruit. The responses were gathered for each of the nine
occupational groups as per Statistics Mauritius classifications. Table 23 gives an indication of the
different job titles as per the occupational groups where it was difficult to fill vacancies by
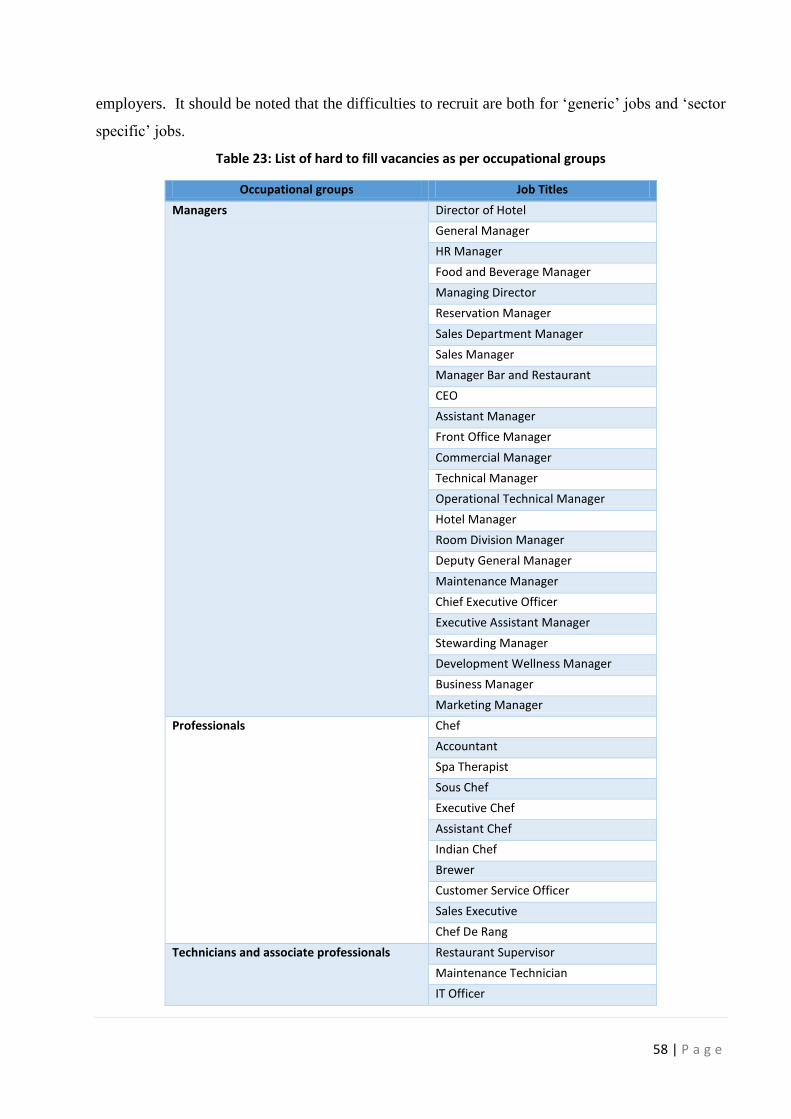
58 | P a g e
employers. It should be noted that the difficulties to recruit are both for ‘generic’ jobs and ‘sector
specific’ jobs.
Table 23: List of hard to fill vacancies as per occupational groups
Occupational groups Job Titles
Managers
Director of Hotel
General Manager
HR Manager
Food and Beverage Manager
Managing Director
Reservation Manager
Sales Department Manager
Sales Manager
Manager Bar and Restaurant
CEO
Assistant Manager
Front Office Manager
Commercial Manager
Technical Manager
Operational Technical Manager
Hotel Manager
Room Division Manager
Deputy General Manager
Maintenance Manager
Chief Executive Officer
Executive Assistant Manager
Stewarding Manager
Development Wellness Manager
Business Manager
Marketing Manager
Professionals
Chef
Accountant
Spa Therapist
Sous Chef
Executive Chef
Assistant Chef
Indian Chef
Brewer
Customer Service Officer
Sales Executive
Chef De Rang
Technicians and associate professionals Restaurant Supervisor
Maintenance Technician
IT Officer
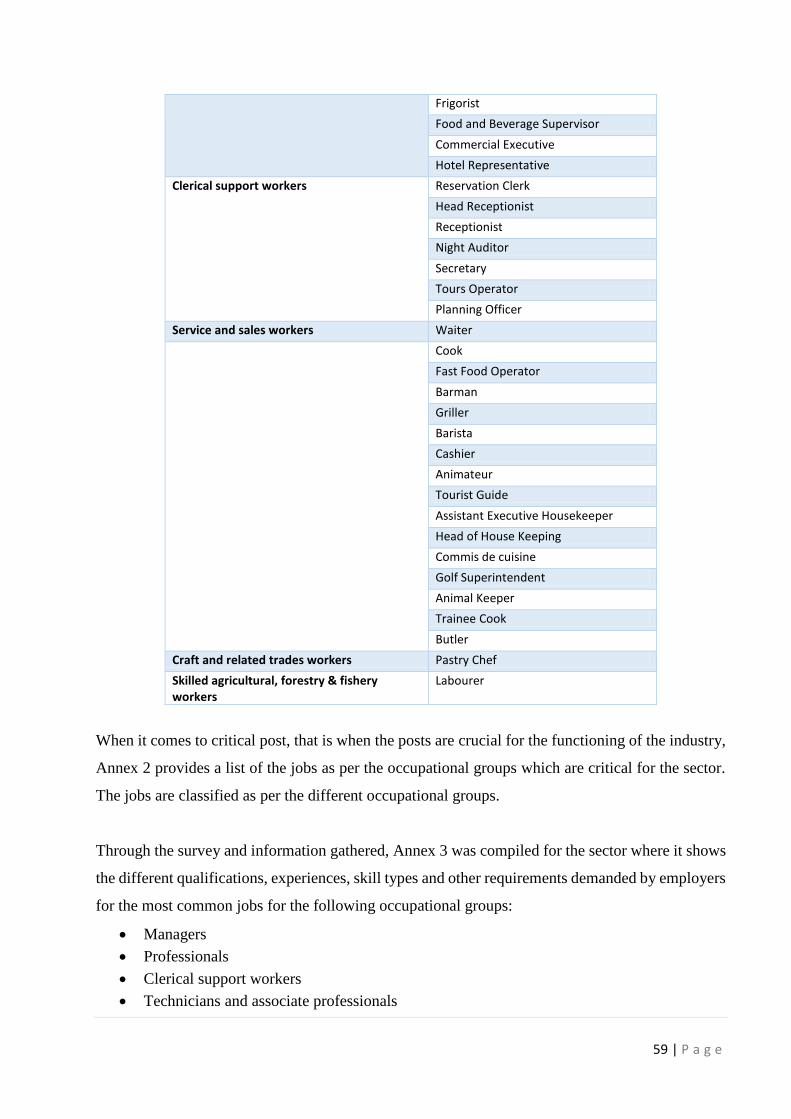
59 | P a g e
Frigorist
Food and Beverage Supervisor
Commercial Executive
Hotel Representative
Clerical support workers Reservation Clerk
Head Receptionist
Receptionist
Night Auditor
Secretary
Tours Operator
Planning Officer
Service and sales workers Waiter
Cook
Fast Food Operator
Barman
Griller
Barista
Cashier
Animateur
Tourist Guide
Assistant Executive Housekeeper
Head of House Keeping
Commis de cuisine
Golf Superintendent
Animal Keeper
Trainee Cook
Butler
Craft and related trades workers Pastry Chef
Skilled agricultural, forestry & fishery workers
Labourer
When it comes to critical post, that is when the posts are crucial for the functioning of the industry,
Annex 2 provides a list of the jobs as per the occupational groups which are critical for the sector.
The jobs are classified as per the different occupational groups.
Through the survey and information gathered, Annex 3 was compiled for the sector where it shows
the different qualifications, experiences, skill types and other requirements demanded by employers
for the most common jobs for the following occupational groups:
Managers
Professionals
Clerical support workers
Technicians and associate professionals
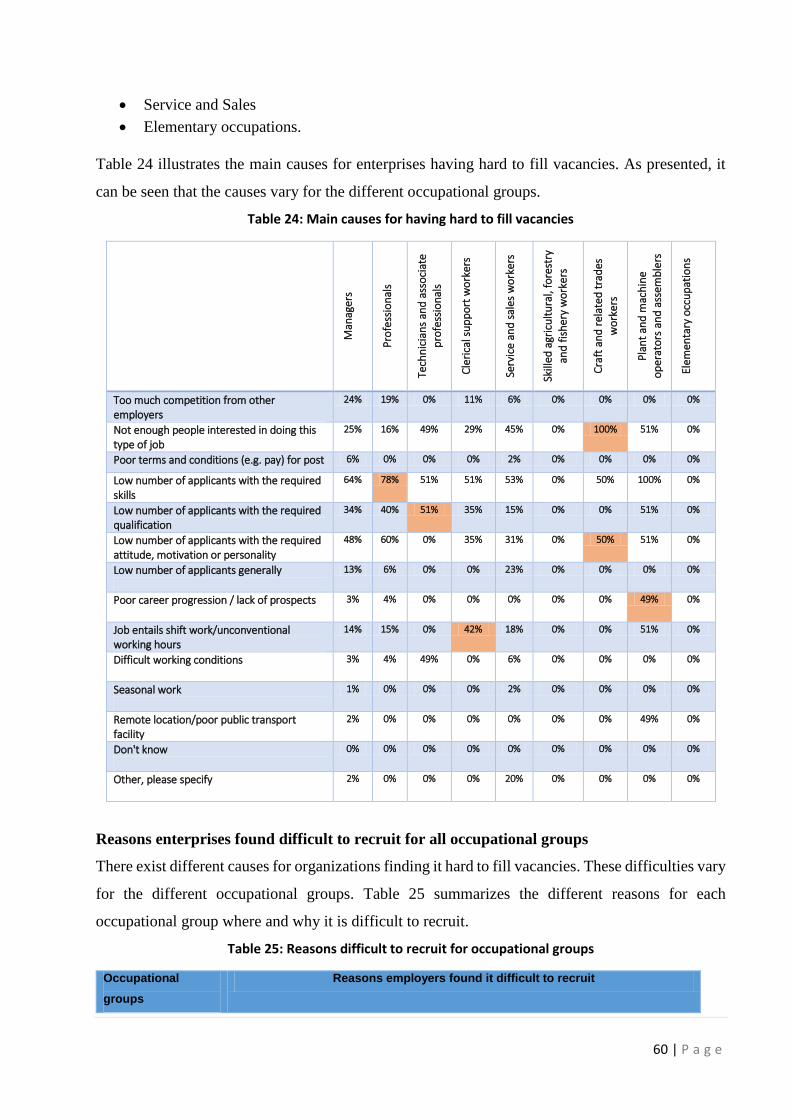
60 | P a g e
Service and Sales
Elementary occupations.
Table 24 illustrates the main causes for enterprises having hard to fill vacancies. As presented, it
can be seen that the causes vary for the different occupational groups.
Table 24: Main causes for having hard to fill vacancies
Man
ager
s
Pro
fess
ion
als
Tech
nic
ian
s an
d a
sso
ciat
e
pro
fess
ion
als
Cle
rica
l su
pp
ort
wo
rker
s
Serv
ice
and
sal
es w
ork
ers
Skill
ed a
gric
ult
ura
l, fo
rest
ry
and
fis
her
y w
ork
ers
Cra
ft a
nd
rel
ated
tra
des
wo
rker
s
Pla
nt
and
mac
hin
e
op
erat
ors
an
d a
ssem
ble
rs
Elem
enta
ry o
ccu
pat
ion
s
Too much competition from other employers
24% 19% 0% 11% 6% 0% 0% 0% 0%
Not enough people interested in doing this type of job
25% 16% 49% 29% 45% 0% 100% 51% 0%
Poor terms and conditions (e.g. pay) for post 6% 0% 0% 0% 2% 0% 0% 0% 0%
Low number of applicants with the required skills
64% 78% 51% 51% 53% 0% 50% 100% 0%
Low number of applicants with the required qualification
34% 40% 51% 35% 15% 0% 0% 51% 0%
Low number of applicants with the required attitude, motivation or personality
48% 60% 0% 35% 31% 0% 50% 51% 0%
Low number of applicants generally
13% 6% 0% 0% 23% 0% 0% 0% 0%
Poor career progression / lack of prospects
3% 4% 0% 0% 0% 0% 0% 49% 0%
Job entails shift work/unconventional working hours
14% 15% 0% 42% 18% 0% 0% 51% 0%
Difficult working conditions
3% 4% 49% 0% 6% 0% 0% 0% 0%
Seasonal work
1% 0% 0% 0% 2% 0% 0% 0% 0%
Remote location/poor public transport facility
2% 0% 0% 0% 0% 0% 0% 49% 0%
Don't know
0% 0% 0% 0% 0% 0% 0% 0% 0%
Other, please specify
2% 0% 0% 0% 20% 0% 0% 0% 0%
Reasons enterprises found difficult to recruit for all occupational groups
There exist different causes for organizations finding it hard to fill vacancies. These difficulties vary
for the different occupational groups. Table 25 summarizes the different reasons for each
occupational group where and why it is difficult to recruit.
Table 25: Reasons difficult to recruit for occupational groups
Occupational
groups
Reasons employers found it difficult to recruit

61 | P a g e
Managers 64 percent said that there exist a low number of applicants with the required
skills
Almost half said that there were low number of applicants with the required
attitude, motivation or personality
One third said that there was low number of applicants with the required
qualification
Around one-quarter said that there were too much competition from other
employers and not enough people interested in doing this type of job
Professionals More that three-quarter of respondents said that there exist low number of
applicants with the required skills
60 percent said that there was low number of applicants with the required
attitude, motivation or personality
40 percent pointed out that there was low number of applicants with the
required qualification
Technicians and
associate
professionals
51 percent of respondents said that there was low number of applicants with
the required skills and low number of applicants with the required qualification
49 percent said that there was not enough people interested in doing this type
of job and similar percentage said that there was difficult working conditions
Clerical support
workers
51 percent said that there was low number of applicants with the required skills
42 percent said that the job entails shift work/unconventional working hours
35 percent also pointed out that there was low number of applicants with the
required qualification and also low number of applicants with the required
attitude, motivation or personality
Service and sales
workers
53 percent said that there was low number of applicants with the required skills
45 percent said that there was not enough people interested in doing this type
of job
31 percent pointed out that there was a low number of applicants with the
required attitude, motivation or personality
Skilled agricultural,
forestry and fishery
workers
For this occupational group, there were no responses
Craft and related
trades workers
For the Craft and related trades workers occupational group, there was
insignificant number of responses
Plant and machine
operators and
assemblers
For Plant and machine operators and assemblers occupational group, there
was insignificant number of responses
Elementary
occupations
For this occupational group, there were no responses
Consequences where enterprises cannot recruit
As stated previously, there exist many reasons why it is hard to fill some vacancies by enterprises
and these difficulties have some consequences on enterprises. Table 26 shows that when there are
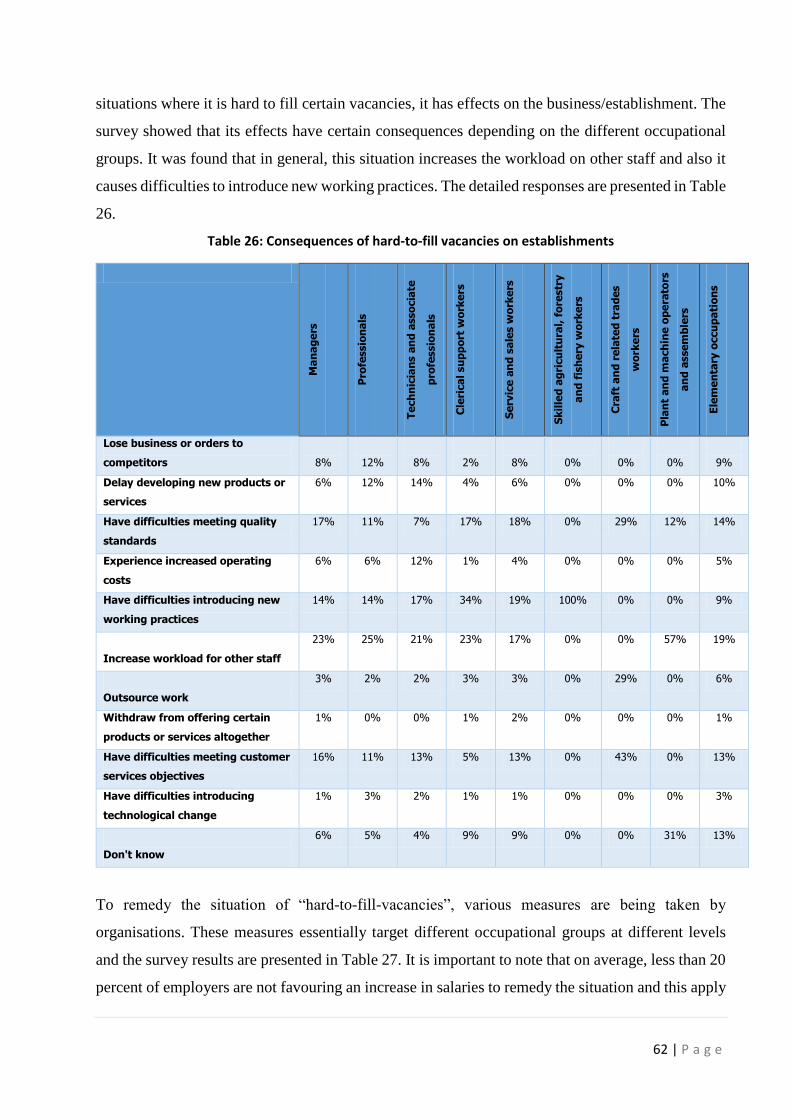
62 | P a g e
situations where it is hard to fill certain vacancies, it has effects on the business/establishment. The
survey showed that its effects have certain consequences depending on the different occupational
groups. It was found that in general, this situation increases the workload on other staff and also it
causes difficulties to introduce new working practices. The detailed responses are presented in Table
26.
Table 26: Consequences of hard-to-fill vacancies on establishments
Ma
na
ge
rs
Pro
fessio
na
ls
Te
ch
nic
ian
s a
nd
asso
cia
te
pro
fessio
na
ls
Cle
rica
l su
pp
ort
wo
rke
rs
Se
rvic
e a
nd
sa
les w
ork
ers
Sk
ille
d a
gri
cu
ltu
ral,
fo
restr
y
an
d f
ish
ery
wo
rke
rs
Cra
ft a
nd
re
late
d t
rad
es
wo
rke
rs
Pla
nt
an
d m
ach
ine o
pe
rato
rs
an
d a
sse
mb
lers
Ele
me
nta
ry o
ccu
pa
tio
ns
Lose business or orders to
competitors
8%
12%
8%
2%
8%
0%
0%
0%
9%
Delay developing new products or
services
6% 12% 14% 4% 6% 0% 0% 0% 10%
Have difficulties meeting quality
standards
17% 11% 7% 17% 18% 0% 29% 12% 14%
Experience increased operating
costs
6% 6% 12% 1% 4% 0% 0% 0% 5%
Have difficulties introducing new
working practices
14% 14% 17% 34% 19% 100% 0% 0% 9%
Increase workload for other staff
23% 25% 21% 23% 17% 0% 0% 57% 19%
Outsource work
3% 2% 2% 3% 3% 0% 29% 0% 6%
Withdraw from offering certain
products or services altogether
1% 0% 0% 1% 2% 0% 0% 0% 1%
Have difficulties meeting customer
services objectives
16% 11% 13% 5% 13% 0% 43% 0% 13%
Have difficulties introducing
technological change
1% 3% 2% 1% 1% 0% 0% 0% 3%
Don't know
6% 5% 4% 9% 9% 0% 0% 31% 13%
To remedy the situation of “hard-to-fill-vacancies”, various measures are being taken by
organisations. These measures essentially target different occupational groups at different levels
and the survey results are presented in Table 27. It is important to note that on average, less than 20
percent of employers are not favouring an increase in salaries to remedy the situation and this apply

63 | P a g e
for all occupational groups. However, ‘redefining existing jobs’ is being considered for some
occupational groups in a view to cope with the situation. In some instances and for some
occupational groups, more than half of the enterprises are trying to ‘promote multi-tasking’. For
other occupational groups, organisations are also ‘prepared to offer training to less well
qualified/skilled recruits’ to remedy the situation of hard-to-fill vacancies. The detailed results of
the survey is depicted in Table 27.
Table 27: Measures to remedy “hard-to-fill vacancies”
Man
ager
s
Pro
fess
ion
als
Tech
nic
ian
s an
d a
sso
ciat
e p
rofe
ssio
nal
s
Cle
rica
l su
pp
ort
wo
rker
s
Serv
ice
and
sal
es w
ork
ers
Skill
ed a
gric
ult
ura
l, fo
rest
ry a
nd
fish
ery
wo
rker
s
Cra
ft a
nd
rel
ated
tra
des
wo
rker
s
Pla
nt
and
mac
hin
e o
per
ato
rs
and
ass
emb
lers
Elem
enta
ry o
ccu
pat
ion
s
Increasing salaries
14% 21% 19% 11% 13% 0% 0% 13% 17%
Increasing the training given to existing workforce to acquire required skills
32% 24% 28% 27% 29% 0% 0% 54% 27%
Redefining existing jobs
42% 45% 47% 25% 41% 50% 43% 13% 36%
Increasing advertising / recruitment expenditure 21% 31% 28% 12% 17% 0% 0% 0% 18%
Embarking on / expanding trainee programmes (DTP, STM, YEP...)
17% 18% 25% 31% 18% 50% 0% 0% 12%
Recruiting graduates under the GTES programme 6% 4% 12% 2% 3% 0% 0% 0% 5%
Promote multi-tasking
59% 57% 49% 38% 56% 50% 29% 25% 58%
Using new recruitment methods or channels (e.g. social media...)
10% 13% 0% 6% 7% 0% 0% 0% 13%
Recruiting expatriate workers
14% 11% 15% 6% 13% 0% 43% 0% 13%
Bringing in contractors to do the work, or contracting it out
6% 4% 0% 6% 6% 0% 0% 0% 8%
Being prepared to offer training to less well qualified/skilled recruits
30% 30% 17% 20% 36% 50% 0% 12% 33%
Sensitisation about the sector and jobs to improve attractiveness of jobs
7% 12% 2% 5% 10% 0% 0% 13% 11%
Nothing
7% 4% 13% 8% 7% 0% 29% 34% 11%
Other, please specify
3% 5% 0% 3% 6% 0% 0% 0% 2%
Very often, employers find it difficult to employ skilled labour with specific skills. These difficulties
are also more pronounced for certain occupational groups. The results of the survey show that
difficulties faced by employers vary across different occupational groups as employers require
different/specific skills for each occupational group. The results of the survey are presented in Table
28 where it clearly shows that different occupational groups require different skills and qualities.

64 | P a g e
Table 28: Skills requirements for different occupational groups
Man
age
rs
Pro
fess
ion
als
Tech
nic
ian
s an
d a
sso
ciat
e
pro
fess
ion
als
Cle
rica
l su
pp
ort
wo
rke
rs
Serv
ice
an
d s
ale
s w
ork
ers
Skill
ed
agr
icu
ltu
ral,
fore
stry
and
fis
he
ry w
ork
ers
Cra
ft a
nd
re
late
d t
rad
es
wo
rker
s
Pla
nt
and
mac
hin
e
op
era
tors
an
d a
sse
mb
lers
Ele
me
nta
ry o
ccu
pat
ion
s
Flexibility and versatility to tackle a wide range of technical and non-technical subjects
28% 24% 51% 39% 7% 0% 0% 51% 0%
Analytical skills
36% 40% 51% 15% 9% 0% 0% 0% 0%
Problem-solving skills
46% 43% 51% 35% 10% 0% 50% 49% 0%
Basic ICT Skills
16% 18% 0% 11% 2% 0% 0% 0% 0%
Ability to learn
29% 23% 0% 14% 23% 0% 0% 0% 0%
To change the status quo
18% 40% 0% 15% 9% 0% 0% 51% 0%
Ability to grasp concepts quickly
24% 39% 0% 21% 17% 0% 0% 0% 0%
Ability to argue on one's feet
37% 39% 51% 39% 11% 0% 0% 100% 0%
Ability to work methodically (organization and planning skills)
33% 33% 0% 28% 20% 0% 0% 51% 0%
Accuracy and attention to detail
21% 45% 49% 23% 25% 0% 100% 51% 0%
Ability to analyze technical and statistical data
22% 13% 0% 6% 0% 0% 0% 0% 0%
Good communication, spoken, written and presentation skills
44% 31% 0% 17% 21% 0% 0% 100% 0%
Team work
22% 34% 0% 23% 17% 0% 0% 100% 0%
Innovative skills
17% 42% 0% 6% 9% 0% 0% 0% 0%
Ability to take initiative and experiment with alternatives
38% 13% 0% 22% 8% 0% 0% 0% 0%
Network with clients
15% 7% 0% 0% 0% 0% 0% 0% 0%
Technical skills
27% 20% 51% 0% 13% 0% 50% 51% 0%
Good attitude
31% 35% 49% 23% 29% 0% 50% 100% 0%
Foreign language skills
15% 4% 0% 11% 13% 0% 0% 51% 0%
Creative skills
15% 35% 0% 6% 8% 0% 0% 0% 0%
Customer handling skills
28% 18% 0% 11% 22% 0% 0% 0% 0%
Strategic management skills
22% 11% 0% 0% 0% 0% 0% 0% 0%
Literacy skills
10% 0% 0% 11% 4% 0% 0% 0% 0%
Mathematical skills
3% 4% 0% 0% 2% 0% 0% 0% 0%

65 | P a g e
Any other skill not listed above? Please specify
9% 11% 0% 11% 22% 0% 0% 0% 0%
3.4 FUTURE SKILLS REQUIREMENTS
3.4.1 FUTURE BUSINESS SCENARIO
For the study, respondents were asked about their future size of their workforce and their future
business activities by assuming two scenarios which are “assuming that the business environment
will remain the same” or in case “business environment will improve in the future”. All the 132
establishments surveyed gave their opinions for this question.
For the first part where respondents assumed that the business environment will remain the same,
in terms of workforce, nearly half of the establishment (49 percent) pointed out that their workforce
will remain the same. Positively, it should also be noted that, around 40 percent also said that even
if the business environment remain the same, their workforce will expand. In addition, even in a
situation where future business environment will remain stagnant, business activities will expand
according to more than half of the respondents (56 percent). Around one third of respondents (31
percent) also said that their business activities would remain the same. Only 7 percent of
establishments were pessimist where they said that their business activities would contract.
When respondents were asked to assume that the business environment will improve, 68 percent
respondents claimed that their workforce will expand. One quarter of respondents also said that
their workforce will remain constant. Similar response was received from respondents in terms of
business activity when they assumed that business environment will improve. A little more that
three-quarter of enterprises (77 percent) claimed that business will expand whereas 16 percent also
claimed that business activities will remain the same.
It can be concluded that respondents were optimist when it comes to future size of labour force and
future business activities even in the event of business environment remaining the same or business
environment improves in the future. The detailed responses are presented in Table 29 and

66 | P a g e
.
Table 29: Future size of labour and business activities in case business environment remain same or improves
Assuming business environment remain the same
In terms of size of workforce % In terms of business activity %
Contract 5 Contract 7
Don't know 5 Don't know 6
Expand 41 Expand 56
Remain the same 49 Remains the same 31
Total 100 Total 100
Assuming business environment improves
In terms of size of workforce % In terms of business activity %
Expand 68 Expand 77
Remain the same 26 Remain the same 16
Contract 1 Contract 1
Don't know 5 Don't know 6
Total 100 Total 100

67 | P a g e
Figure 22: Future size of labour and business activities in case business environment remain same or improves
In case of future expansion of the enterprises in the same or different fields, there are a list of skills
which will be in need, as presented in Table 30. The types of support needed for the skills were also
provided by respondents in Table 30.
Table 30: Skills and support requirements of enterprises in case of expansion
Future Sector of Activity Specific skills requirement Type of Support needed
Mini Club, Gym and Sauna
Qualified trainers Foreign trainers
Bar Barmen Experienced professional to give training
Brewery Technical skill in brewery Professional trainer
41%
49%
5% 5%1%
5%
68%
26%
0%
10%
20%
30%
40%
50%
60%
70%
80%
Expand Remain the same Contract Don't know
Per
cen
tage
In terms of workforce
Assuming business environment remain the same
Assuming business environment improves
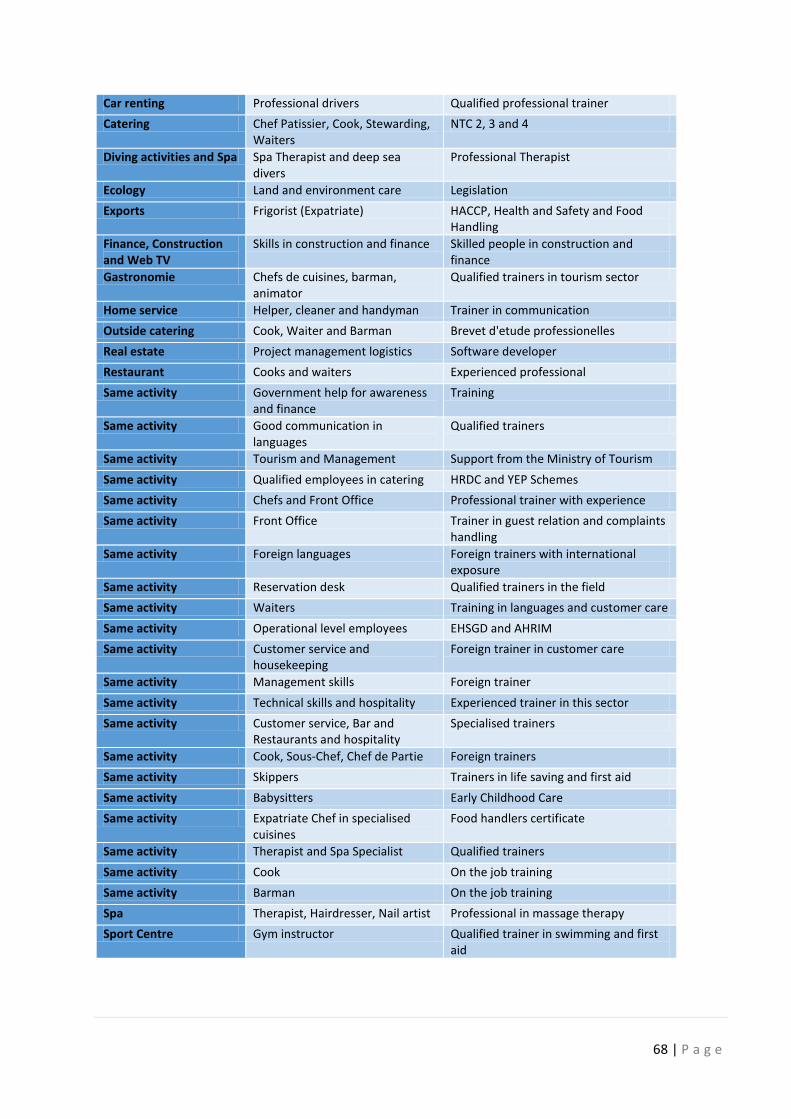
68 | P a g e
Car renting Professional drivers Qualified professional trainer
Catering Chef Patissier, Cook, Stewarding, Waiters
NTC 2, 3 and 4
Diving activities and Spa Spa Therapist and deep sea divers
Professional Therapist
Ecology Land and environment care Legislation
Exports Frigorist (Expatriate) HACCP, Health and Safety and Food Handling
Finance, Construction and Web TV
Skills in construction and finance Skilled people in construction and finance
Gastronomie Chefs de cuisines, barman, animator
Qualified trainers in tourism sector
Home service Helper, cleaner and handyman Trainer in communication
Outside catering Cook, Waiter and Barman Brevet d'etude professionelles
Real estate Project management logistics Software developer
Restaurant Cooks and waiters Experienced professional
Same activity Government help for awareness and finance
Training
Same activity Good communication in languages
Qualified trainers
Same activity Tourism and Management Support from the Ministry of Tourism
Same activity Qualified employees in catering HRDC and YEP Schemes
Same activity Chefs and Front Office Professional trainer with experience
Same activity Front Office Trainer in guest relation and complaints handling
Same activity Foreign languages Foreign trainers with international exposure
Same activity Reservation desk Qualified trainers in the field
Same activity Waiters Training in languages and customer care
Same activity Operational level employees EHSGD and AHRIM
Same activity Customer service and housekeeping
Foreign trainer in customer care
Same activity Management skills Foreign trainer
Same activity Technical skills and hospitality Experienced trainer in this sector
Same activity Customer service, Bar and Restaurants and hospitality
Specialised trainers
Same activity Cook, Sous-Chef, Chef de Partie Foreign trainers
Same activity Skippers Trainers in life saving and first aid
Same activity Babysitters Early Childhood Care
Same activity Expatriate Chef in specialised cuisines
Food handlers certificate
Same activity Therapist and Spa Specialist Qualified trainers
Same activity Cook On the job training
Same activity Barman On the job training
Spa Therapist, Hairdresser, Nail artist Professional in massage therapy
Sport Centre Gym instructor Qualified trainer in swimming and first aid

69 | P a g e
3.5 FUTURE VACANCIES
When it comes to vacancies, from the survey, it was found that there were 892 short-term vacancies
for the different occupational groups as presented in
Table 31. It was noticed that around 70 percent of the vacancies were for the occupational group
“Service and sales workers”.
Table 31: Vacancies as per occupational groups for the sample
Occupational groups No of current
vacancies (n=132)
No. of vacancies in the
short term (n=132)
Managers 22 25
Professionals 47 54
Technicians and associate professionals 2 4
Clerical support workers 18 65
Service and sales workers 315 630
Skilled agricultural, forestry and fishery workers 1 19
Craft and related trades workers 3 4
Plant and machine operators and assemblers 0 8
Elementary occupations 59 83
T0TAL 392 892
Figure 23: Vacancies in the short-term
The tourism sector, just like many other sectors, is facing difficulty to recruit people for certain
occupations. The survey has tried to find out the most in-demand occupations for the sector. For
this question, respondents enumerated the six most occupations where they were facing difficulties
2%6%
1%7%
71%
2% 1% 1%
9%
0%
10%
20%
30%
40%
50%
60%
70%
80%
Managers Professionals Techniciansand associateprofessionals
Clericalsupportworkers
Service andsales workers
Skilledagricultural,forestry and
fisheryworkers
Craft andrelatedtrades
workers
Plant andmachine
operatorsand
assemblers
Elementaryoccupations
Pe
rce
nta
ge

70 | P a g e
to recruit people and all the occupations have been compiled and presented in Table 32. The jobs
listed by respondents are both sector specific and also ‘generic’ jobs.
Table 32: Most in-demand occupations
Occupations Occupations
Waiter Accounts officer
Cook Analyst, job
Housekeeper Animateur
Barman Assistant front office manager
Chef Assistant manager
Receptionist Baker, pastry-cooks and confectionery makers
Steward Beach attendant
Administrative officer Butler
Handyman Carpenter
Fast food operator Catering officer
Front office worker Crew member
Accountant Delivery boy
General manager Digital marketing specialist
Guest relation officer Diver, aquatic products
Guide Electrical technician
Helper, kitchen Engineer
Sales representative Finance administrator
Skipper, boat Frigoboy
Barrista Gardener
Cashier Human resource officer
Clerk IT Professional
Housekeeping assistant Labourer, forestry
HR manager Marketing assistant
Maintenance officer Mason
Secretary Nail artist
Security officer Network Administrator
Training Manager Plumber
Cleaner Public area attendant
Customer service officer Restaurant Manager
Driver Shift manager
Food and Beverage executive Spa therapist
Maid Supply delivery manager
Maintenance supervisor Support manager
Marketing officer Translator
php developper Veterinarian
Public relations officer Web designers
Search engine optimization officer Web developper

71 | P a g e
Sports coaches Welder
Technician
3.6 TOP SKILLS IN DEMAND IN NEXT 5 YEARS
One of the question in the survey was related to scarce skills and difficulties employers were having
to fill the scarce skills for the coming 5 years. Respondents were requested to prioritise the scarce
skills where they would be having difficulties to recruit. The top 6 skills in demand in the Tourism
and Hospitality sector as ranked by the respondents were as follows:
‘Good communication skills (spoken, written and presentation)’
‘Team work’
‘Ability to work methodically (organisation and planning skills)’
‘Customer handling skills’
‘Good attitude
‘Ability to learn’
It was seen from the responses that employers were putting more emphasis on “soft skills” as
compared to technical skills. The six most skills in demand for the sector are presented in Table 33.
Table 33: Six most skills in demand for the sector
Most preferred skills demand for the next 5 years (n=132) Percentage of respondents
Good communication skills (spoken, written and presentation) 60
Team work 56
Ability to work methodically (organisation and planning skills) 47
Customer handling skills 45
Good attitude 42
Ability to learn 40
Respondents also enumerated the fields and related subjects for the sector where education and
training institutions should focus upon in the medium term (in the next 5 years) and this is presented
in Table 34.
Table 34: Skills requirements and subjects/fields for the sector
Skills requirements Subjects/Fields
Communication skills Languages, business communication, complaints handling
Customer service/Public relation Sales techniques, languages, communication

72 | P a g e
Foreign language German, Italian, Mandarin, Russian, Italian, Spanish
Creativity, innovation and team work Relevant training
Emotional intelligence Relevant training
Hospitality Tourism and hospitality
IT skills IT courses
Analytical and organizational skill Tourism management
Basic skills to analyse financial statement Accounting and finance
Chinese cuisine Chinese cooking
Culinary skill Culinary course
Marketing skill Commerce, marketing and business modules
Basic knowledge of electrical appliances Electrical
International and local culture History and geography
Restaurant and bar services Food and beverage modules
Service housekeeping Housekeeping
Administrative skills Management and accountancy
Geographical skill History and geography
Night Auditing Accounting
Spa and massage Anatomy
Sports and wellness Physical education
Cashier skills Accounting
First aid and lifesaving skills First aid and lifesaving
Health and safety Health and safety modules
Project management Management
Soft skills Communication
Veterinary and animal care Biology
3.7 INDUSTRY - EDUCATION LINKAGES
3.7.1 STATUS OF LINKAGES OF ENTERPRISES WITH THE EDUCATION SYSTEM
On the question of linkages between enterprises and educational institutions, with the exception of
TVET, between 64 to 76 percent of respondents said that they had no intention to get involved with
educational institutions. 44 percent of respondents said that they were linked with TVET institutions
and this is comprehensible given the nature of the industry where the majority of employees are in
the occupational group of “Service and Sales Workers”. Alarmingly, it is worth noting that more
than one third (37 percent) of respondents also pointed out that they had no intention to link up with
TVET institutions.
From these responses, it can be concluded that the industry is more or less detached from training
providers as a significant percentages of enterprises are not linking up with TVET providers. This

73 | P a g e
should not have been the case given the fact that the nature and composition of the workforce for
the sector, TVET should have been a prime partner for enterprises. This raises the questions of
whether enterprises are satisfied with the quality of TVET training, whether from public or private
centres, or enterprises are not regarding training as a prime element in their development. The
detailed results are shown in Figure 24.
Figure 24: Percentage of enterprises linked of with schools, TVET, professional bodies or universities.
3.7.2 ENTERPRISE AFFILIATIONS
When it comes to membership of associations/councils locally or internationally, less than half of
the organisations surveyed (45 percent) said that they were members of an association/council
locally or internationally. This is shown in Figure 25.
Figure 25: Whether establishment is a member of any industry associations/councils (local or international) (n=132)
14 15
44
14
28
10
21 1915
9
76
64
37
71
65
0
10
20
30
40
50
60
70
80
Primary School Secondary School TVET Professional bodies(e.g. ACCA)
Universities (Only77% answered this
section)
Per
cen
tage
Yes we have No – but plan to do so in the near future No intention of getting involved
45% 44%
11%
Yes No Don't Know
0%
10%
20%
30%
40%
50%

74 | P a g e
For those organisations who were members of associations/councils locally or internationally, the
following associations/councils were named as shown in Table 35.
Table 35: Membership of respondents (n=59)
Associations Number
AHRIM 22
Business Mauritius 10
Both AHRIM and Business Mauritius 7
Tourism Welfare Fund 6
Mauritius Tourism Promotion Authority 4
Ex Small and Medium Enterprise Development Authority 4
Association of Inbound Operators (Mauritius) 3
Mauritius Chamber of Commerce and Industry 2
Association of Tourism Professionals 1
TOTAL 59
The majority of organizations forming part of associations/councils locally or internationally were
satisfied with their membership as 83 percent of them claimed that they did benefit some skills
development opportunities, as shown in Figure 26.
Figure 26: Do you benefit through membership from any skills development opportunities (n = 60)
3.7.3 SKILLS DEVELOPMENT INITIATIVES
Respondents were surveyed on their willingness to participate in skills development initiatives
either individually or as part of the industry. The result is presented in Figure 16. In general, based
on the different initiatives listed, it was found that enterprises surveyed were not participating in
skills development initiatives either individually or as part of the industry. It was found that on
average, between 45 to 70 percent of enterprises were not participating at all in the different
programmes/initiatives which existed. For those willing to participate, this varied according to the
different programmes/initiatives which existed. It was found that 57 percent were willing to provide
83%
17%
0%
20%
40%
60%
80%
100%
Yes No

75 | P a g e
placement for students and 49 percent were keen on the apprenticeship schemes. The detailed
responses are presented in Figure 27.

76 | P a g e
Figure 27: Participation of enterprises in skills development initiatives
27 27
14
7
57
29
23
8
37
14
20
15
9
1513
49
12
1719
13
2017
14
23
17
2123
1619
24 24
1512
79 10
03
811
14
2
68 8 9
5
49 49
58
70
23
51
5558
45
61
55
63 64
5254
31
0
10
20
30
40
50
60
70
80
Spo
nso
r St
ud
en
ts /
Sch
ola
rsh
ip in
sp
ecif
ic a
reas
re
late
d t
o t
he
bu
sin
ess
of
the
est
ablis
hm
en
t
Gra
du
ates
Rec
ruit
me
nt
Pro
gram
mes
Par
tici
pat
e in
TV
ET/
Un
iver
sity
Ad
viso
ry B
oar
ds
Par
tici
pat
e in
Co
urs
e D
esig
n o
f ed
uca
tio
n in
stit
uti
on
Pro
vid
e p
lace
me
nt
to s
tud
en
ts
Pro
vid
e in
du
stry
vis
its
for
stu
den
ts (
dem
on
stra
te la
test
eq
uip
me
nt
and
pro
cess
es)
Pro
vid
e re
al li
fe p
roje
cts
and
re
sou
rces
fo
r st
ud
en
ts t
o w
ork
up
on
Par
tne
rin
g in
re
sear
ch a
nd
inn
ova
tio
n
Par
tici
pat
ion
in C
are
ers
eve
nts
(C
are
er t
alks
)
Pro
vid
e yo
ur
staf
f as
tra
iner
(TV
ET/U
niv
ersi
ty)
Emp
loye
es a
s st
ud
en
t m
ento
rs
Du
al t
rain
ing
pro
gram
me
s
Off
er
TVET
/Un
ive
rsit
y fa
cilit
ies
for
ind
ust
ry p
urp
ose
s (e
spe
cial
ly f
or
SMEs
)
Sect
or
Skill
s D
eve
lop
men
t Sc
hem
e
Iden
tifi
cati
on
of
skill
s n
eed
s at
se
cto
r le
vel
Ap
pre
nti
cesh
ips
Sch
em
es
Per
cen
tage
Already participating
Willing to participate individually
Willing to participate as part of an industry association
None

77 | P a g e
3.7.4 BARRIERS TO BUILD LINKS WITH EDUCATION AND TRAINING PROVIDERS
The survey revealed that there exist some barriers for enterprises to build links with the education
and training providers. As presented in Figure 28, 28 percent of respondents said that lack of
resources (e.g space, staff) was the main barrier. 24 percent said that there is also a lack of
administrative flexibility to build links with the education and training providers. The detailed
responses are presented in Figure 28.
Figure 28: Major barriers to build links with education and training providers
3.8 SKILLS DEVELOPMENT
3.8.1 DIFFICULTIES IN TRAINING EMPLOYEES
Training of employees has always been a daunting challenge for a number of employers. The
respondents have highlighted the different difficulties that they usually face while training their
employees. It should be noted that 29 percent of respondents said that they were not encountering
any problems. The remaining 71 percent provided the different reasons where they were having
28%
24%
20%
14%13% 13%
12%
9%
5%
30%
Lack
of
reso
urc
es
(e.g
. sp
ace
, sta
ff.)
Lack
of
adm
inis
trat
ive
fle
xib
ility
No
t in
lin
e w
ith
cu
ltu
re/p
olic
y o
f o
ur
esta
blis
hm
en
t
Dif
ficu
lty
fitt
ing
in w
ith
th
e e
du
cati
on
al in
stit
uti
on
’s
tim
eta
ble
We
are
will
ing
bu
t w
e d
on
’t k
no
w h
ow
to
co
ntr
ibu
te
Imp
rop
er
pla
nn
ing
by
edu
cati
on
an
d t
rain
ing
inst
itu
tio
ns
Lack
of
fisc
al i
nce
nti
ves
to
est
ablis
h li
nks
Edu
cati
on
al a
nd
tra
inin
g p
rovi
der
s a
re n
ot
inte
rest
ed
He
alth
, saf
ety
and
/or
regu
lato
ry c
on
stra
ints
to
acco
mm
od
ate
stu
den
ts
Oth
ers
Per
cen
tage
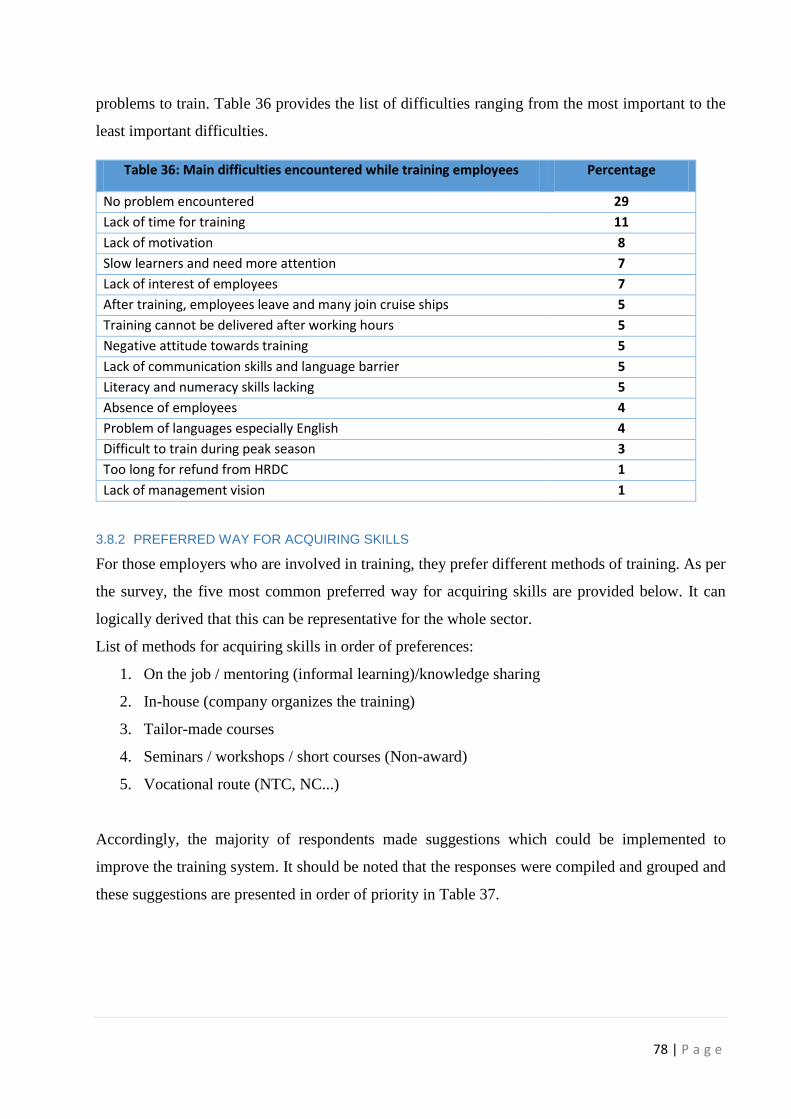
78 | P a g e
problems to train. Table 36 provides the list of difficulties ranging from the most important to the
least important difficulties.
Table 36: Main difficulties encountered while training employees Percentage
No problem encountered 29
Lack of time for training 11
Lack of motivation 8
Slow learners and need more attention 7
Lack of interest of employees 7
After training, employees leave and many join cruise ships 5
Training cannot be delivered after working hours 5
Negative attitude towards training 5
Lack of communication skills and language barrier 5
Literacy and numeracy skills lacking 5
Absence of employees 4
Problem of languages especially English 4
Difficult to train during peak season 3
Too long for refund from HRDC 1
Lack of management vision 1
3.8.2 PREFERRED WAY FOR ACQUIRING SKILLS
For those employers who are involved in training, they prefer different methods of training. As per
the survey, the five most common preferred way for acquiring skills are provided below. It can
logically derived that this can be representative for the whole sector.
List of methods for acquiring skills in order of preferences:
1. On the job / mentoring (informal learning)/knowledge sharing
2. In-house (company organizes the training)
3. Tailor-made courses
4. Seminars / workshops / short courses (Non-award)
5. Vocational route (NTC, NC...)
Accordingly, the majority of respondents made suggestions which could be implemented to
improve the training system. It should be noted that the responses were compiled and grouped and
these suggestions are presented in order of priority in Table 37.

79 | P a g e
Table 37: Measures to improve training
More professional trainers and institutions are required
Change the mentality/attitude of employers/employees towards training
Training should be updated with the requirement of the job market
Training should be more tailor made and in-house training
Training institutions should focus and put more emphasis on soft skills
All process/procedure should be more flexible and friendly
Need to have an awareness campaign to promote training among employers
More tailor made courses for the sector and on-the-job training
Need to have more experienced and qualified trainers
Training should be more technical rather than academic
Need for more financial and technical support from the government
Need to promote specialised training for certain fields
Provide more resources/incentives for employers and employees
Review the Levy System and increase grant level for certain items like overseas training
Trainers from public institutions need to visit and collaborate with employers/organisations
Necessity to provide training opportunity for school leavers/freshers
Enterprises should provide more training facilities
More practical training should be encouraged
More career guidance services should be provided
Need to develop TNAs to identify training gaps
Government must make training compulsory in every sector of activity
HRDC and training centres are already facilitating training which is benefiting employers
Training refund process should be quicker
More incentives for trainees
More communication between the government and enterprises
Provide incentives for skilled/retired persons to train
Need to install continuous learning in enterprises
All companies should have their own in-house trainer
Need to have a training best practice for the sector
There should be more focus on professional work ethics and discipline
Training centres should be more accessible
3.8.3 STEM9 AND OTHER SKILLS
In the survey, there was a question whereby respondents were asked whether they were aware of
STEM and STEM skills. It was found that 91 percent of respondents were not aware of STEM and
STEM skills as shown in Figure 29.
9 STEM SKILLS: are defined as those skills “expected to be held by people with a tertiary-education level degree in the subjects of science, technology, engineering and maths” (STEM). These skills include “numeracy and the ability to generate, understand and analyse empirical data including critical analysis; an understanding of scientific and mathematical principles; the ability to apply a systematic and critical assessment of complex problems with an emphasis on solving them and applying the theoretical knowledge of the subject to practical problems; the ability to communicate scientific issues to stakeholders and others; ingenuity, logical reasoning and practical intelligence”.

80 | P a g e
Figure 29: Awareness for the STEM skills (n=132)
When respondents were explained the meaning and significance of STEM skills, 45 percent of
respondents then said that STEM skills were somewhat important for their establishments. 27
percent added that it was very important. The results are shown in Figure 30.
Figure 30: Importance of STEM as per establishments (n=132)
Having recognised the importance of skills, to promote the acquisition of STEM skills, various
measures can be taken at different levels. The different measures proposed and thus preferred by
respondents are presented in Figure 31. Nearly half of the respondents (48 percent) preferred
“government should recruit and retain more specialist teachers” and “more STEM apprenticeship”
as measures to promote STEM skills. Surprisingly, only 14 percent of respondents said that “making
mathematics compulsory at ‘A’ level” is a measure which can promote STEM skills.
STEM EDUCATION: is an interdisciplinary approach to learning where rigorous academic concepts are coupled with real-world lessons as students apply science, technology, engineering, and mathematics in contexts that make connections between school, community, work, and the global enterprise enabling the development of STEM literacy and with it the ability to compete in the new economy. (Tsupros, 2009).
5%
91%
4%
Yes No Don't Know
14
45
27
14
0
10
20
30
40
50
Not important at all Somewhat important Very important Not applicable
Pe
rce
nta
ge

81 | P a g e
Figure 31: Measures to be taken to promote acquisition of STEM skills
3.8.4 LANGUAGES
Given the nature of the sector, the importance of foreign languages is something vital for the sector.
As rightly pointed out in the survey, 78 percent of respondents said that foreign languages are
important for the sector, as shown in Figure 32.
Figure 32: Importance of foreign language in establishments (n=132)
48 4846
38
3330
27 26 25 2422 21
1917
14
0
10
20
30
40
50
60
Go
vern
men
t sh
ou
ld r
ecru
it a
nd
ret
ain
mo
re s
pec
ialis
tte
ach
ers
Mo
re S
TEM
ap
pre
nti
cesh
ips
Incr
ease
th
e en
rolm
ent
in S
TEM
su
bje
cts
at s
eco
nd
ary
leve
l
Go
vern
men
t sh
ou
ld p
rote
ct f
un
din
g fo
r ST
EM in
hig
her
edu
cati
on
Bu
sin
esse
s sh
ou
ld p
rovi
de
mo
re h
igh
-qu
alit
y w
ork
pla
cem
ents
Fost
er le
arn
ing
of
STEM
su
bje
cts
at u
niv
ersi
ty le
vel
Incr
ease
pu
blic
sch
ola
rsh
ip f
or
STEM
su
bje
cts
at u
niv
ersi
tyle
vel
Rel
ate
the
teac
hin
g o
f ST
EM s
ub
ject
s to
tec
hn
olo
gy
Emp
loye
es s
ho
uld
be
enco
ura
ged
to
bec
om
e ST
EMam
bas
sad
ors
Bu
sin
esse
s sh
ou
ld e
nga
ge w
ith
sch
oo
ls t
o e
nth
use
pu
pils
abo
ut
STEM
stu
dy
Clo
ser
wo
rkin
g re
lati
on
ship
bet
wee
n b
usi
nes
ses
and
un
iver
siti
es t
o d
evel
op
bu
sin
ess-
rele
van
t ST
EM c
ou
rses
Bu
sin
esse
s sh
ou
ld p
rovi
de
fin
anci
al in
cen
tive
s -
e.g
.sp
on
sors
hip
/ s
ign
-on
bo
nu
ses
for
grad
uat
e re
cru
its
Incr
ease
th
e at
trac
tive
nes
s o
f p
hys
ical
sci
ence
lear
nin
g at
pri
mar
y sc
ho
ol l
evel
Priv
ate
ente
rpri
ses
to p
rovi
de
STEM
sch
ola
rsh
ip a
tu
niv
ersi
ty le
vel
Mak
ing
Mat
hem
atic
s a
com
pu
lso
ry s
ub
ject
at
‘A’ L
eve
l
Pe
ren
tage
78%
22%
0%
20%
40%
60%
80%
100%
Yes No
Per
cen
tage
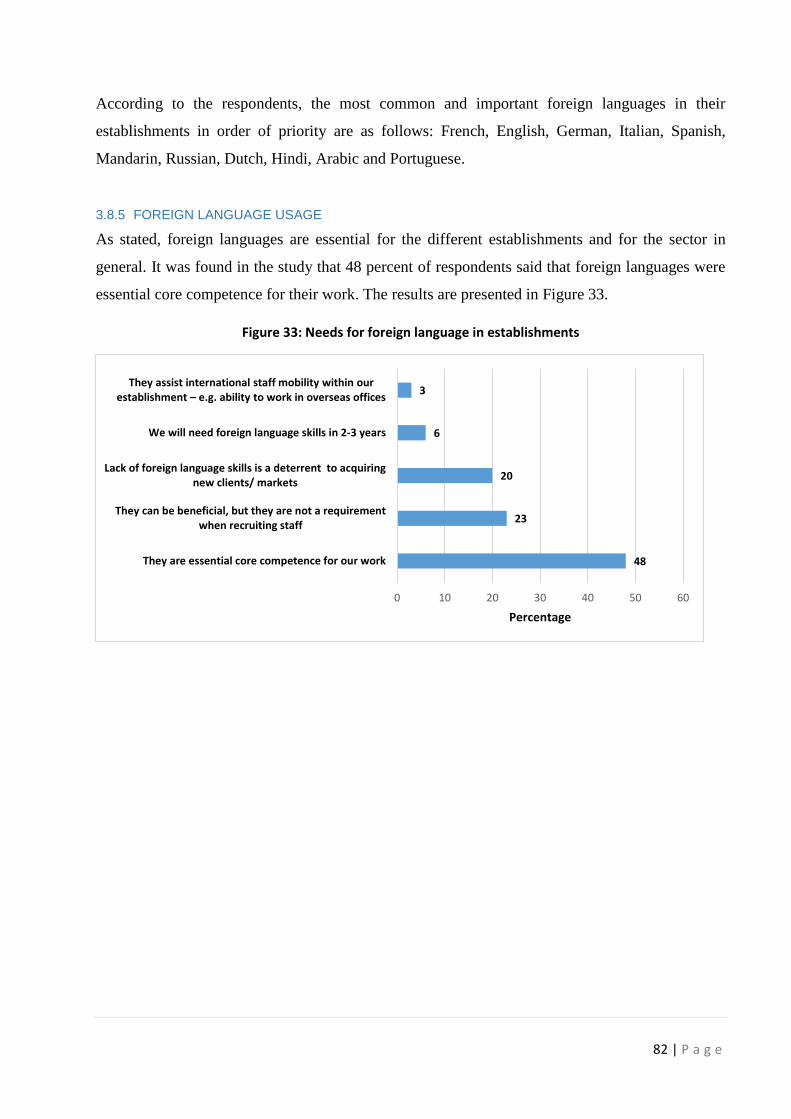
82 | P a g e
According to the respondents, the most common and important foreign languages in their
establishments in order of priority are as follows: French, English, German, Italian, Spanish,
Mandarin, Russian, Dutch, Hindi, Arabic and Portuguese.
3.8.5 FOREIGN LANGUAGE USAGE
As stated, foreign languages are essential for the different establishments and for the sector in
general. It was found in the study that 48 percent of respondents said that foreign languages were
essential core competence for their work. The results are presented in Figure 33.
Figure 33: Needs for foreign language in establishments
48
23
20
6
3
0 10 20 30 40 50 60
They are essential core competence for our work
They can be beneficial, but they are not a requirementwhen recruiting staff
Lack of foreign language skills is a deterrent to acquiringnew clients/ markets
We will need foreign language skills in 2-3 years
They assist international staff mobility within our establishment – e.g. ability to work in overseas offices
Percentage
83 | P a g e
3.9 SKILLS BAROMETER
3.9.1 GAUGING THE LEVEL OF SKILLS MISMATCH IN ENTERPRISES
The last part of the survey aimed at gauging the level of mismatch among enterprises of the Tourism
and Hospitality sector. This exercise was not an easy task as it was to measure the complex issue of
mismatch. Nevertheless, for the purpose of this study, mismatch was measured at 3 levels, namely,
Skill level (vertical) - that is, over-skilled or under-skilled; Qualification level (vertical) - that is,
overqualified10 or underqualified; and Skills obsolescence. Each of those terms were defined in the
questionnaire to ensure uniformity of understanding among employers.
In order to be able to gauge the level of mismatch amongst the employees of the Tourism and
Hospitality sector, it was important to capture the data at each occupational group level. The issue
of skills mismatch has been widely discussed and debated by employers throughout all sectors of
the economy. This is a phenomenon which is present in all countries and various measures are
adopted to tackle the mismatch level. From the survey, it was found that the degree of mismatch
vary from one occupational group to another. In Figure 34, the qualification level and skill level
mismatch of employee has been presented.
It was seen that for the occupational groups ‘Elementary occupations’ and ‘Plant and machine
operators and assemblers’, more than half of the employers said that there was no mismatch in terms
of qualification and skill level of their employees. For ‘Managers’ and ‘Professionals’ more that 20
percent of respondents said that there was no mismatch in terms of skills and qualifications. In
general, the element of mismatch of skills and qualifications, according to respondents seems to be
moderate. As presented in Figure 34, the mismatch level depend on the occupational groups. The
results also pointed out that there was no serious mismatch level for all occupational groups with
the exception of ‘Elementary occupations’ in terms of qualifications.
10 OVER-QUALIFICATION: A situation in which an individual has a level of qualification higher than that required by their current job
(Cedefop, 2010b). UNDER-QUALIFICATION: A situation in which an individual has a lower qualification level than that required by their current job (Cedefop, 2010b). OVER-SKILLING: A situation in which an individual is not able to fully utilise his or her skills and abilities in their current job (Cedefop, 2010b). UNDER-SKILLING: A situation in which an individual lacks the skills and abilities necessary to perform to acceptable standards in their current job (Cedefop, 2010b). SKILL OBSOLESCENCE: Skill obsolescence refers to the situation in which skills are no longer demanded or useful in the labour market (economic skill obsolescence) or the decay of skills resulting from lack of use (technical skill obsolescence) (DTI et al, 2010).
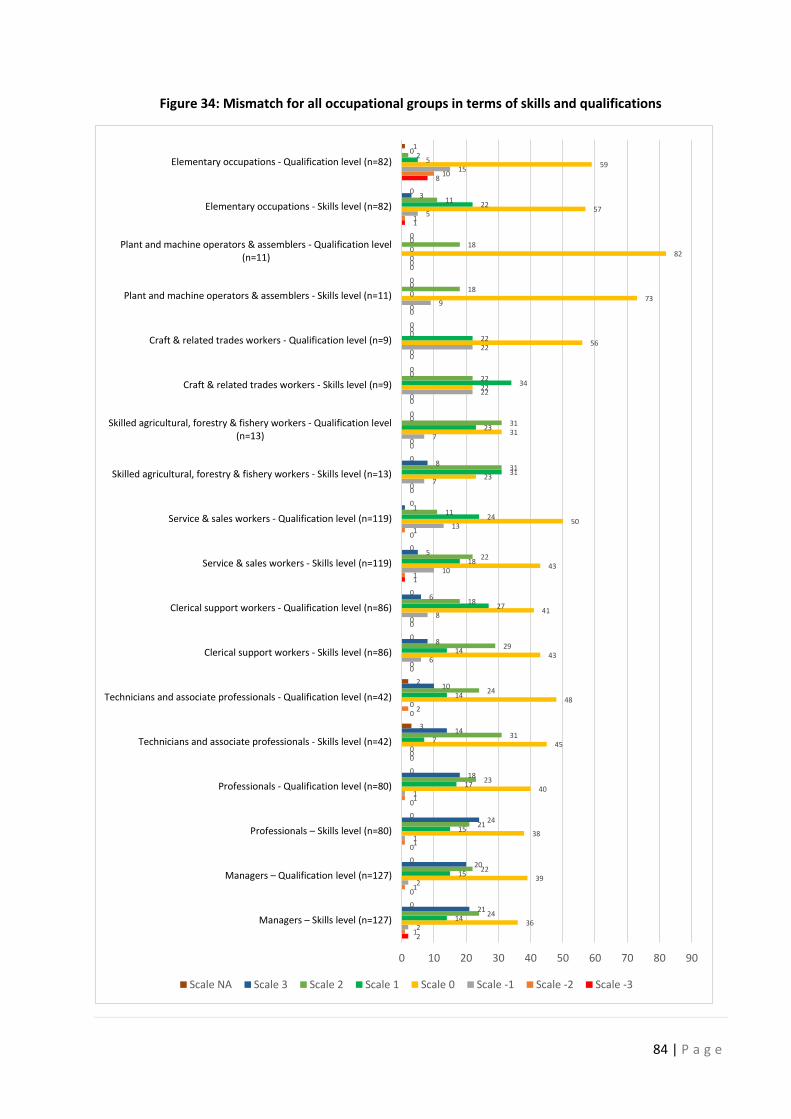
84 | P a g e
Figure 34: Mismatch for all occupational groups in terms of skills and qualifications
2
0
0
0
0
0
0
0
1
0
0
0
0
0
0
0
1
8
1
1
1
1
0
2
0
0
1
1
0
0
0
0
0
0
1
10
2
2
1
1
0
0
6
8
10
13
7
7
22
22
9
0
5
15
36
39
38
40
45
48
43
41
43
50
23
31
22
56
73
82
57
59
14
15
15
17
7
14
14
27
18
24
31
23
34
22
0
0
22
5
24
22
21
23
31
24
29
18
22
11
31
31
22
0
18
18
11
2
21
20
24
18
14
10
8
6
5
1
8
0
0
0
0
0
3
0
0
0
0
0
3
2
0
0
0
0
0
0
0
0
0
0
0
1
0 10 20 30 40 50 60 70 80 90
Managers – Skills level (n=127)
Managers – Qualification level (n=127)
Professionals – Skills level (n=80)
Professionals - Qualification level (n=80)
Technicians and associate professionals - Skills level (n=42)
Technicians and associate professionals - Qualification level (n=42)
Clerical support workers - Skills level (n=86)
Clerical support workers - Qualification level (n=86)
Service & sales workers - Skills level (n=119)
Service & sales workers - Qualification level (n=119)
Skilled agricultural, forestry & fishery workers - Skills level (n=13)
Skilled agricultural, forestry & fishery workers - Qualification level(n=13)
Craft & related trades workers - Skills level (n=9)
Craft & related trades workers - Qualification level (n=9)
Plant and machine operators & assemblers - Skills level (n=11)
Plant and machine operators & assemblers - Qualification level(n=11)
Elementary occupations - Skills level (n=82)
Elementary occupations - Qualification level (n=82)
Scale NA Scale 3 Scale 2 Scale 1 Scale 0 Scale -1 Scale -2 Scale -3

85 | P a g e
Regarding the obsolescence of skills for the different occupational groups, between 64 to 81 percent
of respondents said that for all occupational groups, respondents said that there were no skills
obsolescence, as presented in Figure 35. However, for most of the occupational groups, between 10
to 18 percent of respondents pointed out that there were a small degree of skills obsolescence.
Figure 35: Skills obsolescence as per occupational groups
3.10 SKILLS SHORTAGE
In terms of skills level, for the occupational group of ‘Managers’, 52 percent said that there were
no shortages at all. In addition, almost one third of respondents (32 percent) pointed out that for
“Professionals” also there were no shortages. One third of respondents pointed out that they had
mild skill shortages for “Service and Sales Workers”. The detailed responses are presented in Figure
36. It should be noted that for ‘Skilled agricultural, forestry & fishery workers’, ‘Craft & related
trades workers’ and ‘Plant and machine operators & assemblers’, almost 90 percent of respondents
said that skills shortages were not applicable for these three occupational groups.
73 73
81
72 7469
78
64
72
10 115
1013 15
1118
119 11
2
129 8
0
9 107
410
5 38
11 95
1 1 2 1 1 0 0 0 2
0
10
20
30
40
50
60
70
80
90
Man
agers
Pro
fession
als
Tech
nician
s and
associate
pro
fessio
nals
Cle
rical sup
po
rt wo
rkers
Service
& sale
s wo
rkers
Skilled agricu
ltural, fo
restry
& fish
ery w
orke
rs
Craft &
related
trades
wo
rkers
Plan
t and
mach
ine
op
erators
& assem
ble
rs
Elem
en
tary occu
patio
ns
Scale 0 Scale 1 Scale 2 Scale 3 Scale NA
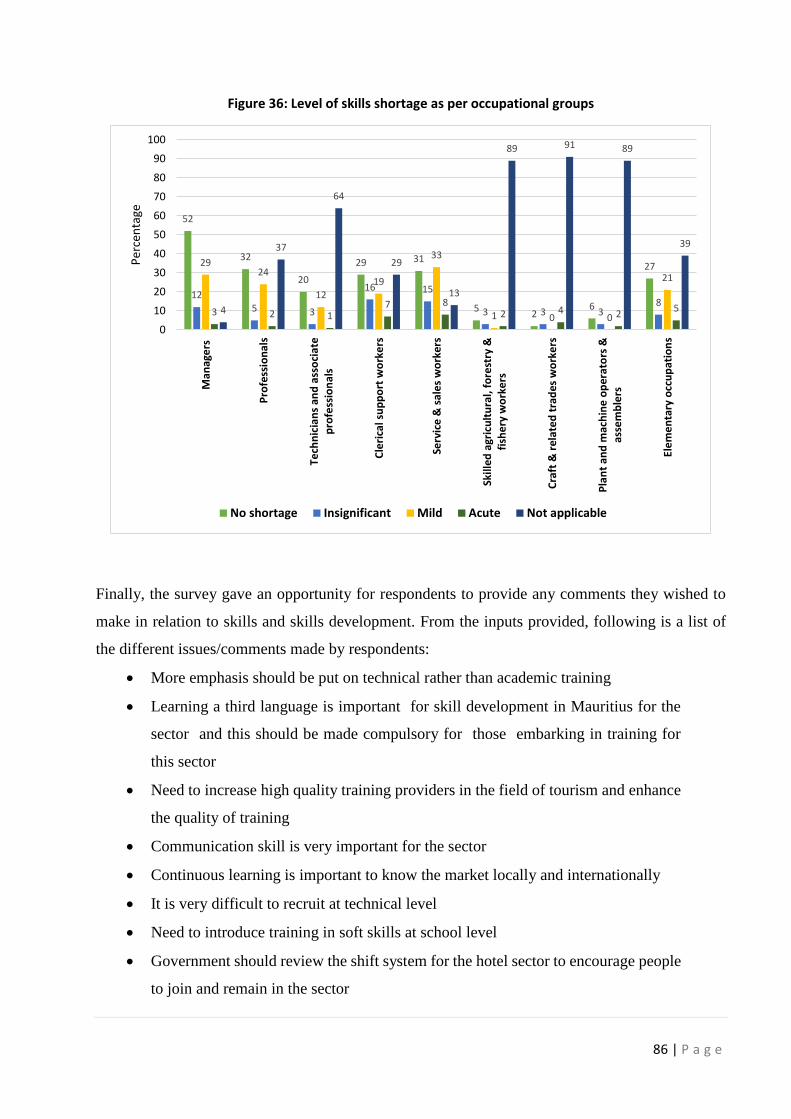
86 | P a g e
Figure 36: Level of skills shortage as per occupational groups
Finally, the survey gave an opportunity for respondents to provide any comments they wished to
make in relation to skills and skills development. From the inputs provided, following is a list of
the different issues/comments made by respondents:
More emphasis should be put on technical rather than academic training
Learning a third language is important for skill development in Mauritius for the
sector and this should be made compulsory for those embarking in training for
this sector
Need to increase high quality training providers in the field of tourism and enhance
the quality of training
Communication skill is very important for the sector
Continuous learning is important to know the market locally and internationally
It is very difficult to recruit at technical level
Need to introduce training in soft skills at school level
Government should review the shift system for the hotel sector to encourage people
to join and remain in the sector
52
32
20
29 31
52
6
27
125 3
16 15
3 3 38
2924
1219
33
1 0 0
21
3 2 17 8
2 4 254
37
64
29
13
89 91 89
39
0
10
20
30
40
50
60
70
80
90
100
Man
age
rs
Pro
fess
ion
als
Tech
nic
ian
s an
d a
sso
ciat
ep
rofe
ssio
nal
s
Cle
rica
l su
pp
ort
wo
rke
rs
Serv
ice
& s
ale
s w
ork
ers
Skill
ed a
gric
ult
ura
l, f
ore
stry
&fi
she
ry w
ork
ers
Cra
ft &
rel
ate
d t
rad
es w
ork
ers
Pla
nt
and
mac
hin
e o
per
ato
rs &
asse
mb
lers
Ele
me
nta
ry o
ccu
pat
ion
s
Per
cen
tage
No shortage Insignificant Mild Acute Not applicable
87 | P a g e
The training system should be reworked to meet local industry requirements
There is a mismatch of skills provided by secondary schools/universities and the
world of work
License to run training centers are provided too easily
Lack of motivation and seriousness from young people to learn
There is an acute lack of skilled workers for the sector in the country
Need to set up a proper career guidance service for all sectors
Lack of professional trainers
Need to address the problem of youth
Set up more specialised institutions for training
Learning should be more work-based for the sector especially at operational level
School leavers should be better prepared to join the world of work
For certain trades in the sector, people with low qualifications should be selected
and properly trained
Training for the sector should be more towards vocational and apprenticeship
Lack of technical, problem solving and decision making skills in youngsters
More emphasis should be placed on work ethics
Too much focus on the academic side in schools. ICT should be given more
importance
Not enough emphasis on the communication skills and multi-tasking

88 | P a g e
3.11 Qualitative Analysis
The survey has been devised in such a way that it reflects as far as possible the true nature of the
sector in terms of skills status. As mentioned, various statistical methods have been used including
face to face questionnaires to enable to get the maximum objective results. However, to supplement
the quantitative data collected, an exercise was carried out whereby qualitative face-to-face
interviews were conducted with key persons who are knowledgeable in the field. The interviews
were conducted with representatives of tourism industry associations, training providers and
professionals in the field. A focus group discussion was also conducted and those who participated
were employers’ representatives, public and private training providers and ministries. Throughout
the qualitative exercises, various issues were raised by respondents and these issues have been
regrouped under different headings for better clarity and administration.
Future of the sector
Through interviews or the focus group discussions, the general feeling among participants was that
the Tourism sector is enduring a good phase compared to the previous years where there was a
downturn due to economic crisis. The sector has picked up and this is reflected in the number of
arrivals. All the stakeholders, whether employers’ representatives or training providers were
optimistic about the future of the sector. All pointed out that tourist arrivals will increase which will
consequently bring an increase in the revenue and employment and the sector’s contribution to the
economy will increase.
Labour/employment
Throughout the qualitative interviews and the focus group discussions, the pertinent issue of labour
was raised. This issue was the main concern of employers as they were presently enduring
difficulties to recruit skilled labour. It was argued throughout the qualitative exercise that recruiting
people for the sector is becoming more and more difficult. The problem of recruitment according
to respondents were classified at three different level. Firstly, employers were not getting people to
work. Secondly, when people are available to work, getting the right people with the right skills and
attitudes was a problem. Finally, employers were also finding it difficult to retaining those people
as there is a high labour turnover in the sector especially for skilled employees. Furthermore, the
cruise is posing a huge challenge for employers in the sector as more and more people are leaving
for cruise ships.

89 | P a g e
Reorganising the institutional and legal set-up of the tourism sector
Among the issues raised throughout the qualitative surveys, the legal and institutional set-up were
highlighted by almost all respondents. It was proposed that the institutional and legal set up should
be organised on two different levels. The first level should be more concerned with the macro
aspects of the sector and this is where a public–private partnership should be promoted. At this
stage, the authorities, private sector together with strategists should work towards one common goal
of promoting the sector together with developing the necessary environment and enablers to
promote the sector.
Secondly, a better regulation of the tourism sector and the tourism related activities should be
undertaken by the authorities. Issues like Remuneration Orders for the sector should be addressed
pertaining to employees. Some legal set-up need to be developed and existing ones should be
amended to better fit the sector. Regulations should also be developed for training providers in terms
of quality of courses and trainers.
Tourism products and services
Another issue pointed out was in relation to the different sub-sectors and their products on offer for
tourists. Respondents agreed that there has been a growth of the different sub-sectors and
consequently their products have varied but still a lot has to be done. Today Mauritius is embarking
into green-tourism and eco-tourism and other allied services. There is a need to develop a proper
set-up as an enabler for locals to develop Mauritian products. A lot has been done in terms of
improvement in the business environment in some instances, however, new policies and strategies
need to be developed. The first thing that need to be done according to respondents is to train our
local entrepreneurs/craftsmen to develop local products whether handicrafts or services. Relevant
institutions should be empowered to develop local brands and if required, international expertise
should be solicited.
Branding/Image/security
The tourism sector worldwide is a very fragile sector when it comes to image. The success of the
industry worldwide depends on the image it projects for tourists abroad. Maintaining a good image
of the country in terms of political stability and security is very important. We have seen many
security issues in recent years where tourists have been attacked and robbed. Problems have arisen
in hotels and at sea. For the latter, skippers of boats need to be fully trained, attested and licensed

90 | P a g e
by the competent authority. Thus, a comprehensive programme for security for tourists should be
developed with the participation of all stakeholders. Respondents acknowledged that many good
initiatives and programmes exist but they are being carried out in isolation. Therefore, the sector
need to be branded continuously.
Training/skills development
In terms of services, Mauritius is renowned worldwide. The standard of services provided need to
be maintained and upgraded as our competitors have reached similar standard of services.
Employees in the sector need to be fully trained and carefully selected where a sense of
responsibility needs to be inculcated. Public and private training providers should enhance their
skills development capabilities and also train people for the future jobs. It is known that the majority
of employees in the sector work at the operational level. There were suggestions that all employers,
especially large and medium sized organisations should have a continuous development
programmes for their employees. Regular job analysis and TNSs should be conducted at the industry
level.
Cultural tourism and Mauritian product
Mauritius is blessed to have so many cultures and people of various origin. There are positive efforts
by the relevant institutions to promote the Mauritian culture abroad. However, according to
respondents, more need to be done as Mauritius has the potential to develop a strong cultural
tourism.

91 | P a g e
4. CONCLUSIONS AND RECOMMENDATIONS
This section provides a summary of the whole study and the conclusions derived there from. It also
gives some recommendations for the skills development for employees of the sector to consolidate
and further improve the sector.
The survey has provided interesting findings and a good indication of the sector in term of
employment, skills scarcity, skills development and skills needs. It also provided an opportunity for
respondents to express their concerns of skills development and skills shortages. There were various
salient issues which were identified which mainly related to employment, skills scarcity and training
amongst others.
As a generic observation, the sector was seen as an important economic contributor for the
Mauritian economy. In terms of GDP contribution, on average, the sector has contributed around 7
percent of the GDP over the past five years. In the year 2017, total earnings of the sector was
estimated to be 60.3 billion Mauritian rupees. The sector employs around 41600 employees directly
and 85000 indirectly according to some industry specialists. In terms of tourist arrivals, the number
of tourists has increased over the past years and in 2018, 1.4 million tourists were expected to visit
Mauritius.
To further boost the tourism sector and cater for its future growth in terms of arrivals, the Ministry
of Tourism came up with a Strategy Plan 2018-2021 for the sector. The main aims of the Strategy
Plan are to consolidate, diversify, modernise and sustain the competitiveness of the sector with key
initiatives and actions to be implemented. The Plan addresses the different threats of the sector and
also the different measures to address these threats.
As in many sectors, getting skilled workforce is a cause of concern for employers. One of the many
challenges of the sector is, even though the sector is employing more people, to attract employees
to work in the tourism sector. Also, one important challenge of the sector in terms of employment
is the cruise industry as many employees from hotels and hospitability are leaving and joining the
cruise sector.
92 | P a g e
For the study, there were respondents from 132 enterprises representing nine different sub-sectors.
In terms of the composition of the tourism sector workforce, given the nature of the sector, it was
found that the majority of employees were in the occupational group “Service and Sales Workers”
and its composition were more than 49 percent of the workforce for the sector which represent
around half of the workforce. When it comes to vacancies, nearly 85 percent of respondents stated
that they did recruit over the past two years and the majority of recruitment were for the occupational
group “Service and Sales Workers” and according to operators, this trend is expected to continue
in the future.
Figures from Statistics Mauritius show that the number of employees has continuously increased
over the years. The main reasons highlighted by the respondents for continued recruitment over the
years were mainly due to the expansion of the sector, labour turnover and many skilled employees
taking jobs in cruise ships.
When it comes to the future of sizes of enterprises, nearly 50 percent of respondents said that in
case business environment would remain the same in the future, their enterprises would remain the
same in terms of workforce. However, on a more optimistic note, it was found that nearly 40 percent
of enterprises said that even if the business environment remain the same, their workforce will
expand. More than 90 percent of respondents said that in case the business environment improves
in the future, their workforce will also expand or remain the same. This is a good indication that the
sector will keep on growing in terms of workforce and size unless the sector is hit by some
unforeseen circumstances.
In terms of educational background, the study revealed that, as expected, the vast majority of
employees have a secondary or TVET as educational background and respondents clearly indicated
that this would continue in the future. In terms of new recruitment also, it was found that most of
the new recruits had either a secondary or TVET as educational qualifications.
To keep the standard of the Mauritian hospitality, professionals and operators emphasised the
importance of training and development of the workforce. During the study, it was found that
employers were putting emphasis on skills development of their employees. Figures from the
HRDC Levy Grant Scheme show that the sector is the second biggest beneficiary in terms of

93 | P a g e
training refund. In addition, the different associations and the government are investing in various
skills development initiatives for the sector.
However, the survey also revealed that there was a sort of a “disconnect” between educational
institutions/training providers and the industry in terms of courses being provided and skills
required by the industry. One of the reasons stated by respondents was that the involvement of the
industry with the education institutions/training providers was low with the exception of TVET.
The different reasons put forward as to why employers were reluctant to participate in different
training initiatives were the relevancy of training programmes available were not as per the
requirement of employers. The quality of trainers and the cost of training were also mentioned as
deterrent for employers to get involved with educational institutions/training providers.
One important element highlighted by respondents and widely documented by operators is that on
average, employers were not too satisfied with trainings being provided by public TVET institutions
and few of the public universities. This has also been highlighted by different industry associations,
employers and professionals. The reasons put forward by the industry are that the relevance of some
courses are not as per actual industry demand. In addition, certain public institutions do not have
the necessary infrastructure and adequate manpower to cater for the new hospitability sector needs.
To cater for this lacunae of skills development, many employers who have the capability, have set
up their own training institutions to compensate for the lack of manpower and also to provide
industry/enterprise relevant courses for their needs. Also, employers were very much involved in
in-house training and on-the-job training.
The study also revealed that there were two initiatives which were highly common among
employers in the sector. These initiatives were providing ‘placement’ for new entrants in the job
market and participation in the ‘apprenticeship scheme’. These two initiatives have been successful
with the industry as training is conducted in a dual mode that is trainees/apprentices have the
opportunity to be at the workplace and also follow theoretical courses simultaneously.
Given the nature of the sector, one important finding of the study was with regards to foreign
languages. It was found that almost three-quarter of respondents said that foreign languages were
important for their establishments and for the sector as a whole. The fact that tourists are coming
94 | P a g e
from all continents to Mauritius, a knowledge of a third language is becoming imperative for
employees especially those working directly with tourists. The most in-demand languages beside
English and French are German, Italian, Spanish, Mandarin, Russian, Dutch and Arabic.
It was also revealed that there were mix responses in terms of future skills requirements and future
availability of skills for the sector. It was noticed that when it comes to planning for future labour
force of enterprises in terms of future skills demand and future jobs, employers did not have a clear
idea of their future needs in terms of numbers and skills requirements. This meant that employers
were unable to foresee the number of employees they would require in the medium and long term.
Adding to that, employers were not in a position to predict the future skills which would be required
for their enterprises. With the digitalisation of the sector, service delivery has changed and the study
has barely captured the future local needs of the sector in terms of jobs and skills.
4.1 RECOMMENDATIONS
The study gave the possibility to weight the sector in terms of its human capital strengths and
weaknesses. Issues addressed were mainly related to skills development and the future landscape
of skills for the sector. Like most of the sectors, this sector faces new challenges especially with
digitalisation and customer centeredness. The tourism sector in Mauritius is competing globally and
to survive at international level, the sector should be ready to face the fourth industrial revolution.
The configuration of customers for the sector has changed over the past decade. Firstly, we have
the traditional tourists coming from all over the world with specific demand. Secondly, nowadays,
we are having a local clientele also where Mauritians are increasingly enjoying our restaurants and
hotel resorts. This has led to an increase in the number of restaurants and local booking for hotels
by Mauritians.
It is found that there is a dearth of trained manpower in restaurants and hotels in the country to cater
to the ever increasing needs of both the domestic clientele and foreign tourists. Considering these
aspects various, short term open courses should be promoted both by private and public-funded
training institutions to equip the students with skills to involve in various tourism and hospitality
related activities. Enterprises should take advantage of the different governmental schemes for skills
development like the NSDP.

95 | P a g e
Training capacity in the fields of “restaurants and bar” and “culinary” should be doubled. Another
important element is that foreign languages should be introduce in all tourism related training
especially for front end trades. A system of ‘Foreign Language Proficiency Class’ should be set up
at the national level where everyone following tourism related courses should follow a certain
degree of foreign languages. This will equip trainees for easy communication with foreign tourists
and better services.
Review the recruitment strategies One of the major concern and challenge for the sector is to get enough skilled people to work. The
study has revealed that there exist vacancies at all occupational groups especially at the “Service
and Sales Workers” level and for certain jobs which are scarce. The tourism sector in Mauritius,
especially hotels, has traditionally operated and recruited skilled labour on a regional basis, that is,
hotels have usually employed people who live in the proximity of hotels. However, with time, the
number of people available in the vicinity of hotels and willing to work in the sector has decreased.
To address this issue, hotels need to re-think about their recruitment strategy. The “catchment
areas” in terms of recruitment for hotels should be extended so that people from different regions
can be reached by hotels. This can be achieved through an extension of the existing transportation
system for employees and the delocalisation of training centres. For the latter, training centres
should be made more accessible so that school leavers are encouraged to enrol for tourism related
fields.
Many associations of hotels are also proposing to recruit expatriates to cater for the lack of personnel
in the industry. However, this proposal should be carefully considered as bringing expatriates will
only solve the immediate operational problem of the sector. Mauritians are renowned for their
hospitability. There is the danger that by bringing expatriates with a different culture, especially at
the hospitability level, this could hurt the Mauritian “touch” in terms of hospitability. One
possibility which could be considered is to bring a limited number of expatriates for few trades for
short-term contract of three months during peak season. To decide on the limited short-term
contract, the industry through their associations should provide the numbers with justifications.
Another way to cater for the scarcity of employees in the sector could be to enrol foreign students
via exchange programmes for placement in the industry. Local training providers who are affiliated
96 | P a g e
with international training institutions could promote exchange programmes for certain fields and
for specific period.
Attracting fresh employees As mentioned, the tourism sector has two main issues which is affecting its labour force. Firstly,
there is the issue of attracting people to work in the sector and secondly, retaining those already in
the sector. Labour turnover is very high in the sector as many employees change employment within
the sector very often. There is also the problem of qualified and experienced employees leaving
local tourism sector and shifting to the more attractive cruise industry.
The different industry associations are putting much emphasis on promoting the sector to attract
people to work in the sector. This initiative has started some years back in schools. This effort
should continue. To have a constant supply of skilled labour for the sector, one of the main objective
of the different industry associations should be to increase enrolment in public and private training
centres in the field of tourism for coming years. Various strategies should be adopted to increase
enrolment in training centres. More concerted efforts need to be made for regular and aggressive
information campaigns by hotels and industry associations to showcase the sector. Some industry
associations are targeting certain secondary schools and this initiative should be extended to all
secondary schools in the future
It is also important to have information campaigns to show the reality of the sector in terms of
working hours and skills demand. One way of conducting the information campaigns is that hotels
should be more involved in the community. Besides providing jobs for people, hotels should adopt
an integrated community involvement in their proximity. This will encourage youth to join the
sector. Some hotels have started similar initiatives but these need to be extended to all regions.
Reduce the disconnect between industry and training providers The results of the study show that there is a “disconnect” between the industry and public and
private training providers. Many employers said that they had minimal links with training providers.
To bridge this “disconnect” both the sector/operators and training providers need to make an effort.
It is highly recommended that both stakeholders should sit together and find solutions on how to
reduce the “disconnect”. The end result should be that training should meet employers’ needs in
terms of their skills requirements.

97 | P a g e
One way to achieve this could be that employers/industry should be more involved in designing
training programmes. There should be a mechanism whereby industry needs in terms of skills and
numbers are communicated to training providers. Regular meetings between the industry and
training providers should be conducted. For this to become a reality, the different industry
associations/employers should take the lead to organise regular meetings with training providers.
Another mean of bridging this “disconnect” is that employers should put more emphasis on dual-
training, that is, employers should invest time in training by providing potential employees
opportunity to be trained and placed in their enterprises. The National Skills Development
Programme is an ideal pathway where employers engage with training providers to mount training
programmes and trainees are placed in enterprises. The NSDP has among its objectives to promote
dual-training where trainees are exposed to the world of work while learning.
Structured placement for trainees One of the findings of the study was that many employers are using the apprenticeship scheme and
job placements extensively. The apprenticeship scheme is a well-structured scheme which has been
in place for a number of years and usually there exist a coordination between the enterprises and
training providers. When it comes to training being provided by some private training providers
which include job placements, very often these placements have been seen as unstructured and there
are evidences that placements are being used as cheap labour by enterprises.
For the apprenticeship scheme and placement to really work, apprenticeship and job placement
should be more structured. Placements should be structured with well-defined learning outcomes
and tasks to be undertaken by trainees during placement. Each trainee should be accompanied and
mentored during placement. Regulatory bodies should ensure that theoretical programme are
accompanied by structured placement. Enterprises and training providers should take the
responsibility to structure courses and placement. As far as possible, placement should also be made
compulsory for courses approved by the relevant authorities.
Quality of training The tourism sector is a very dynamic sector in terms of its products and services. With constant
changes in the sector in terms of tourists demand, skills requirements and digitalisation, there is a
need to review the training system to meet the new requirements of the sector. Mauritius has always
been known for its warm welcome and quality products. However, it is important to realise that our

98 | P a g e
competitors have already reached the same level in terms of quality of services and products. What
should be aimed as a destination is to offer different products to tourists. This can only be achieved
through development of new products and services complemented with new skills of the employees.
Very often, it has been widely publicised that some public and private training providers in the
sector have been blamed for the unsatisfactory and sub-standard level of training they are providing.
On one hand, the industry blames training providers for not producing enough employees with up-
to-date skills and on the other hand, training providers blame the industry for not indicating their
skills demand so that courses could be mounted accordingly.
To tackle this situation, strict regulations should be developed and imposed on training providers
when designing training programmes. A training development framework/guideline should be
developed whereby all programmes developed should abide to it. Approval should be obtained only
when certain standards are met in terms of contents, infrastructure and qualification of trainers.
Licencing and renewal of trainers’ licence should not be granted based on qualification only. MQA
and the relevant authorities should be in a position to assess whether while applying for a trainer’s
licence, the person is capable to deliver training. For renewal of trainer’s licence, the relevant
authority should request that trainers show proof that they have conducted training while they were
registered. Train-the-trainer should also be made mandatory for all private registered trainers.
Industry- training providers linkages One of the important findings of the study was that employers were not willing to pair with public
training providers as the latter are not meeting employers’ expectations in terms of skills
requirements and training standard. As for private providers, employers are highlighting that the
level of training being provided is not to the satisfaction and needs of employers. Public and private
providers are still offering courses in “traditional” fields and there are very few providers who are
able to train people for future jobs/skills. This need to be changed as the industry should be able to
tell providers what new skills are required for different jobs and training should be based on future
skills requirements.
As per the requirement of the sector, design and delivery of training should be more geared towards
technical training with more emphasis on practical and industrial placement. One way of meeting
with the industry’s requirements is through partnering of local training providers with external

99 | P a g e
training providers. This will enhance the level of training and also provide new courses as per the
market needs. Where required and possible, local training providers should provide certification
courses and encourage National Certificate courses. As highlighted in the study, the majority of
employees in the sector have TVET as educational background and this will continue in the future.
Therefore more emphasis should be put on TVET education for the sector. New National
Certificates and Higher National Diplomas in different fields need to be added for a wider choice
for students. Course contents for university courses should also be adapted and regularly reviewed
so that it meets the industry demand.
Design of training programmes When it comes to the design of training programmes for the sector, it can be observed that most
training programmes are supply-driven, that is training contents are designed and marketed to
enterprises. The main drawback of such supply-driven courses is that in general, it does not meet
the skills requirement of enterprises. The best way to proceed for training design would be that
employers and training providers consult each other to design a programme with set objectives and
outcomes. As far as possible, employers and industry associations should encourage tailor-made
training programme. When applying for approval of training courses, one of the requirements
should be the justification by employers of the training through TNAs or a training plan.
Regarding the design of training programmes, it is highly recommended that two essential aspects
need to be considered. Firstly, employers should be more involved in designing training programme
and new modules like ‘soft skills’, ‘analytical skills’ and ‘communication skills’ need to be included
in trainings. Training programmes also need to be reviewed regularly, especially those at public
training providers. This can only be made possible through a close collaboration between the
industry and training providers. Secondly, given the nature of the industry where most of the
trainings are at technical level which include different trades, it is imperative that industrial
placement should be included for all training for the industry.
In addition, training schedule should be flexible to accommodate trainees who are already working
and who are willing to upgrade their skills. To go a step further, the validity of approved training
programmes should be limited for a specific number of months/years so that this limit training
providers from offering same training programmes for a number of years where the training contents
are no more in demand by the sector.
100 | P a g e
Regulation of training providers Training providers, whether private or public, play an important role in feeding the industry with
skilled people. Authorities should ensure that trainings which are being provided by both private
and public providers needs to be as per skill requirements of the market and employers’ needs.
Therefore, there is a need to ensure a quality assurance of all approved trainings to ensure that the
trainings are delivered as per the required standard. Trainers and training providers need to be
regularly monitored to maintain a minimum delivery standard. It is also recommended that fee-
paying courses which are delivered privately should be closely monitored in terms of its relevance,
content, trainers and facilities. Very often, people are following fee-paying courses delivered by
private institutions but are unable to get a job as the certificates. As far as possible, training with
certification should be encouraged by the industry and training providers should be empowered to
deliver certification courses.
Promotion of a culture of training among employees This sector is highly service-oriented and as mentioned before, more than three-quarter of the
employees in the sector work are at the operational level. The survival of the Mauritian tourism and
hospitality sector depend entirely on the quality of its services. For delivering high quality services,
the level of skills of the employees need to be high and need to be constantly upgraded. This could
be achieved if there is a culture of training in the sector whereby both the employees and employers
see training more as an investment rather than a cost. Training should be continuously provided to
employees as clients are becoming more demanding in terms of service delivery. There is also the
issue of tourists nowadays coming from ‘new markets’ which means new exigencies and new
cultures. Employees should be already trained to cater new markets and cultures.
Identification of new jobs/skills As all the sectors of the Mauritian economy, the tourism sector has also evolved in terms of its
customer base and workforce. Nowadays, tourists are visiting the country from all continents. The
sector has also evolved with technology where digitalisation has brought changes in the way
services are being offered. The technological changes have brought new jobs with new skills
needed. For example, mobile application developer for hotel booking and digital marketer are few
jobs which have emerged with technology. It is therefore important for the industry to identify new
emerging jobs and skills which will be required for the future and importantly to communicate these
jobs and skills to training providers. The latter are expected to develop courses/training programmes

101 | P a g e
to prepare the future employees. Employers need also to be prepared to invest more on certain types
of “scarce skills”. Even though it is difficult, it is vital to identify those jobs/skills in advance.
Importance of foreign languages The study has revealed that for this sector, a third language is important for employees especially
for those involved directly with customers. Therefore, it is highly recommended that beside English
and French, a third language should be included for students studying tourism related subjects and
for certain courses, this should be made compulsory. A third language is also recommended at
secondary school level and by introducing a third language at secondary school level, beside the
tourism and hospitality sector, all other sectors of the economy will also benefit.
Government initiatives should be more sector-based/targeted The Government has come up with many programmes to promote skills development for different
sectors. However, the different programmes should be more focused and targeted as each sector has
his own specificities. The government should in collaboration with industry associations mount
sector specific programmes with specific targets. A targeted skills-development approach will
certainly help to address skills issues for the sector.
Various initiatives have been put in place to address skills development issues. Employers just need
to make the most of the different schemes available at different level. At the HRDC level, there
exist certain schemes which employers can benefit if they want to address their skills problems. The
Sectoral Skills Development Scheme (SSDS) and the National Skills Development Programme
(NSDP) are two programmes where employers can benefit either individually of by clustering
themselves. The recent increase in refund for levy Grant is an example where HRDC is trying to
encourage employers to train their employees.
Develop cultural tourism, crafts and niche markets Mauritius, having a rich culture, needs to develop the cultural tourism and organise regular cultural
fairs or promote activities related to arts and culture. Our local artists need to be promoted via
cultural shows. The last budget has tried to address this but more need to be done. The intervention
of the Ministry of Arts and Culture is required for the development of the cultural tourism through
setting a framework and training of people to promote the cultural tourism. Organisation like the
MTPA is already working on similar initiative to promote our cultural richness. New organisations

102 | P a g e
like Air Mauritius, association of hotels and private sector should join hands to promote the
Mauritian cultural tourism.
Regarding crafts, it is proposed that the Mauritian crafts should be promoted as this has a huge
potential for earnings. Unfortunately, crafts available in the Mauritian markets for tourists are
imported. Certain initiatives are being implemented but more need to be done. Moreover, Mauritius
has a strong reputation in terms of its products but we need to innovate and find an identity for a
Mauritian craft product. The contribution of local organisations like the different cultural centres
could contribute to develop a Mauritian craft industry.

103 | P a g e
References
ILO, 2011, A Skilled Workforce for Strong, Sustainable and Balanced Growth: A G20 Training
Strategy International Labour Office – Geneva, viewed 12 July, from
https://www.oecd.org/g20/summits/toronto/G20-Skills-Strategy.pdf
Ladkin, A. (2005). Careers and employment. In: D. Airey, & J. Tribe (Eds.), An international
handbook of tourism education (pp. 437-450). UK: Elsevier.
Dale, C., & Robinson, N. (2001). The theming of tourism education: a three-domain approach.
International Journal of Contemporary Hospitality Management, 13 (1), 30-34.
Digest of National Accounts of Statistics Mauritius (2016), Statistics Mauritius, from
http://statsmauritius.gov.mu
The World Bank, ‘Doing Business 2018, World Bank Group Flagship Report’, Economy Profile-
Mauritius, http://www.doingbusiness.org/data/exploreeconomies/mauritius
Digest of Labour Statistics of Statistics Mauritius (2016), Statistics Mauritius,
http://statsmauritius.gov.mu.

104 | P a g e
ANNEX 1: Weighting protocol sample to population
Base: 1,252 All interviews
Raw counts
Raw % Weighted
counts Weighted
Frequencies Weighted
counts Weighted
Frequencies
Agriculture, forestry and fishing x 5-9 8 0.6% 3 0.2% 9 0.2%
Agriculture, forestry and fishing x 10-49 54 4.3% 42 3.4% 143 3.4%
Agriculture, forestry and fishing x 50-100 10 0.8% 5 0.4% 16 0.4%
Agriculture, forestry and fishing x 101-199
8 0.6% 4 0.3% 14 0.3%
Agriculture, forestry and fishing x 200 and above
9 0.7% 4 0.3% 14 0.3%
Manufacturing (Non-textile) x 5-9 12 1.0% 29 2.3% 100 2.3%
Manufacturing (Non-textile) x 10-49 152 12.1% 176 14.1% 601 14.1%
Manufacturing (Non-textile) x 50-100 27 2.2% 26 2.0% 87 2.0%
Manufacturing (Non-textile) x 101-199 18 1.4% 18 1.4% 61 1.4%
Manufacturing (Non-textile) x 200 and above
13 1.0% 9 0.7% 29 0.7%
Textile and Apparel x 5-9 2 0.2% 8 0.6% 26 0.6%
Textile and Apparel x 10-49 38 3.0% 50 4.0% 171 4.0%
Textile and Apparel x 50-100 11 0.9% 14 1.1% 49 1.1%
Textile and Apparel x 101-199 2 0.2% 9 0.7% 32 0.7%
Textile and Apparel x 200 and above 10 0.8% 15 1.2% 51 1.2%
Tourism, Hospitality and Recreational activities x 5-9
7 0.6% 4 0.3% 14 0.3%
Tourism, Hospitality and Recreational activities x 10-49
74 5.9% 42 3.4% 144 3.4%
Tourism, Hospitality and Recreational activities x 50-100
19 1.5% 8 0.7% 28 0.7%
Tourism, Hospitality and Recreational activities x 101-199
14 1.1% 8 0.7% 28 0.7%
Tourism, Hospitality and Recreational activities x 200 and above
18 1.4% 15 1.2% 52 1.2%
ICT / BPO x 5-9 9 0.7% 4 0.3% 13 0.3%
ICT / BPO x 10-49 86 6.9% 64 5.1% 219 5.1%
ICT / BPO x 50-100 19 1.5% 10 0.8% 33 0.8%
ICT / BPO x 101-199 10 0.8% 6 0.4% 19 0.4%
ICT / BPO x 200 and above 7 0.6% 5 0.4% 17 0.4%
Financial & Insurance Activities x 5-9 12 1.0% 1 0.0% 2 0.0%
Financial & Insurance Activities x 10-49 54 4.3% 26 2.0% 87 2.0%
Financial & Insurance Activities x 50-100 12 1.0% 5 0.4% 17 0.4%
Financial & Insurance Activities x 101-199
4 0.3% 2 0.1% 6 0.1%

105 | P a g e
Base: 1,252 All interviews
Raw counts
Raw % Weighted
counts Weighted
Frequencies Weighted
counts Weighted
Frequencies
Financial & Insurance Activities x 200 and above
7 0.6% 6 0.5% 21 0.5%
Wholesale & Retail Trade x 5-9 22 1.8% 33 2.7% 114 2.7%
Wholesale & Retail Trade x 10-49 108 8.6% 230 18.3% 783 18.3%
Wholesale & Retail Trade x 50-100 13 1.0% 24 1.9% 83 1.9%
Wholesale & Retail Trade x 101-199 12 1.0% 11 0.9% 38 0.9%
Wholesale & Retail Trade x 200 and above
8 0.6% 6 0.5% 21 0.5%
Transportation and storage x 5-9 2 0.2% 2 0.1% 6 0.1%
Transportation and storage x 10-49 57 4.6% 21 1.7% 71 1.7%
Transportation and storage x 50-100 6 0.5% 4 0.4% 15 0.4%
Transportation and storage x 101-199 6 0.5% 2 0.2% 7 0.2%
Transportation and storage x 200 and above
5 0.4% 4 0.3% 12 0.3%
Construction x 5-9 14 1.1% 27 2.2% 93 2.2%
Construction x 10-49 105 8.4% 123 9.8% 419 9.8%
Construction x 50-100 18 1.4% 13 1.1% 46 1.1%
Construction x 101-199 7 0.6% 6 0.5% 22 0.5%
Construction x 200 and above 9 0.7% 9 0.7% 29 0.7%
Professional, Scientific and Technical Activities x 5-9
17 1.4% 6 0.5% 20 0.5%
Professional, Scientific and Technical Activities x 10-49
88 7.0% 97 7.7% 330 7.7%
Professional, Scientific and Technical Activities x 50-100
16 1.3% 9 0.7% 29 0.7%
Professional, Scientific and Technical Activities x 101-199
6 0.5% 6 0.4% 19 0.4%
Professional, Scientific and Technical Activities x 200 and above
7 0.6% 2 0.2% 8 0.2%
Total 1252 100.0% 1252 100.0% 4268 100.0%

106 | P a g e
Annex 2: Post critical for the sector as per occupational groups
Occupational Groups Job Title
Managers Travel Manager
Managers Account Manager
Managers Administration Manager
Managers Area Manager
Managers Assistant Manager
Managers Assistant F & B Manager
Managers Assistant Sales Manager
Managers Assistant HR Manager
Managers Assistant HR Manager/Coordinator
Managers Assistant Restaurant Manager
Managers Bar Manager
Managers Business Manager
Managers Central Reservation Manager
Managers CEO
Managers Cluster General Manager
Managers Commercial Manager
Managers Corporate Manager
Managers Deputy General Manager
Managers Development Wellness Manager
Managers Director
Managers Director Of HR & Administration
Managers Director Of Marketing
Managers Director of Sales & Marketing
Managers Director PR & Communication
Managers Duty Manager
Managers Estate Manager
Managers Event Manager
Managers Executive Director
Managers Executive Housekeeper Manager
Managers Executive Manager
Managers F&B Outlet Manager
Managers F&B Manager
Managers Finance and Administrative Manager
Managers Finance Manager
Managers Floor Manager
Managers Garden Manager
Managers General Manager
Managers Golf Director
Managers Group And Incentive Manager
Managers Guest Experience Manager
Managers Guest Relation Manager
Managers Head Of Department Inbound

107 | P a g e
Managers Head Of Department Outbound
Managers Hotel Director
Managers Hotel Manager
Managers Housekeeping Manager
Managers HR Coordinator / Talents Development Manager
Managers HR Executive Manager
Managers HR Manager
Managers HR Coordinator
Managers Inventory Manager
Managers IT Assistant Manager
Managers IT Manager
Managers Laundry Manager
Managers Maintenance Manager
Managers Maintenance Coordinator
Managers Night Duty Manager
Managers Operation Manager
Managers Operational Technical Manager
Managers Outlet Manager
Managers Planning Manager
Managers Procurement Manager
Managers Project Manager
Managers Purchasing Manager
Managers Quality & Coaching Manager
Managers Quality Assurance Manager
Managers Quality Manager
Managers Reception Manager
Managers Reservation Manager
Managers Resident Manager
Managers Resort Manager
Managers Restaurant Manager
Managers Revenue & Reservation Manager
Managers Revenue Control Manager
Managers Revenue Executive Manager
Managers Room Division Manager
Managers Sales & Marketing Manager
Managers Security Manager
Managers Senior Operation Manager
Managers Service Manager
Managers Shift Manager
Managers Sports and Leisure Manager
Managers Store Manager
Managers Supply Chain Manager
Managers Supply Manager
Managers Tour Manager
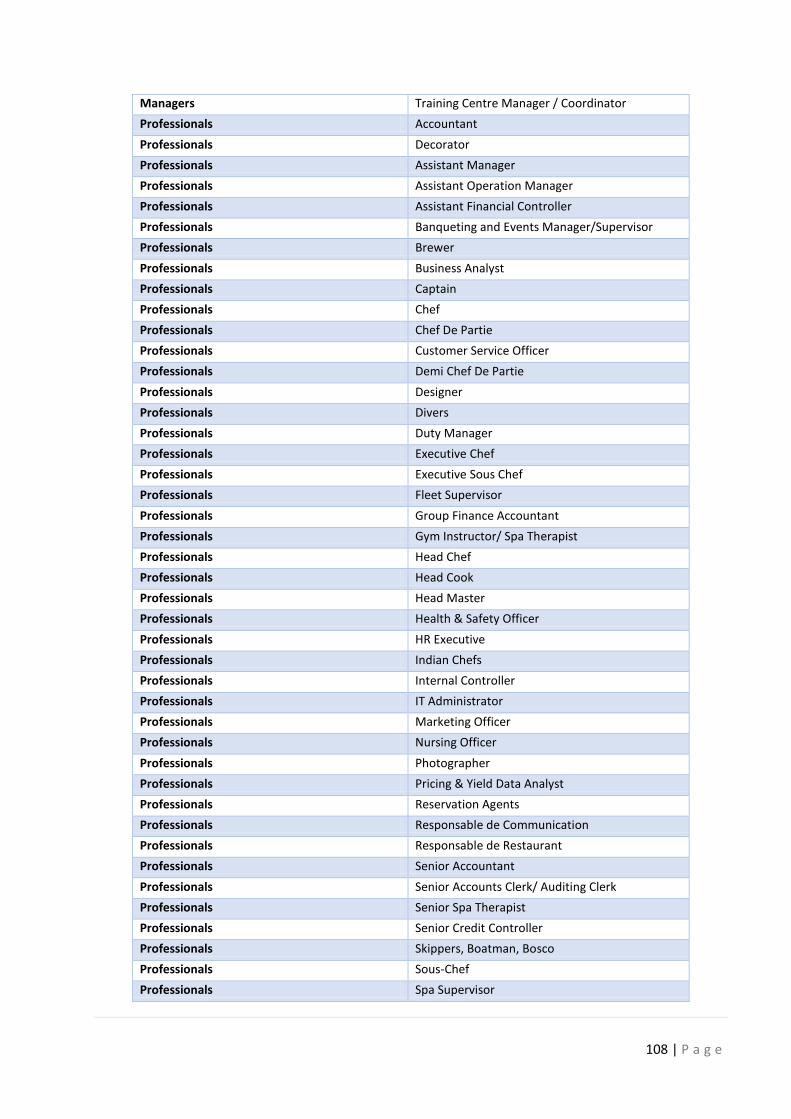
108 | P a g e
Managers Training Centre Manager / Coordinator
Professionals Accountant
Professionals Decorator
Professionals Assistant Manager
Professionals Assistant Operation Manager
Professionals Assistant Financial Controller
Professionals Banqueting and Events Manager/Supervisor
Professionals Brewer
Professionals Business Analyst
Professionals Captain
Professionals Chef
Professionals Chef De Partie
Professionals Customer Service Officer
Professionals Demi Chef De Partie
Professionals Designer
Professionals Divers
Professionals Duty Manager
Professionals Executive Chef
Professionals Executive Sous Chef
Professionals Fleet Supervisor
Professionals Group Finance Accountant
Professionals Gym Instructor/ Spa Therapist
Professionals Head Chef
Professionals Head Cook
Professionals Head Master
Professionals Health & Safety Officer
Professionals HR Executive
Professionals Indian Chefs
Professionals Internal Controller
Professionals IT Administrator
Professionals Marketing Officer
Professionals Nursing Officer
Professionals Photographer
Professionals Pricing & Yield Data Analyst
Professionals Reservation Agents
Professionals Responsable de Communication
Professionals Responsable de Restaurant
Professionals Senior Accountant
Professionals Senior Accounts Clerk/ Auditing Clerk
Professionals Senior Spa Therapist
Professionals Senior Credit Controller
Professionals Skippers, Boatman, Bosco
Professionals Sous-Chef
Professionals Spa Supervisor

109 | P a g e
Professionals Spa Therapist/ Beautician
Professionals Spa Therapist/ Hairdresser
Professionals Trainee Cost Controller
Professionals Yoga Teacher
Technicians and associate professionals Graphic Designer
Technicians and associate professionals Accounting Officer
Technicians and associate professionals Administrative assistant
Technicians and associate professionals Administrative Secretary
Technicians and associate professionals Airport Supervisor
Technicians and associate professionals Assistant Restaurant Manager
Technicians and associate professionals Assistant Bar manager
Technicians and associate professionals Assistant Front Office Manager
Technicians and associate professionals Assistant Head Gardener
Technicians and associate professionals Central Reservation Officers
Technicians and associate professionals Graphic Designer
Technicians and associate professionals Head Cook
Technicians and associate professionals Head Therapist
Technicians and associate professionals HVAC Technician
Technicians and associate professionals IT Coordinator
Technicians and associate professionals IT Technician
Technicians and associate professionals Maintenance And Operation Supervisor
Technicians and associate professionals Maintenance Officer
Technicians and associate professionals Sport Instructor
Technicians and associate professionals Uniform Executive
Technicians and associate professionals Zoo Keeper
Clerical support workers Supervisor
Clerical support workers Accounts Clerk
Clerical support workers Accounts Officer
Clerical support workers Administrative Assistant
Clerical support workers Administrative Officer
Clerical support workers Administrator
Clerical support workers Archive Clerk
Clerical support workers Assistant Executive Housekeeper
Clerical support workers Assistant HR
Clerical support workers Assistant Boathouse Manager
Clerical support workers Breakfast Supervisor
Clerical support workers Butcher
Clerical support workers Carpenter
Clerical support workers Chef De Cuisine
Clerical support workers Clerk
Clerical support workers Commercial Executive
Clerical support workers Communication And Sales Executive
Clerical support workers Cost Control Clerk
Clerical support workers Cost Controller

110 | P a g e
Clerical support workers Electrician
Clerical support workers Executive Assistant
Clerical support workers Executive Housekeeper
Clerical support workers Executive Housekeeping
Clerical support workers Executive Secretary
Clerical support workers F&B Outlet Supervisor
Clerical support workers F&B Secretary
Clerical support workers F&B Storekeeper
Clerical support workers F&B Supervisor
Clerical support workers Front Office Assistant
Clerical support workers Wedding Coordinator
Clerical support workers Front Office Supervisor
Clerical support workers Head Of Leisure
Clerical support workers Hotel Representative
Clerical support workers Hotel Service Representative
Clerical support workers Housekeeping Coordinator
Clerical support workers HR Assistant
Clerical support workers HR Officer
Clerical support workers Maintenance Helper
Clerical support workers Pastry Chef De Partie
Clerical support workers Pastry Demi Chef De Partie
Clerical support workers Planning Officer
Clerical support workers Plumber
Clerical support workers Project Officer
Clerical support workers Purchasing Clerk
Clerical support workers Purchasing Officer
Clerical support workers Receiving Officer
Clerical support workers Receptionist
Clerical support workers Reservation Clerk
Clerical support workers Reservation Coordinator
Clerical support workers Secretary
Clerical support workers Senior Porter
Clerical support workers Store and Purchasing Officer
Clerical support workers Supervisor
Clerical support workers Tours Operator(Staff)
Clerical support workers Trainee Front Office
Clerical support workers Trainee Quality Officer
Clerical support workers Trainee Secretary
Clerical support workers Wages Clerk
Clerical support workers Wellness Centre Manager
Clerical support workers Wellness Centre Supervisor
Clerical support workers Wellness Centre Therapist
Service and sales workers Aide Cuisinier
Service and sales workers Airport Representative
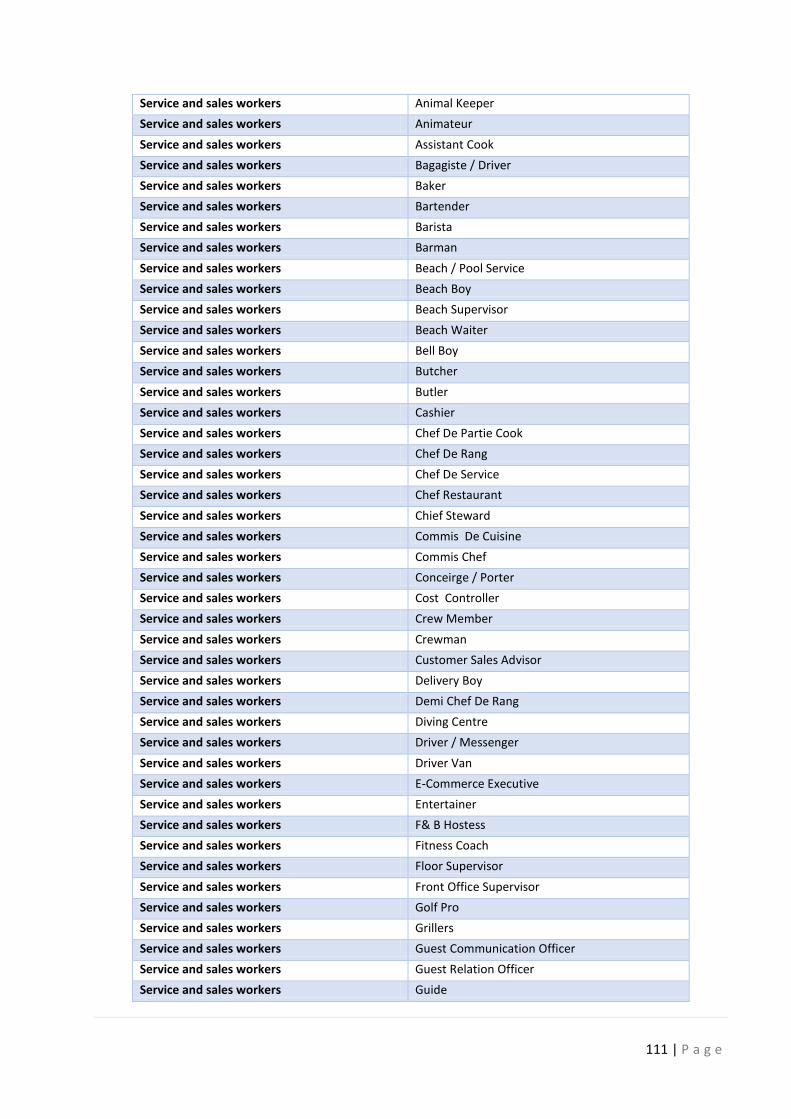
111 | P a g e
Service and sales workers Animal Keeper
Service and sales workers Animateur
Service and sales workers Assistant Cook
Service and sales workers Bagagiste / Driver
Service and sales workers Baker
Service and sales workers Bartender
Service and sales workers Barista
Service and sales workers Barman
Service and sales workers Beach / Pool Service
Service and sales workers Beach Boy
Service and sales workers Beach Supervisor
Service and sales workers Beach Waiter
Service and sales workers Bell Boy
Service and sales workers Butcher
Service and sales workers Butler
Service and sales workers Cashier
Service and sales workers Chef De Partie Cook
Service and sales workers Chef De Rang
Service and sales workers Chef De Service
Service and sales workers Chef Restaurant
Service and sales workers Chief Steward
Service and sales workers Commis De Cuisine
Service and sales workers Commis Chef
Service and sales workers Conceirge / Porter
Service and sales workers Cost Controller
Service and sales workers Crew Member
Service and sales workers Crewman
Service and sales workers Customer Sales Advisor
Service and sales workers Delivery Boy
Service and sales workers Demi Chef De Rang
Service and sales workers Diving Centre
Service and sales workers Driver / Messenger
Service and sales workers Driver Van
Service and sales workers E-Commerce Executive
Service and sales workers Entertainer
Service and sales workers F& B Hostess
Service and sales workers Fitness Coach
Service and sales workers Floor Supervisor
Service and sales workers Front Office Supervisor
Service and sales workers Golf Pro
Service and sales workers Grillers
Service and sales workers Guest Communication Officer
Service and sales workers Guest Relation Officer
Service and sales workers Guide
112 | P a g e
Service and sales workers Head /Commis Sommelier
Service and sales workers Head Boatman
Service and sales workers Head Entertainer
Service and sales workers Head Laundry
Service and sales workers Hostess
Service and sales workers Hostess Mini Club
Service and sales workers Housekeeper
Service and sales workers Housekeeping Supervisor
Service and sales workers Housekeeping/Laundry Attendant
Service and sales workers Kids Club Attendant
Service and sales workers Landscaper
Service and sales workers Launderer
Service and sales workers Laundry and Linen Supervisor
Service and sales workers Laundry Attendant
Service and sales workers Linen Attendant
Service and sales workers Maintenance Executive
Service and sales workers Maintenance Officers
Service and sales workers Mini Bar Attendant
Service and sales workers Pastry Chef
Service and sales workers Porter
Service and sales workers Public and Guest Relation Officer
Service and sales workers Reservation Executive
Service and sales workers Reservation Officers
Service and sales workers Restaurant Supervisor
Service and sales workers Sales Agent
Service and sales workers Sales and Marketing
Service and sales workers Salesman
Service and sales workers Security Officer
Service and sales workers Senior Therapist
Service and sales workers Sewing Attendant
Service and sales workers Shop Assistant
Service and sales workers Shop Attendant
Service and sales workers Sous Chef
Service and sales workers Spa Therapist
Service and sales workers Sports And Leisure Skipper
Service and sales workers Staff Canteen
Service and sales workers Steward
Service and sales workers Store Attendant
Service and sales workers Store Supervisor
Service and sales workers Storekeeper
Service and sales workers Supervisor
Service and sales workers Supply Chain Coordinator
Service and sales workers Tourist Guide
Service and sales workers Trainee Cook

113 | P a g e
Service and sales workers Trainee Room Attendant
Service and sales workers Trainee Waiter
Service and sales workers Trainee Waitress
Service and sales workers Valet
Service and sales workers Waiter
Service and sales workers Waiter / Barman
Craft and related trades workers Beach Attendant
Plant and machine operators and assemblers Handyman ( Painter )
Plant and machine operators and assemblers Store Assistant
Elementary occupations Attendant
Elementary occupations Cleaners
Elementary occupations Fast Food Operator
Elementary occupations Gardener
Elementary occupations Handy Man
Elementary occupations Handyman / Gardener
Elementary occupations Helper
Elementary occupations Kitchen Helper
Elementary occupations Linen Supervisor
Elementary occupations Maids
Elementary occupations Public Area Attendant
Elementary occupations Public Area Cleaner
Elementary occupations Security Guards
Elementary occupations Steward (Cleaner)
Elementary occupations Steward (Plongeur)
Elementary occupations Watchman

114 | P a g e
Annex 3: Requirements demanded by employers for different occupational groups
Occupational group
Job Title Qualification Experience Skill Type Other requirements
Managers Director Degree/Masters 10 years
Business awareness, organisational skills, analytical skills, multi-tasking, decision making
Communication, negotiation skills
Managers Head of Department Diploma/Degree plus NC4/5 5 years
Organisational and planning skills
Good knowledge of the hotel sector, multi-tasking
Managers Shift Manager HSC/Diploma 5 years
Good knowledge of the hotel sector, planning and customer oriented
Willingness to work long and odd hours
Managers Front Office Manager HSC plus Diploma 2/3 years Customer service, planning and organisational skills
Work under pressure, work odd hours, pleasant personality
Managers Guest Relation Manager HSC plus Diploma 2/3 years
Customer service, communication, languages
Pleasant personality, customer service
Managers Boathouse Manager HSC plus Certificate in lifesaving 2/3 years
Planning and organisational skills, good knowledge mechanic Planning boat excursions
Managers Restaurant Manager Diploma in Restaurant and Bar 2/3 years
Good knowledge in Restaurant and Bar, Customer service Leadership and communication
Professionals HR Manager/Executive Degree in HR/Management 5 years
HR, managerial, analytical and legal skill
Confidentiality, communication, decision making
Professionals Sales & Marketing Manager/Executive
Degree in Marketing/Management 5 years
Negotiating, communication, IT skills Accountancy and leadership
Professionals Banquet and Event Manager
Degree in Marketing/Management 6 years
Event management, negotiating skills Customer service
Professionals Health & Safety Officer
Diploma/Degree in Health & Safety 3 years OSHA, safety measures Dependable, proactive
Professionals Spa Therapist Certificate/Diploma in Spa Therapy 2 years
Massage, facial, manicure, pedicure
Customer service, communication, planning
Professionals Chef/Executive Chef Diploma in culinary 7 years
Excellent knowledge of cooking skills, food handling, handling of kitchen
Ability to work under pressure, good communication, organisational skills
Clerical support workers Supervisor Form 4/5 and NC3/4 2 years
Supervisory skills in restaurant, bar, laundering and housekeeping
Leadership, good attitude and work under pressure
Clerical support workers Clerk HSC 2 or 3 yrs
Administrative skills, computer literate, accounting Should be multi-skilled
Clerical support workers Hotel Representative HSC 3 years
Negotiation skills with good communication and presentation skills
Good knowledge of the sector and languages
Clerical support workers Receptionist SC/HSC plus NC3/4 1 year
Customer service, telephone skills, languages and computer literate
Good communication and pleasant personality
Clerical support workers Reservation Clerk HSC 2 years
Customer service, computer literate, communication, languages,
Presentation skills, work under pressure
Clerical support workers Accounts Clerk/Officer
HSC plus ACCA Level 2 or Diploma/Degree in Accounting 2 years
Computer literate with good knowledge of Accounting packages
Reliable and ability to work under pressure

115 | P a g e
Technicians and associate professionals Frigorist Form 4/ plus NTC 4 2/3 years
Good knowledge of electrical products and a qualified technician
Good attitude and customer service
Technicians and associate professionals Sous Chef NTC 3/4 6 years
Culinary, bakery and pastry skills
Good attitude and customer service
Technicians and associate professionals Sports Instructor
Form 5 plus Diploma in related field 2/3 years
Good knowledge of sports , wellness and anatomy
Communication skills and languages
Technicians and associate professionals F & B Coordinator
Form 5 plus Diploma in related field 5 years
Good knowledge in restaurant and bar
Organisational, planning, customer care skills
Technicians and associate professionals Electrician SC plus NTC in Electrical 2 years
Good knowledge of electric installations and repairs Team worker and dependable
Technicians and associate professionals Maintenance Officer
Diploma/Degree in Engineering 10 years
Technical skills for the construction sector
Managerial and decision making skills
Technicians and associate professionals
Maintenance Supervisor
NTC/Diploma in related fields 5/6 years
Good knowledge of all infrastructure installations and repairs
Communication and decision making
Service and sales workers Waiter Form 3/4 plus NTC 3
3- 6 months Skills in restaurant and bar
Good communication, third language, food handling, customer service
Service and sales workers Crew Member Form 4/5 1 year
Should be a team worker and able to perform multi-tasks
Customer care, cashier, taking orders, work odd hours, languages
Service and sales workers Housekeeping Form 3/4 plus NTC 3
3- 6 months
Cleaning and handling of chemical products
Good communication, customer care, reliable, honest
Service and sales workers Cashier Form 5 and above 1 year
Capacity to handle money and operate a cash till
Customer care, good communication, knowledge of foreign currencies, honest
Service and sales workers Cook Form 4/5 plus NC 3 2 years
Culinary skills and kitchen management
Flexible, work under pressure, work odd hours, food safety and hygiene and HACCP knowledge
Service and sales workers Barman Form 4/5 plus NC 4 1 year Restaurant and bar skills
Good communication, customer care, third language, good knowledge of cocktails
Service and sales workers Fast Food Operator
Form 4/5 plus Food Handlers Certificate
3- 6 months
Customer handling skills and multi-skilled
Work odd hours, good communication, customer care, skills to handle tills
Elementary occupations Kitchen Helper
Primary education and above
3- 6 months
Literate and ability to work under pressure
Hygiene, neat and knowledge of HACCP
Elementary occupations Gardener CPE and above 1 year Landscaping skills
Creative skills and good knowledge about plants
Elementary occupations Steward CPE and above
3- 6 months Cleaning and use of utensils
Good attitude and knowledge of detergents
Elementary occupations Cleaner CPE and above
3- 6 months General cleaning
Good attitude and knowledge of cleaning products and handling of cleaning equipment
Elementary occupations Pubic Area Attendant Form 3 and above
3- 6 months Attending customers request Good communication

116 | P a g e
Elementary occupations Handyman
Form 3 plus Vocational education 1 year
Basic knowledge of general works
Good communication and attitude
Related Documents