DISCUSSION PAPER SERIES Forschungsinstitut zur Zukunft der Arbeit Institute for the Study of Labor Skill Shortages in German Establishments IZA DP No. 8290 June 2014 Lutz Bellmann Olaf Hübler

Welcome message from author
This document is posted to help you gain knowledge. Please leave a comment to let me know what you think about it! Share it to your friends and learn new things together.
Transcript

DI
SC
US
SI
ON
P
AP
ER
S
ER
IE
S
Forschungsinstitut zur Zukunft der ArbeitInstitute for the Study of Labor
Skill Shortages in German Establishments
IZA DP No. 8290
June 2014
Lutz BellmannOlaf Hübler

Skill Shortages in German Establishments
Lutz Bellmann Friedrich-Alexander-Universität Erlangen-Nürnberg,
IAB and IZA
Olaf Hübler Leibniz Universität Hannover,
IAB and IZA
Discussion Paper No. 8290 June 2014
IZA
P.O. Box 7240 53072 Bonn
Germany
Phone: +49-228-3894-0 Fax: +49-228-3894-180
E-mail: [email protected]
Any opinions expressed here are those of the author(s) and not those of IZA. Research published in this series may include views on policy, but the institute itself takes no institutional policy positions. The IZA research network is committed to the IZA Guiding Principles of Research Integrity. The Institute for the Study of Labor (IZA) in Bonn is a local and virtual international research center and a place of communication between science, politics and business. IZA is an independent nonprofit organization supported by Deutsche Post Foundation. The center is associated with the University of Bonn and offers a stimulating research environment through its international network, workshops and conferences, data service, project support, research visits and doctoral program. IZA engages in (i) original and internationally competitive research in all fields of labor economics, (ii) development of policy concepts, and (iii) dissemination of research results and concepts to the interested public. IZA Discussion Papers often represent preliminary work and are circulated to encourage discussion. Citation of such a paper should account for its provisional character. A revised version may be available directly from the author.

IZA Discussion Paper No. 8290 June 2014
ABSTRACT
Skill Shortages in German Establishments* This paper investigates the development of skill shortage during the period 2007-2012. Using the IAB establishment panel, we find differences for the years before, during and after the Great Recession. Furthermore, we analyze the importance of firm characteristics and that of some specific measures with respect to skill shortage based on probit, random effects probit and instrumental variables estimates. The empirical analysis confirms that apprentice and further training serves to reduce the number of unfilled qualified jobs. Plans for the long-run personnel development of the staff are also helpful. Skill shortage within a firm is often only a short-term phenomenon and less often observed over a longer period. During the Great Recession itself, the estimates reveal a weaker relationship between structural characteristics of the firm and skill shortage than in other years. Post-recession effects can be detected. Robustness checks are conducted that account for endogeneity, sample selection, outliers and causality. Least angle regression is applied to select the relevant firm characteristics. JEL Classification: D21, D22, E32, J63 Keywords: skill shortage, Great Recession, firm characteristics, measures Corresponding author: Olaf Hübler Institut für Empirische Wirtschaftsforschung Königsworther Platz 1 30167 Hannover Germany E-mail: [email protected]
* We are grateful to Knut Gerlach, Robert A. Hart, Wolfgang Meyer and Gesine Stephan for their helpful comments.

2
1 Introduction During the Great Recession sales strongly decreased world-wide and in consequence demand for labor went down more than in other recessions. However in Germany, the unemployment rate stayed nearly stable. Companies have hoarded labor. This fact is well-known. Less clear is the situation of skilled workers before, during and after the recession. From an international perspective, resilience of the German labor market in terms of a stable level of unemployment was an important feature of the Great Recession around 2009. A further distinguishing phenomenon was the scarcity of skilled personnel in the pre-recession period. These two topics are interrelated. We argue that in order to understand the German labor market response to the Great Recession, it is necessary to take the scarcity of skilled personnel into account.
There is a public and scientific debate on the issue as to what extent Germany experiences a shortage of skilled workers. The reasons are manifold. Some argue from long-term and others from short-term perspectives. Regions, occupations and industries differ in their exposure to skill shortages. Seasonal, yearly, and cyclical fluctuations occur. Some commentators emphasize supply side and others demand side reasons. In fact, different definitions of skilled workers and shortage lead to controversial assessments as to whether scarcities of qualified personnel exist. There is a substantial ambiguity about the definition of a skill shortage: In a broader sense, it may refer to difficulties in recruiting workers with adequate skills. In a more narrow sense, it means that current staff has not the skills needed to do their jobs effectively (Green et al. 1998).
It seems paradox that worker shortages exist during times of high national unemployment. A number of sectors report a shortage of workers and problems filling key positions such as high-tech, advanced manufacturing and medical specialists. On the labor-intensive side of the economy, in agricultural, restaurants, hotels, hospitals and care of the elderly it is difficult to fill vacancies. There are shortfalls of nurses and engineers.
So far, empirical investigations of skill shortage are focused on aggregate data for different occupations and industries. Predictions and simulations of labor supply and labor demand are presented. Results based on establishment data are rare. Exceptions are e.g. Bundesverband der Deutschen Industrie (2013), Falk (2002), Kettner (2012), Klinger et al. (2011), Kölling (2002), and Kubis et al. (2013). Multivariate estimates are missing. Little is known about the effectiveness of different measures to reduce or eliminate skill shortage and the development of skill shortage around the Great Recession.
In the following empirical investigation on skill shortage we present results based on establishment data and the period from 2007 to 2012. This includes the phase before, during and after the Great Recession in Germany. Especially, we investigate whether skill shortage is more pronounced in 2007/08 than in the following years, whether the Great Recession has significantly reduced the skill shortage, whether the post-recession period is characterized by similar development as in 2007/08 or whether we observe a structural break in 2009, whether the level of skill shortage is decreased or increased compared with the pre-recession period. We investigate which determinants, especially which firms’ characteristics are

3
responsible, whether short-term bottlenecks or long-term shortage dominate, whether specific measures are successful and others less so.
In the years before the recession German establishments were reluctant to hire new skilled workers. Employers expected that the boom from 2005 to 2007 to be only short-lived (Burda/Hunt 2011, p.24). They hesitated to hire during the short boom for lack of confidence. Compared to other countries, there existed relatively high layoff costs imposed by the strict job protection legislation in Germany (Venn 2008) and these outweighed the additional gains from the recruitment of new personnel. Thus, as the recession arrived, the necessity to dismiss skilled employees was less urgent. Companies had not foreseen the severity of the Great Recession on sales. They expected only a short downturn because the growth potential of the emerging economies (especially China) was assessed very positively. In addition, industries with the highest shares of vacancies during the year 2008 - like mechanical engineering, automotive and chemical industries - were also those affected by Great Recession 2008/09 most severely (Möller 2010).Thus, not only layoff costs but also potential hiring costs provided arguments for companies to hoard qualified labor during the crisis.
If labor hoarding occurs, the employment cycle has weaker amplitudes than the production cycle (Oi 1962). However, during the recession we have to expect that the degree of skill shortage is lower than in the pre-recession period. Due to the large growth potential of the emerging countries that belong to the most important export markets of the German economy, many German companies prepared themselves during the crisis to serve the needs of the emerging countries in the expected recovery after the Great Recession. Therefore, they strategically hoarded and even recruited their personnel in order to avoid skill shortage after the crisis.
The discussion of the development of skill shortage within a cycle provides evidence in which way the trend is overlaid by cyclical movements. A more detailed analysis can reveal whether the cycle affects the trend, whether the trend is enhanced or weakened. For example, we guess that firms with a high share of female workers have on average fewer problems than others to fill jobs with skilled workers due to increasing labor market participation and the rising qualifications of women. The more this type of potential is exploited, the more a decreasing negative trend may be expected. During a crisis, we suppose lower differences between these two types of establishments or even a reverse effect when men are stronger concerned by the recession than women. In an upswing the pattern might reverse. It is unclear whether the trend returns to the former level or whether there is a break. The Great Recession is an excellent example to demonstrate whether cyclical effects are effective, which determinants are responsible for a skill shortage and whether the success of measures varies over the cycle. If we do not find remarkable deviations over the period around 2009, we cannot expect deviations in weaker recessions.
The paper is organized as follows. Section 2 discusses briefly reasons and previous evidence to skill shortage as well as measures to solve this problem. In Section 3 the data and descriptive statistics are presented. Section 4 contains the applied methods and results of the econometric investigation, including robustness checks. Section 5 concludes.

4
2 Sources of skill shortage, previous empirical
evidence and measures 2.1 Potential sources of a skill shortage
From a national perspective, skill shortages go hand in hand with demographic developments, technological and organizational changes as well as the adjustment of the education system to the requirements of working life. First, a decline in population, late entrance on the labor market and early retirement reduces labor supply. However, a higher female labor market participation, a better education, a higher share of graduates and more training have the potential to extend labor supply. Second, skill biased technological progress increases the demand for skilled workers: skill shortages are higher for establishments that use advanced technology in the production process (Haskel/Martin 2001). Third, it is argued (Bertelsmann Stiftung 2002, IHK 2011) that schooling is responsible for deficiencies at the quality of human capital. Besides policy mistakes, an insufficient supply of labor and an increasing demand for labor as well as mismatches can induce bottlenecks of qualified workers. All these reasons determine the long-run macroeconomic development of skill shortages. We are more interested in cyclical and microeconomic effects.
Skill shortage underlies cyclical fluctuations. Based on the Beveridge curve and Okun’s law, we expect that skill shortage increases when the national economy grows, national unemployment falls and more vacancies are supplied. Elsby et al. (2010) have found that the nature of the labor market adjustment displayed a notable resemblance to that observed in past severe downtowns. However, starting in the mid of 2009 indicators of real activity and labor market began to diverge from past patterns in the U.S. Recent developments on unemployment and job vacancies imply a rightward shift in the Beveridge curve.
Different reasons may be responsible that – in times of a crisis - the conventional mechanism is hindered (Dietz/Stops/Walwei 2010, Elsby et al. 2010, 2011, Franz 1994, Ghayad 2013, Ghayad/Dickens 2012). First, emergency unemployment compensation contributes to deviations in the Beveridge curve. Second, long-term unemployed people are discouraged and do not apply to a posted vacancy. Third, the mismatch in the skills between the unemployed and requirements given in vacancies varies over the cycle. Fourth, a geographical mismatch, in particular in the U.S., is induced by too little mobility. The latter is due to unwillingness or inability to sell one’s house in a weak housing market caused by the Great Recession. Fifthly, firms do not hire long-term unemployed. Rhayad/Dickens (2012) and Rhayad (2013) demonstrate by a decomposition of the Beverage curve that this result is only observed for longer than 6 month jobless persons. Those who were unemployed for a shorter time and who have experience in the industry have significant application advantages. Sixthly, establishments have hoarded labor during the crisis, in particular skilled labor in order to avoid firing costs and hiring costs in the recovery phase. Usually, it is argued that effective labor productivity decreases under a policy of labor hoarding. However, if this hoarding strategy goes hand in hand with a decline of unqualified workers, a rise in productivity may be a consequence (Hübler 2010). Lazear et al. (2013) distinguish two possibilities. On the one hand, the average worker has a higher productivity during the recession than in the preceding

5
period. On the other hand, each worker produces more while holding worker quality constant. The empirics demonstrate that the second effect dominates the first effect over the business cycle in the U.S. Shortage of skilled workers decreases in both cases. We should expect that the relief is larger in the case of higher quality. Consequences for the labor shortage in the post-recession period are unclear. They depend on whether the increased productivity decreases again.
All in all, there are many reasons that may explain skill shortage and their long- and short-run fluctuations. However, there is little known which of the positive and negative determinants dominate and which measures are successful to reduce skill shortage.
2.2 Previous empirical evidence
Most empirical evidence that we have or that we have to expect on skill shortage is provided by politicians, ministries, employer associations or unions. Macroeconomic information and predictions are the usual sources. Indicators to demonstrate the problems are usually the completed average duration to fill a job, the ratio of applicants or unemployed to vacancies. Many reports are not restricted to skilled workers but more generally to the development of the labor force. Brunow et al. (2012) are skeptical that these methods and the applied indicators are suitable in respect to inferences about shortages of skilled labor. Changes of the applied variables can have many causes that are independent of shortages. Short-term shortages usually say little about long-term problems. Zimmermann (2011) has emphasized that due to insufficient data and unsatisfactory indicators it is not possible to determine the actual shortage of skill work in detail. In the following, we summarize shortly macroeconomic results and predictions on skill shortages, especially in Germany. Then we report on microeconomic investigations based on German establishment data.
The Federal Ministry of Economics and Technology - BMWi (2012) – emphasizes in the analysis of bottlenecks that currently 30-40 percent of the small and middle-sized firms have problems in filling vacancies of qualified jobs. The strongest difficulties are revealed in the technical field. The MINT (mathematics, informatics, nature science, technique) gap in December of 2011 is estimated at about 179,000 persons. E.g. the average completed duration to fill a vacancy for machinery engineers is 106 days and the ratio of unemployed to a vacancy is 0.7 while for architects the analogous figures are 76 and 2.55, respectively. The bottlenecks of workers with a vocational training in small and middle-sized firms are currently larger than among academics. The Ministry expects that skill shortage will especially increase due to demographic changes, aging and population decline.
Both the German Federal Ministry of Labour and Social Affairs – BMAS (2011) – and Kubis et al. (2013) present empirical results on the demand for skilled labor. They deal with the effects of hidden reserve and the developments in the regions on the expected changes of the labor force, of entrances in the education and apprenticeship system. Information on vacancies and unemployed, based on the IAB survey on vacancies and recruitment processes show that there does not exist a general shortage of skilled workers in Germany. In most segments labor supply exceeds labor demand. The duration to fill a job vacancy is decreasing and strong cyclical fluctuations are observed since 2006. Bottlenecks are detected in academic but also in other qualified occupations. In the health, care and education sector and among engineers the number of vacancies exceeds the number of applicants. From a regional

6
perspective, obvious differences exist. The labor market tightness is strongest in southern Germany. The number of qualified employees has increased since 2001 by 2.5 million persons, whereas the number of persons without a completed vocational training almost stagnated (+ 33,000). According to both the IAB establishment and the employment history panel, the proportion of older (50+) employees rose in the last decade.
The Federal Institute for Vocational Training (BiBB) publishes an annual data report on vocational training. In BiBB (2008, … , 2013) we find for the period 2006-2012 that the changes of the number of new apprentices in percent compared with the year before are: +4.7%, +8.6%,-1.5%,-8.2%, -0.7%, +1.8% and -3.2%. Beginning with the Great Recession there is a trend towards less vocational training. The interest of the young generation in vocational training in the German dual system has declined. Often, the minimum standard employers demand from apprentices they hire was not fulfilled. This means the supply of workers with vocational skills has fallen.
The German Trades Union Confederation – DGB (2011) – concedes that there exists a shortage of skilled workers in some occupations and some regions after the Great Recession in Germany. However, the unions warn against a general hysteria. They argue that also qualified workers are actually more often hit by unemployment than often supposed. Missing skills are mentioned as the major reason that qualified job vacancies cannot be filled. This problem could be solved by the establishments. Heidemann (2012) emphasizes bottlenecks of engineers, IT jobs, teachers, child care workers, hospital nurses and nurses for the elderly. .
Prognos (2010) compares the scenarios „Arbeitslandschaft 2030”, „Wirtschaftskrise” and „lange Wirtschaftskrise“. The first were developed in 2007/08 and estimates reveal a labor force gap of 5.5 million. The second and third are based on 2010 and determine a mismatch of 5.2 million persons in 2030. Prognos expects that 25 percent of the academic jobs cannot be filled in 2030 if no measures are taken. For engineers and MINT jobs a gap of 14 percent is estimated for 2014. The evaluation of the effectiveness of different measures shows that in particular training is important under the scenario “lange Wirtschaftskrise”.
Maier et al. (2011) predict the development of the number of indentures from 2009 to 2020 where they distinguish between an optimistic and a pessimistic forecast. In the former case the authors calculate an increase to 2013 with a maximum of 624,000 and then a continuous reduction to 530,000 in 2020 so that the total reduction is 5.5 percent. The pessimistic variant is that the reduction starts in 2009, persists on this level until 2014. Then a continuous decline is estimated until 466,000. This means that all together the number of indentures is 17 percent lower in 2020 than 2009.
Trends and fluctuations of skilled employees are not restricted to Germany. Dunkel (2011) presents some information to the expected shortage of skilled workers in Europe. He predicts that up to 2020 six million additional jobs will be created in Europe with three-fourths expected in the service sector. Especially, the growth in academic occupations will be strong. Not only for Europe but also for the U.S. there is a predicted shortage of skilled workers in future. In the U.S. one can argue that this may result from the retirement of the baby boomer cohort. However, Neumark et al. (2012) find no evidence of skill shortages emerging by the end of this decade. They suppose that skill shortage is more likely in the near-

7
term in states with large and growing immigrant populations. Lakey (2006) has shown that from a longer-term demographic perspective the composition of the population of Northern Alberta may exacerbate the skills shortages, particular over the period of approximately 2014 to 2020. During this period the number of retirees will increase rapidly. The number of people of prime work force age will not keep pace with withdrawals. Over the period to 2026, the population will be categorized by a rapidly growing youth population and a rapidly growing senior’s population. Changes in technology are, in general, not likely to mitigate the shortage of skills in the near term.
Some few empirical investigations on skilled shortages exist only using German establishment data. Based on a dataset with 204 companies collected in 1999 with special focus on skilled workers and competiveness, commissioned by the Institute for Small and Medium Sized Enterprises, Bonn, Backes-Gellner and Tuor (2010) find that the existence of apprenticeship training and a works council improve the recruitment process of skilled blue-collar workers. They interpret their results in the sense of Spence’s signal theory. They argue that workplace and company characteristics should be evaluated not only in the context of their original goals and direct effects, that is, by the returns they generate within their own policy field, but also by their signaling value or indirect effects on other policy areas. Given an aggregate labor market shortage for skilled workers, individual companies can significantly improve their relative position and ensure above average hiring rates by sending high quality signals to potential employees. A good work climate and labor relations can help to fill skilled vacancies.
Using the IAB establishment data from the waves 2000, 2005, and 2007, Fischer et al. (2008) investigate how often establishments searched for skilled employees and how often they were unable to fill their vacancies. According to their analyses, most of the establishments did not look for skilled personnel (61 percent). 29 percent of the establishments searched sometimes. Among those establishments which searched 68 percent were able to fill the vacancies in every year, 12 percent only sometimes, but 20 percent in every year.
Bechmann et al. (2012) investigate the share of establishments searching for skilled employees during the years 2007-2010, using the IAB Establishment Panel. They show that 49 percent of all establishments never looked for skilled employees, 46 percent searched sometimes and 5 percent every year. They found that only 1 percent of all establishments searching for skilled employees were not able to fill them during all years in the period 2007-2010, while 21 percent could not find skilled workers in one of the four years to fill the vacancies.
Bechmann and Dahms (2012) demonstrate that the number of hired skilled workers fluctuates from year to year since 2006 In 2011 the percentage of firms that have hired skilled workers was highest in the public sector. The authors have also found that the share of unfilled qualified jobs in the service sector, especially in the banking and insurance exceeded that in other sectors in 2011. In the next two years the greatest bottlenecks are expected in the civil service. Zagelmeyer et al. (2012, p.3371)have found that experience with shortage of skilled labor is positively associated with the exploration of new markets and restructuring activities. A study of the European Union (2011, pp.17) stresses that in Germany, in contrast to other EU countries, only very limited job losses from the second quarter of 2008 to the second quarter of 2010 in high-technology could be observed. Klinger et al. (2011) find that firms with labor shortages in 2008 did not use significantly more short-time work, other forms of working time or
8
wage reduction than establishments without labor shortage problems. The development of the work force was approximately the same as that of their non-labor shortage counterparts. The authors have employed data from the German Job Vacancy Survey between the fourth quarter of 2008 and the third quarter of 2009.
Based on more than 900 industry firms, observed in spring 2013, the BDI Establishment Panel (Bundesverband der Deutschen Industrie 2013) finds that more than 50 percent of the German companies assess skill shortage as important to their business prospects. Since the Great Recession this issue becomes more relevant. Two-thirds of the firms adopt measures to keep and to train qualified workers in order to secure competitiveness in the long-run. An additional quarter wants to become active in this field in future.
2.3 Measures to counter skill shortage
There exist different ways to fill the skill gaps. The Chamber of Commerce and Industry – IHK (2011) – highlight the responsibility of unions and employers at the policy and the firm level. Incentives to intensify the MINT education, to reduce the dropout rate of students and, within the dual education system, to remove barriers of transitions between the vocational training and the university are suggested. The firms should intensify the contact with universities, should hire more university drop-outs and adolescences with a migration background. More training of older workers is recommended. The Institute of the German Economy (Institut der deutschen Wirtschaft Köln 2012) emphasizes that establishments use especially the following instruments: keeping of older workers, hiring of female and foreign workers, intensifying of further training and long-run firm-specific planning of the staff. The unions (DGB 2011) mention the insufficient reform of the education system as an important reason of skill shortages. They believe that the hiring standards of the firms are too high and request more internal further training. Furthermore, they argue that entrance wages are too low compared with the required standards that were developed during the crisis hold up in the recovery phase. In the long-run, the danger of bottlenecks due to demographic changes has to be combatted by better education and training.
Kolodziej (2011) summarizes the recommendations of the different institutions (BA, SVR, McKinsey, IAB, IZA) in respect of reducing shortages of qualified workers. She mentions as strategies the reduction of dropouts, the improvement of the transition into a job, an extended labor market participation, in particular of women, a longer working lifetime, an intensified and better regulated immigration of skilled workers, an extension of the working time, better education and training, detailed information about the labor market, family friendly working time, a better compatibility of the job and the family, lifelong learning, increasing wages, an enhancement of the firm’s attractiveness, cooperation of the firms with other institutions. Especially, two fields are mentioned. The first is to retrain the workers. The second is to take advantage of foreign workers who possess the skill set and mobility to fill the existing gaps. Further, the Bertelsmann Foundation (2002) recommends the elimination of repressive rules in social laws and laws of taxation, the adoption of company-level pacts in order to reduce shortages of skilled workers, the enhancement of wage differences between qualification levels, an anticipatory personal management.

9
3 Data and descriptive results The following investigation is based on German IAB Establishment Panel Survey of the Institute for Employment Research of the Federal Employment Agency (Fischer et al. 2009). In this representative survey German establishments are interviewed employing one or more employees from the private sector, excluding agriculture, forestry and fishing. The panel started in 1993 with an annual survey of West German establishments and was extended to East Germany in 1996. Since 1996, more than 15,000 establishments have been included in the survey. Information is provided on many labor market topics, including employment, wages, sales, bargaining levels, works councils, profit sharing and investments.
Wave 2011 gives some details regarding skill shortages and labor requirements. The question is whether an establishment expects problems in filling qualified jobs in the next two years and, if yes, for what reasons. Furthermore, the importance of 12 explicit strategies is identified with which firms serve to cover the demand for skilled workers.
The investigation is focused on data for the period 2007-2012 that is before, during and after the Great Recession. In the years before 2007 information on the number of unfilled skilled vacancies (SQW – shortage of qualified workers) is missing. In the following descriptive and econometric analysis skill shortage is measured by this variable. Skilled workers include employees with a university degree and qualified workers with vocational training. Sometimes, we use only a dummy variable D_SQW, where D_SQW=0 if SQW=0 and D_SQW=1 if SQW>0, respectively. Additionally, the number of years with skill shortage
TSQWi = Σt (D_SQWit) i=1,…,N; t=2007,…,2012
and the ratio of SQW to total number of employees n in firm i
R_SQWi = SQWi/ni
for all establishments( i=1,…,N) is calculated. The quota of unfilled qualified jobs SQW to the total number of qualified workers (QW) can also be employed:
R_UQJit=SQWit/QWit.
Table 1 presents the descriptive statistics of D_SQW, SQW, R_SQW and R_UQJ for the years 2007 -2012. D_SQW includes establishments with information over the entire period 2007-2012 (N=6,977). Others are excluded in order to avoid specific sample selection effects. Line (1) in Table 1 reveals clear effects of the Great Recession. In 2009 we observe an obvious decline of skill shortage. Nevertheless in spite of the strongest slump of sales since the Great Depression 1929/30, the shortage does not completely vanish. More than 7 percent of the firms could not fill all qualified jobs in this year. During the recovery period , the percentage increases again and exceeds the pre-crisis level. It seems that labor hoarding in 2009 had no remarkable effects on the further development of skill shortage.

10
Table 1: Descriptive statistics of indicators of skill shortage
____________________________________________________________________________________
2007 2008 2009 2010 2011 2012
_____________________________________________________________________________________
(1) D_SQW 0.091 (0.287) 0.111 (0.315) 0.071 (0.256) 0.098 (0.298) 0.135 (0.342) 0.137 (0.344)
(2) SQW 5.426(13.426) 6.400 (37.916) 5.129 (17.942) 3.712 (6.777) 4.920(19.593) 4.713(16.465)
(3) R_SQW 0.089 (0.152) 0.082 (0.114) 0.087 (0.132) 0.073 (0.095) 0.079 (0.105) 0.079 (0.117)
(4) R_UQJ 0.141 (0.280) 0.141 (0.290) 0.135 (0.245) 0.122 (0.221) 0.125 (0.245) 0.131 (0.249)
_____________________________________________________________________________________
Notes: mean and standard deviation in parentheses is presented in this table. SQW - number of qualified vacancies that could not be filled; D_SQW is a dummy, where D_SQW=0 if SQW=0 and D_SQW=1 if SQW>0; R_SQW = SQW/n; R_UQJ=SQW/QW; n is the total number of employees in a firm and QW is the number of qualified workers.
Source: IAB Establishment Panel 2007-2012
The picture changes a little bit when the absolute number of unfilled qualified jobs is considered. The kernel density estimation in Figure 1 demonstrates for the year 2009 that the number of qualified vacancies is usually small and in line (2) of Table 1 we see that the dispersion is large. There, only those firms are incorporated that have unfilled qualified job vacancies. In this case the number of observations varies between the years (2007: 615; 2008: 771; 2009: 490; 2010: 670; 2011: 926; 2012: 941). The average number of vacant skilled jobs is highest in 2008 and then falls to a minimal value in 2010. The following increase is lower than in the pre-crisis period. It is not clear whether labor hoarding or more successful measures or a completely different firm’s strategy induced by the crisis is responsible for this development. The indicators R_SQW and R_UQJ document also that the degree of shortage is lowest in 2010. The development over the entire period is comparable to that of SQW. Insofar the numerator in line (3) and (4) governs the movement. It is interesting to note that the conditional average of D_SQW in 2009 under D_SQW=1 in 2007 or 2008 is higher (0.243) than the comparable value (0.197) under D_SQW=1 in 2010, 2011 or 2012. An interpretation is the following: the pre-crisis situation is more important for the shortage status in 2009 than the latter for the further development. This assessment is in accord with Burda and Hunt (2011) who explain the labor market miracle in Germany with the reluctance of German firms to hire additional employees in the pre-crisis phase.
The average number of years with skill shortage (TSQW) is 0.643 with a standard deviation of 1.197 including the establishments without skill shortage over all 6 years (N=6,977). The frequency distribution can be found in the Appendix, Table A1. More than two-thirds of the establishments had no bottlenecks of qualified workers. In less than 5 percent of the firms we observe in the sample four or more years with

11
skill shortages. The average of those with one or more shortage years is 2. It seems that most firms overcome short-run bottlenecks by various specific measures.
Skill shortage does not vary unsystematically over time. Figure 2 makes clear that the number of unfilled skilled jobs usually increase with the firm size. In 2007-2009 this relationship is not effective for large establishments. We observe a sharp slump especially in 2008. Many other firms’ characteristics differ significantly between companies with and without unfilled qualified jobs as can be seen in the Appendix, Table A2. Related to some properties the two types of companies seem to correspond. A mean comparison t-test does not reject the null hypothesis that the labor productivity does not differ. An earlier study (Gerlach/Hübler 2012) found that the productivity had also no influence on the speed to overcome the 2009 crisis, while the existence of a working time account has contributed to a speedier solution. So far we have only presented empirical results from different one- and two-dimensional perspectives. Of course, some of the firms’ characteristics correlate.
4 Methods and econometric estimations 4.1 Econometric strategy
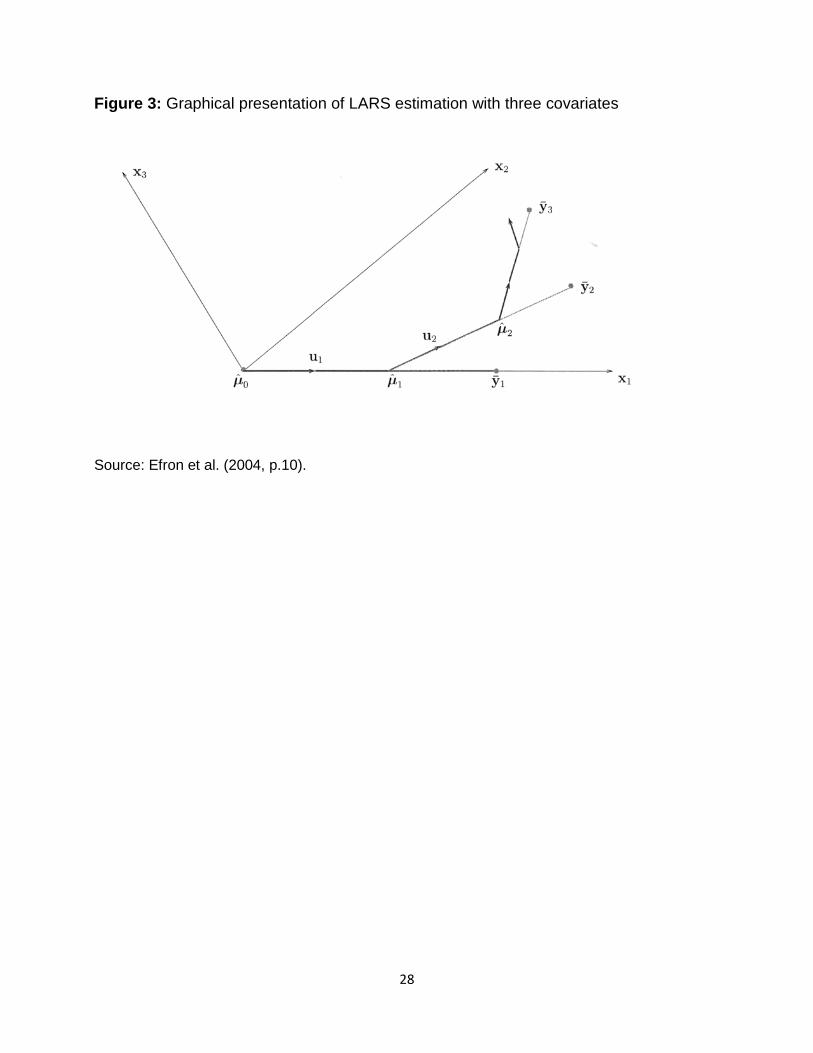
No theory can convincingly explain why some companies report skills shortage. It is also not clear why among such firms some have only minor problems. For others the difficulties are both significant and long-term. Our econometric analysis starts with the selection of firms’ characteristics that are relevant in a statistical sense. For this purpose least angle regression (LARS) is applied (Efron et al. 2004). Among a collection of m available covariates a parsimonious set for the efficient prediction of response variables is selected. Only m steps are required. Each step adds one covariate to the model so that after k steps just k coefficients are nonzero. The procedure is started with all coefficients equal to zero and finds the predictor most correlated with the response, say x1 – see Figure 3. The largest step possible in the direction of this predictor is taken until another predictor, say x2, has as much correlation with the current residual. LARS proceeds in a direction equiangular between the two predictors, x1 and x2, until a third predictor, x3, earns its way into the “most correlated” set.
LARS proceeds equiangularly between x1 x2 and x3, that is, along the “least angle direction” until a fourth variable x4 enters, and so on. The Cp criterion
Cp (μ)=( ||y-μ||2/σ2) – n +2df
is used as the stopping rule, where μ=Xβ and σ2 is the residual variance; df=Σcov(μ,y)/σ2 are the degrees of freedom. The procedure stops, no more regressors are incorporated, if Cp is smallest. Cp is an unbiased estimator of prediction error. Insofar Cp minimization is trying to be an unbiased estimator of the optimal stopping point. Perhaps, the stopping rule can be improved if the df multiplier 2 in Cp is increased. In the Appendix, Table A3 an example of the selection of regressors via LARS is presented where covariates are selected to determine German skill shortage in 2012.
Conventional forward stepwise regressions are too strongly focused on the prediction accuracy. The Lasso (least absolute shrinkage and selection operator) alternative (Tibshirani 1996) has also a parsimony

12
property. The sum of squared residuals is minimized under the restriction that for each step the absolute norm of the estimated coefficients is not larger than the number of the completed number of steps. Both methods are variants of LARS. There are many criticisms of stepwise regression, one of which is that the regression coefficients are too large. Ridge regression is one method of model-building that shrinks the coefficients by making the sum of the squared coefficients less than some constant. Lasso tends to shrink the OLS coefficients toward 0. Shrinkage often improves prediction accuracy, trading off decreased variance for increased bias (Efron et al. 2004, p.409).
The second step is to estimate probit models where the dependent variable is the dummy D_SQW (=1 if the firm has notified skills shortage). First, only the covariates, selected by LARS, are incorporated. Then, measures are added that are more or less intended to eliminate lack of qualified personnel. Dummies are only incorporated so that the effects can be better compared. From the IAB establishment panel the following dummies can be calculated: Appren, Train, RPlan, OldW, Leasing, Foreign, HWage, Fam+Work and AttrWC. In Appendix, Table A6, these variables and descriptive statistics in 2011 are described. Additionally, we investigate whether high technology – HighTech – (Haskel/Martin 2001) and labor hoarding (HOARD) in the previous period have influence on skills shortage. Hoarding is often measured by the vacancy-unemployment rate, working hours or productivity (Dietz et al. 2010). The first cannot be determined at the firm-level. The latter two are not only affected by hoarding (Hübler 2010). In this paper labor hoarding is determined from the information from the following question of the IAB Establishment Panel 2008-2012: Assume the demand for products increases, would it be possible to satisfy the additional sales with the available personnel and capital? If the management has answered: Yes, this is possible, it is assumed that labor was hoarded in the past. As supplement, labor productivity (PROD=sales/(1000*firm size)) is incorporated. The lower the latter, the higher is the potential that an extension is possible and that the skill bottlenecks can be reduced.
The third step is to analyze the influences of firms’ characteristics where some establishments report never skill shortage (TSQW=0), others only in one year (TSQW=1) and again others more than once (TSQW>1). For this purpose multinomial estimates can be presented. We can distinguish between no, short-run and long-run skill shortages. Another possibility is to apply the negative binomial regression method. We compare whether the number of years with skill shortage (TSQW) is affected by the same variables as a single skill shortage.
The fourth step is focused on the share of unfilled jobs with respect to the total number of employees (R_SQW) where we concentrate on firms reporting one or more years of skill shortage. We start with OLS estimates.
Five methodological problems should be considered. First, skill shortage can induce corrective measures and the measures can affect the amount of unfilled jobs. Therefore, IV estimates are applied. For this purpose, actual applied measures are substituted by the management’s assessments which of specific strategies are important to secure the demand for skilled workers in future. The instruments are described in Table A7. On the one hand, we guess that a high assessment is correlated with actual measures. Insofar, we suppose that the instruments are not weak. This will be established statistically by an F test for significance of instruments in the first stage regression. On the other hand, it is not necessary that currently measures are applied that are important in future satisfying needs for skilled

13
personnel. Other measure may be superior in the actual situation. Some firms are possibly more short-run than long-run oriented or none of the successful long-run strategies is adequate to overcome urgent current problems. We assume that an important future strategy does not affect directly the amount of skill shortage but only indirectly via concrete measures. An OIR (overidentifying restrictions) test is applied. We incorporate a strategy dummy S (=1, if the strategy is assessed as important to satisfy the demand for skilled workers in future) into the skill shortage equation including actual measures and test whether S has a significant influence on R_SQW – see Table 1 to the definition.
Second, a sample selection problem is possible. The situation that a firm reports on skill shortage may be due to self-selection so that a nonrandom sample results. Unfilled jobs may constitute a smaller problem for the firms with respect to profits or costs than measures to redress the problem or vice versa. In this event, the amount of unfilled jobs and the decision to allow skill shortage correlate. In other words, an OLS estimator of the former can be inconsistent. The Heckit estimator provides a solution.
Third, outliers may strongly influence the estimates. Fourthly, not always a single measure but a bundle of measures is applied to combat skilled vacancies. Then multicollinearity may be a problem. An alternative to the incorporation of different measures into the skill shortage equation is to carry out a principal component (PC) analysis and determine factor scores of the different components. The latter are incorporated as artificial regressors were we experiment with the given number of PCs. Three or four factors seem adequate based on the Kaiser criterion. Fifthly, a matching estimator of treatment effects is useful, when the selection into treatment is based only on observable variables.
Therefore, as robustness checks the following approaches are applied: the Mahalanobis metric matching estimator (Rubin 1980), a truncated regression model using Heckman’s two-step procedure (Heckman 1979), the quantile regression estimator (Koenker/Basset 1978) and 2SLS instrumental variables estimators. Additionally, the different measures are clustered by a principal component analysis with VARIMAX rotation. The purpose of this modification is to show that multicollinearity between the different measures does not change the basic outcome. Finally, the dependent variable is substituted by the share of unfilled skilled jobs in respect to the entire number of qualified workers in the firm. We will see that the alternative definition of skill shortage induces only weak changes in the estimates.
4.2 Econometric results
4.2.1 Firms’ characteristics as determinants of skill shortage
In Table 2 the probit estimates are split by the years 2007-2012. This is more a reduced form equation than a causal relationship. The dependent variable is a dummy denoting whether a firm has reported a lack of skilled workers (D_SQW). The lack of skilled workers is larger in the service sector (SERVICES) than in the manufacturing sector. In the trade sector (TRADE) problems are less severe.
In southern Germany (SOUTH) the shortage is usually more pronounced than in other regions. This is demonstrated by the significantly positive effects in the beginning and at the end of the period 2007-2012. It is interesting to note that the coefficient is significantly negative in 2010. This can be explained by the fact that the south was especially affected by the crisis and firms have hoarded labor at this stage.

14
Table 2: Probit ML estimates of skill shortage
Variable | 2007 2008 2009 2010 2011 2012
--------------------+-------------------------------------------------------------------------------------------------
SOUTH | 0.0975* 0.0429 0.0155 -0.1148** -0.0122 0.0925**
SERVICES | 0.1389** 0.1789*** 0.3580*** 0.2353*** -0.0333 0.1243**
TRADE | -0.1864** -0.2941*** -0.2093** -0.1733** -0.2761*** -0.2386***
EXPORT | 0.1947*** 0.0654 -0.1136** -0.0093 -0.0482 -0.0482
WTA | 0.2236*** 0.3033*** 0.2962*** 0.3972*** 0.3992*** 0.3677***
COMP | 0.2061*** 0.2098*** 0.0386 0.1070** 0.1602*** 0.1426***
SKILL | 0.1367 0.1717* 0.2575** 0.1791* 0.3609*** 0.2970***
FEMALE | -0.4875*** -0.4691***-0.0033 -0.0326 -0.1675* -0.2871***
WOCO | 0.0156 -0.0510 -0.0744 -0.1617***-0.0328 -0.0984*
FOUND | -0.2091*** -0.1604*** -0.2031*** -0.1633*** -0.1705***-0.1077**
TRAIN | 0.1451** 0.2406*** 0.2662*** 0.2765*** 0.3578*** 0.2814***
HWAGE | 0.2760*** 0.2034*** 0.2229*** 0.3457*** 0.2332*** 0.2246***
PS | 0.2750*** 0.2650*** 0.2699*** 0.2756*** 0.2153*** 0.2272***
MINI-J | -0.5743*** -0.3177* -0.4966** -0.7366*** -0.1482 -0.0981
MANAG | 0.1067* 0.1392** 0.1418** 0.1270** 0.0854 0.0260
PEXS | 0.3351*** 0.3931*** 0.2326*** 0.3513*** 0.3683*** 0.3197***
HOARD | -0.3332*** -0.2929*** -0.2246***-0.2677*** -0.2421***
_cons | -1.8556*** -1.6999*** -2.1001*** -1.9725***-1.8590*** -1.7220***
--------------------+---------------------------------------------------------------------------------------------------
N | 6773 6754 6773 6769 6768 6769
Notes: All independent variables are dummies; most of them are explained in Table A2 or Table A4, where also descriptive statistics are presented. Further variables are: TRADE - trade sector, WOCO - works council, FOUND - firms founded before 1990, TRAIN - further training, MINI-J - mini-jobs, MANAG - professional managers; * p<0.1; ** p<0.05; *** p<0.01.
15
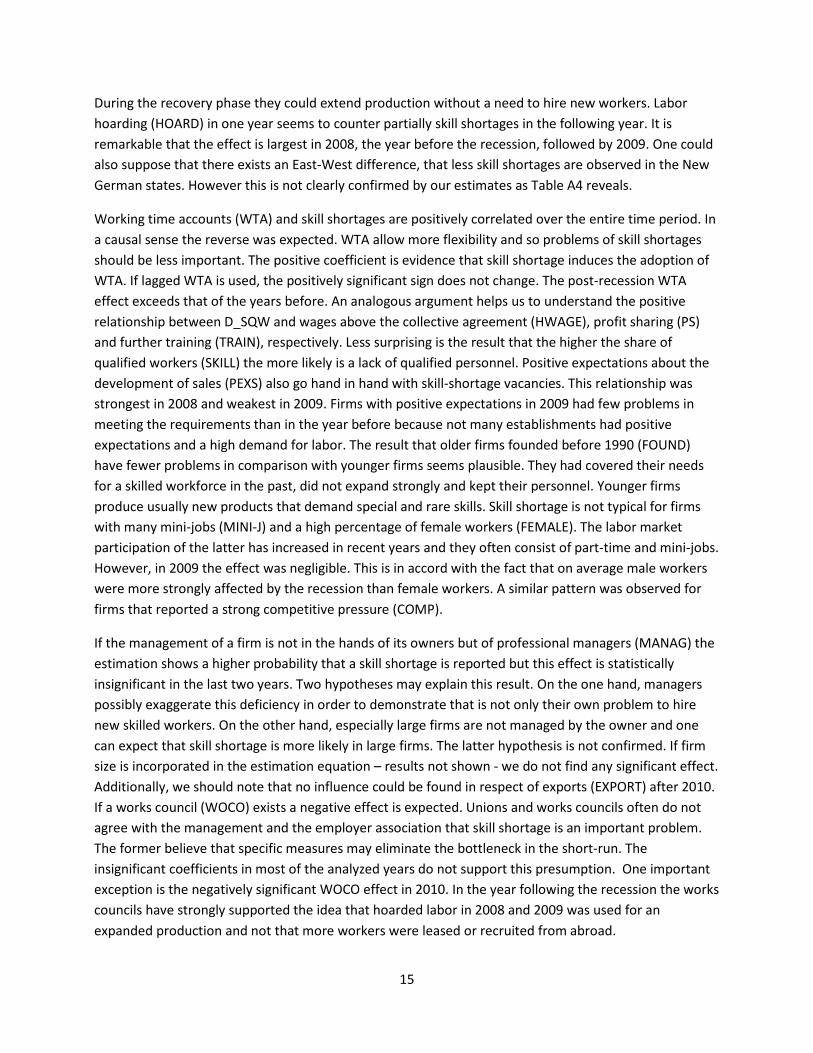
During the recovery phase they could extend production without a need to hire new workers. Labor hoarding (HOARD) in one year seems to counter partially skill shortages in the following year. It is remarkable that the effect is largest in 2008, the year before the recession, followed by 2009. One could also suppose that there exists an East-West difference, that less skill shortages are observed in the New German states. However this is not clearly confirmed by our estimates as Table A4 reveals.
Working time accounts (WTA) and skill shortages are positively correlated over the entire time period. In a causal sense the reverse was expected. WTA allow more flexibility and so problems of skill shortages should be less important. The positive coefficient is evidence that skill shortage induces the adoption of WTA. If lagged WTA is used, the positively significant sign does not change. The post-recession WTA effect exceeds that of the years before. An analogous argument helps us to understand the positive relationship between D_SQW and wages above the collective agreement (HWAGE), profit sharing (PS) and further training (TRAIN), respectively. Less surprising is the result that the higher the share of qualified workers (SKILL) the more likely is a lack of qualified personnel. Positive expectations about the development of sales (PEXS) also go hand in hand with skill-shortage vacancies. This relationship was strongest in 2008 and weakest in 2009. Firms with positive expectations in 2009 had few problems in meeting the requirements than in the year before because not many establishments had positive expectations and a high demand for labor. The result that older firms founded before 1990 (FOUND) have fewer problems in comparison with younger firms seems plausible. They had covered their needs for a skilled workforce in the past, did not expand strongly and kept their personnel. Younger firms produce usually new products that demand special and rare skills. Skill shortage is not typical for firms with many mini-jobs (MINI-J) and a high percentage of female workers (FEMALE). The labor market participation of the latter has increased in recent years and they often consist of part-time and mini-jobs. However, in 2009 the effect was negligible. This is in accord with the fact that on average male workers were more strongly affected by the recession than female workers. A similar pattern was observed for firms that reported a strong competitive pressure (COMP).
If the management of a firm is not in the hands of its owners but of professional managers (MANAG) the estimation shows a higher probability that a skill shortage is reported but this effect is statistically insignificant in the last two years. Two hypotheses may explain this result. On the one hand, managers possibly exaggerate this deficiency in order to demonstrate that is not only their own problem to hire new skilled workers. On the other hand, especially large firms are not managed by the owner and one can expect that skill shortage is more likely in large firms. The latter hypothesis is not confirmed. If firm size is incorporated in the estimation equation – results not shown - we do not find any significant effect. Additionally, we should note that no influence could be found in respect of exports (EXPORT) after 2010. If a works council (WOCO) exists a negative effect is expected. Unions and works councils often do not agree with the management and the employer association that skill shortage is an important problem. The former believe that specific measures may eliminate the bottleneck in the short-run. The insignificant coefficients in most of the analyzed years do not support this presumption. One important exception is the negatively significant WOCO effect in 2010. In the year following the recession the works councils have strongly supported the idea that hoarded labor in 2008 and 2009 was used for an expanded production and not that more workers were leased or recruited from abroad.

16
The comparison between the yearly estimates in Table 2 does not reveal always clear differences. From a statistical perspective we can incorporate interaction variables between year dummies and firm characteristics, where the time dummy of 2009 and interactions between this year and firm characteristics are excluded as base categories. Then we can test whether the influence of the incorporated interaction variables is significant. The results, based on random effects estimation, are presented in Table A5. We observe that the influence of some interactions is statistically different from that of 2009, the recession year, while interactions with other firm characteristics do not highlight in none of the two pre-recession (2007 and 2008) and the three post-recession years (2010-2012) remarkable deviates from 2009. Variables of the first type are SERVICE SECTOR, EXPORTS, COMPETITIVE PRESSURE and SHARE of FEMALE WORKERS. The second type includes TRADE SECTOR, SHARE of SKILLED WORKERS, WORKS COUNCIL, FOUNDATION BEFORE 1990, FURTHER TRAINING, PROFIT SHARING, SHARE of MINI JOBS und NON-OWNER MANAGEMENT.
When tested, an explicit incorporation of specific policy measures to eliminate bottlenecks of qualified workers, mentioned in section 2.3 and 4.1, did not show the expected effects. The results are not presented in the tables. Neither the recruitment of foreign workers or leasing nor wages above collective agreements, a solid plan of staffing requirements, training, incentives for older workers to postpone the retirement, attractive working conditions nor a family friendly firms’ policy can be identified as helpful in removing a source of capacity limitations.
We undertook robustness checks. Firstly, we tested whether productivity (PROD) instead of the applied hoarding variable (HOARD) is also a suitable proxy. We find in 2007, 2008 and 2011 (not in the tables) that the higher the labor productivity the lower is the risk of a skill shortage. In these years the results are analogous those that under using HOARD. In 2009 and 2010 only insignificant PROD effects are displayed. The estimated PROD coefficients and in parentheses the t-values are the following
2007: -0.0001638 (-2.09)
2008: 0.0001999 (-2.28)
2009: -0.0001015 (-1.19)
2010: -0.0000726 (-0.95)
2011: -0.0003214 (-2.63).
This result is not satisfactory because the situation in 2009 differs completely from that in 2010. In the former case productivity is low because sales had fallen dramatically while the number of employees remained nearly constant or only slightly reduced. In the latter case, productivity is again higher due to the increase of sales. The outcome provides an argument for HOARD instead of PROD.
Haskel and Martin hypothesize that firms with a high percentage of IT investments have more problems than other firms in hiring skilled workers. We do not find any evidence for this. Only in 2008 is the coefficient of the regressor “percentage of IT investments to the entire investments” significant and

17
positive. In the other years the effect is completely insignificant. The estimated coefficients and in parentheses the t-values are the following
2007: 0.0001424 (0.14)
2008: 0.0021184 (2.16)
2009: 0.0011156 (1.04)
2010: -0.0001589 (-0.16)
2011: -0.0003700 (-0.38)
2012: -0.0002691 (-0.34).
Furthermore, we investigated whether skill shortage is concentrated on one period, whether the problems are short-run, or whether we find bottleneck clusters. As mentioned in section 3, based on the results of Table A1 it is clear that the majority of firms have not experienced a bottleneck in more than one year. Did previous bottlenecks increase the probability of a current bottleneck? The answer is yes in respect of all five years. The estimated coefficients of the lagged endogenous variable as a regressor with the t-value in parentheses are the following
2008: 1.2364 (16.68)
2009: 0.9410 (12.55)
2010: 0.8320 (12.95)
2011: 0.9707 (16.47)
2012: 1.0285 (20.20).
In a more extensive investigation (not reported in Tables), a separate estimation for firms with an without previous bottlenecks reveals some new results: (i)The share of qualified workers has only significant effects in firms where bottlenecks were observed in the past; (ii) wages above collective agreement and shortage of skilled professionals are only significantly correlated over the entire period from 2007 to 2012 in firms with more long-run bottlenecks; (iii) works councils appear only to be influential in the avoidance short-run bottlenecks of skilled workers. Furthermore, a multinomial estimation is employed where we distinguish between three alternatives (TSQW=0 – no year with skill shortage; TSQW=1 – only one year with skill shortage; TSQW>1 – more than one year with skill shortage). From this, it is interesting to mention – not in the tables - differences between TSQW=1 and TSQW>1 in the influence of some firms’ characteristics on the skill shortage probability. The latter case, TSQW>1, reveals significantly positive effects of the share of qualified workers and wages above collective agreement but significantly negative effects of productivity on the probability of skill shortage. Under TSQW=1 we do not find any significant influences of these regressors.

18
The comparison of Table A8, where negative binomial regressions are employed, with Table 2 shows the following remarkable results: (a) the effects on the number of bottlenecks are more stable than in the probit estimates and only in very few cases insignificant. No sign changes are observed with the exception of the insignificant covariate that the management is not led by the owner. (b) Recession effects can hardly be detected in Table A8.
4.2.2 The effects of measures to reduce skill shortage
In the following, the investigation is restricted to firms with skill shortages. The same determinants are assumed as in Table 2. The share of unfilled skilled jobs to the entire number of employees is now used as the dependent variable. Again, the LARS procedure is employed to select the set of control variables as in Table A3. Additionally, productivity and the percentage of IT investments are incorporated. The LARS estimates show that the statistically relevant variables are nearly the same but not completely identical. Now, it is important whether the establishment belongs to the manufacturing industries (MANUFACT) while labor hoarding (HOARD) is irrelevant. The analysis is focused on the question whether some measures contribute to reduce skill shortage
In Table 3 the results of the IV estimates are presented where only the coefficients and significance of the measures and not those of the firms’ characteristics are displayed. For the applied instruments see section 4.1 and Table A7. The tests for weak instruments (WI) in Table A9 show that the null hypothesis has to be rejected except for strategy S4, S6 and in some cases S9 – see Table A7 for the definitions of the strategies. The OIR tests display only in very few cases a significant direct influence of the instruments on the ratio of unfilled skilled jobs to the entire number of employees.
The estimates highlight a clear and significant effect if the firms have trained apprentices in the past. On average, the number of unfilled qualified jobs in relation to the firm size is lower. This effect holds over the entire period 2007-2012 where the absolute effect was larger in the pre-recession period. The decrease of the number of new apprentices since the Great Recession – see section 2.2 - may be an explanation. Further training induces similar effects with smaller but also significant coefficients. In 2010 we do not find any training effect. In the recession year 2009 many hoarded employees with reduced working time were trained. It is not unexpected that the training effect in this year was largest while in the next year it is negligible (cf. Bellmann et al. 2014). The only further reduction effect is found by a requirement plan for the personnel. We should note that this result holds only in the pre-recession phase, in 2008. All other measures are not successful. As a supplement a random effects estimator with year dummies and interaction variables between year dummies and firm characteristics is presented in Table A5. The results confirm that skill shortages are larger in the years before and after the Great Recession. We can also recognize that the influence of firm characteristics on skill shortages varies from year to year. However, the interaction effects are insignificant in the most cases. This is especially due to multicollinearity. A significant variation is revealed in interactions between the service sector and year dummies. Here we can see that the negative correlation between the service sector and skill shortages is weaker in 2009 compared with the other years. The opposite is observed for the interaction between exports and year dummies or between competitive pressure and the year dummies.

19
Table 3: Instrumental variables estimation of the ratio of unfilled skilled jobs to the entire number of employees among firms with skill shortage
Measure | 2007 2008 2009 2010 2011 2012
---------------------+-------------------------------------------------------------------------------------------------------
Appren | -0.0838*** -0.0588*** -0.0444*** -0.0368*** -0.0450*** -0.0412***
Train | -0.0451*** -0.0311** -0.0622*** -0.0184 -0.0464*** -0.0377***
RPlan | -0.0129 -0.0422** -0.0208 -0.0331 -0.0169 -0.0224
OldW | -0.0086 -0.0306 -0.0157 -0.0449 -0.0061 -0.0095
Leasing | 0.0057 -0.0229 -0.0229 -0.0363 -0.0091 -0.0083
Foreign | -0.0141 0.0224 -0.0092 -0.0131 -0.0027 -0.0126
HWage | 0.0087 0.0053 0.0020 0.0065 0.0093 0.0050
Fam+Work | 0.0013 -0.0576 -0.0157 -0.0372 0.0087 0.0040
AttrWC | -0.0038 0.1695 0.0421 0.1410 0.0119 0.0142
--------------------+-------------------------------------------------------------------------------------------------------
N | 554 671 405 583 818 810
Notes: The measures Appren … AttrWC are explained in Table A4 and the instruments in Table A5. Further covariates determined by LARS are manufacturing, services sector, trade sector, exports, working time accounts, competitive pressure, share of qualified workers, share of female workers, works council, foundation of the firm before 1990, labor hoarding; * p<.1; ** p<.05; *** p<.01.
Furthermore, we should mention that outliers do not affect the estimates. The coefficients of the median estimator – see Table A10 - are similar as that of Table 3. The estimates do not react sensitive if the dependent variable is modified, namely if the denominator is exchanged by the number of all qualified employees in the firm – see Table A11.
In Table 3 the inverse Mills ratio λ as an artificial regressor is neglected, because no statistical influence could be discovered except in 2008. The incorporation of λ reduces the apprentice training effect of Table 3 but the coefficients are similar – compare Table A12. Furthermore, we should note that in this case the development of a requirements plan for the personnel seems more helpful than in Table 3. Except in 2010 we find a negatively significant correlation with the number of unfilled skilled jobs in relation to the firm size. By and large, the other results do not differ strongly from the estimates without the regressor λ.

20
The principal component analysis with varimax rotation including Heckman’s sample selection correction confirms our previous results. It should be noted that, if three factors are extracted, only the first one with high loading on vocational and further training, requirement plans for the personnel and high wages reduce significantly the number of vacant qualified jobs. If four factors are extracted, also only the first component that has a high loading on apprenticeship and further training is statistically significant – see Table A13.
As a further robustness check we apply the Mahalanobis metric matching method – see Table A14. The propensity score is determined with the same covariates as in Table 2. The disadvantage of this procedure is the small number of observations. For each firm that applies a specific measure we look for a statistical twin without such a measure. The results from Table 3 are confirmed – see Table A14. If apprentices were trained in the past, on average, the number unfilled qualified jobs are lower than in other firms. From a statistical perspective, the effect of further training is less clear than that in Table 3 while the effect of the existence of a requirements plan for the personnel is a little bit more pronounced. Only in 2010 is the influence insignificant.
5 Summary and outlook Skill shortage is an increasing long-run phenomenon with a break during the Great Recession. This does not mean that the number of vacant qualified jobs per establishment increases. Frequently, firms have only short-run problems. We find that young firms in the service sector with competitive pressure, high wages, profit sharing and working time accounts that have not hoarded skilled workers in the past report a higher propensity to skill shortage than other firms. In 2009, the recession year, the estimates reveal only a weak or no relationship between structural characteristics of the firm and skill shortage. If firms are exposed to competitive pressure they report problems to fill all skilled vacancies. In 2009, however, we cannot find this correlation. Given increased job losses in the labor market, it was easier to find qualified workers. Firms benefited from labor hoarding during the recession. This might help to explain why skill shortages of exporting firms in 2007 and 2008 vanish in the post-recession period. These firms had the largest decline of sales in 2009 but remained optimistic about future opportunities and hold on to keyworkers.
We have three other main findings. First, firms with a large share of female workers have fewer problems with skill shortages. Second, working accounts and problems in filling qualified vacancies appear to go hand in hand and this relationship is strengthened over the period 2007 to 2012. This is a hint that the number of firms with skill shortage grows and that firms try to reduce the problems in the short-run by working accounts. However, this is not a complete solution. Third, the service sector has more problems and the trade sector less problems with skill shortages than the manufacturing sector. No clear trend can be identified. The bottlenecks in the service sector were relatively largest in 2009.
Specific measures which should help from a political perspective to reduce skill shortage differ strongly in their effects. Firms’ measures can partially reduce the number of unfilled qualified jobs, but cannot completely eliminate the shortage problem. At the firm level, apprenticeship training has proved to be effective in preventing skill shortages. Further training and - with some reservation - plans of needs for skilled workers are further successful instruments. In contrast, monetary incentives and extended hiring

21
of foreign qualified workers, but also a family friendly policy and attractive work conditions had not contributed to firms’ resilience against skill shortages. It is interesting to note that the influence of further training during the Great Recession in 2009 is stronger than in the pre- and post-recession period. The pattern of vocational training effects differs. Here, we have a decreasing trend. Although the empirical analysis demonstrates definitely that vocational training is successful in the fight against the skill shortage a decreasing number of apprentices since the Great Recession is observed. Vocational and further training should be extended and plans of staff requirements contribute that firms react faster and successful on skill shortage.
Future research should investigate whether our findings are stable in the long-run, whether combinations of measures are more successful than only single measures and whether a panel data analysis generates new findings under the consideration of unobserved heterogeneity. It is also of interest to ascertain whether the Great Recession effects differ more among disaggregated industries and whether the post-recession developments have a diverse pattern across different branches of economic activities and regions.

22
References Backes-Gellner, U. and S.N. Tuor (2010): Avoiding Labor Shortages by Employer Signaling – On the Importance of Good Work Climate and Labor Relations, Industrial and Labor Relations Review 63, 271-286.
Bechmann, S. and V. Dahms (2012): Fachkräftesuche und demographischer Wandel. Ergebnisse aus dem IAB-Betriebspanel 2011, mimeo.
Bechmann, S., Dahms, V. Tschersich, N. Frei, M. Leber, U. and B. Schwengler (2012): Fachkräfte und unbesetzte Stellen in einer alternden Gesellschaft. Problemlagen und betriebliche Reaktionen. IAB-Forschungsbericht 13/2012: Nürnberg.
Bellmann, L., Gerner, H.-D. and Leber, U. (2014): Firm-Provided Training During the Great Recession. Jahrbücher für Nationalökonomie und Statistik 234:1, 5-22.
Bertelsmann Stiftung 2002: Neue Strategien gegen den Fachkräftemangel. Memorandum.
Brunow, S., Garloff, A., Wapler, R. and G. Zika (2012): Wie wird sich der Arbeitsmarkt langfristig entwickeln? Methoden und Validitäten von Prognosen zur Vorhersage von Arbeitskräfteangebot und –bedarf, IAB-Stellungnahme 1/2012.
Bundesinstitut für Berufsbildung – BiBB (2008): Berufsbildungsbericht 2008, Bonn.
Bundesinstitut für Berufsbildung – BiBB (2013,…,2009): Datenreport zum Berufsbildungsbericht 2013,…,2009 , Bonn.
Bundesministerium für Arbeit und Soziales - BMAS (2011): Arbeitskräftereport.
Bundesministerium für Arbeit und Soziales - BMAS (2011a): Fachkräftesicherung. Ziele und Maßnahmen der Bundesregierung.
Bundesministerium für Wirtschaft und Technologie - BMWi (2012): Fachkräfte sichern. Engpassanalyse.
Bundesverband der Deutschen Industrie (2013): BDI Mittelstandspanel - Ergebnisse der Onlinebefragung, Frühjahr 2013.
Deutscher Gewerkschaftsbund – DGB (2011): Aktueller Fachkräftemangel – Mythos oder Realität? Arbeitsmarkt aktuell, Nr. 5 / September 2011.
Burda, M.C. and J. Hunt (2011): What Explains the German Labor Market Miracle in the Great Recession, Brookings Papers on Economic Activity 42(1), Economic Studies Program, The Brookings Institution, 273-335.
Dietz,M., Stops, M. and U.Walwei (2010): ): Safeguarding jobs through labour hoarding in Germany. Comment, Applied Economics Quarterly, Supplement-Issue 61, 125-150.

23
Dunkel, T. (2011): Qualifikationsprognosen und Fachkräftebedarf in Europa, Berufsbildung in Wissenschaft und Praxis 40, H20155 – 3/2011, 25-29.
Efron, B., Hastie, T., Johnstone, I. and R. Tibshirani (2004): Least angle regression, Annals of Statistics 32(2), 407-451.
Elsby, M.W., Hobijn, B. and A. Sahin (2010): The Labor Market in the Great Recession, Brookings Papers on Economic Activity, Spring 2010, 1-48.
Elsby, M.W., Hobijn, B., Sahin, A. and R.G. Valletta (2011): The Labor Market in the Great Recession – An Update to September 2011, Brookings Papers on Economic Activity, Fall 2011, 353-384.
European Union (2011): Shifts in the job structure in Europe during the Great Recession, European Foundation for the Improvement of Living and Working Conditions, Luxembourg.
Falk, M. (2002): IKT-Fachkräftemangel und Anpassungsreaktionen der Unternehmen. In: Bellmann, L. und J. Velling (Hrsg.): Arbeitsmärkte für Hochqualifizierte. Beiträge zur Arbeitsmarkt- und Berufsforschung 256: Nürnberg, 37-73.
Fischer, G., Dahms, V., Bechmann, S., Bilger, F., Frei, M., Wahse, J. and I. Möller (2008): Langfristig handeln, Mangel vermeiden: Betriebliche Strategien zur Deckung des Fachkräftebedarfs. Ergebnisse des IAB-Betriebspanels 2007. IAB-Forschungsbericht 3/2008: Nürnberg.
Fischer, G., Janik, F., Müller, D. and Schmucker, A. (2009): The IAB establishment panel: Things users should know, Schmollers Jahrbuch für Wirtschafts- und Sozialwissenschaften 129(1), 133-148.
Franz, W. (1994): Arbeitsmarktökonomik, Springer: Berlin.
Geis, W. (2012): Der Beitrag der Zuwanderung zur Fachkräftesicherung, Trends 2/2012.
Gerlach, K. and O. Hübler (2012): Die wirtschaftliche Situation und Entwicklung niedersächsischer Betriebe 2006 bis 2010, in: K. Gerlach, O. Hübler and S. Thomsen (Hrsg.), Arbeitsmarkt und Arbeitsmarktpolitik in Niedersachsen, Hannover, 1-26.
Ghayad, R. (2013): A decompositions of shifts of the Beverage Curve, Federal Reserve Bank of Boston, Public Policy Briefs No. 13-1.
Ghayad, R. and W.T. Dickens (2012): What can we learn by disaggregating the unemployment-vacancy relationship? Federal Reserve Bank of Boston, Public Policy Briefs No. 12-3.
Green; F. and D. Ashton (1992): Skill shortages and skill deficiency: a critique, Work, Employment & Society 6, 287-301.
Green, F., Machin, S. and D. Wilkinson (1998): The meaning and determinants of skills shortages, Oxford Bulletin of Economics and Statistics 60, 165-187.
Haskel, J. and C. Martin (2001): Technology, wages and skill shortages: evidence from UK micro data, Oxford Economic Papers 53, 642-658.

24
Haskel, J. and M.J. Slaughter (2001): Trade, technology and U.K. wage inequality, Economic Journal 111, 163-187.
Heckman, J.J. (1979): Sample selection bias as a specification error, Econometrica 47, 153-161.
Heidemann, W. (2012): Zukünftiger Qualifikations- und Fachkräftebedarf. Handlungsfelder und Handlungsmöglichkeiten – Ein Überblick, Hans Böckler Stiftung, mimeo.
Hübler, O. (2010): Safeguarding jobs through labour hoarding in Germany. Comment, Applied Economics Quarterly, Supplement - Issue 61, 151-165.
Industrie- und Handelskammer – IHK (2011): Sicherung des Fachkräfteangebots in Berlin im demographischen Wandel, Berlin.
Institut der deutschen Wirtschaft Köln (2012): Was machen Unternehmen gegen Fachkräfteengpässe?
Kettner, A. (2012): Fachkräftemangel – Fakt oder Fiktion? Empirische Analysen zum betrieblichen Fachkräftebedarf in Deutschland. Bertelsmann: Bielefeld. IAB-Bibliothek 337.
Klinger, S., Rebien, M., Heckmann, M. and J. Szameitat (2011): Did Recruitment Problems Account for the German Job Miracle? International Review of Business Research Papers 7, 265-281.
Kölling, A. (2002): Wer suchet, der findet… mehr oder doch nicht? – Analyse der betrieblichen Suche nach Fachkräften mit Daten des IAB-Betriebspanels. In: Bellmann, L. und J. Velling (Hrsg.): Arbeitsmärkte für Hochqualifizierte. Beiträge zur Arbeitsmarkt- und Berufsforschung 256: Nürnberg, 3-36.
Kolodziej, D. (2011): Fachkräftemangel in Deutschland. Statistiken, Studien und Strategien, Deutscher Bundestag – Wissenschaftliche Dienste – Infobrief WD 6 - 3010-189/11.
König, M., Clausen, H. und C. Schank (2012): Fachkräftemangel in der Sozialwirtschaft. Eine empirische Studie, mimeo.
Koenker, R. and G. Bassett (1978): Regression Quantiles, Econometrica 46, 33-50.
Kubis, A., Leber, U., Müller, A. and J. Stegmaier (2013): Der Arbeitskräftebedarf in Deutschland 2006 bis 2011: Nachfrage, Rekrutierungsprozesse und Engpässe aus Sicht der Betriebe. IAB -Bibliothek 339, Bertelsmann: Bielefeld.
Lakey, S. (2012): Research to Evaluate the Shortage of Skilled Workers in Northern Alberta, prepared for the Northern Alberta Labor Market Information Clearinghouse Project.
Lazear, E.P., Shaw, K.L. and C. Stanton (2013): Making do with less: Working harder during recessions, NBER Working Paper No. 19328.
Maier, T., Troltsch, K. and G. Walden (2011): Längerfristige Entwicklung der dualen Ausbildung, Berufsbildung in Wissenschaft und Praxis 40, H20155 – 3/2011, 6-8.

25
Möller, J. (2010): The German labor market response in the world recession – de-mystifying a miracle, Journal of Labour Market Research 43(4), 325-336.
Neumark, D., Johnson, H.P. and M.C. Mejia (2012): Future skill shortages in the U.S. Economy? NBER Working Paper No. 17213.
Oi, W. (1962): Labor as a quasi-fixed factor, Journal of Political Economy 70. 538-555.Platt, H. and M.B. Platt (2011): Revisiting the labor hoarding employment demand model: an economic order quantity approach, Journal of Finance Transformation 31, 158-163.
Prognos AG - Hrsg. (2010): Arbeitslandschaft 2030 – Auswirkungen der Wirtschafts- und Finanzkrise, Basel.
Rubin, D.B. (1980): Percent bias reduction using Mahalanobis metric matching, Biometrics 36, 293-298.
Tibshirani, R. (1996): Regression shrinkage and selection via the lasso, Journal of the Royal Statistical Society, Series B 58, 267-288.
Venn, D. (2009): Legislation, collective bargaining and enforcement: Updating the OECD employment protection indicators. OECD Social, Employment and Migration Working Papers 89, Paris: OECD.
West, D.M. (2013): The paradox of worker shortages at a time of high national unemployment, Governance Studies at Brookings.
Zagelmeyer, St., Heckmann, M. and A. Kettner (2012): Management responses to the global financial crisis in Germany, Adjustment mechanisms at establishment level, International Journal of Human Resource Management 23(16), 3355-3374.
Zimmermann, K. (2011): Stellungnahme anlässlich der öffentlichen Anhörung des Ausschusses für Arbeit und Soziales des Deutschen Bundestages am 21. Februar 2011.

26

27
28
Figure 3: Graphical presentation of LARS estimation with three covariates
Source: Efron et al. (2004, p.10).

29
Appendix
Table A1: Frequency distribution of number of years with a skill shortage (TSQW)
TSQW | Freq. Percent Cum.
------------+-----------------------------------
0 | 4,726 67.74 67.74
1 | 1,156 16.57 84.31
2 | 490 7.02 91.33
3 | 288 4.13 95.46
4 | 165 2.36 97.82
5 | 85 1.22 99.04
6 | 67 0.96 100.00
------------+-----------------------------------
Total | 6,977 100.00
----------------------------------------- -----------------------------------------------------------------------------------------------

30
Table A2: Two-sample t tests on mean differences with unequal variances split by establishments with (=1) and without (=0) unfilled qualified jobs in 2011
Variable mean std.dev. t-value prob.value
Southern Germany 0 | 0.2094 0.4077
(SOUTH) 1 | 0.2606 0.0143 1.741 0.041
Manufacturing 0 | 0.2174 0.4133
(MANUFACT) 1 | 0.3411 0.4743 4.093 0.000
Services 0 | 0.5731 0.4956
(SERVICES) 1 | 0.4121 0.4924 -4.596 0.000
Export 0 | 0.5217 0.5005
(EXPORT) 1 | 0.4343 0.4959 -2.472 0.007
Working time account 0 | 0.7154 0.4521
(WTA) 1 | 0.8358 0.3706 3.899 0.000
Competitive pressure 0 | 0.3280 0.4704
(COMP) 1 | 0.4459 0.4973 3.497 0.000
Share of qualified workers 0 | 0.6753 0.3028
(SKILL) 1 | 0.7759 0 .2021 4.989 0.000
Share of female workers 0 | 0.4275 0.2833
(FEMALE) 1 | 0.3763 0.2971 -2.524 0.006
Positive expectations of sales 0 | 0.3280 0.4704
(PEXS) 1 | 0.4304 0.4954 3.037 0.001
Wages above collective agreement 0 | 0.1706 0.3769
(HWAGE) 1 | 0.2675 0.4429 3.487 0.000
Profit sharing 0 | 0.1694 0.3758
(PS) 1 | 0.2818 0.4501 4.010 0.000
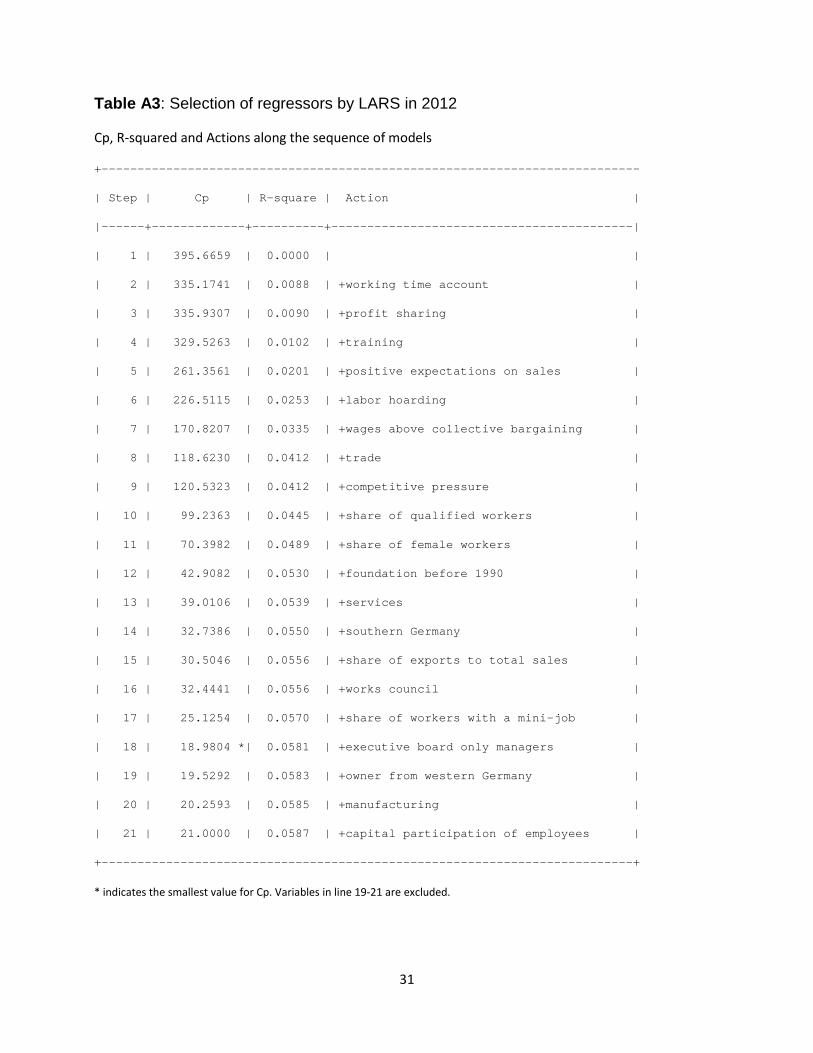
31
Table A3: Selection of regressors by LARS in 2012
Cp, R-squared and Actions along the sequence of models
+---------------------------------------------------------------------------
| Step | Cp | R-square | Action |
|------+-------------+----------+------------------------------------------|
| 1 | 395.6659 | 0.0000 | |
| 2 | 335.1741 | 0.0088 | +working time account |
| 3 | 335.9307 | 0.0090 | +profit sharing |
| 4 | 329.5263 | 0.0102 | +training |
| 5 | 261.3561 | 0.0201 | +positive expectations on sales |
| 6 | 226.5115 | 0.0253 | +labor hoarding |
| 7 | 170.8207 | 0.0335 | +wages above collective bargaining |
| 8 | 118.6230 | 0.0412 | +trade |
| 9 | 120.5323 | 0.0412 | +competitive pressure |
| 10 | 99.2363 | 0.0445 | +share of qualified workers |
| 11 | 70.3982 | 0.0489 | +share of female workers |
| 12 | 42.9082 | 0.0530 | +foundation before 1990 |
| 13 | 39.0106 | 0.0539 | +services |
| 14 | 32.7386 | 0.0550 | +southern Germany |
| 15 | 30.5046 | 0.0556 | +share of exports to total sales |
| 16 | 32.4441 | 0.0556 | +works council |
| 17 | 25.1254 | 0.0570 | +share of workers with a mini-job |
| 18 | 18.9804 *| 0.0581 | +executive board only managers |
| 19 | 19.5292 | 0.0583 | +owner from western Germany |
| 20 | 20.2593 | 0.0585 | +manufacturing |
| 21 | 21.0000 | 0.0587 | +capital participation of employees |
+--------------------------------------------------------------------------+
* indicates the smallest value for Cp. Variables in line 19-21 are excluded.

32
Table A4: Probit ML estimates of skill shortage – German state coefficients are only displayed
__________________________________________________________
(1) (2) (3) (4) (5) (6)
2007 2008 2009 2010 2011 2012
b/se b/se b/se b/se b/se b/se
__________________________________________________________________________
Schleswig-Holstein 0.272 0.285* 0.080 0.184 -0.330* -0.109
(0.184) (0.167) (0.209) (0.170) (0.178) (0.157)
Hamburg 0.000 -0.148 -0.341 0.141 -0.208 -0.259
(0.286) (0.273) (0.349) (0.241) (0.246) (0.230)
Lower Saxony 0.077 0.337*** 0.145 -0.003 -0.053 0.043
(0.147) (0.128) (0.153) (0.128) (0.117) (0.114)
Bremen 0.079 0.301** 0.230 -0.052 0.021 -0.125
(0.147) (0.129) (0.144) (0.128) (0.115)(0.117)
North Rhine-Westphalia 0.248** 0.240** 0.306**-0.052 -0.059 -0.107
(0.123) (0.116) (0.130) (0.113) (0.102 (0.101)
Hesse 0.213 0.223* 0.464*** -0.210 -0.131 -0.114
(0.141) (0.132) (0.144) (0.140) (0.127)(0.120)
Rhineland-Palatinate 0.136 0.204 0.103 -0.050 -0.115 -0.031
(0.162) (0.143) (0.166) (0.135) (0.130) (0.123)
Baden-Württemberg 0.319** 0.293** 0.005 -0.236* -0.190* 0.040
(0.127) (0.118) (0.142) (0.122) (0.108) (0.102)
Bavaria 0.422*** 0.381*** 0.229 0.109 0.158 0.100
(0.131) (0.123) (0.141) (0.121) (0.108) (0.108)
Saarland 0.191 0.251 0.071 0.068 -0.258 -0.261
(0.203) (0.182) (0.223) (0.188) (0.185) (0.182)
Berlin 0.217 0.319** 0.180 0.073 -0.188 -0.060
(0.147) (0.135) (0.150) (0.137) (0.132) (0.125)

33
Brandenburg 0.272** 0.046 0.226* 0.142 -0.111 0.022
(0.126) (0.125) (0.132) (0.112) (0.105) (0.103)
Mecklenburg-West-Pomerania 0.179 0.141 0.332** 0.042 -0.178 -0.080
(0.137) (0.127) (0.131) (0.121) (0.116) (0.109)
Saxony 0.177 0.110 0.270** 0.096 0.059 -0.011
(0.122) (0.116) (0.129) (0.111) (0.097) (0.099)
Saxony-Anhalt 0.185 0.010 0.078 -0.001 -0.015 -0.050
(0.126) (0.124) (0.134) (0.116) (0.102) (0.105)
__________________________________________________________________________________
Pseudo-R² 0.15 0.16 0.14 0.12 0.13 0.11
Observations 5989 5990 6054 6047 5916 6046
__________________________________________________________________________________
Notes: The table reports coefficients and robust standard errors in parentheses. Control variables are the same firm characteristics as in Table 2 and 43 industry dummies; base category of German states: Thuringia; * p<0.1, ** p<0.05; *** p.0.01.

34
Table A5: Random effects probit estimates of skill shortages (D_SQW) with interaction variables between year dummies and firm characteristics
D_UQJ | Coef. Std. Err. z P>|z|
----------------------------------------------------------+------------------------------------------------------------------------------------------
SOUTHERN GERMANY | 0.0213 0.0806 0.26 0..791
SERVICE SECTOR | 0.4890 0.0908 5.38 0.000
TRADE SECTOR | -0.2860 0.1210 -2.36 0.018
EXPORTS | -0.1474 0.0760 -1.94 0.053
WORKING TIME ACCOUNT | 0.4115 0.0811 5.07 0.007
COMPETIVE PRESSURE | 0.0412 0.0724 0.57 0.570
SHARE of SKILLED WORKERS | 0.4626 0.1653 2.80 0.005
SHARE of FEMALE WORKERS | -0.0131 0.1397 -0.09 0.925
WORKS COUNCIL | -0.0738 0.0860 -0.86 0.391
FOUNDATION BEFORE 1990 | -0.2675 0.0734 -3.64 0.000
FURTHER TRAINING | 0.3727 0.0989 3.77 0.000
HIGH WAGES | 0.2461 0.0888 2.77 0.006
PROFIT SHARING | 0.3435 0.0856 4.01 0.000
SHARE of MINI JOBS | -0.5961 0.2929 -2.03 0.042
NON-OWNER MANAGEMENT | 0.1215 0.0869 1.40 0.162
POSITIVE SALES EXPECTATIONS | 0.2058 0.0829 2.48 0.013
LABOR HOARDING | -0.2847 0.0737 -3.86 0.000
SOUTHERN GERMANY*D2007 | 0.1336 0.0971 1.38 0.169
SOUTHERN GERMANY*D2008 | 0.0746 0.0945 0.79 0.430
SOUTHERN GERMANY*D2010 | -0.1468 0.0974 -1.51 0.132
SOUTHERN GERMANY*D2011 | -0.0190 0.0932 -0.20 0.838
SOUTHERN GERMANY*D2012 | 0.1199 0.0917 1.31 0.191
SERVICE SECTOR*D2007 | -0.3930 0.1099 -3.57 0.000
SERVICE SECTOR*D2008 | -0.2170 0.1067 -2.03 0.042
SERVICE SECTOR*D2010 | -0.2499 0.1089 -2.29 0.022

35
SERVICE SECTOR*D2011 | -0.5797 0.1050 -5.52 0.000
SERVICE SECTOR*D2012 | -0.3508 0.1040 -3.37 0.001
TRADE SECTOR*D2007 | 0.0220 0.1420 0.16 0.877
TRADE SECTOR*D2008 | -0.1702 0.1421 -1.20 0.231
TRADE SECTOR*D2010 | 0.0353 0.1425 0.25 0.804
TRADE SECTOR*D2011 | -0.1177 0.1362 -0.86 0.388
TRADE SECTOR*D2012 | -0.0670 0.1363 -0.49 0.623
EXPORTS*D2007 | 0.4471 0.0915 4.88 0.000
EXPORTS*D2008 | 0.3190 0.0890 3.58 0.000
EXPORTS*D2010 | 0.1727 0.0906 1.91 0.057
EXPORTS*D2011 | 0.1215 0.0875 1.39 0.165
EXPORTS*D2012 | 0.0862 0.0870 0.99 0.322
WORKING TIME ACCOUNT*D2007 | -0.0628 0.1001 -0.63 0.530
WORKING TIME ACCOUNT*D2008 | 0.0403 0.0970 0.42 0.678
WORKING TIME ACCOUNT*D2010 | 0.1615 0.0993 1.63 0.104
WORKING TIME ACCOUNT*D2011 | 0.1810 0.0954 1.90 0.058
WORKING TIME ACCOUNT*D2012 | 0.0975 0.0940 1.04 0.300
COMPETITIVE PRESSURE*D2007 | 0.2609 0.0867 3.01 0.003
COMPETITIVE PRESSURE*D2008 | 0.2338 0.0845 2.76 0.006
COMPETITIVE PRESSURE*D2010 | 0.1069 0.0861 1.24 0.215
COMPETITIVE PRESSURE*D2011 | 0.1808 0.0829 2.18 0.029
COMPETITIVE PRESSURE*D2012 | 0.1604 0.0825 1.94 0.052
SHARE of SKILLED WORKERS*D2007 | -0.3054 0.1991 -1.53 0.125
SHARE of SKILLED WORKERS*D2008 | -0.1471 0.1947 -0.76 0.450
SHARE of SKILLED WORKERS*D2010 | -0.2371 0.1987 -1.19 0.233
SHARE of SKILLED WORKERS*D2011 | 0.0553 0.1928 0.29 0.774
SHARE of SKILLED WORKERS*D2012 | -0.0361 0.1900 -0.19 0.849
SHARE of FEMALE WORKERS*D2007 | -0.6923 0.1740 -3.98 0.000
SHARE of FEMALE WORKERS*D2008 | -0.7063 0.1680 -4.20 0.000
SHARE of FEMALE WORKERS*D2010 | -0.0020 0.1689 -0.01 0.991

36
SHARE of FEMALE WORKERS*D2011 | -0.3098 0.1633 -1.90 0.058
SHARE of FEMALE WORKERS*D2012 | -0.3868 0.1619 -2.39 0.017
WORKS COUNCIL*D2007 | 0.0881 0.1043 0.84 0.398
WORKS COUNCIL*D2008 | 0.0274 0.1013 0.27 0.786
WORKS COUNCIL*D2010 | -0.1627 0.1031 -1.58 0.114
WORKS COUNCIL*D2011 | 0.0293 0.0992 0.30 0.768
WORKS COUNCIL*D2012 | -0.0704 0.0989 -0.71 0.476
FOUNDATION BEFORE 1990*D2007 | -0.0252 0.0893 -0.28 0.777
FOUNDATION BEFORE 1990*D2008 | 0.0306 0.0867 0.35 0.724
FOUNDATION BEFORE 1990*D2010 | 0.0548 0.0880 0.62 0.533
FOUNDATION BEFORE 1990*D2011 | 0.0137 0.0848 0.16 0.871
FOUNDATION BEFORE 1990*D2012 | 0.1301 0.0842 1.54 0.122
FURTHER TRAINING*D2007 | -0.1770 0.1196 -1.48 0.139
FURTHER TRAINING*D2008 | -0.0170 0.1171 -0.15 0.884
FURTHER TRAINING*D2010 | 0.0290 0.1200 0.24 0.809
FURTHER TRAINING*D2011 | 0.1231 0.1152 1.07 0.285
FURTHER TRAINING*D2012 | 0.0336 0.1134 0.30 0.767
HIGH WAGES*D2007 | 0.1304 0.1046 1.25 0.213
HIGH WAGES*D2008 | 0.0300 0.1030 0.29 0.771
HIGH WAGES*D2010 | 0.2275 0.1040 2.19 0.029
HIGH WAGES*D2011 | 0.1156 0.1008 1.15 0.251
HIGH WAGES*D2012 | 0.0539 0.1007 0.54 0.592
PROFIT SHARING*D2007 | 0.0820 0.1010 0.81 0.417
PROFIT SHARING*D2008 | 0.0487 0.0990 0.49 0.623
PROFIT SHARING*D2010 | 0.0592 0.1004 0.59 0.555
PROFIT SHARING*D2011 | -0.0133 0.0975 -0.14 0.892
PROFIT SHARING*D2012 | -0.0414 0.0976 -0.42 0.671
SHARE of MINI JOBS*D2007 | -0.1179 0.3730 -0.32 0.752
SHARE of MINI JOBS*D2008 | 0.2047 0.3528 0.58 0.562
SHARE of MINI JOBS*D2010 | -0.3921 0.3674 -1.07 0.286

37
SHARE of MINI JOBS*D2011 | 0.3699 0.3439 1.08 0.282
SHARE of MINI JOBS*D2012 | 0.4884 0.3354 1.46 0.145
NON-OWNER MANAGEMENT*D2007 | 0.0339 0.1038 0.33 0.743
NON-OWNER MANAGEMENT*D2008 | 0.0547 0.1013 0.54 0.589
NON-OWNER MANAGEMENT*D2010 | 0.0565 0.1028 0.55 0.583
NON-OWNER MANAGEMENT*D2011 | -0.0028 0.0994 -0.03 0.977
NON-OWNER MANAGEMENT*D2012 | -0.0891 0.0998 -0.89 0.372
POSITIVE EXPECTATIONS*D2007 | 0.0006 0.0997 0.01 0.995
POSITIVE EXPECTATIONS*D2008 | -0.0136 0.0970 -0.14 0.888
POSITIVE EXPECTATIONS*D2010 | -0.0252 0.0987 -0.26 0.798
POSITIVE EXPECTATIONS*D2011 | 0.1195 0.0942 1.27 0.205
POSITIVE EXPECTATIONS*D2012 | 0.2644 0.0932 2.84 0.005
LABOR HOARDING*D2007 | 0.1794 0.0887 2.02 0.043
LABOR HOARDING*D2008 | 0.1677 0.0863 1.94 0.052
LABOR HOARDING*D2010 | 0.0133 0.0880 0.15 0.879
LABOR HOARDING*D20 11 | -0.0085 0.0846 -0.10 0.920
LABOR HOARDING*D2012 | -0.0430 0.0842 -0.51 0.609
D2007 | 0.6070 0.2082 2.92 0.004
D2008 | 0.5127 0.2038 2.52 0.012
D2010 | 0.3363 0.2078 1.62 0.106
D2011 | 0.4840 0.2016 2.40 0.016
D2012 | 0.6071 0.1978 3.07 0.002
_cons | -3.0489 0.1740 -17.52 0.000
-----------------------------------------------------------+------------------------------------------------------------------
sigma_u | 1.0132 0.0237
rho | 0.5066 0.0117
N | 40,614
-----------------------------------------------------------------------------------------------------------------------------
Likelihood-ratio test of rho=0: chibar2(01) = 2730.36 Prob >= chibar2 = 0.000

38
Table A6: Description of measures to reduce or eliminate skills shortages, ______________________________________________________________________________
Variable | description mean std.dev.
______________________________________________________________________________
ApE | number of apprentices per employee 0.042 0.084
Appren | =1 - indentures were concluded in the last year 0.340 0.474
AttrWC | =1 – attractive working conditions in the firm 0.161 0.367
Fam+Work | =1 – reconciliation of family and work, among 8 measures
| the firm has installed 4 or more measures 0.070 0.255
Foreign | =1 – foreign sales are larger than 10 percent
| and the owner is a foreigner 0.028 0.165
Foreign1_D | =1 – foreign sales are larger than 20 percent
| or the owner is a foreigner 0.305 0.461
Foreign10_D | =1 – foreign sales are larger than 10 percent 0.321 0.467
Foreign20_D | =1 – foreign sales are larger than 20 percent 0.283 0.450
HighTech | percentage of IT investments to the total
| investment 22.005 31.928
HOARD |=1 – if additional demand for products can be
| satisfied without additional labor and capital 0.485 0.500
HWage | =1 – wages per employee in the firm is larger than the average
| wage per employee in the sample 0.397 0.489
Leasing | =1 – leasing workers are in the firm 0.155 0.362
OldW | =1 – among 8 measures for older workers 4 or
| more are installed in the firm 0.131 0.338
PROD | sales per year in €/(1000*number of workers) 155.239 301.753
RPlan | =1 – the firm has a requirements plan for the
| personnel 0.341 0.474
Train | =1 – the firm trains and incurs the costs 0.733 0.442
______________________________________________________________________________

39
Table A7: Definition and descriptive statistics of strategies to reduce or eliminate skills shortages
______________________________________________________________________
Variable | definition mean std.dev.
---------+-------------------------------------------------------------
S1 | intensified apprenticeship 0.502 0.500
S2 | intensified further training of employees 0.571 0.495
S3 | long-run specific personnel development 0.371 0.483
S4 | retention of older workers 0.269 0.444
S5 | increased leasing of workers 0.042 0.202
S6 | hiring of skilled foreign workers 0.018 0.131
S7 | willingness ta pay higher wages 0.109 0.311
S8 | compatibility of family and work 0.278 0.482
S9 | supply of attractive working conditions 0.416 0.493
Notes: The strategy variables S1-S9 – see question 37, IAB Establishment panel 2011 - are used as instruments of Appren, Train, RPlan, OldW, Leasing, Foreign, HWage, Fam+Work and AttrWC, respectively, and measured as dummies (=1 if the strategy has a large importance for the firm to secure the requirement of skilled workers; =0 otherwise).

40
Table A8: Negative Binomial Regression of the number of years with skill shortage
Variable| 2007 2008 2009 2010 2011 2012
--------+---------------------------------------------------------------------
SOUTH | 0.0754 0.0871 0.0674 0.0420 0.0218 0.0336
SERVICE | 0.4121*** 0.3863*** 0.3369*** 0.3898*** 0.3573*** 0.1992***
TRADE | -0.3925*** -0.3424*** -0.3600*** -0.3892*** -0.3288*** -0.3808***
EXPORT | 0.2158*** 0.2400*** 0.2669*** 0.2388*** 0.2488*** 0.0677
WTA | 0.5628*** 0.5321*** 0.5523*** 0.5205*** 0.5374*** 0.5182***
COMP | 0.1429** 0.1558*** 0.1733*** 0.1744*** 0.1894*** 0.2125***
SKILL | 0.4241*** 0.3760*** 0.3778*** 0.4640*** 0.3298** 0.2893**
FEMALE | -0.4497*** -0.3704*** -0.3972*** -0.3773*** -0.3137** -0.2977***
WOCO | -0.0913 -0.1264* -0.1280* -0.1215* -0.1217* -0.1479**
FOUND | -0.2398*** -0.1939*** -0.1841*** -0.2029*** -0.2026*** -0.2285***
TRAIN | 0.6048*** 0.6286*** 0.6308*** 0.6264*** 0.6188*** 0.5513***
HWAGE | 0.3489*** 0.3409*** 0.3267*** 0.3144*** 0.2861*** 0.3575***
PS | 0.2855*** 0.2821*** 0.3211*** 0.2749*** 0.2688*** 0.3445***
MINI-J | -1.0613*** -1.1188*** -0.8513*** -0.8126*** -0.9310*** -0.6971***
MANAG | -0.0317 -0.0254 0.0092 -0.0047 0.0000 0.1214*
PEXP | 0.2284*** 0.2805*** 0.1980** 0.3441*** 0.3007*** 0.2667***
PROD | -0.0002*** -0.0003*** -0.0003*** -0.0002*** -0.0003***
IT | 0.0004 -0.0001 -0.0000 0.0002 0.0003 0.0005
HOARD | -0.3266*** -0.3303*** -0.2801*** -0.3172*** -0.2993***
_cons | -1.5920*** -1.4323*** -1.3926*** -1.5224*** -1.4283*** -1.3538***
--------+---------------------------------------------------------------------
lnalpha| 0.1330* 0.0870 0.1349** 0.1044 0.0904 0.2552***
--------+---------------------------------------------------------------------
N | 3448 3397 3431 3422 3357 3572

41
Table A9: Testing for weak instruments (WI) and test for overidentifying restrictions (OIR)
Measure | 2007 2008 2009 2010 2011 2012
| WI OIR WI OIR WI OIR WI OIR WI OIR WI OIR
--------+---------------------------------------------------------------
Appren | *** *** *** *** *** ***
Train | *** *** *** *** *** ***
RPlan | *** *** ** *** *** *** ***
OldW | *** *** *** *** *** ***
Leasing | *** *** *** *** *** ***
Foreign | *** *** *** *** *** ***
HWage | *** *** *** ** *** *** * *** *
Fam+Work| *** *** *** *** *** ***
AttrWC | *** *** *** *** *** ***
--------+---------------------------------------------------------------
N | 554 671 405 583 818 810
Notes: Further covariates determined by LARS are manufacturing, services sector, trade sector, exports, working time accounts, competitive pressure, share of qualified workers, share of female workers, works council, foundation of the firm before 1990, labor hoarding; * p<0.1; ** p<0.05; *** p<0.01. If the coefficient of the instrument in the second (skill shortage) equation is significant (p<0.05), then the hypothesis of weak instruments (WI) has to be rejected. If the F test of the OIR test is significant (p<0.05), the instrument is bad or the specification is not correct.

42
Table A10: Median estimators of the ratio of unfilled skilled jobs to the entire number of employees
Variable| 2007 2008 2009 2010 2011 2012
--------+------------------------------------------------------------------
Appren | -0.0239*** -0.0260*** -0.0297*** -0.0218*** -0.0297*** -0.0204***
Train | -0.0432*** -0.0362*** -0.0443*** -0.0162** -0.0461*** -0.0425***
RPlan | -0.0093 -0.0108** -0.0135* -0.0049 -0.0090* -0.0079
OldW | -0.0027 -0.0024 -0.0018 -0.0015 -0.0020 -0.0014
Leasing | -0.0027 -0.0042 -0.0092 -0.0044 -0.0028 -0.0026
Foreign | -0.0022 0.0027 -0.0112 -0.0047 -0.0007 0.0003
HWage | 0.0012 0.0054 0.0023 -0.0037 0.0059 0.0007
Fam+Work| -0.0045 -0.0037 0.0029 0.0002 0.0035 0.0030
AttrWC | -0.0016 -0.0006 -0.0064 -0.0057 -0.0062 -0.0046
-------+--------------------------------------------------------------------
N | 555 671 405 583 818 810 -----------------------------------------------------------------------------
Notes: Further covariates determined by LARS are manufacturing, services sector, trade sector, exports, working time accounts, competitive pressure, share of qualified workers, share of female workers, works council, foundation of the firm before 1990, labor hoarding, the same as in Table 3; * p<.1; ** p<.05; *** p<.01.

43
Table A11: Instrumental variables estimation of the ratio of unfilled skilled jobs to the entire number of qualified employees
Variable | 2007 2008 2009 2010 2011 2012
----------+-------------------------------------------------------------------
Appren | -0.1764*** -0.1102*** -0.0898*** -0.0711*** -0.0781*** -0.0775***
Train | -0.0646*** -0.0975*** -0.1359*** -0.0391 -0.1037*** -0.0825***
RPlan | -0.0272 -0.0241 -0.0400 0.0290 -0.0066 -0.0086
OldW | 0.0000 -0.0424 -0.0278 0.0283 0.0117 0.0240
Leasing | 0.0076 -0.0082 -0.0348 0.0270 -0.0066 0.0216
Foreign | -0.0051 0.0517 -0.0092 -0.0112 -0.0099 0.0005
HWage | 0.0242 0.0376 0.0160 0.0109 0.0403 0.0347
Fam+Work | 0.0243 -0.0560 -0.0359 0.0501 0.0283 0.0874
AttrWC | -0.0120 0.2051 0.1171 -0.2049 -0.0300 -0.2323
---------+-------------------------------------------------------------------
N | 807 668 402 580 816 807
Notes: Further covariates determined by LARS are manufacturing, services sector, trade sector, exports, working time accounts, competitive pressure, share of qualified workers, share of female workers, works council, foundation of the firm before 1990, labor hoarding, the same as in Table 3; * p<.1; ** p<.05; *** p<.01.

44
Table A12: OLS estimation of the share of unfilled skilled jobs to the entire number of employees in the firm with Heckman’s sample selection correction
Variable| 2007 2008 2009 2010 2011 2012
--------+---------------------------------------------------------------------
Appren | -0.0330*** -0.0292*** -0.0345*** -0.0348*** -0.0357*** -0.0351***
Train | -0.0168 -0.0283** -0.0205 -0.0330** -0.0210* -0.0378***
RPlan | -0.0148* -0.0167** -0.0203** -0.0097 -0.0227*** -0.0231***
OldW | -0.0035 -0.0127 -0.0058 -0.0078 -0.0018 0.0006
Leasing | -0.0003 -0.0022 -0.0068 -0.0057 -0.0118* -0.0111*
Foreign | 0.0021 0.0118 -0.0075 -0.0152 -0.0053 -0.0108
HWage | 0.0022 0.0109 0.0102 0.0007 0.0063 0.0029
Fam+Work| 0.0093 0.0058 0.0116 -0.0000 0.0147 0.0032
AttrWC | 0.0006 -0.0072 -0.0043 -0.0092 -0.0046 -0.0061
--------+---------------------------------------------------------------------
mills |
lambda | -0.0345 -0.0496*** 0.0234 -0.0264* -0.0174 -0.0234
--------+---------------------------------------------------------------------
N | 3439 3378 3415 3403 3344 4493
Notes: Further covariates determined by LARS are manufacturing, services sector, trade sector, exports, working time accounts, competitive pressure, share of qualified workers, share of female workers, works council, foundation of the firm before 1990, labor hoarding, the same as in Table 3. The covariates in the first equation – probit estimates of skill shortage – are the same as in Table 2; * p<.1; ** p<.05; *** p<.01.

45
Table A13: OLS estimation of the share of unfilled skilled jobs to the entire number of employees in the firm with Heckman’s sample selection correction – measures are clustered by principle component analysis with VARIMAX rotation
Variable | 2007 2008 2009 2010 2011 2012
----------+-------------------------------------------------------------------
FC1 | -0.0161*** -0.0181*** -0.0201*** -0.0178*** -0.0223*** -0.0247***
FC2 | 0.0008 -0.0026 0.0000 -0.0029 0.0001 -0.0011
FC3 | 0.0006 0.0011 -0.0024 -0.0035 -0.0022 -0.0023
FC4 | -0.0020 0.0026 0.0004 -0.0019 -0.0007 -0.0000
_cons | 0.2492*** 0.2856*** 0.1466*** 0.1826*** 0.2099*** 0.1573***
----------+-------------------------------------------------------------------
mills |
lambda | -0.0456* -0.0501*** 0.0092 -0.0235* -0.0259* -0.0213
----------+-------------------------------------------------------------------
N | 3439 3378 3415 3403 3344 4493
Notes: Further covariates determined by LARS are manufacturing, services sector, trade sector, exports, working time accounts, competitive pressure, share of qualified workers, share of female workers, works council, foundation of the firm before 1990, labor hoarding, the same as in Table 3. Covariates of the first equation – probit estimates of skill shortage – are the same as in Table 2. The first factor of the principle component analysis has high loadings of the measures apprentice and further training. The second factor loads highly on measures for older workers and reconciliation of family and work. The third factor has high loadings if workers are leased or hired from abroad. Finally, the fourth factor has a high loading if the firm pays high wages, * p<.1; ** p<.05; *** p<.01.

46
Table A14: Mahalanobis matching estimates of the ratio of unfilled skilled jobs to the entire number of employees
Variable | 2007 2008 2009 2010 2011 2012
---------+--------------------------------------------------------------------
Appren | -0.0331*** -0.0385*** -0.0273** -0.0319*** -0.0320*** -0.0450***
Train | -0.0106 0.0194 -0.0183 -0.0196 -0.0216 -0.0499***
RPlan | -0.0143* -0.0196* -0.0233** -0.0014 -0.0258*** -0.0202*
OldW | -0.0028 0.0011 -0.0002 0.0017 -0.0018 0.0074
Leasing | 0.0006 -0.0048 0.0024 -0.0145 -0.0079 -0.0080
Foreign | 0.0000 -0.0080 0.0059 -0.0169 -0.0010 -0.0200
HWage | 0.0097 0.0051 0.0021 0.0152* -0.0121 0.0153
Fam+Work | 0.0101 -0.0127 0.0058 0.0081 0.0244 0.0066
AttrWC | 0.0007 0.0006 -0.0039 -0.0012 -0.0088 -0.0051
---------+--------------------------------------------------------------------
N | 393 156 110 214 245 235
Notes: Further covariates determined by LARS are manufacturing, services sector, trade sector, exports, working time accounts, competitive pressure, share of qualified workers, share of female workers, works council, foundation of the firm before 1990, labor hoarding, the same as in Table 3; * p<.1; ** p<.05; *** p<.01.
Related Documents