Sizes of Currently Available Produce May Significantly Affect Nutrient Intake Assessment. Joannie Dobbs, Ph.D., CNS C. Alan Titchenal, PhD, CNS Wing Shan Tam, and Lauren Hong Human Nutrition, Food & Animal Sciences

Sizes of Currently Available Produce May Significantly Affect Nutrient Intake Assessment. Joannie Dobbs, Ph.D., CNS C. Alan Titchenal, PhD, CNS Wing Shan.
Dec 18, 2015
Welcome message from author
This document is posted to help you gain knowledge. Please leave a comment to let me know what you think about it! Share it to your friends and learn new things together.
Transcript

Sizes of Currently Available Produce May Significantly Affect
Nutrient Intake Assessment.
Joannie Dobbs, Ph.D., CNS
C. Alan Titchenal, PhD, CNS
Wing Shan Tam, and
Lauren HongHuman Nutrition, Food & Animal Sciences

Introduction:
Nutrient databases are essential tools in:
Clinical researchDietary guidanceFood labelingEpidemiology
Nutritional Status Risk Factors.
CNA Uses
• Research– Clinical– Epidemiology
• Nutrition Education• Public Health
Recommendations• Menu Planning• Diet Planning
• Popular Media• Recipes
– Cookbooks– Food Columns
• Culinary– Restaurants– Food Labeling– Purchasing

Objective:
To determine if advances in agricultural practice (i.e. changes in produce weights) may lead to significant errors in the estimation of nutrient intake and other computer nutrient analysis (CNA) applications.

Methods and Materials:
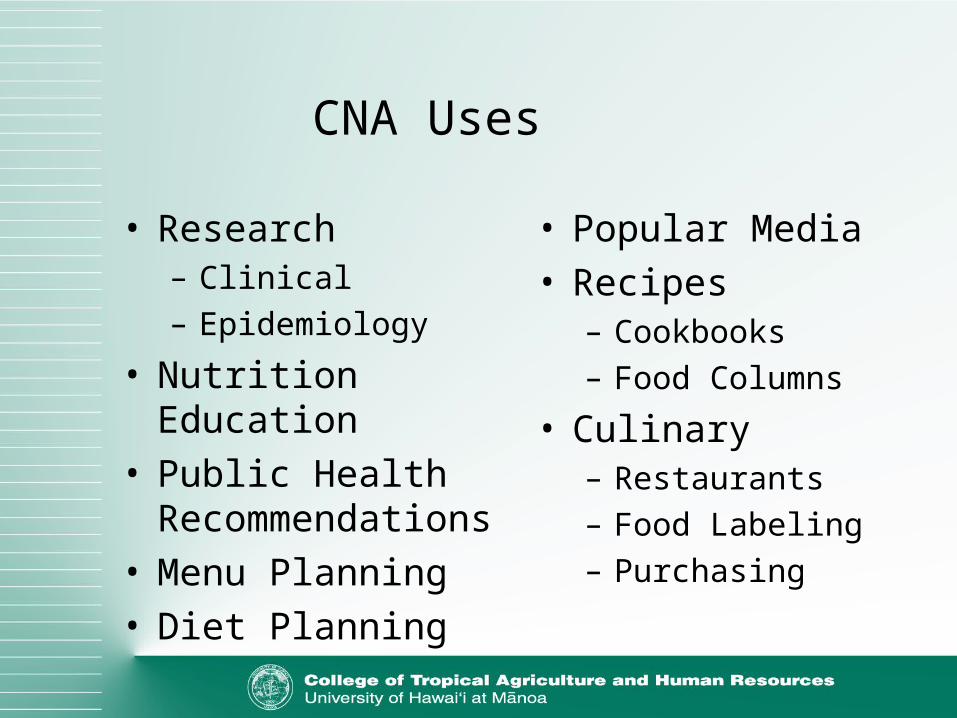
--5 major supermarkets in Honolulu-- Subset of most commonly consumed fruits and vegetables in the U.S. -- the largest -- the smallest-- 1 to 3 median-sized -- Weights were measured and compared
to USDA SR16-1 database.
Example of Sampling Technique - Tomatoes
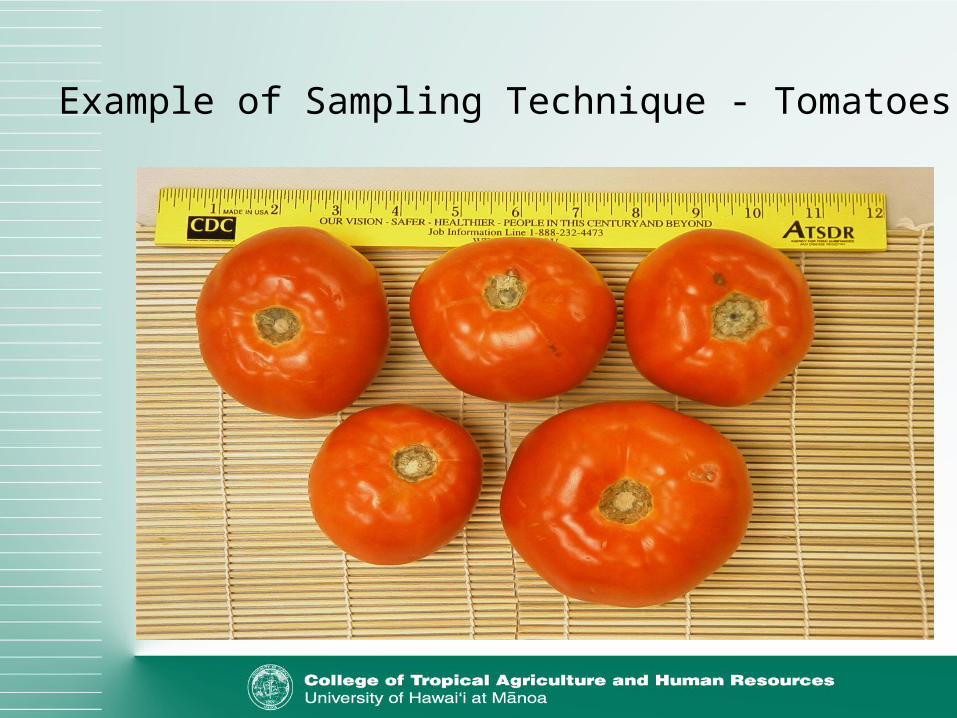
Results:
Small ---Honolulu to USDA SR16-1
Large ---Honolulu to USDA SR16-1
Median ---Honolulu to Medium USDA SR16-1
Comparisons of Energy Content Differences
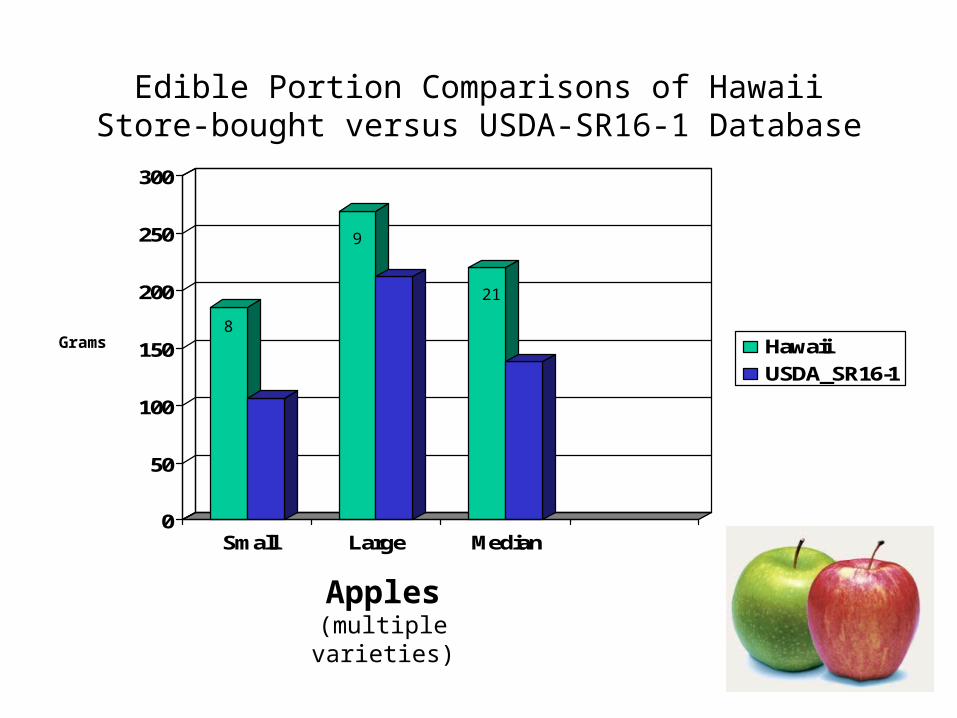
Edible Portion Comparisons of Hawaii Store-bought versus USDA-SR16-1 Database
0
50
100
150
200
250
300
Small Large Median
Hawaii
USDA_SR16-1
Grams 8
9
21
Apples(multiple varieties)
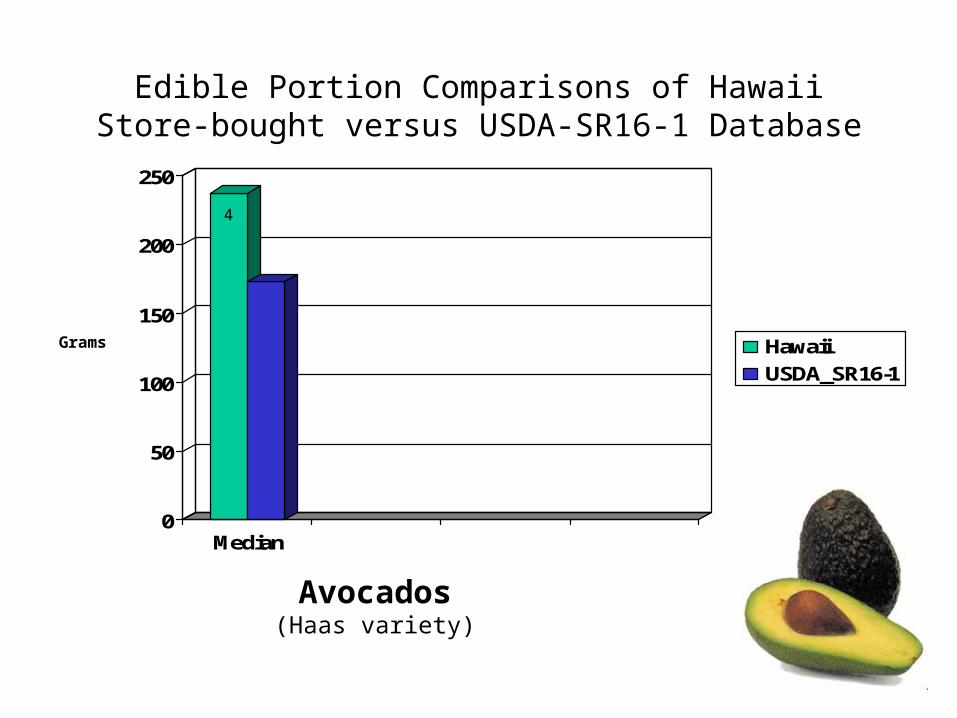
Edible Portion Comparisons of Hawaii Store-bought versus USDA-SR16-1 Database
0
50
100
150
200
250
Median
Hawaii
USDA_SR16-1
Avocados(Haas variety)
Grams
4
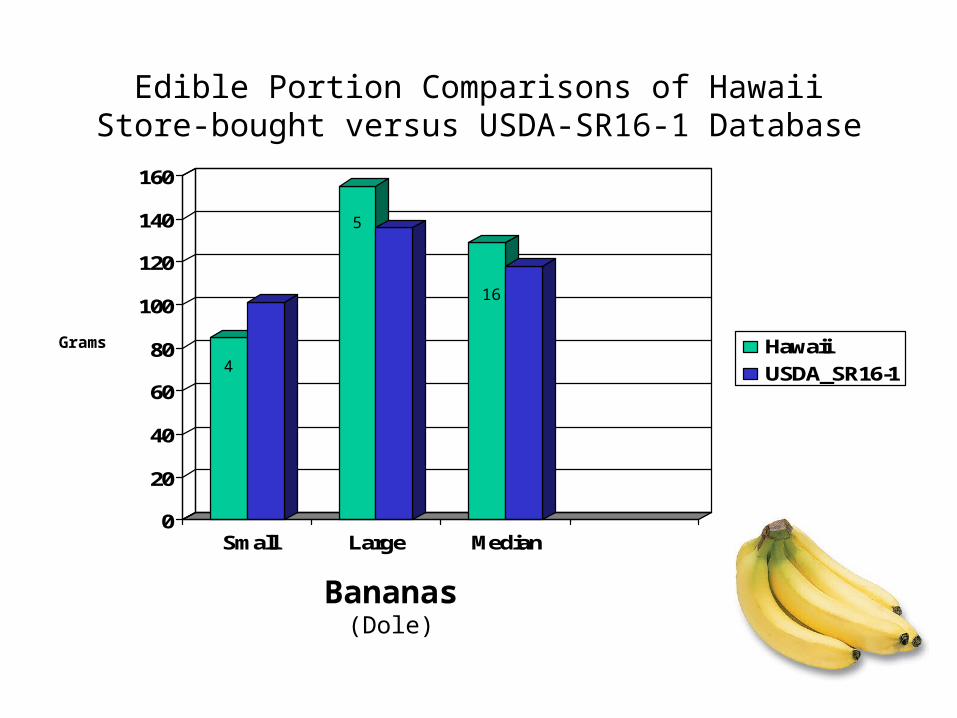
Edible Portion Comparisons of Hawaii Store-bought versus USDA-SR16-1 Database
0
20
40
60
80
100
120
140
160
Small Large Median
Hawaii
USDA_SR16-1
Bananas(Dole)
Grams
4
5
16
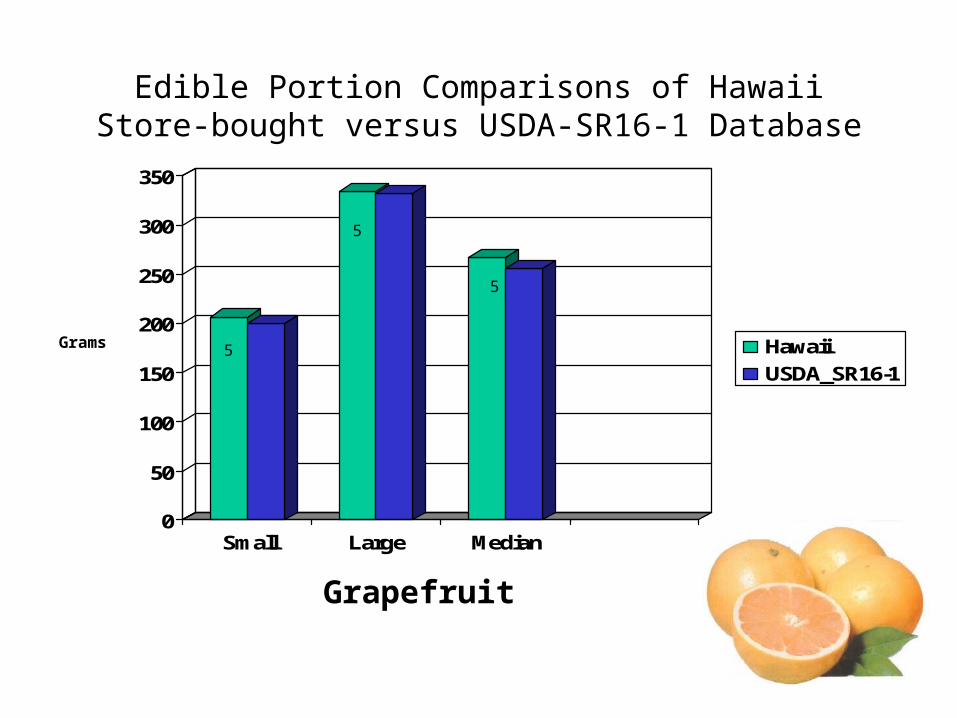
Edible Portion Comparisons of Hawaii Store-bought versus USDA-SR16-1 Database
0
50
100
150
200
250
300
350
Small Large Median
Hawaii
USDA_SR16-1
Grapefruit
Grams 5
5
5

Edible Portion Comparisons of Hawaii Store-bought versus USDA-SR16-1 Database
0
10
20
30
40
50
60
70
80
90
100
Small Large Median
Hawaii
USDA_SR16-1
Kiwi Fruits
Grams 5
5
5
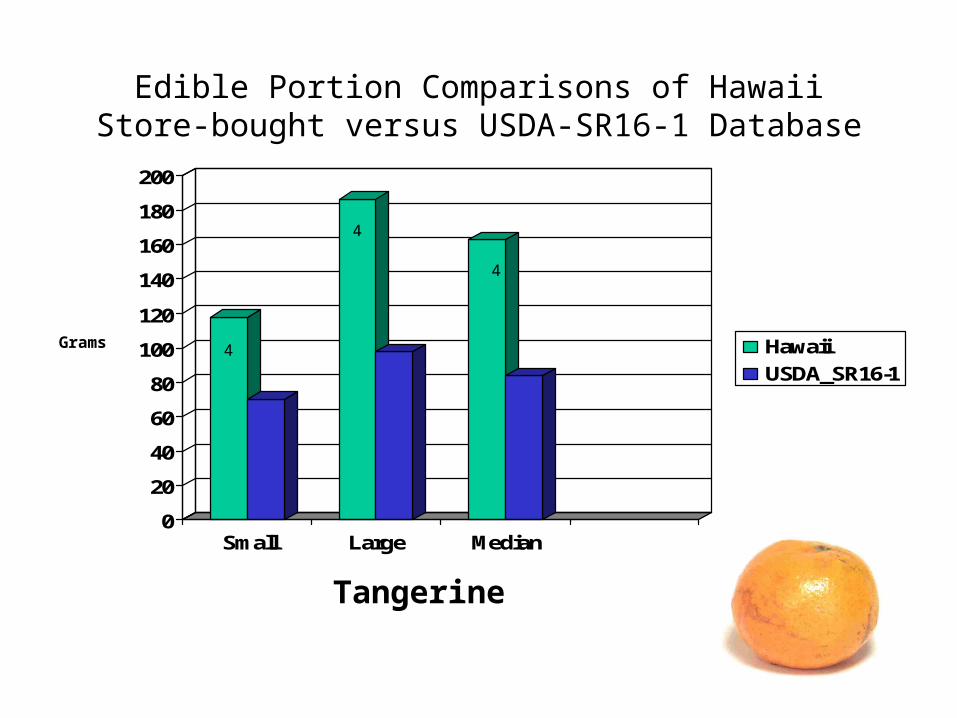
Edible Portion Comparisons of Hawaii Store-bought versus USDA-SR16-1 Database
0
20
40
60
80
100
120
140
160
180
200
Small Large Median
Hawaii
USDA_SR16-1
Tangerine
Grams 4
4
4
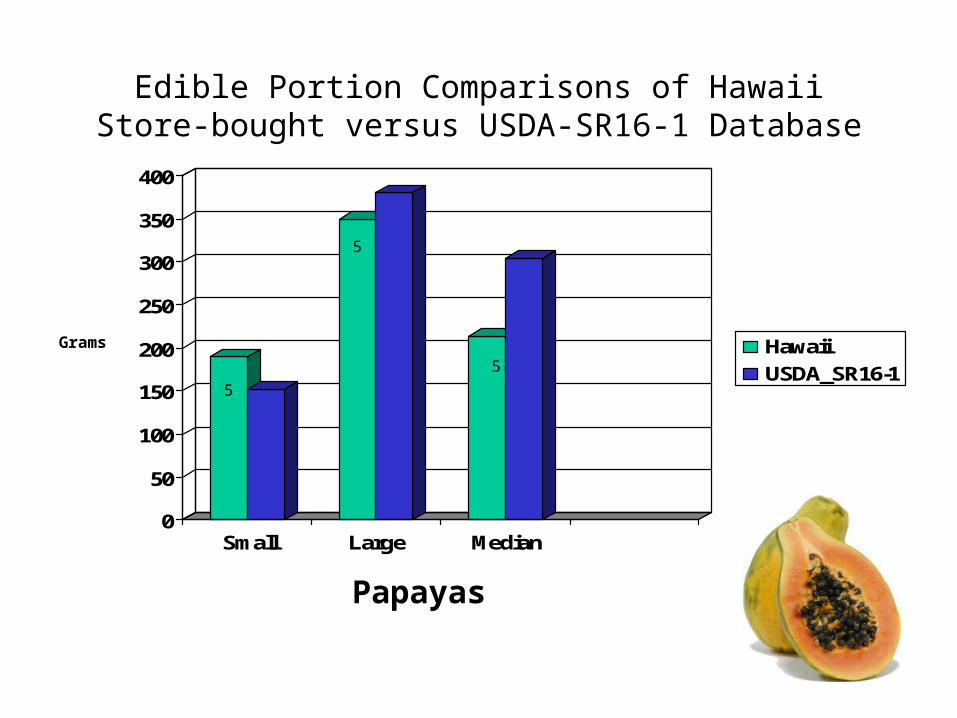
Edible Portion Comparisons of Hawaii Store-bought versus USDA-SR16-1 Database
0
50
100
150
200
250
300
350
400
Small Large Median
Hawaii
USDA_SR16-1
Papayas
Grams
5
5
5

Edible Portion Comparisons of Hawaii Store-bought versus USDA-SR16-1 Database
0
10
20
30
40
50
60
70
80
Small Large Median
Hawaii
USDA_SR16-1
Navel Oranges
Grams
5
5
5
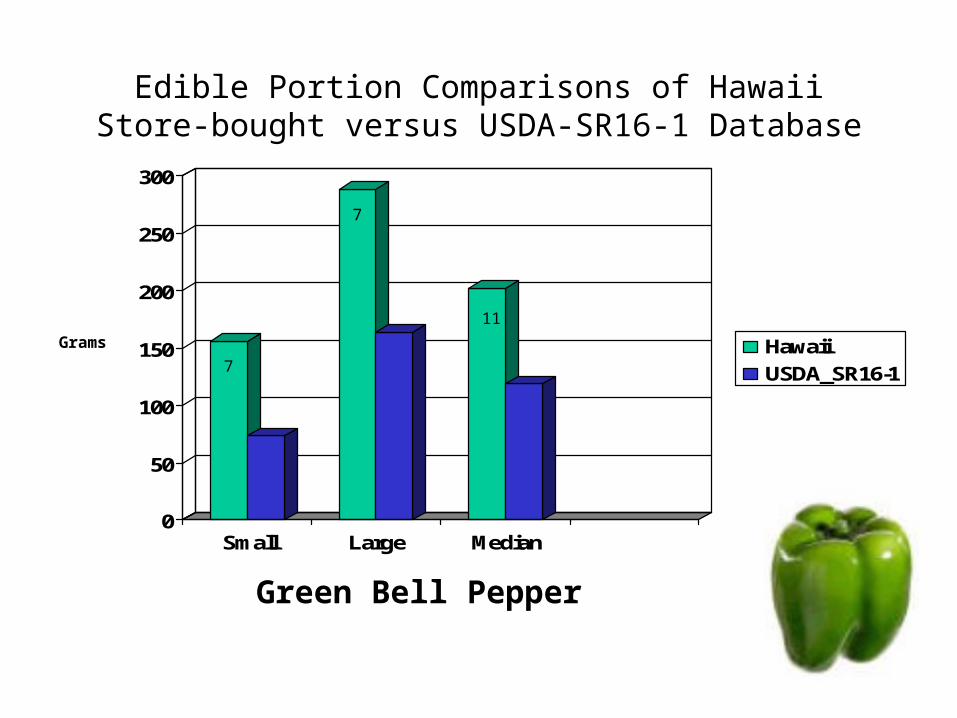
Edible Portion Comparisons of Hawaii Store-bought versus USDA-SR16-1 Database
0
50
100
150
200
250
300
Small Large Median
Hawaii
USDA_SR16-1
Green Bell Pepper
Grams
7
7
11
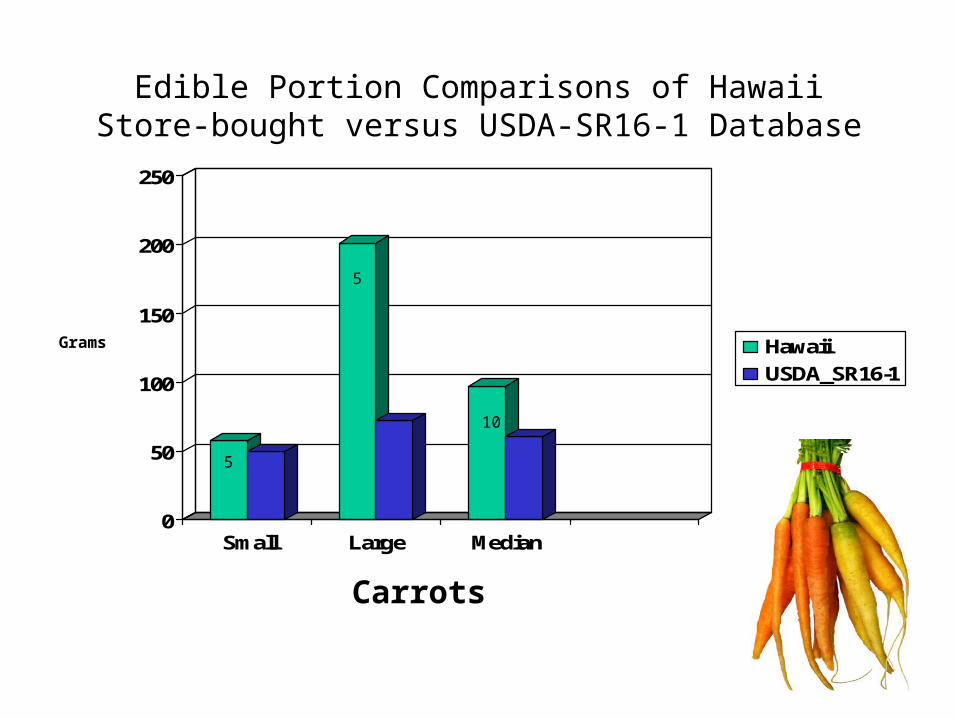
Edible Portion Comparisons of Hawaii Store-bought versus USDA-SR16-1 Database
0
50
100
150
200
250
Small Large Median
Hawaii
USDA_SR16-1
Carrots
Grams
5
5
10
Edible Portion Comparisons of Hawaii Store-bought versus USDA-SR16-1 Database
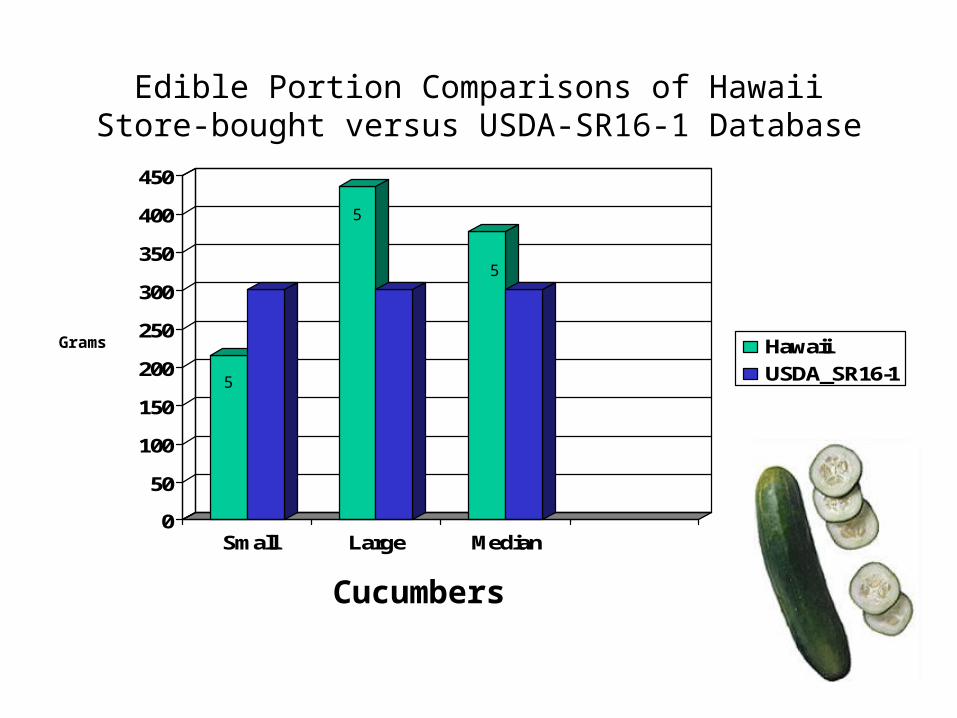
0
50
100
150
200
250
300
350
400
450
Small Large Median
Hawaii
USDA_SR16-1
Cucumbers
Grams
5
5
5
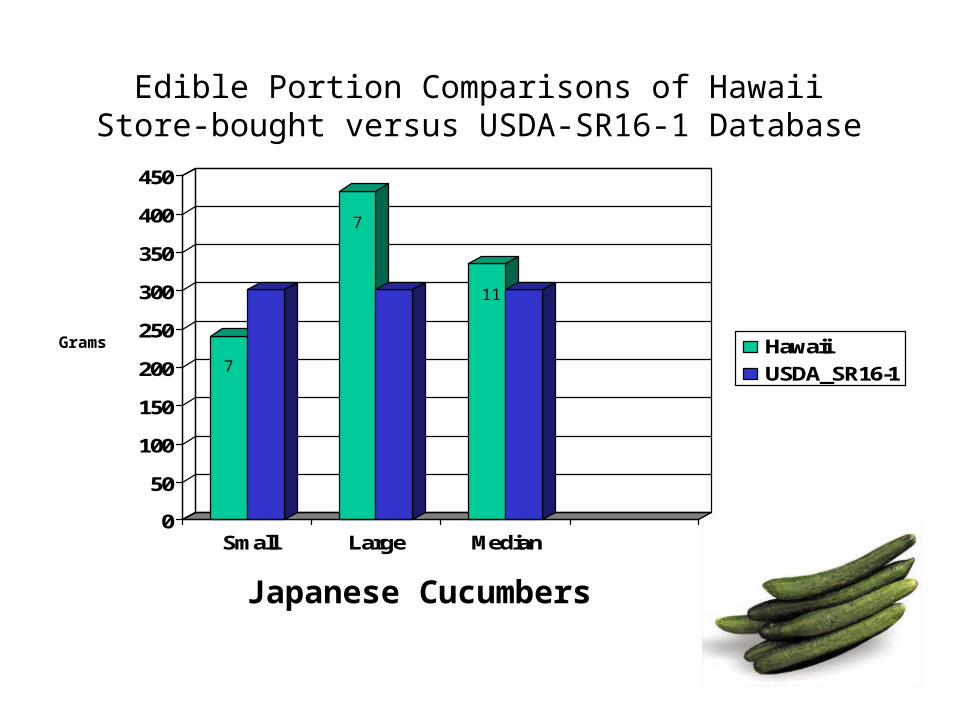
Edible Portion Comparisons of Hawaii Store-bought versus USDA-SR16-1 Database
0
50
100
150
200
250
300
350
400
450
Small Large Median
Hawaii
USDA_SR16-1
Japanese Cucumbers
Grams
7
7
11
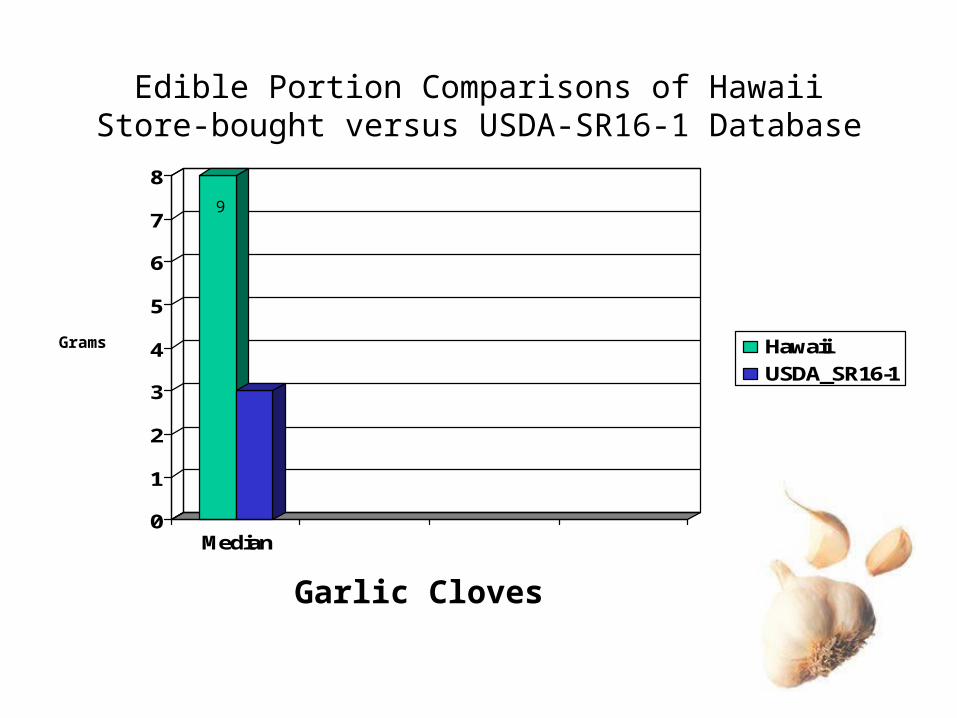
Edible Portion Comparisons of Hawaii Store-bought versus USDA-SR16-1 Database
0
1
2
3
4
5
6
7
8
Median
Hawaii
USDA_SR16-1
Garlic Cloves
Grams
9

Edible Portion Comparisons of Hawaii Store-bought versus USDA-SR16-1 Database
0
5
10
15
20
25
30
35
40
Small Large Median
Hawaii
USDA_SR16-1
Button Mushrooms
Grams
5
5
5

Edible Portion Comparisons of Hawaii Store-bought versus USDA-SR16-1 Database
0
100
200
300
400
500
600
700
800
900
Small Large Median
Hawaii
USDA_SR16-1
Red Onions
Grams
1
1
3
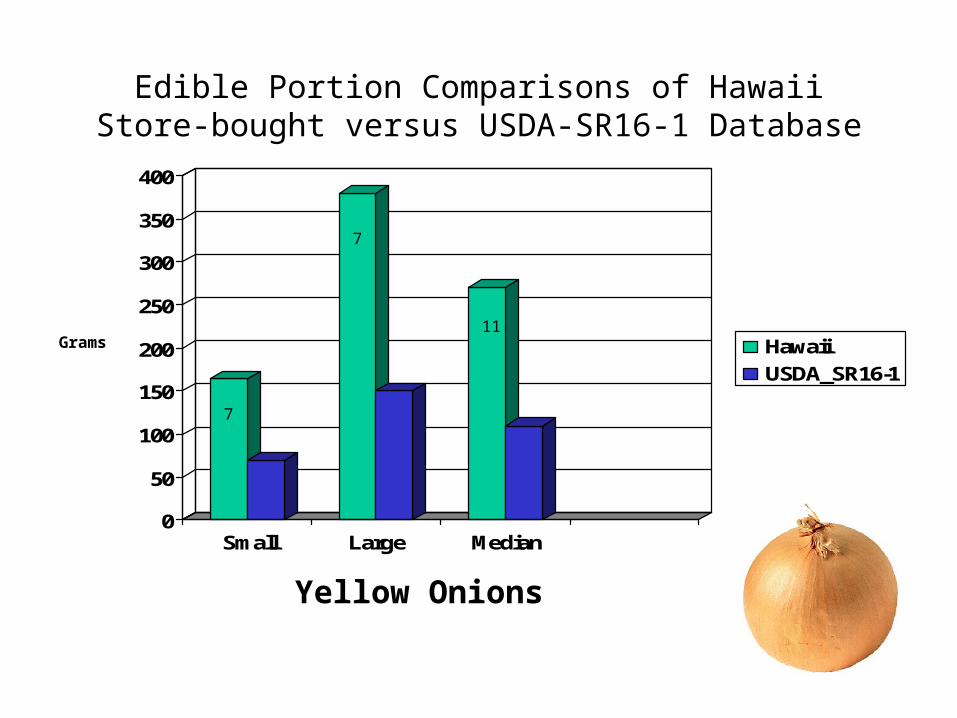
Edible Portion Comparisons of Hawaii Store-bought versus USDA-SR16-1 Database
0
50
100
150
200
250
300
350
400
Small Large Median
Hawaii
USDA_SR16-1
Yellow Onions
Grams
7
7
11
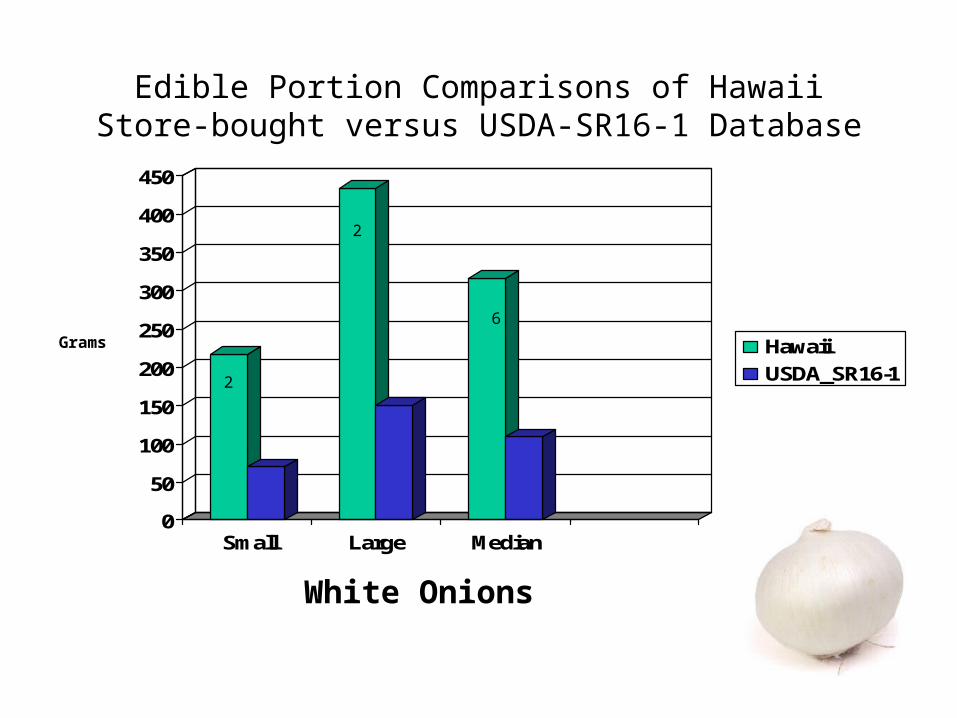
Edible Portion Comparisons of Hawaii Store-bought versus USDA-SR16-1 Database
0
50
100
150
200
250
300
350
400
450
Small Large Median
Hawaii
USDA_SR16-1
White Onions
Grams
2
2
6
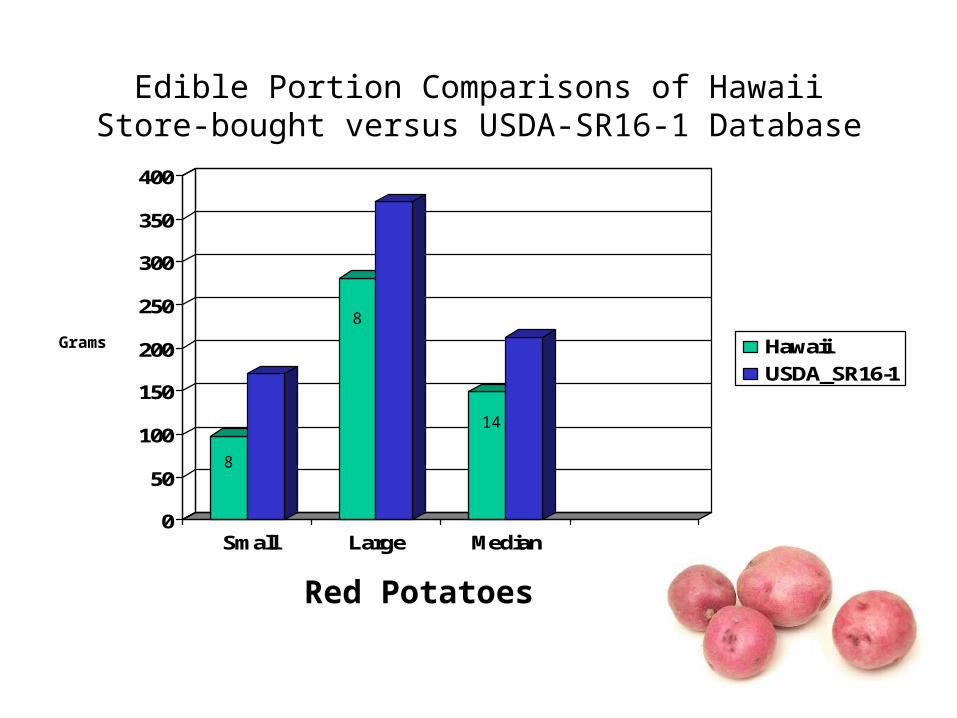
Edible Portion Comparisons of Hawaii Store-bought versus USDA-SR16-1 Database
0
50
100
150
200
250
300
350
400
Small Large Median
Hawaii
USDA_SR16-1
Red Potatoes
Grams
8
8
14

Edible Portion Comparisons of Hawaii Store-bought versus USDA-SR16-1 Database
0
50
100
150
200
250
300
350
400
Small Large Median
Hawaii
USDA_SR16-1
Russet Potatoes
Grams
3
3
5

Edible Portion Comparisons of Hawaii Store-bought versus USDA-SR16-1 Database
0
50
100
150
200
250
300
350
400
450
500
Small Large Median
Hawaii
USDA_SR16-1
Zucchini Squash
Grams
5
5
5

Edible Portion Comparisons of Hawaii Store-bought versus USDA-SR16-1 Database
0
50
100
150
200
250
300
350
Small Large Median
Hawaii
USDA_SR16-1
Tomatoes
Grams
3
3
5

Edible Portion Comparisons of Hawaii Store-bought versus USDA-SR16-1 Database
0
20
40
60
80
100
120
Small Large Median
Hawaii
USDA_SR16-1
Roma Tomatoes(Plumb Tomatoes)
Grams
4
4
5

Potentialpounds BAgainedA – BUSDAMedianUSDA
in a yearkcalkcalkcalkcal/100g4.4427211452Apples11.2107289396167Avocado-Haas1.11010511589Bananas0.33828532Grapefruits-0.2-2464461Kiwi-0.5-5696449Orange-Navel-3.7-351198439Papaya3.735377244Tangerines- Honey2Average:
Difference in Energy Content between Honolulu Median and USDA SR16-1 Medium Fruit

Difference in Energy Content between Honolulu Median and USDA SR16-1 Medium Vegetables
PotentialpoundsBAgainedA – BUSDAMedianUSDA
in a yearkcalkcalkcalkcal/100g1.716244020Bell Pepper1.514253941Carrots1.312455715Cucumber0.55455015Cucumber-Japanese0.88412149Garlic0.114522Mushroom14.51394618542Red Onion7.0674611342Round (Yellow) Onion9.1874613342White Onion-4.8-4615310772Red Potato8.17816824679Russet Potato2.019315016Squash Zucchini1.716264221Tomato - loose0.11131421Tomato - plum/Italian3Average:

USDA Medium Apple (138 g)
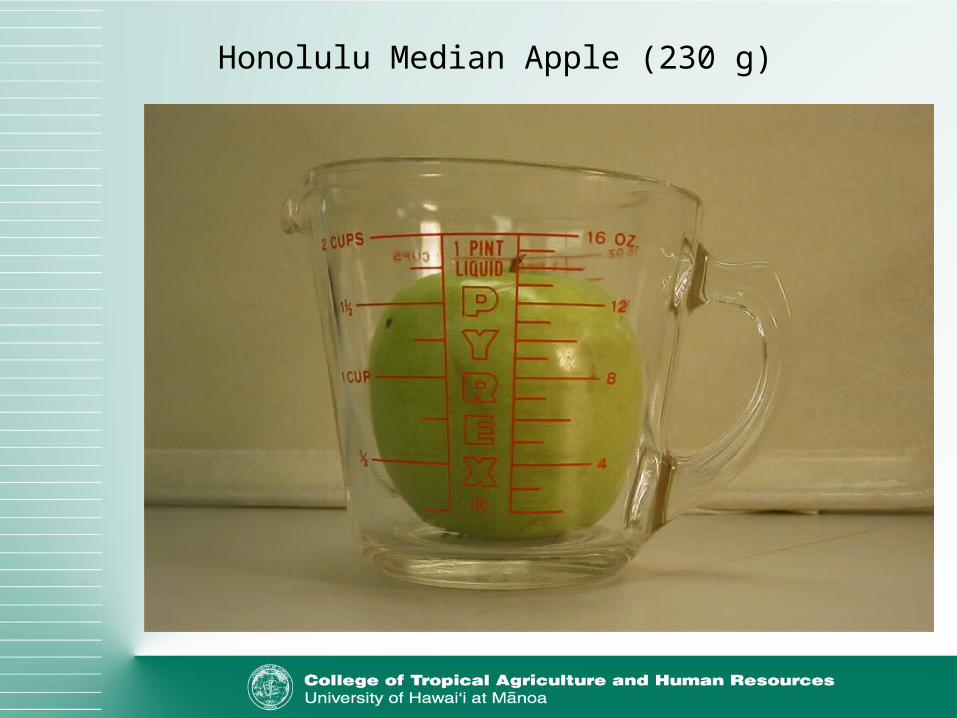
Honolulu Median Apple (230 g)

USDA Medium Apple (138 g)

Honolulu Median Apple (230 g)
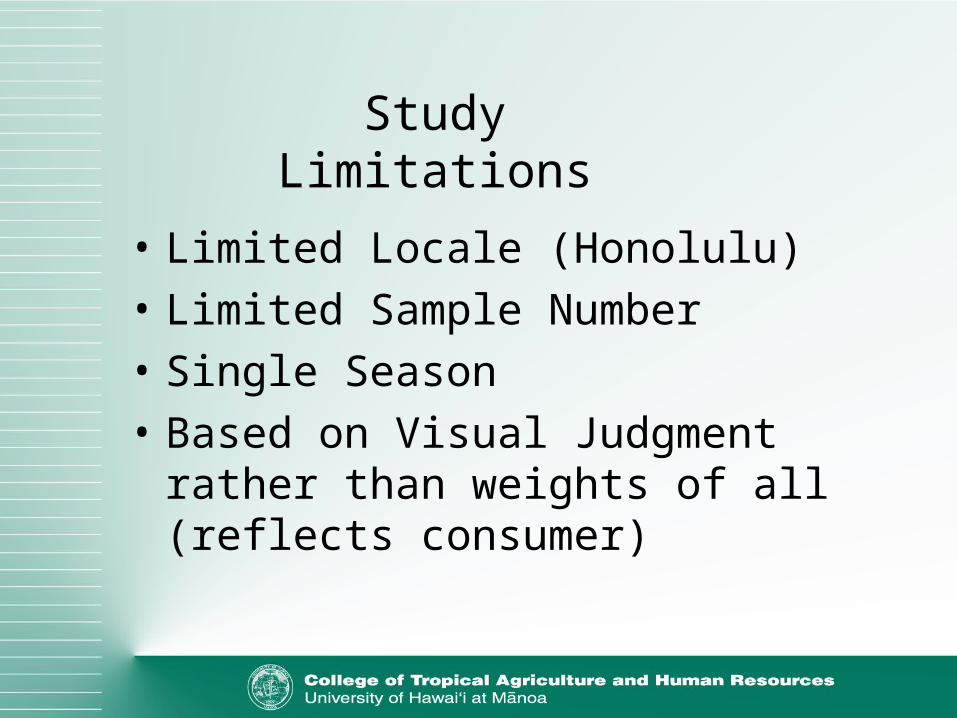
Study Limitations
• Limited Locale (Honolulu)
• Limited Sample Number
• Single Season
• Based on Visual Judgment rather than weights of all (reflects consumer)
Significance/So What:
• Assuming market produce is similar in size to database values can lead to significant – Underestimation or overestimation of energy, nutrient, and
phytochemicals consumed
• Potential error due to produce size differences may affect correctness in – Individual Nutrient Recommendations– Public Health Nutrient Recommendations– Evaluation of Epidemiological Data– Errors in Food and Restaurant Labeling

Mahalos
• For their Vision• Frederick Hill - Richard Grau - Max
Kleiber
• Partially Funded by HATCH Grant Project No HAW00238-H
Related Documents