This article appeared in a journal published by Elsevier. The attached copy is furnished to the author for internal non-commercial research and education use, including for instruction at the authors institution and sharing with colleagues. Other uses, including reproduction and distribution, or selling or licensing copies, or posting to personal, institutional or third party websites are prohibited. In most cases authors are permitted to post their version of the article (e.g. in Word or Tex form) to their personal website or institutional repository. Authors requiring further information regarding Elsevier’s archiving and manuscript policies are encouraged to visit: http://www.elsevier.com/copyright

Welcome message from author
This document is posted to help you gain knowledge. Please leave a comment to let me know what you think about it! Share it to your friends and learn new things together.
Transcript
This article appeared in a journal published by Elsevier. The attachedcopy is furnished to the author for internal non-commercial researchand education use, including for instruction at the authors institution
and sharing with colleagues.
Other uses, including reproduction and distribution, or selling orlicensing copies, or posting to personal, institutional or third party
websites are prohibited.
In most cases authors are permitted to post their version of thearticle (e.g. in Word or Tex form) to their personal website orinstitutional repository. Authors requiring further information
regarding Elsevier’s archiving and manuscript policies areencouraged to visit:
http://www.elsevier.com/copyright

Author's personal copy
Size tuning of luminescent silicon nanoparticles with meso-poroussilicon membranes
T. Serdiuk a,⇑, V. Lysenko b, S. Alekseev a,c, V.A. Skryshevsky a
a Institute of High Technologies, Taras Shevchenko National University of Kyiv, 64 Volodymyrska Str., 01601 Kyiv, Ukraineb Université de Lyon, Institut des Nanotechnologies de Lyon (INL), UMR-5270, CNRS, INSA de Lyon, 7 av. Jean Capelle, Bat. Blaise Pascal, Villeurbanne F-69621, Francec Faculty of Chemistry, Taras Shevchenko National University of Kyiv, 64 Volodymyrska Str., 01601 Kyiv, Ukraine
a r t i c l e i n f o
Article history:Received 27 April 2011Accepted 15 July 2011Available online 6 August 2011
Keywords:Si nanoparticlesMeso-porous SiAuto-filtrationSize selectionPhotoluminescenceSize tuningFree-standing Si membranes
a b s t r a c t
Size tuning of silicon (Si) nanoparticles (NPs) with the use of meso-porous silicon (meso-PS) free-stand-ing layers is reported for the first time. Accumulation of Si NPs inside the membrane pores during thefiltering process (NP transport through the meso-PS) leads to an auto-filtration effect (called Si-by-Si(SBS) filtration) allowing more efficient size selection of the NPs. General complex fractal shape and sur-face chemistry of the whole porous network, layer thickness as well as a given initial NP size dispersiondetermine final size of the NPs in the filtered solution. Moreover, quantum of step-like NP size increasingequal to 0.12 nm was found.
� 2011 Elsevier Inc. All rights reserved.
1. Introduction
Intense photoluminescence of silicon nanoparticles (Si NPs) to-gether with enhanced photostability and low toxicity make thempromising for various applications such as bioimaging and drugdelivery [1,2], as well as for optoelectronic devices [3–6]. Severaltechnological approaches are used for fabrication of Si NPs. Electro-chemical etching of crystalline silicon in HF-containing solutionsseems to be one of the most efficient ways to fabricate the Si NPs.
During the last few years, a special attention was paid by sev-eral research groups to the luminescence of Si NPs dispersed in li-quid solutions [7–13]. Typically, relatively big Si NPs withhydrogen or alkyl surface termination demonstrate the PL maxi-mum centered near 700 nm. As for the Si NPs smaller than 5 nm(Bohr exciton radius), they demonstrate significant shift of the PLmaximum to higher energies with the NP size decrease due tothe quantum confinement effect. The PL maximum of Si NPs withlarge size dispersion (1–7 nm) obtained by electrochemical etchingof Si is often observed in the spectral range from 550 to 750 nm.This fact can be explained by: (i) competitive absorption and (ii)electronic coupling between the red-emitting big NPs and theblue-emitting small ones. Indeed, absorption efficiency of the bigSi NPs is much higher than the absorption efficiently of the small
NPs, as well as the energy accumulated by the photoexcited chargecarriers in the small NPs is almost immediately transferred fromthem to the big NPs with much narrower energy band gap. In par-ticular, the energy transfer rate in highly concentrated colloidalsolutions is extremely high due to the very intimate contact be-tween the all NPs. As a result, final radiative recombinations ofthe photoexcited charge carriers take place only inside the big SiNPs emitting in the red spectral region.
That is why the size separation of small Si NPs will allow tuningof their PL wavelength, and the development of an efficient tech-nique giving monodispersed NPs is an important practical task.In particular, gel permeation chromatography [10] and centrifuga-tion of Si NPs dispersion in ethanol [5] were applied to perform sizeselection. Several authors having worked with the size-selected SiNPs observed discrete variations of their dimensions [6,14,15].However, nature of the observed step-like size variation of theformed NPs is not clearly established.
In this paper, we propose a new method allowing more precisesize selection of colloidal Si NPs. Our approach for the size selectionof Si NPs is based on the use of meso-PS free-standing membranesas NP filters. A possibility of penetration and long-time storage ofSi NPs inside the meso-PS matrix was already earlier reported byour team [16]. In this work, an efficient filtering of the NPs wasachieved due to an auto-filtration phenomenon. Moreover, the PLdata obtained in this work strongly support size quantization ofthe electrochemically derived Si NPs, and an explanation of sucha phenomenon is suggested.
0021-9797/$ - see front matter � 2011 Elsevier Inc. All rights reserved.doi:10.1016/j.jcis.2011.07.068
⇑ Corresponding author.E-mail address: [email protected] (T. Serdiuk).
Journal of Colloid and Interface Science 364 (2011) 65–70
Contents lists available at ScienceDirect
Journal of Colloid and Interface Science
www.elsevier .com/locate / jc is
Author's personal copy
2. Experimental
Strongly hydrogenated Si nanoparticles (with about 6.5% masscontent of hydrogen [17]) used in this work were formed by elec-trochemical etching of 2-in. boron-doped p-type (1–10 X cm)(1 0 0)-oriented Si wafers in 1:1 mixture (by volume) of 49% aque-ous hydrofluoric acid and absolute ethanol. The wafer anodizationwas performed in a Teflon cell with a Pt counter electrode and abackside Cu electrode. Anodization current density was 55 mA/cm2. The obtained high porosity (>90%) 300-lm thick nano-PSlayer was washed several times in absolute ethanol to evacuatecompletely all HF traces. Then, a micro-powder was formed fromthe nano-PS layer after the final evaporation of the ethanol fromthe nanopores. After this, the formed PS micro-powder wasmechanically grinded until it became a homogeneous nanopowderconstituted by numerous and various individual nanoparticleswhich were then dispersed in absolute ethanol. Finally, nanoparti-cle concentration up to 5 g per liter of ethanol was used as initialsolution for all the following manipulations and measurements.
Free-standing meso-PS membranes used in this work for sizetuning of the colloidal Si NPs were also prepared by anodic etching.Highly boron-doped p+-type (0.01–0.02 X cm) double-side pol-ished (1 0 0)-oriented Si wafers were treated. Etching solution con-tained 1:1 volume mixture of 49% aqueous hydrofluoric acid andabsolute ethanol. Constant anodic current density of 150 mA/cm2
was applied for various times (depended on layer thickness). A per-manent stirring of the etching solution was applied in order toevacuate hydrogen bubbles formed during the anodization process.Two seconds etch-stop intervals (2 s etch + 2 s stop) were intro-duced during the anodization in order to restore the electrolytein the depth of the meso-pores and thus, to avoid a porosity gradi-ent along the layer thickness. At the end of the anodization process,in order to remove the formed meso-PS layers from the bulk siliconwafer and thus to form free-standing meso-PS membrane, theanodization current density was rapidly switched for 5 s to the va-lue (1.27 A/cm2) corresponding to the electropolishing regime. Onefree-standing 37-lm thick meso-PS membrane was oxidized for15 min in 1:1 volume mixture of de-ionized water and ethanol. An-other 246-lm thick meso-PS membrane was chemically etched in10:1 volume mixture of absolute ethanol and HF acid (49%) during10 min in order to increase initial meso-pore diameters. Photolu-minescence (PL) of the NPs solutions extracted from the donorand receiver cells was analyzed in details. Photoluminescencemeasurements were performed at room temperature using a pulsenitrogen laser (k = 337.1 nm, s = 8 ns, 20 kW in each pulse) as aphoto-excitation source. The sample emission directed via an opti-cal fiber toward a monochromator (MS2004, Solar T2) was synch-ronically detected by a photomultiplier (Hamamatsu C6270),converted by an analog-to-digital device and finally, processed byPC.
3. Results and discussion
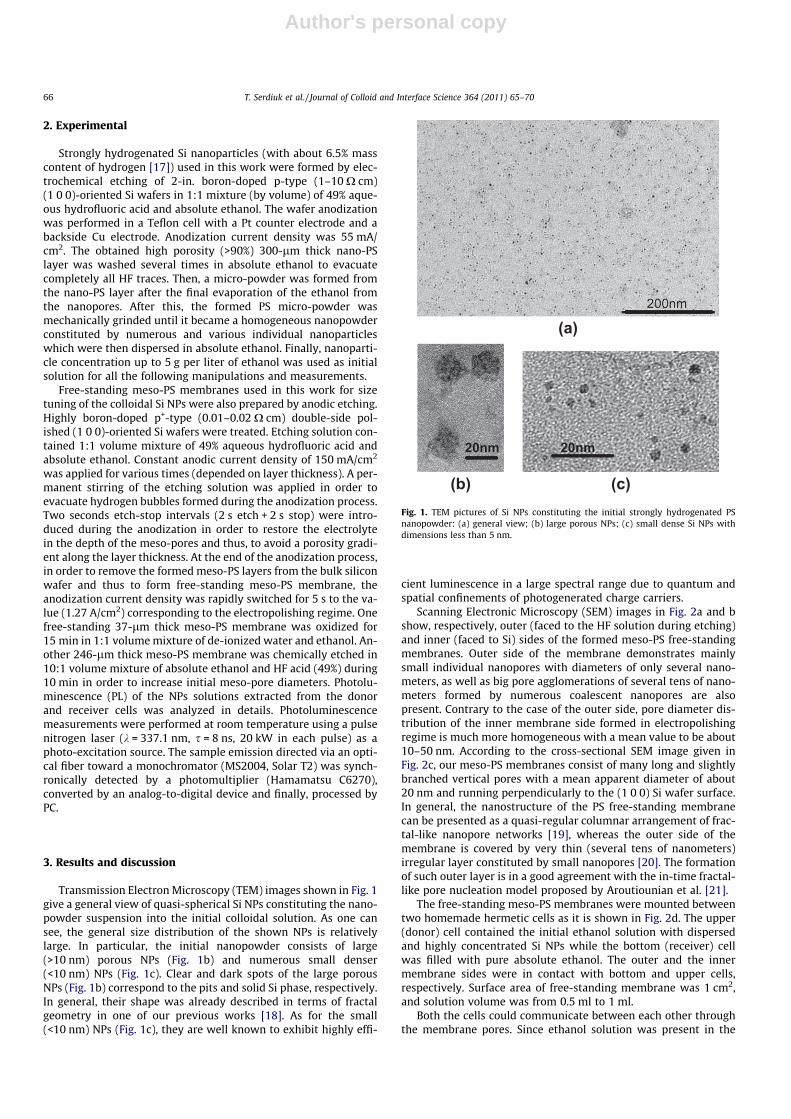
Transmission Electron Microscopy (TEM) images shown in Fig. 1give a general view of quasi-spherical Si NPs constituting the nano-powder suspension into the initial colloidal solution. As one cansee, the general size distribution of the shown NPs is relativelylarge. In particular, the initial nanopowder consists of large(>10 nm) porous NPs (Fig. 1b) and numerous small denser(<10 nm) NPs (Fig. 1c). Clear and dark spots of the large porousNPs (Fig. 1b) correspond to the pits and solid Si phase, respectively.In general, their shape was already described in terms of fractalgeometry in one of our previous works [18]. As for the small(<10 nm) NPs (Fig. 1c), they are well known to exhibit highly effi-
cient luminescence in a large spectral range due to quantum andspatial confinements of photogenerated charge carriers.
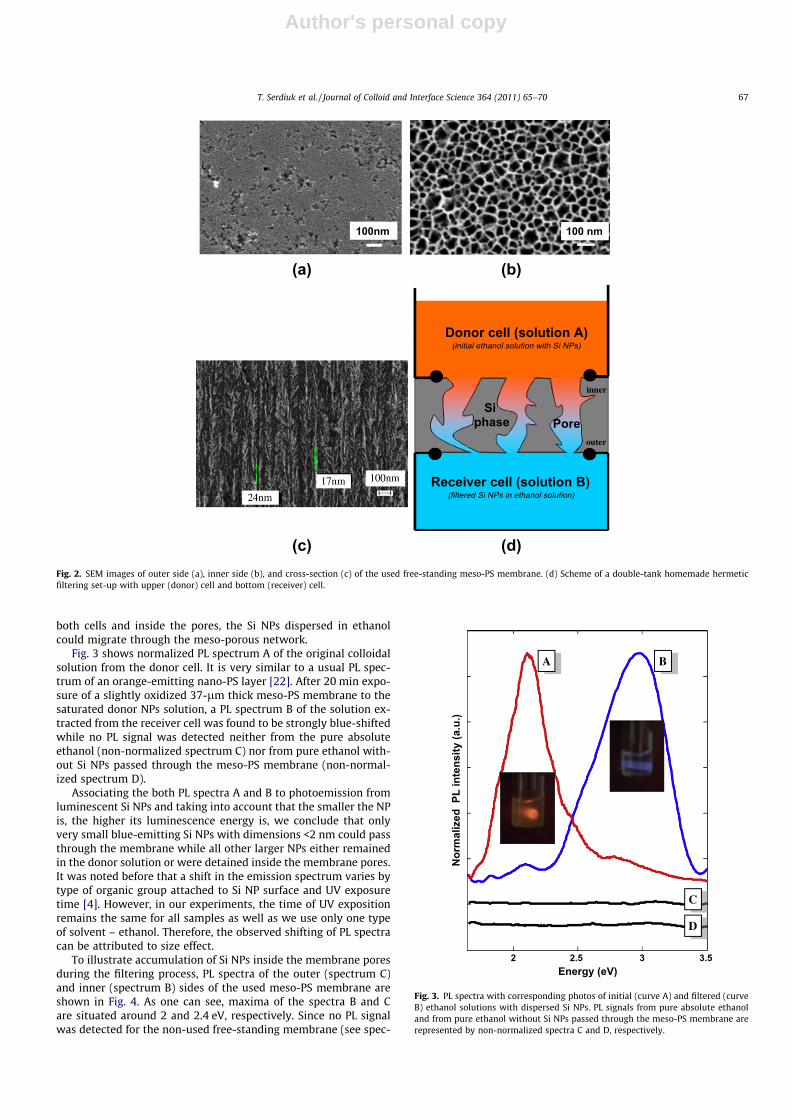
Scanning Electronic Microscopy (SEM) images in Fig. 2a and bshow, respectively, outer (faced to the HF solution during etching)and inner (faced to Si) sides of the formed meso-PS free-standingmembranes. Outer side of the membrane demonstrates mainlysmall individual nanopores with diameters of only several nano-meters, as well as big pore agglomerations of several tens of nano-meters formed by numerous coalescent nanopores are alsopresent. Contrary to the case of the outer side, pore diameter dis-tribution of the inner membrane side formed in electropolishingregime is much more homogeneous with a mean value to be about10–50 nm. According to the cross-sectional SEM image given inFig. 2c, our meso-PS membranes consist of many long and slightlybranched vertical pores with a mean apparent diameter of about20 nm and running perpendicularly to the (1 0 0) Si wafer surface.In general, the nanostructure of the PS free-standing membranecan be presented as a quasi-regular columnar arrangement of frac-tal-like nanopore networks [19], whereas the outer side of themembrane is covered by very thin (several tens of nanometers)irregular layer constituted by small nanopores [20]. The formationof such outer layer is in a good agreement with the in-time fractal-like pore nucleation model proposed by Aroutiounian et al. [21].
The free-standing meso-PS membranes were mounted betweentwo homemade hermetic cells as it is shown in Fig. 2d. The upper(donor) cell contained the initial ethanol solution with dispersedand highly concentrated Si NPs while the bottom (receiver) cellwas filled with pure absolute ethanol. The outer and the innermembrane sides were in contact with bottom and upper cells,respectively. Surface area of free-standing membrane was 1 cm2,and solution volume was from 0.5 ml to 1 ml.
Both the cells could communicate between each other throughthe membrane pores. Since ethanol solution was present in the
(a)
(b) (c)
20nm 20nm
Fig. 1. TEM pictures of Si NPs constituting the initial strongly hydrogenated PSnanopowder: (a) general view; (b) large porous NPs; (c) small dense Si NPs withdimensions less than 5 nm.
66 T. Serdiuk et al. / Journal of Colloid and Interface Science 364 (2011) 65–70
Author's personal copy
both cells and inside the pores, the Si NPs dispersed in ethanolcould migrate through the meso-porous network.
Fig. 3 shows normalized PL spectrum A of the original colloidalsolution from the donor cell. It is very similar to a usual PL spec-trum of an orange-emitting nano-PS layer [22]. After 20 min expo-sure of a slightly oxidized 37-lm thick meso-PS membrane to thesaturated donor NPs solution, a PL spectrum B of the solution ex-tracted from the receiver cell was found to be strongly blue-shiftedwhile no PL signal was detected neither from the pure absoluteethanol (non-normalized spectrum C) nor from pure ethanol with-out Si NPs passed through the meso-PS membrane (non-normal-ized spectrum D).
Associating the both PL spectra A and B to photoemission fromluminescent Si NPs and taking into account that the smaller the NPis, the higher its luminescence energy is, we conclude that onlyvery small blue-emitting Si NPs with dimensions <2 nm could passthrough the membrane while all other larger NPs either remainedin the donor solution or were detained inside the membrane pores.It was noted before that a shift in the emission spectrum varies bytype of organic group attached to Si NP surface and UV exposuretime [4]. However, in our experiments, the time of UV expositionremains the same for all samples as well as we use only one typeof solvent – ethanol. Therefore, the observed shifting of PL spectracan be attributed to size effect.
To illustrate accumulation of Si NPs inside the membrane poresduring the filtering process, PL spectra of the outer (spectrum C)and inner (spectrum B) sides of the used meso-PS membrane areshown in Fig. 4. As one can see, maxima of the spectra B and Care situated around 2 and 2.4 eV, respectively. Since no PL signalwas detected for the non-used free-standing membrane (see spec-
(d)(c)
Si phase Pore
Donor cell (solution A) (initial ethanol solution with Si NPs)
Receiver cell (solution B) (filtered Si NPs in ethanol solution)
inner
outer
(b)(a)
100nm 100 nm
Fig. 2. SEM images of outer side (a), inner side (b), and cross-section (c) of the used free-standing meso-PS membrane. (d) Scheme of a double-tank homemade hermeticfiltering set-up with upper (donor) cell and bottom (receiver) cell.
2 2.5 3 3.5Energy (eV)
Nor
mal
ized
PL
inte
nsity
(a.u
.)
A B
C
D
Fig. 3. PL spectra with corresponding photos of initial (curve A) and filtered (curveB) ethanol solutions with dispersed Si NPs. PL signals from pure absolute ethanoland from pure ethanol without Si NPs passed through the meso-PS membrane arerepresented by non-normalized spectra C and D, respectively.
T. Serdiuk et al. / Journal of Colloid and Interface Science 364 (2011) 65–70 67

Author's personal copy
trum A in Fig. 4) because of the large (>10 nm) Si crystallites con-stituting the membrane in which quantum and spatial confine-ments of photogenerated charge carriers are too weak or evenabsent, the strong luminescence observed from the used mem-brane (spectra B and C) is ensured by the NPs accumulated insidethe pores during the filtering. Moreover, taking into account spec-tral position of the PL peaks B and C, accumulation of the smallerNPs at the outer membrane side (output of the pore network)can be stated.
It means that the NP stacked along the membrane thickness canbe characterized by a more or less important NP size gradientdepending on a general complex fractal shape of the whole porousnetwork, on the membrane thickness as well as on a given initial
NP size distribution. It is really worth to remark that the NPs accu-mulated inside the pores diminish initial pore dimensions and itleads to an auto-filtration phenomenon (already observed and de-scribed in many other fields [23]), i.e., the blocked up Si NPs putobstacles in the way of the new coming Si NPs. In such a way,the observed auto-filtration effect which we called here ‘‘Si-by-Si’’ (SBS) filtration leads to a more efficient size selection of theNPs achieving the receiver cell.
PL spectra (1–4) of the receiver solutions shown in Fig. 5 illus-trate progressive filling of the pores of a 37-lm thin membranewith the passing NPs. Indeed, after the first use of the membrane,the PL spectrum 1 is very wide with several clearly visible low-en-ergy shoulders situated below the peak maximum (<2.3 eV) andcorresponding to the relatively big NPs passed through the mem-brane. The following utilizations of the same membrane lead toprogressive disappearance of the low-energy spectral components(see spectra 2–4).
It means that the number of the big NPs in the receiver solutionis drastically reduced. To our mind, the most plausible reason forthis is a gradual decrease in the pore dimensions due to progres-sive accumulation of the Si NPs into the porous network resultingin the auto-filtration effect mentioned above.
Evolution of the spectra is stopped when the meso-PS mem-brane is sufficiently saturated by the relatively big NPs. Accordingto our experiments, only several filtration steps are necessary to
2 2.5 3Energy (eV)
Nor
mal
ized
PL
inte
nsity
(a.u
.)
B C
A
inner
outer
Fig. 4. PL spectra of the free-standing meso-PS membrane before the filtrationprocedure (curve A) and after it: from the inner side (input of the pore network)(curve B) and from the outer side (output of the pore network) (curve C) of themembrane. The inset shows schematically an auto-filtration process of the Si NPsinside the membrane pores.
1.75 2 2.25 2.5 2.75 3 3.25Energy (eV)
Nor
mal
ized
PL
inte
nsity
(a.u
.)
1
2
3
4
Fig. 5. PL spectra of the colloidal Si NPs passed through the free-standing 37-lmthick meso-PS membrane after the first (curve 1), second (curve 2), third (curve 3),and fourth (curve 4) filtering processes performed in series.
2 2.5 3 3.5Energy (eV)
Nor
mal
ized
PL
inte
nsity
(a.u
.)
+3 +6
1
2
3
4
5
6
7
n+1 +4 +7 +8+5+2
Fig. 6. PL spectra of Si NPs dispersed in initial (curve 1) ethanol solutions, filteredwith the use of 23-lm thick free-standing meso-PS membrane (curve 2), filteredwith the use of 37-lm thick free-standing meso-PS membrane before (curve 3) andafter (curve 4) oxidation in 1:1 volume mixture of deionized water and ethanol atabout 320 K during 15 min, filtered with the use of 246-lm thick free-standingmeso-PS membrane before (curve 5) and after (curve 6) etching in 1:10 volumemixture of HF and deionized water at room temperature during 10 min, filteredwith the use of 350-lm thick free-standing meso-PS membrane (curve 7).
68 T. Serdiuk et al. / Journal of Colloid and Interface Science 364 (2011) 65–70
Author's personal copy
stabilize completely the NPs population inside the membrane andthus ensure good repeatability of the filtration process.
Fig. 6 shows how various parameters of the meso-PS membraneinfluence size distribution of the Si NPs achieving the receiver cell.First of all, gradual increase in the membrane thickness from tensup to hundreds of microns provokes consecutive blue-shifts of thecorresponding PL spectral maxima (curves 2, 3, 5, 7) regarding tothe maximum position of spectrum 1 of the initial donor solution.This result can be easily understood considering enhancement ofthe filtering efficiency of a membrane with a fixed porous mor-phology when the membrane thickness increases. Indeed, thickerthe membrane is, higher the probability of the NP blocking is.However, the filtering time increases too: from 7 min for the thin-nest membrane up to 30 min for the thickest one in order to re-ceive more or less the same PL intensity.
Slight oxidation of the 37-lm thick membrane leading to a con-siderable reduction in the pore dimensions ensures much moreefficient size exclusion during the SBS filtering even for the thinmembrane as it can be concluded from comparison of the spectra3 and 4 in Fig. 6. From another side, enlarging of the initiallyformed pores that can be simply achieved by an additional chem-ical etching step renders the SBS filtering less selective as it is illus-trated by the spectra 5 and 6. Indeed, the PL spectrum 6 becomesmuch wider due to appearance of numerous additional low-energyshoulders compared with the spectrum 5.
This reflects the fact that much more of the larger NPs penetratethrough the additionally etched membrane into the receiver solu-tion. In general, the etching and/or the oxidation steps can be usedfor precise tuning of the pore sizes to obtain a necessary size of theSi NPs.
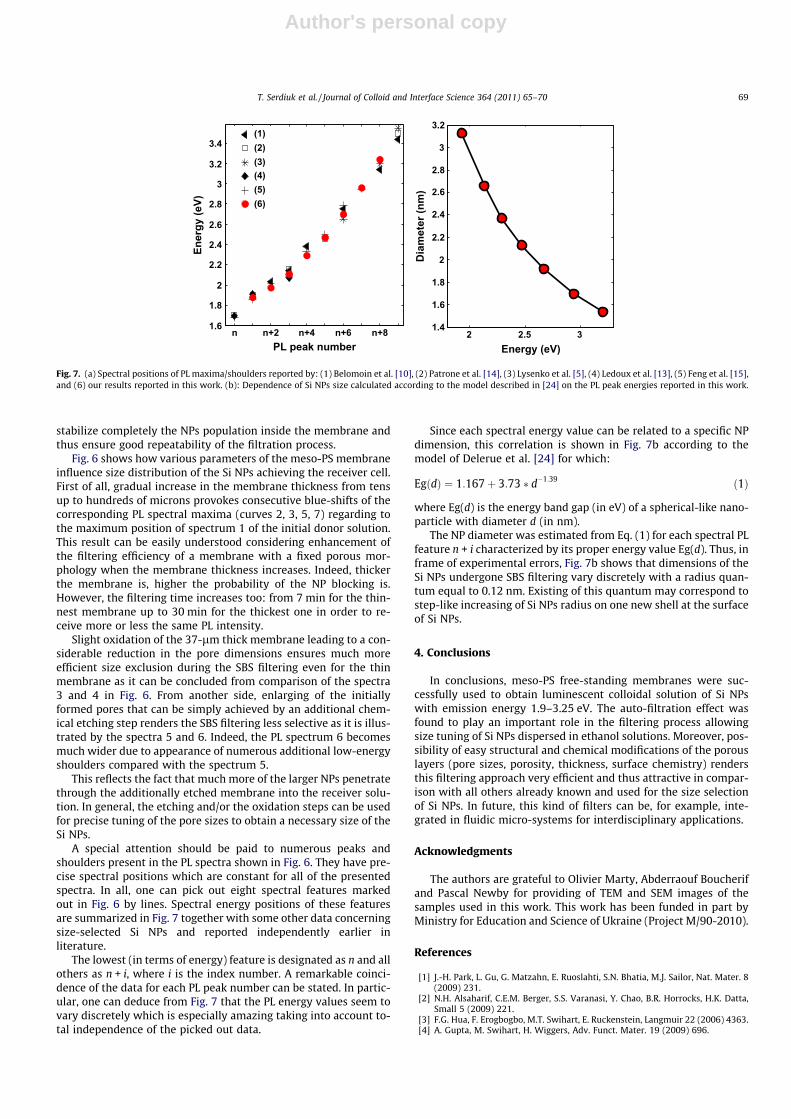
A special attention should be paid to numerous peaks andshoulders present in the PL spectra shown in Fig. 6. They have pre-cise spectral positions which are constant for all of the presentedspectra. In all, one can pick out eight spectral features markedout in Fig. 6 by lines. Spectral energy positions of these featuresare summarized in Fig. 7 together with some other data concerningsize-selected Si NPs and reported independently earlier inliterature.
The lowest (in terms of energy) feature is designated as n and allothers as n + i, where i is the index number. A remarkable coinci-dence of the data for each PL peak number can be stated. In partic-ular, one can deduce from Fig. 7 that the PL energy values seem tovary discretely which is especially amazing taking into account to-tal independence of the picked out data.
Since each spectral energy value can be related to a specific NPdimension, this correlation is shown in Fig. 7b according to themodel of Delerue et al. [24] for which:
EgðdÞ ¼ 1:167þ 3:73 � d�1:39 ð1Þ
where Eg(d) is the energy band gap (in eV) of a spherical-like nano-particle with diameter d (in nm).
The NP diameter was estimated from Eq. (1) for each spectral PLfeature n + i characterized by its proper energy value Eg(d). Thus, inframe of experimental errors, Fig. 7b shows that dimensions of theSi NPs undergone SBS filtering vary discretely with a radius quan-tum equal to 0.12 nm. Existing of this quantum may correspond tostep-like increasing of Si NPs radius on one new shell at the surfaceof Si NPs.
4. Conclusions
In conclusions, meso-PS free-standing membranes were suc-cessfully used to obtain luminescent colloidal solution of Si NPswith emission energy 1.9–3.25 eV. The auto-filtration effect wasfound to play an important role in the filtering process allowingsize tuning of Si NPs dispersed in ethanol solutions. Moreover, pos-sibility of easy structural and chemical modifications of the porouslayers (pore sizes, porosity, thickness, surface chemistry) rendersthis filtering approach very efficient and thus attractive in compar-ison with all others already known and used for the size selectionof Si NPs. In future, this kind of filters can be, for example, inte-grated in fluidic micro-systems for interdisciplinary applications.
Acknowledgments
The authors are grateful to Olivier Marty, Abderraouf Boucherifand Pascal Newby for providing of TEM and SEM images of thesamples used in this work. This work has been funded in part byMinistry for Education and Science of Ukraine (Project M/90-2010).
References
[1] J.-H. Park, L. Gu, G. Matzahn, E. Ruoslahti, S.N. Bhatia, M.J. Sailor, Nat. Mater. 8(2009) 231.
[2] N.H. Alsaharif, C.E.M. Berger, S.S. Varanasi, Y. Chao, B.R. Horrocks, H.K. Datta,Small 5 (2009) 221.
[3] F.G. Hua, F. Erogbogbo, M.T. Swihart, E. Ruckenstein, Langmuir 22 (2006) 4363.[4] A. Gupta, M. Swihart, H. Wiggers, Adv. Funct. Mater. 19 (2009) 696.
n n+2 n+4 n+6 n+81.6
1.8
2
2.2
2.4
2.6
2.8
3
3.2
3.4
PL peak number
Ener
gy (e
V)
(1)(2)(3)(4)(5)(6)
2 2.5 31.4
1.6
1.8
2
2.2
2.4
2.6
2.8
3
3.2
Energy (eV)
Dia
met
er (n
m)
Fig. 7. (a) Spectral positions of PL maxima/shoulders reported by: (1) Belomoin et al. [10], (2) Patrone et al. [14], (3) Lysenko et al. [5], (4) Ledoux et al. [13], (5) Feng et al. [15],and (6) our results reported in this work. (b): Dependence of Si NPs size calculated according to the model described in [24] on the PL peak energies reported in this work.
T. Serdiuk et al. / Journal of Colloid and Interface Science 364 (2011) 65–70 69

Author's personal copy
[5] V. Lysenko, V. Onyskevych, O. Marty, V.A. Skryshevsky, Y. Chevolot, C. Bru-Chevallier, Appl. Phys. Lett. 92 (2008) 251910.
[6] Shu-Lin Zhang, Kuok-san Ho, Yongtian Hou, Bidong Qlan, Peng Diao, ShengminCai, Appl. Phys. Lett. 62 (1993) 642.
[7] T. Qiu, X.L. Wu, F. Kong, H.B. Ma, P.K. Chu, Phys. Lett. A 334 (2005) 447.[8] V. Švrcek, T. Sasaki, Y. Shimizu, N. Koshizaki, Appl. Phys. Lett. 89 (2006)
213113.[9] A. Tanaka, R. Saito, T. Kamikake, M. Imamura, H. Yasuda, Solid State Commun.
140 (2006) 400.[10] G. Belomoin, J. Therrien, A. Smith, S. Rao, R. Twesten, S. Chaieb, M.H. Nayfeh, L.
Wagner, L. Mitas, Appl. Phys. Lett. 80 (2002) 841.[11] V. Švrce, A. Slaoui, J.-C. Muller, J. Appl. Phys. 95 (2004) 3158.[12] J. Valenta, P. Janda, K. Dohnalová, D. Niznansky, F. Vácha, J. Linnros, Opt. Mater.
27 (2005) 1046.[13] G. Ledoux, O. Guillois, D. Porterat, C. Reynaud, Phys. Rev. B 62 (2000) 15942.[14] L. Patrone, D. Nelson, V.I. Safarov, M. Sentis, W. Marine, J. Appl. Phys. 87 (2000)
3829.
[15] Z.C. Feng, R. Tsu (Eds.), Porous Silicon, World Scientific, Singapore, 1994, p. 88(and reference there in).
[16] T. Serdiuk, V.A. Skryshevsky, I.I. Ivanov, V. Lysenko, Mater. Lett. 65 (2011)2514.
[17] V. Lysenko, F. Bidault, S. Alekseev, C. Turpin, F. Geobaldo, P. Rivolo, E. Garrone,V. Zaitsev, D. Barbier, J. Phys. Chem. B 109 (2005) 19711.
[18] T. Nychyporuk, V. Lysenko, D. Barbier, Phys. Rev. B 71 (2005) 115402.[19] M. Wesolowski, Phys. Rev. B 66 (2000) 205207.[20] N. Errien, L. Vellutini, G. Froyer, G. Louarn, Appl. Surf. Sci. 253 (2007) 7265.[21] V.M. Aroutiounian, M.Zh. Ghoolinian, H. Tributsch, Appl. Surf. Sci. 122 (2000)
162.[22] L.T. Canham (Ed.), Properties of Porous Silicon, INSPEC, The IEE, London, 1997.[23] see, for example: N. Roussel, Thi Lien Huong Nguyen, P. Coussot, Phys. Rev.
Lett. 98 (2007) 114502 (and references there in).[24] C. Delerue, G. Allan, M. Lannoo, Phys. Rev. B 48 (1993) 11024.
70 T. Serdiuk et al. / Journal of Colloid and Interface Science 364 (2011) 65–70
Related Documents