Pergamon NmoSmchred Materials, Vol. 8, No. 7, pp. 771-784, 1997 Elswicr Scima Lul Q 1998 Acu Memllurgica Inc. Printed in the USA. AU rights atsaved 0965-9773197 s17.al+ .oo PI1 SO9659773(98)0002&8 SIZE SELECTION BY CLUSTER DEFLECTION IN AN ELECTRIC FIELD A.C. Xenoulis*, P. Tsouris*, G. Doukellis*, N. Boukos,** E. Valamontesf, Y. Chen* and T. 1Sakalakost X’Institute of Nuclear Physics, National Center for Scientific Research, “Demokritos,” 153 10 Aghia Pamskevi, Athens, Greece *“Institute of Material Science, National Center for Scientific Research, “Demokritos,” 153 10 Aghia Paraskevi, Athens, Greece tTechnological Educational Institute, Aegaleo 122 43, Greece *Dept. of Ceramic and Materials Engineering, Rutgers University, Piscataway, NJ 08854-8065 (Accepted January 12,1998) Abstract-Defection by an electricfield has been tested asameans to deposit size selected clusters. A hollow-cathode, glow-discharge, source has been used for the production of Cu clusters in the size range between 4 and 38 nm, while afield emission scanning microscope has been usedfor HREM investigation of the size and morphology of clusters supported on Alfoil. The deflected negative clusters demonstrate size selection as a function of displacement while the positive do no tfollow the samedisplacementfunction. Size selection is also observed in the neutral clusters, with the heaviest clusters deposited at the center of the undejlected beam spot. Implications concerning the synthesis of cluster-composed, nanostructured materials are dis- cussed. @I998 Acta Metallurgica Inc. INTRODUCTION Size selected clusters are considered to be a new building block for the construction of nanostructured materials (1). Size selection, however, is not a trivial operation. Electrically charged clusters are required as well as an appropriate experimental apparatus capable to act as mass gate. In order to obtain charged cluster beams, two main approaches are possible. In the first approach, a beam of neutral clusters is extracted from the source and is post-ionized by electron or photon bombardment. This is the case with all oven-heated sources. The other solution is to use a cluster source which can directly produce spontaneously ionized clusters. All sources implementing electric discharge or generating plasma, such as the magnetron (2) and the hollow- cathode (3) source, provide a mixture of neutral and spontaneously ionized clusters of both polarities. Ionized clusters produced in a hollow-cathode source are used in the present study. 771

Welcome message from author
This document is posted to help you gain knowledge. Please leave a comment to let me know what you think about it! Share it to your friends and learn new things together.
Transcript
Pergamon
NmoSmchred Materials, Vol. 8, No. 7, pp. 771-784, 1997 Elswicr Scima Lul
Q 1998 Acu Memllurgica Inc. Printed in the USA. AU rights atsaved
0965-9773197 s17.al+ .oo
PI1 SO9659773(98)0002&8
SIZE SELECTION BY CLUSTER DEFLECTION IN AN ELECTRIC FIELD
A.C. Xenoulis*, P. Tsouris*, G. Doukellis*, N. Boukos,** E. Valamontesf, Y. Chen* and T. 1Sakalakost
X’Institute of Nuclear Physics, National Center for Scientific Research, “Demokritos,” 153 10 Aghia Pamskevi, Athens, Greece
*“Institute of Material Science, National Center for Scientific Research, “Demokritos,” 153 10 Aghia Paraskevi, Athens, Greece
tTechnological Educational Institute, Aegaleo 122 43, Greece *Dept. of Ceramic and Materials Engineering, Rutgers University,
Piscataway, NJ 08854-8065
(Accepted January 12,1998)
Abstract-Defection by an electricfield has been tested asameans to deposit size selected clusters. A hollow-cathode, glow-discharge, source has been used for the production of Cu clusters in the size range between 4 and 38 nm, while afield emission scanning microscope has been usedfor HREM investigation of the size and morphology of clusters supported on Alfoil. The deflected negative clusters demonstrate size selection as a function of displacement while the positive do no tfollow the samedisplacementfunction. Size selection is also observed in the neutral clusters, with the heaviest clusters deposited at the center of the undejlected beam spot. Implications concerning the synthesis of cluster-composed, nanostructured materials are dis- cussed. @I998 Acta Metallurgica Inc.
INTRODUCTION
Size selected clusters are considered to be a new building block for the construction of nanostructured materials (1). Size selection, however, is not a trivial operation. Electrically charged clusters are required as well as an appropriate experimental apparatus capable to act as mass gate.
In order to obtain charged cluster beams, two main approaches are possible. In the first approach, a beam of neutral clusters is extracted from the source and is post-ionized by electron or photon bombardment. This is the case with all oven-heated sources. The other solution is to use a cluster source which can directly produce spontaneously ionized clusters. All sources implementing electric discharge or generating plasma, such as the magnetron (2) and the hollow- cathode (3) source, provide a mixture of neutral and spontaneously ionized clusters of both polarities. Ionized clusters produced in a hollow-cathode source are used in the present study.
771
772 AC XENOULIS, P Tsoms, G DOUKELLIS, N B~UKOS, E VALAMONTES, Y CHEN AND T TSAKALAKOS
Time of flight mass spectrometry and Wien filters both have been used extensively for size selection associated mainly with the study of fundamental cluster properties. What may be good for basic research, however, is not necessarily equally fitting for the production of nanostructured materials. The latter demand high deposition rates and high operational stabilities, obviously because large quantities, sufficient for practical utilization, must be collected during a deposition run. However, both these apparatus can be tuned only to a certain mass range at a time, while the rest of the mass distribution is wasted. Wien filters having a simple operation are very reliable, but they can be used effectively only for the separation of relatively small clusters.
Probably the most robust technique to obtain size selected clusters is by deflection of charged clusters in a homogeneous electric field. Its success, however, is conditional. In principle, the deflection displacement is inversely proportional to the kinetic energy of the charged clusters and thus, for a given flight velocity, inversely proportional to the mass of the cluster. Such an approach has been used to infer the mass distribution of zinc clusters (4). In practice, however, the situation usually is less straightforward, mainly because it is almost impossible to anticipate either the translational velocities or the degree of ionization of the involved clusters. For light mass clusters, for which it has been well documented (5) that their convective velocity equals the flow velocity of the carrier gas, good size selection is assured. For heavier clusters, however, a velocity slip may be present (6), according to which the larger clusters acquire only a fraction of the carrier gas
pump pump
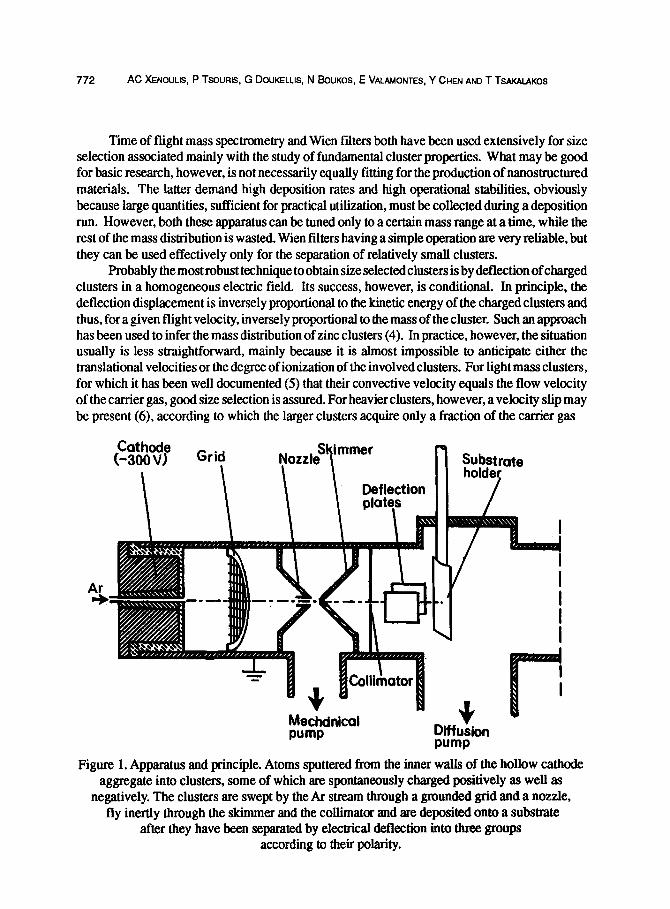
Figure 1. Apparatus and principle. Atoms sputtered from the inner walls of the hollow cathode aggregate into clusters, some of which are spontaneously charged positively as well as
negatively. The clusters are swept by the Ar stream through a grounded grid and a nozzle, fly inertly through the skimmer and the collimator and are deposited onto a substrate
after they have been separated by electrical deflection into three groups according to their polarity.
SIZE SELECTION BY CLUSTER DEFLECTION IN AN ELECTRIC FIELD 773
velocity. In that case clusters of different size will acquire similar kinetic energies, be equally deflected and. deposited on exactly the same beam spot. Similar size-selection miscarriage will occur by multiple cluster ionizations. Apparently, only direct experimental testing can resolve all these alternatives.
Consequently, in the present study no assumptions about the parameters associated with mass separation were presumed. Instead, after the clusters were electrically deflected and deposited on particular substrates, their morphology was examined and their size quantified by high-resolution scanning electron microscopy (HRSEM). The various results were, finally, evaluated in order to empirically assess and delineate possibilities as well as limitations of the deflection method as a means to deposit size selected clusters for practical applications.
APPARATUS AND PRINCIPLES
A detailed description of the hollow-cathode source used in the present study can be found elsewhere (3). Aschematic diagram of the apparatus relevant to the present investigation is shown in Figure 1. Briefly, a potential difference of -300 V is applied between the insulated cathode and the grounded walls of the vacuum tube. The ensuing plasma discharge ionizes the Ar gas which, at an average pressure of about 1 mbar, is continuously flowing through the source under the influence of a mechanical pump. The inert gas is injected into the chamber from the cathode end, and pumped out from the grounded anode end, generating a flowing glowing plasma which could be observed through two sideview windows.
Recently, the effect of a grounded grid placed in the source chamber between the hollow cathode and the nozzle (see Figure l), has been tested on various aspects of the discharge. As a result of these tests, the grid was adopted as an integral part of the experimental setup because its presence significantly upgraded the performance of the source.
The cathode atoms sputtered in the discharge aggregate into clusters with size varying between roug,hly 50 and 150 A, as indicated by TEM measurements. Some clusters will be charged when at least one of their constituent atoms has been already charged, either because it was ionized during the earlier sputtering event or because it was ionized a little later by the discharge. As far as the ionization caused by the discharge is concerned, there is only one mechanism, involving electron attachment, producing negative clusters, while there are a few causing positive ionization. The latter include direct electron impact, asymmetric charge transfer between Ar+ and the metal atom, and Penning ionization caused by metastable excited Ar atoms. Nevertheless, in the final countdown the negative clusters dominate, probably because the positive are reneutralized by the overabundant electrons, although either polarity may be lost by charge recombination and diffusion to the walls. Otherwise, the charges would proliferate to infinity. For instance, only the atoms born ionized in the sputtering (although their probability is only of the order of 10m4) would cause a near 100% ionization, assuming that the average cluster contains 10,000 atoms. More details about ionization processes may be found elsewhere (7).
Chargedand neutral clusters are swept by the Ar stream through a Cmm diameter nozzle and fly inertly through a l-mm diameter skimmer and a collimator of the same diameter. Then the cluster beam passes through two deflection plates on which a potential difference may be applied and are finally deposited on various substrates. The deflection electrodes are 2x2 cm aluminum plates set 1 cm apart.
f
774
SIZE SELECTION BY CLUSTER DEFLECTION IN AN ELECTRIC FIELO 775
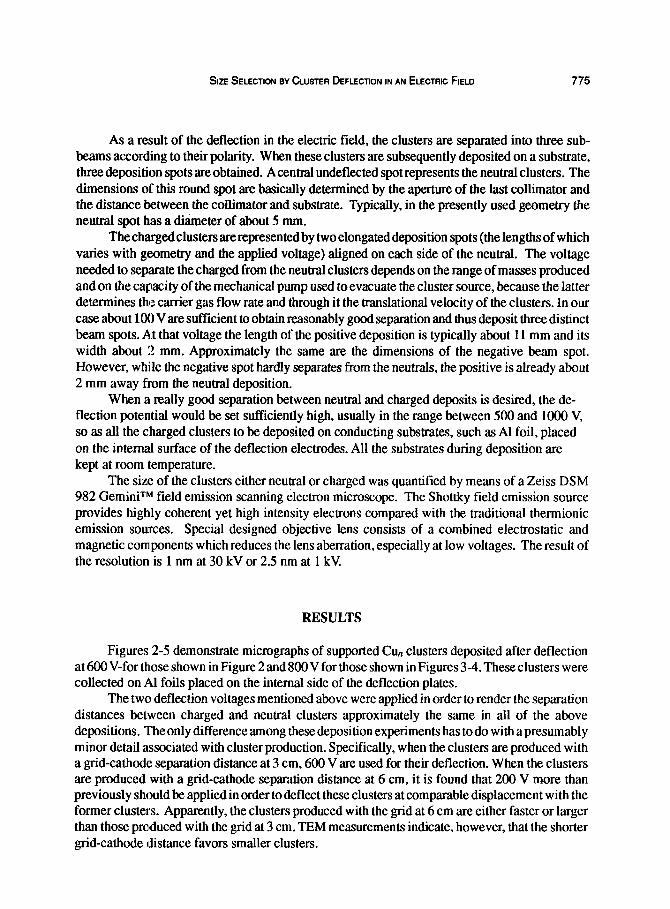
As a result of the deflection in the electric field, the clusters are separated into three sub- beams according to their polarity. When these clusters are subsequently deposited on a substrate, three deposition spots are obtained. Acentral undeflected spot represents the neutral clusters. The dimensions of this round spot are basically determined by the aperture of the last collimator and the distance between the collimator and substrate. Typically, in the presently used geometry the neutral spot has a diameter of about 5 mm.
The charged clusters are represented by two elongated deposition spots (the lengths of which varies with geometry and the applied voltage) aligned on each side of the neutral. The voltage needed to separate the charged from the neutral clusters depends on the range of masses produced and on the capacity of the mechanical pump used to evacuate the cluster source, because the latter determines the carrier gas flow rate and through it the translational velocity of the clusters. In our case about 100 Vare sufficient to obtain reasonably good separation and thus deposit three distinct beam spots. At that voltage the length of the positive deposition is typically about 11 mm and its width about 2 mm. Approximately the same are the dimensions of the negative beam spot. However, while the negative spot hardly separates from the neutrals, the positive is already about 2 mm away from the neutral deposition.
When a really good separation between neutral and charged deposits is desired, the de- flection potential would be set sufficiently high, usually in the range between 500 and 1000 V, so as all the clharged clusters to be deposited on conducting substrates, such as Al foil, placed on the internal surface of the deflection electrodes. All the substrates during deposition are kept at room temperature.
The size of the clusters either neutral or charged was quantified by means of a Zeiss DSM 982 GeminP field emission scanning electron microscope. The Shottky field emission source provides highly coherent yet high intensity electrons compared with the traditional thermionic emission souIrces. Special designed objective lens consists of a combined electrostatic and magnetic components which reduces the lens aberration, especially at low voltages. The result of the resolution is 1 nm at 30 kV or 2.5 nm at 1 kV.
RESULTS
Figures 2-5 demonstrate micrographs of supported Gun clusters deposited after deflection at 600 V-for thlose shown in Figure 2 and 800V for those shown in Figures 3-4. These clusters were collected on Al foils placed on the internal side of the deflection plates.
The two deflection voltages mentioned above were applied in order to render the separation distances between charged and neutral clusters approximately the same in all of the above depositions. The only difference among these deposition experiments has to do with a presumably minor detail associated with cluster production. Specifically, when the clusters are produced with a grid-cathode separation distance at 3 cm, 600 V am used for their deflection. When the clusters are produced with a grid-cathode separation distance at 6 cm, it is found that 200 V more than previously should be applied in order to deflect these clusters at comparable displacement with the former clusters. Apparently, the clusters produced with the grid at 6 cm are either faster or larger than those produced with the grid at 3 cm. TEM measurements indicate, however, that the shorter grid-cathode distance favors smaller clusters.
776
778

SIZE SELECTION BY CLUSTER DEFLECTlON IN AN ELECTFIIC FIELD 779
Negative
l
30 -
2o - Shoot displacement
10 - I\ 8
Middle displacement
8
n Large displacement
o~m*‘*‘*‘.‘*‘*J 0 5 10 15 20 25 30 35 40
Diameter in nm Figure 6. Size distributions of negatively charged clusters deflected by the electric field at three different displacement distances.
20 -
15 -
10 -
5-
e 2 20
s 0 15
6
& 10
45 z
1
15
10
5
t
Positive
Short displacement
:i\, 8 I-.
b
Middle displacement
0’*‘*‘* ’ - ‘* ’ * ’ *‘* ’ 0 5 10 15 20 25 30 35 40
Diameter in nm Figure 7. Size distributions of positively charged clusters deflected by the electric field at three different displacement distances.
A second introductory remark is in order. With no exception and under any used potential, the heaviest negative clusters, as it has been already mentioned, are displaced less by deflection than the corresponding positive. Apparently, the negative clusters are either faster or larger than the positive produced and ionized under exactly the same conditions. Present results, which will be discussed below, as well as relevant results previously published (1,8) support the second alternative.
With re,spcct to the chemical composition of the supported clusters, although Cu clusters were initially deposited, they were almost completely oxidized to CuzO (cuprite) by the time of the microscopic observations. This chemical trausformation, which occurred because the samples were exposed to the atmosphere for several days, was identified by XRD measurements. In fact,
780 AC XENOULIS. P TSOURS, G DOUKELLIS, N B~UKOS, E VALAMONTES. Y CHEN AND T TSMALAKOS
a detailed HRSEM study of the oxidation of copper clusters has recently appeared, demonstrating that at room temperature oxidation begins just after a few minutes of exposure to air (9).
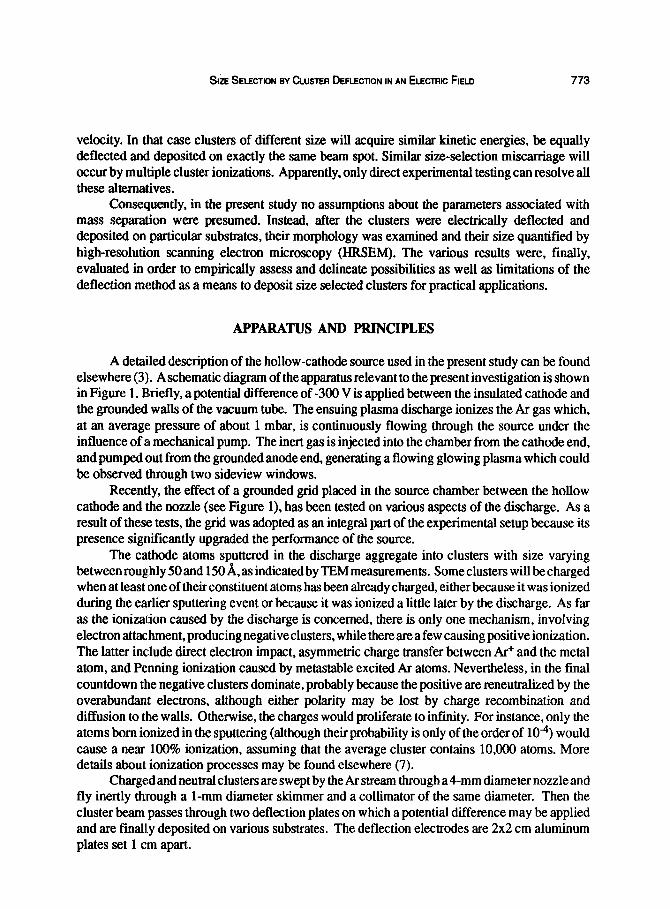
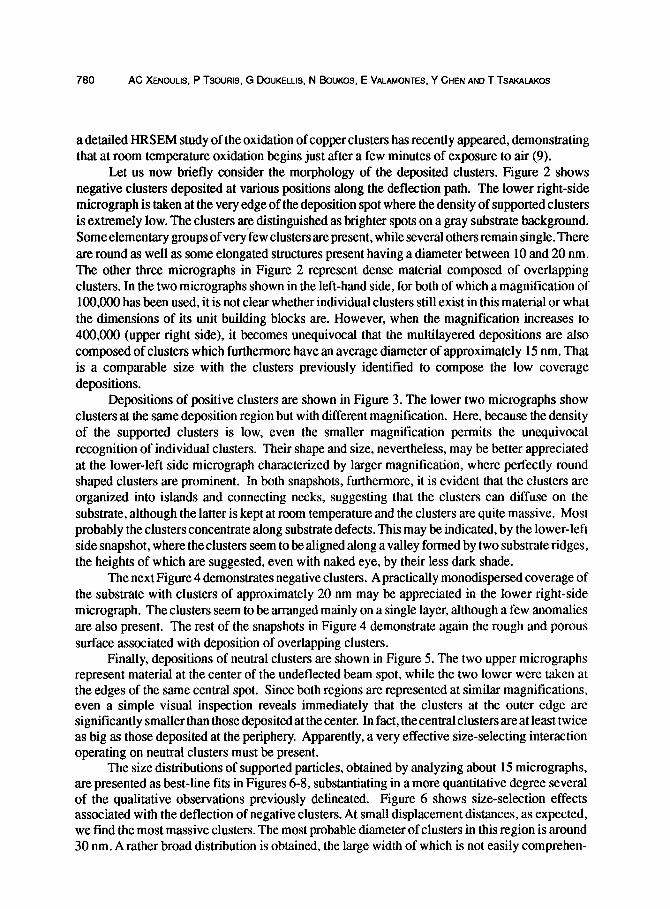
Let us now briefly consider the morphology of the deposited clusters. Figure 2 shows negative clusters deposited at various positions along the deflection path. The lower right-side micrograph is taken at the very edge of the deposition spot where the density of supported clusters is extremely low. The clusters are distinguished as brighter spots on a gray substrate background. Some elementary groups of very few clusters are present, while several others remain single. There are round as well as some elongated structures present having a diameter between 10 and 20 nm. The other three micrographs in Figure 2 represent dense material composed of overlapping clusters. In the two micrographs shown in the left-hand side, for both of which a magnification of 100,000 has been used, it is not clear whether individual clusters still exist in this material or what the dimensions of its unit building blocks are. However, when the magnification increases to 400,000 (upper right side), it becomes unequivocal that the multilayered depositions are also composed of clusters which furthermore have an average diameter of approximately 15 nm. That is a comparable size with the clusters previously identified to compose the low coverage depositions.
Depositions of positive clusters are shown in Figure 3. The lower two micrographs show clusters at the same deposition region but with different magnification. Here, because the density of the supported clusters is low, even the smaller magnification permits the unequivocal recognition of individual clusters. Their shape and size, nevertheless, may be better appreciated at the lower-left side micrograph characterized by larger magnification, where perfectly round shaped clusters are prominent. In both snapshots, furthermore, it is evident that the clusters are organized into islands and connecting necks, suggesting that the clusters can diffuse on the substrate, although the latter is kept at room temperature and the clusters are quite massive. Most probably the clusters concentrate along substrate defects. This may be indicated, by the lower-left side snapshot, where the clusters seem to be aligned along a valley formed by two substrate ridges, the heights of which are suggested, even with naked eye, by their less dark shade.
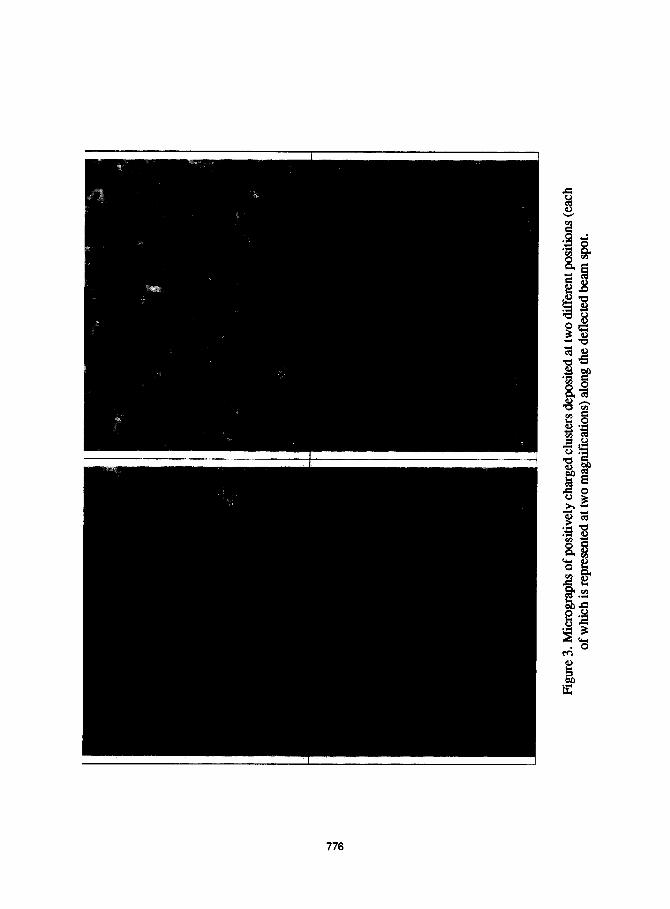
The next Figure 4 demonstrates negative clusters. A practically monodispersed coverage of the substrate with clusters of approximately 20 nm may be appreciated in the lower right-side micrograph. The clusters seem to be arranged mainly on a single layer, although a few anomalies are also present. The rest of the snapshots in Figure 4 demonstrate again the rough and porous surface associated with deposition of overlapping clusters.
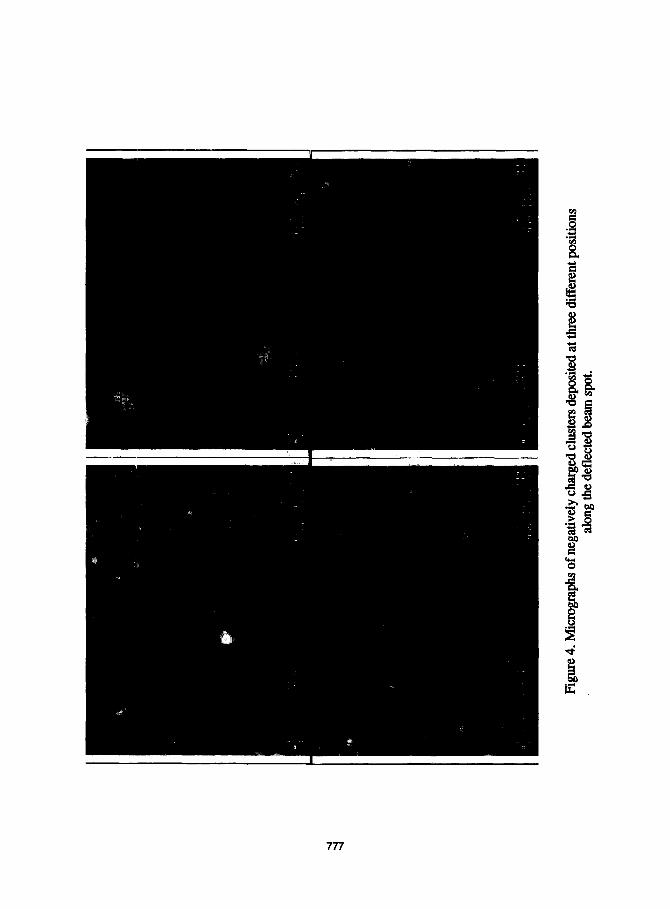
Finally, depositions of neutral clusters are shown in Figure 5. The two upper micrographs represent material at the center of the undeflected beam spot, while the two lower were taken at the edges of the same central spot. Since both regions are represented at similar magnifications, even a simple visual inspection reveals immediately that the clusters at the outer edge are significantly smaller than those deposited at the center. In fact, the central clusters are at least twice as big as those deposited at the periphery. Apparently, a very effective size-selecting interaction operating on neutral clusters must be present.
The size distributions of supported particles, obtained by analyzing about 15 micrographs, are presented as best-line fits in Figures 6-8, substantiating in a more quantitative degree several of the qualitative observations previously delineated. Figure 6 shows size-selection effects associated with the deflection of negative clusters. At small displacement distances, as expected, we find the most massive clusters. The most probable diameter of clusters in this region is around 30 nm. A rather broad distribution is obtained, the large width of which is not easily comprehen-
8n SELECTION BYCLUSTER DEFLECTION INAN ELECTRIC FIELD 781
30
20
[ 10
50
50-
40-
30-
20-
10-
7OL
60-
so-
so-
30-
20-
10 -
Neutral
Center
. \
\ I Periphery
Outeredge
c.-.‘-‘-‘*‘*‘-‘*’ 0 5 10 15 20 25 20 32 40
Diameter in nm
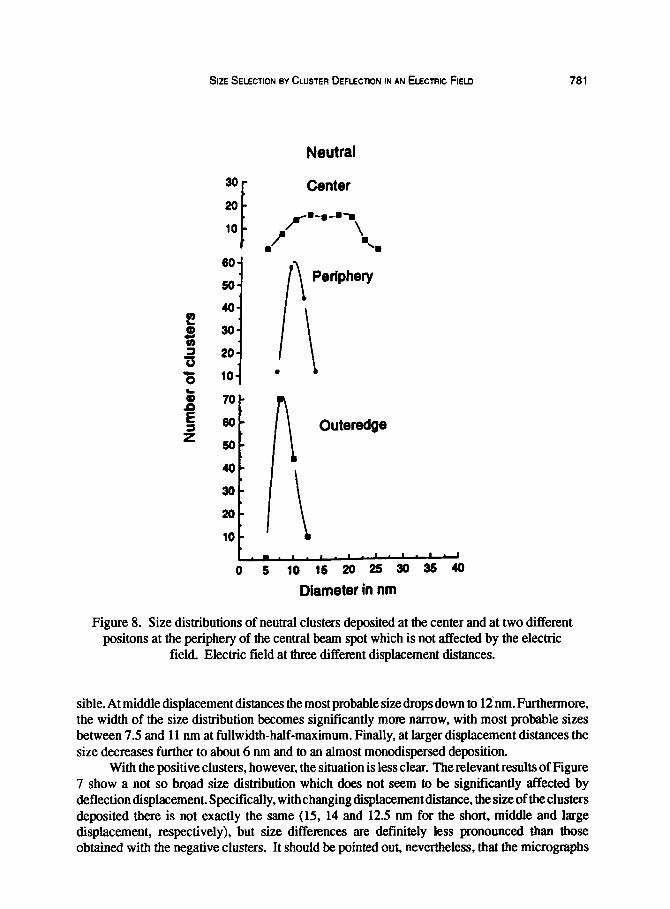
Figure 8. Size distributions of neutral clusters deposited at the center and at two different positons at the periphery of the central beam spot which is not affected by the electric
field. Electric field at three different displacement distances.
sible. At middle displacement distances the most probable size drops down to lznm. Furthermore, the width of the size distribution becomes significantly more narrow, with most probable sizes between 7.5 and 11 nm at fullwidth-half-maximum. Finally, at larger displacement distances the size decreases further to about 6 nm and to an almost monodispersed deposition.
With the positive clusters, however, the situation is less clear. Therelevant results of Figure 7 show a not so broad size distribution which does not seem to be significantly affected by deflection displacement. Specifically, with changing displacement distance, the size of the clusters deposited there is not exactly the same (15, 14 and 12.5 run for the short, middle and large displacement, respectively), but size differences are definitely less pronounced than those obtained with the negative clusters. It should be pointed out, nevertheless, that the micrographs
782 AC XENOULIS, P Tsouws, G DOUKELLIS, N WJKOS, E VALAMONTES, Y CHEN AND T TSAKALAKOS
of the positive clusters were less clear than those of the negative clusters, rendering the quantitative results of Figure 7 less certain than those of Figure 6. Finally, comparison of sizes of negative and positive clusters shown in Figures 6 and 7 clearly suggests that the largest negative clusters are significantly larger than the corresponding positive.
Size differentiation associated with neutral clusters is demonstrated in Figure 8. The clusters deposited at the center of the neutral-cluster deposition spot are characterized by a bimodal, broad distribution with cluster sizes roughly between 5 and 25 nm. In the periphery, however, the clusters are significantly lighter, with practically monodispersed sizes of 7 and 11 nm for the two different cases presented. Although the significance of the observation cannot be presently evaluated, it should be noted that the light clusters selectively deposited at the periphery correspond more or less to the low-mass peak of the bimodal distribution.
DISCUSSION
The HRSEM analysis of deflected clusters has revealed that the deposited negative as well as neutral clusters are clearly size selected as a function of displacement. The implications of the above observations are twofold.
On a fundamental level they suggest that the clusters were formed already before they were intercepted by the electric field. Otherwise, the deflection could not result to size selection. This observation, however, cannot exclude that a certain size rearrangement may also occur on the substrate during or after deposition.
On the practical level, the above results suggest that the synthesis of nanostructured materials with size selected clusters may be relatively easily achieved by deposition of deflected negative clusters. The samples produced in practical quantities may not be as monodispersed, such as those shown in Figure 6 since a range of different sizes will be deposited when, for instance, a set of slits will be used to simultaneously collect various samples composed of clusters of diffetent size. Nevertheless, for the clarification of several technologically important questions (such as, for instance, the verification of a postulated size effect on the detection capabilities of nanostructured sensors) a strictly monodispersed cluster size may not be necessary. What probably is more important in rendering meaningful such testings, is the uniformity of conditions, other than size differentiation, under which the various comparable nanostructured samples are produced. Obviously, a stringent uniformity of production is assured by the present technique, since all the samples are simultaneously produced under exactly the same conditions.
Size quantification is much more certain in those deposition spots characterized by low coverage because there the limits of the non-overlapping clusters are clearly distinguished, in contradistinction to multilayered depositions where the situation appears more obscure. After sufficient magnification, however, it becomes clear that even in the latter cases, the material ls composed of individual clusters of comparable dimensions, suggesting that the clusters retain their
. integrity, irrespective of monolayered or overlapping depositions. Thediffe~ntsize-selectionbehaviorofnegativeandpositiveclusters,ifnotduetoanartifact
associated with the quality of the respective microgmphs, suggests fundamental differences between clusters of opposite polarity. This may not come as a complete surprise since such differentiations have been already identified on a number of different occasions. Present, as well as previous results suggest, for instance, that neither the size (1,8) nor the structure (10) of positive and negative clusters are exactly the same.
SIZE SELECTION BY CLUSTER DEFLECTON IN AN ELECTRIC FIELO 783
The diRerent size-selection behavior of positive and negative clusters most probably suggests that their velocity distributions are not the same. More specifically, the velocity distribution of positive clusters seems to be much nearly flat, containing a mixture of different velocity components almost irrespective of mass. Otherwise, abetter size separation as a function of deflection displacement should have occurred. Different velocity distributions suggest, in turn, that charged clusters acquire their velocities not only due to the convection of the carrier gas, as is traditionally assumed, but also due to extra interactions which must be polarity dependent, The validation of the above hypothesis or the nature of the postulated polarity-dependent interactions demands and lcertainly deserves further study.
Another question posed by the present data, which probably also demands further study, is the verification of the mechanism causing the very effective size separation observed in the deposition of neutral clusters. It is most reasonable to assume that this is simply due to a mechanical selection, cauc;ed, e.g., by enhanced diffusion or scattering of the lighter clusters, probably assisted by the particullar beam geometry presently used. However, it cannot be completely ruled out that in this size selection a mechanism of a different nature may have contributed; such as, for instance, the deflection of clusters having strong dipole moments at the inhomogeneous fringes of the electric field. Whatever the mechanism, the presence of a bimodal mass distribution also may not be irrelevant with the final outcome. In any event, size selection of neutral clusters in the very satisfactory degree presently observed, if reasonably understood and verified under various experimental conditions may constitute auseful addition to the arsenal of nanotechnological tools.
In conclusion, the results of the present investigation have, on the one hand, triggered a number of interesting questions, some of which remain outstanding, while on the other, provided convincing evidence that a profitable size selection can be achieved merely by electric deflection of negative clusters. The required extra instrumentation, a pair of deflection plates and a dc power supply, is as robust as possible, promising reliable collection of size separated material. Another very important advantage of the deflection method is that it permits the simultaneous deposition of the whole mass range. Thus, not only cluster-beam intensity is not wasted, but most importantly samples composed of various-size clusters can be simultaneously produced under exactly the same conditions, facilitating comparison.
Most probably, the present findings apply directly to all cluster sources producing sponta- neously ionized clusters and to those, in particular, generating a plasma.
ACKNOWLEDGMENT
This research was supported in part by the Greek Ministry of Development under contract #PENED-13fIl and by the Intemafional Atomic Energy Agency, Vienna under contract #9386.
REFERENCES
1. Melinon, P., Paillard, V., Dupuis, V., Perez, A., Jensen, P., Hoareau, A., Perez, J.P., Tuaillon, J., Broyer, M.,ViaIle, J.L., Pellarin,M., Baguenard, B. and Lerme, J.,lnternational Journal ofModern Physics., 1995, B9,339.
2. Ha&land, H., Karrais, M., Mall, M. and Thumer, Y., Journal of Vacuum Science and Technology A, 1992,10,3266.

784 AC XENOULIS, P TSOURS, G DOUKELLIS, N BOUKOS, E VALAMONTES, Y CHEN AND T TSAKALAKOS
3.
4.
5.
6.
7. 8.
9. 10.
Xenoulis, A.C., Trouposkiadis, P., Potiriadis, C., Papastaikoudis, C., Katsanos, A.A. and Clouvas, A., Nanostnrctured Materials, 19967,473. Urban III, F.K., Feng, S.W. and Nainaparampil, J., Journal ofApplied Physics, 1993,74, 1335. Pflaum, R., Sattler, K. and Recknagel, E., 2. Phys. , 1986, Dl, 131. Zimmermann, U., Malinowski, N., Naher, U., Frank, S. and Martin, T.P., Z. Phys., 1994, D3 1,85. Chapman, B., Glow Discharge Pnwesses, John Wiley & Sons, New York, 1982. Siekmann, H.R., Luder, Ch., Faehrmann, J., Lutz, H.O. and Meiwes-Broer, K.H., Z. Phys., 1991, D 20. Urban, J., Sack-Kongehl, H. and Weiss, K., Z. Phys., 1996, D 36,73. Bloomfield, L.A., Geusic,M.E., Freeman, R.R. andBrown, W.L., ChemicalPhysicsLetters, 1985, 121,33.
Related Documents


![A modified cluster-head selection algorithm in …...data transmission [8]. In response to these problems, this paper presents a modified cluster-head selection algorithm based on](https://static.cupdf.com/doc/110x72/5f081b087e708231d4205d43/a-modified-cluster-head-selection-algorithm-in-data-transmission-8-in-response.jpg)


