SIZE, LEVERAGE, AND RISK-TAKING OF FINANCIAL INSTITUTIONS by JUN LU B.A., Zhongnan University of Finance and Economics, l998 M.A., Bowling Green State University, 2006 A thesis submitted to the Faculty of the Graduate School of University of Colorado in partial fulfillment of the requirement for the degree of Doctor of Philosophy Division of Finance 2011

Welcome message from author
This document is posted to help you gain knowledge. Please leave a comment to let me know what you think about it! Share it to your friends and learn new things together.
Transcript

SIZE, LEVERAGE, AND RISK-TAKING OF FINANCIAL INSTITUTIONS
by
JUN LU
B.A., Zhongnan University of Finance and Economics, l998
M.A., Bowling Green State University, 2006
A thesis submitted to the
Faculty of the Graduate School of
University of Colorado in partial fulfillment
of the requirement for the degree of
Doctor of Philosophy
Division of Finance
2011

This thesis entitled: Size, Leverage, and Risk-taking of Financial Institutions
written by Jun Lu has been approved for the Division of Finance
Sanjai Bhagat
Michael Stutzer
Date
The final copy of this thesis has been examined by the signatories, and we Find that both the content and the form meet acceptable presentation standards
Of scholarly work in the above mentioned discipline.
iii
Lu, Jun (Ph.D., Finance)
Size, Leverage, and Risk-taking of Financial Institutions
Thesis directed by Provost Professor of Finance Sanjai Bhagat
We investigate the link between firm size and risk-taking among financial
institutions during the period of 1998—2008 and make four contributions. First,
size is positively correlated with risk-taking measures even when controlling for
other observable firm characteristics, such as market-to-book asset ratio, corporate
governance, and ownership structure. This is consistent with the notion that “too-
big-to-fail” policies distort the risk incentives of financial institutions. Second, a
simple decomposition of the risk measure, the Z-score, reveals that financial firms
engage in excessive risk-taking mainly through leverage. Third, we find that the
recently developed governance variable, measured as the median director dollar
stockholding, has a substantial impact on reducing firms’ risk-taking. Lastly,
investment banks are generally riskier than commercial banks. These findings
suggest that rather than capping the firm size, it is more effective for policymakers
to control a financial firm’s risk-taking by strengthening regulations on capital
requirement; they also provide justification for the functional separation of
investment banking from wholesale financial services. In terms of corporate risk
management policy, these findings suggest that the excessive risk-taking problem
can potentially be attenuated by focusing on the governance structure.

iv
Acknowledgments
I thank my Dissertation Committee members, Sanjai Bhagat, Martin Boileau, Bjorn
Jorgenson, Nathalie Moyen, and Michael Stutzer for their constructive suggestions.
I also benefit greatly from talking with Mattias Kahl and Mattias Nilsson.

v
CONTENTS
CHAPTER
1. INTRODUCTION ....................................................................... 1
2. REVIEW OF THE LITERATURE AND HYPOTHESES DEVELOPMENT ........................................................................ 9
3. SAMPLE COLLECTION AND VARIABLE CONSTRUCTION
Definition of variables ......................................................... 14
Summary of Statistics ......................................................... 19
4. EMPIRICAL ANALYSIS
Baseline regression .............................................................. 31
Robustness check
Endogeneity of firm size ................................................. 42
Time and firm fixed effect .............................................. 48
Decomposition of Z-score ..................................................... 50
5. TBTF FIRMS V.S. NON-TBTF FIRMS
Specification ......................................................................... 64
Results on risk-shift ............................................................ 65
6. POLICY IMPLICATIONS ........................................................ 68 BIBLIOGRAPHY……………………..…………………………………………71 APPENDIX

vi
A. THEORECTICAL OF DEVELOPMENT OF Z-SCORE .......... 77
B. CAPITAL ASSET RATIO ......................................................... 78
C. VARIABLE DEFINITIONS AND DATA SOURCES .............. 79
D. LIST OF FINANCIAL INSTITUTIONS .................................. 80
E. DATA VERIFICATION ............................................................ 84
F. GOVERNANCE INDICES AS EXPLANATORY VARIABLES ..
......................................................................................... 85
G. FIRM SIZE (TOTAL REVENUE) AND RISK-TAKING ......... 88
H. FIRM SIZE (MARKET CAPITALIZATION) AND RISK-TAKING
......................................................................................... 89
I. FIRM SIZE (FOR FIRMS WITH TOTAL ASSETS LESS THAN 10
BILLION DOLLARS ONLY) AND RISK-TAKING .............. 90
J. FIRM SIZE AND RISK-TAKING, SEPERATED FOR
COMMERCIAL BANKS, INVESTMENT BANKS AND LIFE
INSURANCE .......................................................................... 91
K. CHANGE IN CAR AROUND BASEL II ACCORD ................. 95
L. TWO-STAGE LEAST SQUARE IV REGRESSION FOR
COMMERCIAL BANKS ONLY ............................................. 96
M. FIXED EFFECTS: TWO PERIODS ......................................... 97
N. FIXED EFFECTS: FOUR PERIODS ....................................... 98
O. CROSS-SECTIONAL REGRESSION USING QUARTERLY DATA
FROM 2005—2008 ................................................................. 99

vii
P. DECOMPOSITION OF Z-SCORE USING QUARTERLY DATA
FROM 2005—2008 ............................................................... 101
Q. DIFFERENCES-IN-DIFFERENCES MODEL ...................... 103
viii
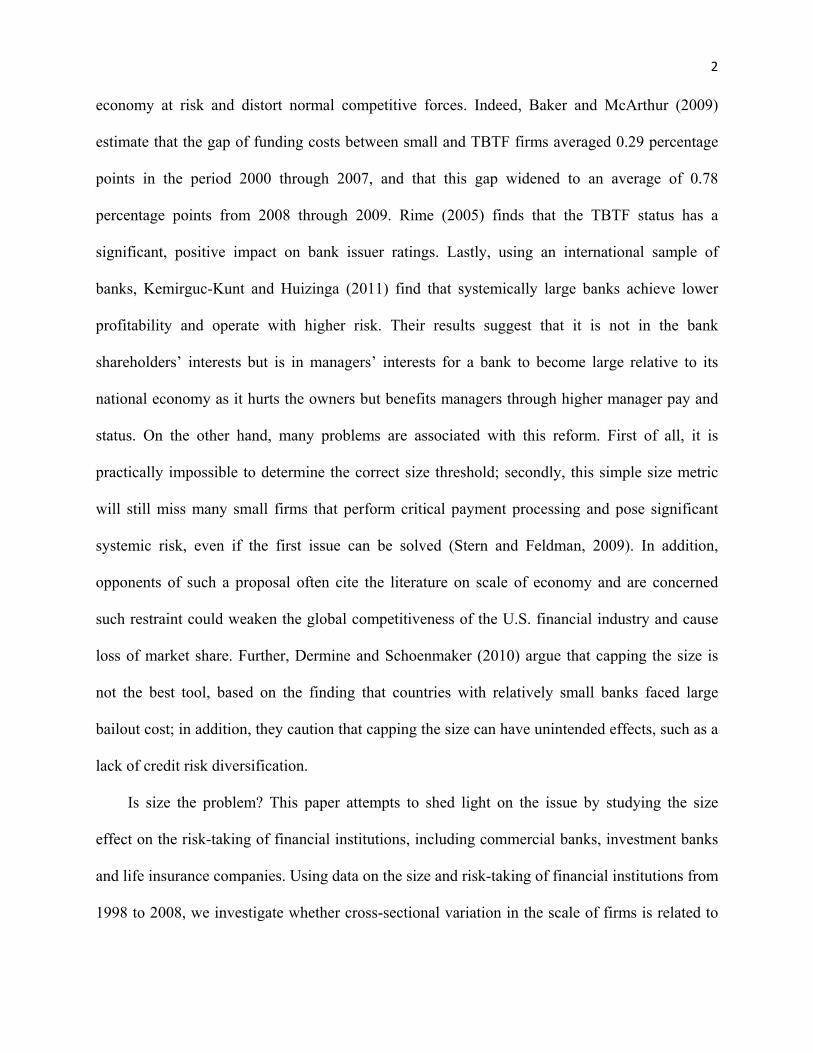
TABLES
Table I. Comparison of this research with existing literature ..................... 7 II. Summary statistics ........................................................................ 21 III. Correlation matrix of main regression variables .......................... 30 IV. Firm size (total asset) and risk-taking .......................................... 35 V. Alternative risk measures .............................................................. 39 VI. Comparison of Delaware and non-Delaware firms ....................... 43 VII. Two-stage Least Square (2SLS) IV regression of firm size on risk-taking ................................................................................................... 47 VIII. Fixed effect model ........................................................................... 50 IX. Decomposition of Z-score ................................................................ 57 X. Risk-shifting ................................................................................... 67

ix
FIGURES
Figure 1. Histogram of firm size .................................................................... 28 2. Plot of leverage versus squared-residuals ..................................... 33
3. Empirical distribution of firm size by non-Delaware firms and Delaware firms ........................................................................................... 44
4. Time series of capital asset ratio and return on asset for periods: 1998—
2008 and 2006—2008 ................................................................ 52
1
CHAPTER 1
Introduction
“Too-big-to-fail policies offer systemically important firms the explicit or implicit promise of a bailout when things go wrong. These policies are destructive, for several reasons. First, because the possibility of a bailout means a firm’s stakeholders claim all the profits but only some of the losses, financial firms that might receive government support have an incentive to take extra risk. The firm’s shareholders, creditors, employees, and management all share the temptation. The result is an increase in the risks borne by society as a whole.”
———— The Squam Lake Report: Fixing the Financial System
Too-big-to-fail (TBTF) is a concept that governments have to bail out a failing financial
institution (FI) because its failure may present a threat to the proper functioning of the financial
intermediation process and cause severe disruption to the economy. When firms are perceived
TBTF, they may have a propensity to assume excessive risks to profit in the short term. Indeed,
TBTF policy has been blamed by many, including the Obama administration, as one of the main
factors causing distortion in financial firms’ risk-taking incentives, which played a pivotal role in
the recent financial crisis. The risk distortion resulting from TBTF policies are often referred to
as the “moral hazard” problem in the finance literature.1
In turn, policy makers propose an array of regulations to reshape financial institutions.
Specifically designed to address the TBTF issue, suggestions such as limiting the size of
financial institutions have been proposed by the Obama administration along with academics.2
The reason for dealing with size directly is that the regulators believe that the larger the firm is,
the more likely it is systematically important or TBTF.3 On the one hand, proponents of such a
proposal argue that it will deter financial firms from becoming so large that they put the broader
1See Boyd, Jagannathan and Kwak (2009) for a detailed description of this problem 2 See, for example, “Proposal Set to Curb Bank Giants”, Wall Street Journal, January 21, 2010, A2. Boyd, Jagannathan and Kwak (2009) and Walter (2009) also propose size limits on firms. 3 We use the term TBTF and systematically important interchangeably hereafter.
2
economy at risk and distort normal competitive forces. Indeed, Baker and McArthur (2009)
estimate that the gap of funding costs between small and TBTF firms averaged 0.29 percentage
points in the period 2000 through 2007, and that this gap widened to an average of 0.78
percentage points from 2008 through 2009. Rime (2005) finds that the TBTF status has a
significant, positive impact on bank issuer ratings. Lastly, using an international sample of
banks, Kemirguc-Kunt and Huizinga (2011) find that systemically large banks achieve lower
profitability and operate with higher risk. Their results suggest that it is not in the bank
shareholders’ interests but is in managers’ interests for a bank to become large relative to its
national economy as it hurts the owners but benefits managers through higher manager pay and
status. On the other hand, many problems are associated with this reform. First of all, it is
practically impossible to determine the correct size threshold; secondly, this simple size metric
will still miss many small firms that perform critical payment processing and pose significant
systemic risk, even if the first issue can be solved (Stern and Feldman, 2009). In addition,
opponents of such a proposal often cite the literature on scale of economy and are concerned
such restraint could weaken the global competitiveness of the U.S. financial industry and cause
loss of market share. Further, Dermine and Schoenmaker (2010) argue that capping the size is
not the best tool, based on the finding that countries with relatively small banks faced large
bailout cost; in addition, they caution that capping the size can have unintended effects, such as a
lack of credit risk diversification.
Is size the problem? This paper attempts to shed light on the issue by studying the size
effect on the risk-taking of financial institutions, including commercial banks, investment banks
and life insurance companies. Using data on the size and risk-taking of financial institutions from
1998 to 2008, we investigate whether cross-sectional variation in the scale of firms is related to

3
heterogeneity in risk-taking. Our measures of risk-taking are comprehensive. They include a
model-based measure such as the Z-score 4 , a market-based measure that captures market’s
perception about firms’ risk-taking such as volatility of stock return, and an accounting-based
measure that such as write-downs.5 We focus primarily on Z-score; the other risk measures serve
as a robustness check. Our baseline analysis is to regress the Z-score on firm size along with
other firm characteristics.
If size does affect risk-taking as measured by Z-score, then an interesting question is, how
does size affect the components of Z-score? This question is interesting because if we can find
out what factors might drive the relation between firm size and risk-taking, we can target the
risk-taking problem of financial institutions more directly. We argue that if limiting the size
focuses on exclusively the normative aspects of the issue of risk-taking, then the factor analysis
would address the positive aspects of the problem. We answer this question by regressing each of
the components of Z-score on firm size and other firm characteristics.
Motivated by proposals that would treat TBTF firms differently. 6 we also investigate
whether TBTF firms behave differently from small firms as a natural extension to our baseline
analysis. We first define firms as TBTF when they pass a commonly-agreed size threshold (for
example, $10 billion in assets), then interact the TBTF firm dummy with size. We establish the
following findings. First, firm size is positively correlated with risk-taking, even when
controlling for observable firm characteristics such as market-to-book ratio and ownership
4 Z‐score measures the distance to default and a higher Z‐score implies more stability. It is calculated as the sum of return on asset and capital asset ratio divided by volatility of asset return. Theoretic development of this variable from Boyd and Runkle (1993) is attached in Appendix A. Z‐score has been used extensively as a measure of bank risk recently; see, for example, Boyd, De Nicolo, and Jalal (2006); Laeven and Levine ( 2009); Houston, et al (2010); Beltratti and Stulz (2010). 5 See Chesney, Stromberg and Wagner (2010) for a description of this variable. 6 For example, the Obama administration proposes using tax policy to punish large banks based on their exposure to risk. See “White House’s Tax Proposal Targets Big Banks’ Risks”, Wall Street Journal, January 14, 2010.
4
structure, which are believed have an effect on risk-taking. For instance, a one-standard deviation
increase in size will decrease Z-score by 4 points, which is sufficient to make a capital-
constrained firm fail. To ensure that that our result is not contaminated by the issue of
endogeneity, as prominent in the corporate finance research, we apply the identification strategy
of instrumental variable, where we instrument our endogenous variable, firm size, with the
dummy variable for whether a firm is incorporated in Delaware. To further rule out the
possibility that our result is driven by any firm-specific unobservable effect, we employ the firm
fixed-effect model. We show that our result holds when these additional concerns are taken into
consideration.
The analysis of decomposing Z-score reveals that firm size has a significant, negative
impact on capital asset ratio but not on return on asset or earnings volatility. These findings
suggest that financial firms engage in excessive risk-taking mainly through increased leverage.
On the other hand, they also suggest that economy of scale does not exist, which is consistent
with existing literature. Regressions with volatility of stock return as a dependent variable
indicate that size-related diversification may not exist in the financial sector since size is
positively associated with return volatility.
Second, we find that the newly developed corporate governance measure, calculated as
median director dollar stockholding, is negatively associated with risk-taking for all risk
measures, and they are significant at a 1% level across all specifications and estimations. Lastly,
we find that investment banks, but not insurance companies, engage in more risk-taking
compared to commercial banks. However, this result is not driven by leverage since investment
banks on average are less leveraged than commercial banks.

5
While there is a substantial literature that examines the risk-taking behavior of financial
institutions (see Saunders, Strock and Travlos, 1990; Demsetz, Saidenberg and Strahan, 1997;
Stiroh, 2006; Laeven and Levine, 2009; Houston et al, 2010; and Demirguc-Kunt and Huizinga,
2011), to our knowledge, we are the first to study comprehensively the relation between size and
risk-taking of financial institutions (see Table I for a detailed comparison of this study with
existing literature on the risk-taking of financial institutions). The gap is surprising because the
TBTF phenomenon is not new,7 and one might think this question would have been settled a
long time ago. While Boyd and Runkle (1993) is the closest to this study, there are significant
differences. First, the motivation is different. Their study is motivated by two theories related to
banking firms – deposit insurance and modern intermediation theory – while ours is motivated
by the political debate about capping the financial firm’s size. Secondly, the scope of their study
is limited by focusing on only large bank holding companies (BHCs), while our sample includes
commercial banks, investment banks and insurance companies, and they have a large variation in
size. We argue that, since the recent financial crisis was not caused by bank holding companies
alone, excluding these important components will not provide a complete picture about risk-
taking in the financial industry. Lastly, the inference of Boyd and Runkle (1993) is also limited
because in their empirical test, the only explanatory variable is size, which is more like a
univariate analysis. Ours, on the other hand, includes covariates which in theory might affect
firm’s risk-taking. Another paper which is close to ours is Demsetz and Strahan (1997), who
provide evidence that diversification and size are highly correlated in BHCs. Since BHC size is
not correlated with stock return variance in many years of their sample period, they conclude that
7 The existence of TBTF policy was first admitted by federal government in 1984 when the Comptroller of the Currency contributed roughly $1 billion to save Continental Illinois Bank from default. See Morgan and Stiroh (2005).

6
size-related diversification does not translate into reductions in risk. In their regression analysis,
however, they find that firm size has a significant effect in reducing firm-specific risk.
.

Table I Comparison of this research with existing literature
Study Sample period &size Data source & screens Dependent Variable (risk) Firm Size Sign Variable of interest Other independent variables
Sauders, Strock and 1978-1985 Call Report Standard deviation of dairly Total asset + Insider ownership Insider ownership Travlos (1990) 38 Bank holding company only stock return Capital asset ratio
Operating leverage Boyd and Runkle 1971-1990 Annual COMPUSTAT data Z-score Log of total asset - Size (1993) 122 Bank holding company only Standard deviation of ROA
Total asset >$1 billion Equity/asset Require 5 consecutive years
Demsetz and 1980-1993 Bank holding companies only Firm-specific risk (σ(ε)) Log of total asset -*** Size Capital asset ratio squared Strahan (1997) 134 Y-9C Report & CRSP Loan characteristics
Trading weekds >30 De Nicolo (2000) 1988-1998 Worldscope Z-score Log of total asset -** Size Asset growth rate
419 Bank holding company only Volatility of ROA Require at least 3 year data Equity asset ratio
ROA Boyd, De Nicolo June, 2003 Small banks Z-score Log of total asset -*** Bank competition Bank Competition and Al Jalal (2006) 2500 Operate only in rural non- Equity asset ratio Country controls
Metropolitan Statistical Areas Stiroh (2006) 1997-2004 Y-9C Standard deviation of weekly Log of asset -*** Log of equity asset ratio
400 Bank holding companies only stock return Loan & income controls Laeven and Levine 1996-2001 Bankscope&Bankers Almanac Z-score Log of total asset -* Cash flow right Cash flow right (2009) 270 10 largest public banks in each Country controls
country Houston et al (2010) 2000-2007 BankScope Z-score Log of total asset +*** Creditor right Log of total asset square
2400 Banks only ROA Credit rights Cross-country study Capital asset ratio Country controls
Volatility of ROA This Paper 1998-2008 Compustat & Proxy statement Z-score Log of total asset -** Size Market to book
302 Commercial bank, investmnet Write-down Log of total avenue Governance Corporate governance bank and insurance Volatility of stock return CEO ownership
Industry controls
7
8
Our paper builds on the literature related to economy of scale. Berger and Mester (1997)
estimate banking returns to scale using a U.S. bank sample for the 1990s to find an optimal
banking size of around $25 billion in assets. Hughes and Mester (1997) find that banks of all
sizes enjoy significant scale economy when financial capital is considered as a mechanism for
signaling risk to less informed investors, and that bank managers are assumed risk-averse. They
argue that scale economy exists because as banks grow larger, they are able to economize on the
use of financial capital, and the cost of signaling risk decreases. In line with this, Hughes,
Mester, and Moon (2001) offer evidence that scale economies so often cited by merging banks
do, indeed exist, but are elusive. They argue this is because these scale economies are influenced
by banks’ risk-taking and can, in fact, be obscured by risk-taking.
Our study also contributes to the broader literature on governance (see Gompers, Ishii and
Metrick, 2003; Bebchuk, Cohen and Ferrell, 2009; and Brown and Caylor, 2006) by
incorporating a new measure of corporate governance, namely, the median director dollar
stockholding (see Bhagat and Bolton, 2008) and by offering empirical evidence that the new
measure has a significant impact in reducing the risk-taking of financial institutions.
Our analysis is crucial from a public policy perspective because the risk-taking behavior of
financial institutions affects financial and economic fragility, business cycle fluctuations, and
economic growth (see Bernanke, 1983, Calomiris and Mason, 1997, 2003a, b, and Keely, 1990).
Our findings have important policy implications that are particularly relevant today, as the calls
for strict restrictions and reinforcement of corporate governance on financial sector accelerate.8
First, they suggest that instead of capping the firm size, it is more effective for regulators to
strengthen and enhance regulations on capital requirements for all FIs. Secondly, our finding on
8 See The Art and Science of Risk Management, 2009 Federal Reserve Bank of Chicago Annual Report.

9
corporate governance indicates that median director dollar stockholding can be used as an
effective internal corporate risk control mechanism. Our last finding provides justification for the
functional separation of investment banking from wholesale financial services, as pointed out by
Walter (2009).
The paper is organized as follows. In Chapter 2, we review the existing literature and
develop the hypotheses. Chapter 3 summarizes the data. Chapter 4 presents core results. Chapter
5 compares the marginal effect of size on risk-taking between TBTF firms and non-TBTF firms.
Chapter 6 concludes with policy implications.
CHAPTER 2
Literature review and hypotheses development
The recent financial crisis has generated tremendous interest in the study of risk-taking of
financial institutions (FIs). A variety of issues have been considered by researchers. For instance,
in a cross county study, Laeven and Levine (2009) analyze the relation between bank risk-taking,
bank governance (measured by cash flow rights), and national bank regulations. Specifically,
they investigate how governance and national regulations jointly shape the risk-taking behavior
of individual banks. Based on a sample of the largest 279 banks in 48 countries, they find that
cash flow right plays a critical role in shaping banks’ risk-taking to the extent that the actual sign
of the effect of regulation on risk varies with ownership concentration. Beltratti and Stulz (2010)
exploit variation in the cross-section of performance of large banks across the world during the
period of the financial turmoil. They document that banks with dispersed ownership have lower
idiosyncratic risk, and that banks with more non-interest income are associated with higher
idiosyncratic risk. Based on a U.S. sample of FIs, Cheng, Hong and Scheinkman (2010)
investigate whether compensation structure contributes to excessive risk-taking. They find that

10
risk-taking, measured as firm beta, return volatility, etc., are correlated with short-term pay such
as options and options. Their main result suggests that, besides the greediness of management,
investors’ short-termism may also have contributed to the crisis by encouraging management to
engage in excessive risk-taking. In a similar context, Balachandran, Kogut, and Harnal (2010)
find that equity-based pay such as restricted stock and options increases the probability of default
of financial institutions, while non-equity pay such as cash bonuses decreases it. Lastly, Bolton,
Mehran, and Shapiro (2010) propose addressing the excessive risk-taking by tying executive
compensation to both stock and debt prices.
We focus on size-related risk distortion in this study; we construct a few hypotheses drawn
from the moral hazard and risk-taking literature. This first is the view of moral hazard in
financial firms due to the TBTF policies. Moral hazard is a concept that refers to the distortion of
incentives caused by insurance; it occurs when a party insulated from risk may behave
differently than it would if it were fully exposed to the risk. In banking, this distortion of
behavior may happen for a variety of reasons, such as protection of bank creditors provided by
the Discount Window, Deposit Insurance, and especially the TBTF policy. With the government
safety net in place, the downside risks of FIs are limited: TBTF firms know they will be bailed
out by passing their losses to the government and taxpayers when their bets go sour while
keeping all the profits when gambles succeed. Since firm size is positively correlated with the
likelihood of being TBTF, it follows that, as firms become larger, they are more likely to engage
in excessive risk-taking. This strand of literature includes Boyd and Runkle (1993), Boyd,
Jagannathan and Kwak (2009), and Walter (2009), to name just a few.
The role of corporate governance in coping with risk is not obvious. Standard theory on
corporate governance predicts that firms with better governance increase firm value by adopting

11
projects with positive net present value (NPV).9 However, it does not preclude the possibility of
projects with risky cash flows. Therefore, it might be in the interest of shareholders to take risky
projects as long as they are value-enhancing. In addition, option theory (Black and Scholes,
1973) tells us that, all else being equal, the value of option increases with volatility of the
underlying asset. Since a company’s shareholders are essentially holding a European call option
with the total value of the company as the underlying asset, and the value of debt as the striking
price (assuming the firm has risky debt), it follows that the more volatile the company’s cash
flow is, the more valuable the call option is. Thus, the value of common stock increases. Based
on these arguments, we would expect a positive association between corporate governance and
risk-taking.
This relation, however, can go in the opposite direction. As Rajan (2006) and Diamond and
Rajan (2009) pointed out, the compensation structure is different in the finance industry in that
the performance of CEOs is evaluated based in part on the earnings they generate relative to their
peers. With this pressure, executives have incentives to take excessive risk to profit in the short
run even if they are not truly value-maximizing — a term coined “short-termism” in banking
literature (see Cheng, Hong, and Scheinkman, 2010). As noted in Diamond and Rajan (2009),
“even if managers recognize that this type of strategy is not truly value-creating, a desire to
pump up their stock prices and their personal reputations may nevertheless make it the most
attractive option for them”(p.607). If these researchers are right, we would expect FIs with better
governance to have set incentives and controls to avoid taking risks that did not benefit
shareholders. Thus, we should see a negative relation between corporate governance and risk-
9 Gompers, Ishii and Metrick (2003) provide evidence that firms with better governance have higher firm value; Bhagat and Bolton (2008) have similar findings.
12
taking.10 We argue that Diamond and Rajan (2009) is more relevant to our study since it is
specifically tailored to financial institutions; we expect a negative association between corporate
governance and risk-taking.
The third hypothesis is based on the fact that commercial banks and insurance companies
have relatively stricter regulations compared to investment banks, so we expect the risk-taking of
commercial banks and insurance companies to be more constrained. The last one is motivated by
the proposed differential treatment of big vs. small firms, and it extends the first hypothesis and
argues that firms in different size cohorts behave differently. These hypotheses are summarized
as the following:
H1. On average, bigger FIs are riskier than small FIs. The exact size beyond which government
will bail out the troubled firm is unknown, but generally we expect the likelihood of government
rescue is bigger for large FIs than for small FIs.
H2. The effect of corporate governance on firm risk-taking is negative.
H3. Investment banks are riskier than commercial banks are.
H4. Conditional on whether a FI is TBTF firm, the marginal effect of size on risk is higher for
systemic important firms than non-systemic firms.
CHAPTER 3
Sample collection and variable construction
Our main sources of data are Compustat, the Center for Research in Security Prices (CRSP),
RiskMetrics, and Bloomberg supplemented by hand-collected data from companies’ SEC filings
10 Indeed, as argued by John, Litov, and Yeung (2008), the relationship between corporate governance and risk‐taking could be either positive or negative.

13
on EDGAR. We define financial industry as all financial institutions consisting of commercial
banks, investment banks, and life insurance companies,11 as classified by their 4-digit standard
industrial classification (SIC). Specifically, firms with the 4-digit SIC codes of 6020, 6211 and
6311 are identified as commercial banks, investment banks and life insurance companies,
respectively. 12 We use this narrower classification on the grounds that it greatly reduces
unobservable heterogeneity among firms within each category, thus it alleviates omitted variable
bias and enhances comparability.
The starting point for the sample selection is the Compustat, where we collect annual
accounting data on all U.S. commercial banks, investment banks and life insurance. Our sample
spans the period 1998—2008. Following Boyd and Runkle (1993) and John, Litov and Yeung
(2008), we require that firms have at least five years of data on key accounting variables over the
period to be included in the sample. This process yields an initial sample of 687 unique financial
institutions or an unbalanced panel of 6180 firm-year observations, comprising 587 commercial
banks, 59 investment banks, and 41 life insurance companies.
Our study requires governance and CEO ownership data. This data is available through
RiskMetrics. However, RiskMetrics only provides data for S&P 1500 companies, which includes
around 10% of financial firms. After matching our initial sample with this database, we lost the
majority of our observations. For this reason, we hand-collected data on governance and
ownership from each company’s proxy statement. However, extracting data on all 687 firms is
labor intensive, so we limit our investigation to a random sample of 250 commercial banks,
while keeping all the investment banks and life insurance companies from the original sample.
11 We would like to include mortgage companies such as Fannie Mae and Freddie Mac in our sample, but the observations for these firms are too small to make a reliable inference. 12 This classification is similar to Cheng, Hong and Scheinkman (2010)

14
The advantage of the sampling process is that it avoids the estimation problem of selection on
observables (size) since firms in the S&P 1500 are relatively large. We then match this random
sample to CRSP to retrieve the stock return data in order to calculate stock return volatility.
We use accounting write-down as one of our risk-taking measures. The description of write-
down is provided in the following section. We obtain most of this data from companies’ 10-K
and 10-Q during the years 2007 and 2008 while the rest comes from Bloomberg13 using the
WDCI function. To be consistent with Bloomberg, we search each company’s filings using key
words such as write-down/off, provision for credit losses, charge-off, impairments, and so on.
Our final sample has a total of 302 observations with available data, consisting of 238
commercial banks, 38 investment banks and 26 life insurance companies. In our sample,
insurance companies include firms such as AIG, Prudential Financial Inc, and Lincoln National
Corp, while investment banks include Bear Stearns, Lehman Brothers, and Goldman Sachs.
A. Definition of variables
A1. Risk-taking
Our primary measure for firm risk-taking is the Z-score, which equals the average return on
assets (ROA) plus the capital asset ratio (CAR) divided by the standard deviation of asset returns
(σ(ROA)) (see Appendix A for the theoretical development of variable).
In banking, the definition of capital is different from non-banking firms and it varies
depending on the level of reliability as a cushion against losses and financial distress. According
to Basel I Accord, for example, Tier 1 capital consists primarily of common stock and retained
13 Bloomberg started to collect write‐down data for financial institutions from the 3rd quarter of 2007. While companies did take write‐downs in the 1st and 2nd quarters of 2007, the magnitude is relatively small.

15
earnings, while Tier 2 capital is composed of supplementary capital, which is categorized as
undisclosed reserves, revaluation reserves, general provisions, hybrid instruments and
subordinated term debt14. In this research, we calculate CAR as total asset minus total liability
divided by total asset, following Laeven and Levine (2009), Houston et al (2010), Balachandran,
Kogut and Harnal (2010), and Vyas (2011).
Z-score has been widely used in the recent literature as a measure of bank risk. The Z-score
measures the distance from insolvency. A higher value of Z-score indicates more stability. Since
the Z-score is highly skewed, we follow Laeven and Levine (2009) and Houston et al (2010), and
use the natural logarithm of the Z-score as the risk measure. However, the problem with this
transformation is that it is not defined when you have non-positive Z-scores, which renders some
loss of observations. Due to this reason, we rely on raw Z-score as our primary measure for risk-
taking while taking into account the skewness of the distribution as we perform the regression
analysis, and use the logarithm of Z-score as a robustness check. We use the sample to estimate
the population average ROA and σ(ROA). Specifically, ROA and CAR are calculated as the
average over 1998—2008 using annual data, and σ(ROA) is the standard deviation of annual
ROA over 1998—2008.
As a robustness check, we incorporate additional risk-taking measures including market
betas, a measure that captures a firm’s non-diversifiable risk, accounting based write-downs15
that reflect a CEO’s risk-taking incentives, and the standard deviation of annual stock return
which indicates the market’s perception about firms’ risk-taking. For each firm, we calculate
market beta as the average CAPM betas for 60-month rolling regressions over the sample period.
14 See http://www.bis.org/publ/bcbsc111.pdf?noframes=1 for source and Appendix B for illustration. 15 See Chesney, Stromberg and Wagner (2010) for a detailed description about the advantages and disadvantages of this variable.

16
As for write-down, we follow Vyas (2011) and define it as net credit losses recognized by
financial institutions through accounting treatments, which include fair value adjustments,
impairment charges, loan loss provisions, and charge-offs. We focus on total write-downs that
occurred during the commonly-agreed crisis period of 2007 and 2008 because it is this period
that exposes the investments undertaken by banks in prior years to the bad state of the world. For
equity volatility, we use both annual and monthly stock return data.
To gain insights about which component of the Z-score is principally driving the
relationship between the independent variables (e.g., size, ownership, and corporate governance)
and Z-score, we use the three components of Z-score (i.e., ROA, CAR, and σ(ROA)) as separate
dependent variables.
A2. Firm size
The potential candidates for measuring firm size include accounting-based measures such as
total asset and total revenue, and market based measures such as market capitalization. We prefer
total asset and total revenue to market capitalization because previous literature argues these two
accounting measures are less noisy as a proxy for the “scale” of the firm than market measure
(see Baker and Hall, 2004).16 Following the existing literature, we focus primarily on total asset
and use total revenue as a robustness check. We apply logarithm transformation on both the
average total asset and average total revenue over the sample period 1998—2008. We expect the
effect of this variable on risk taking to be positive.
A3. Corporate governance
16Nevertheless, we also tried total market capitalization as measure for firm size in an unreported regression. The results are qualitatively the same as our primary size measures, and are available from the authors upon request.

17
The commonly used governance measures are G-index (Gompers, Ishii, and Metrick, 2003),
E-index (Bebchuk, Cohen, and Ferrell, 2004), and Gov-Score (Brown and Caylor, 2006).
Though these governance indices are widely used in empirical research, such use has both
strengths and weaknesses. In particular, recent studies (e.g., Bhagat, Bolton, and Romano, 2008;
Bhagat, and Bolton, 2008) have questioned whether governance indices measure the right
governance attributes. As such, we employ a new measure of corporate governance – the median
director dollar stockholding – developed by Bhagat and Bolton (2008). The advantage of this
measure is that it is simple, intuitive, less prone to measurement errors and can enhance the
comparability of research findings.17 As mentioned earlier, RiskMetrics provide limited data on
financial firms (123 out of 302 observations), so we supplement it by hand-collecting director
ownership information, as of the last year in our sample period, from companies’ proxy
statements. We then calculate the natural logarithm of median director dollar stockholding by
matching this data to stock price information obtained from CRSP.
A4. CEO stock ownership
Following Bhagat and Bolton (2008), we use CEO ownership as our measure for bank
ownership structure. Like the governance variable, we hand-collect CEO ownership data in
addition to the data provided by RiskMetrics, as of the last year in our sample period, from
companies’ proxy statement. Since ownership patterns tend to be relatively stable over time, we
do not view this as a serious shortcoming.
Risk-averse managers, whose employment income is tied to changes in firm value, have
incentives to take on less than optimal firm risk to protect their firm-specific human capital. This
17 See Bhagat and Bolton (2008) for a detailed description and Bhagat and Bolton (2010) for the strength about this variable.

18
is an agency problem in essence as described in Jensen and Meckling (1976), Amihud and Lev
(1981), and Smith and Stulz (1985). However, ownership by managers may be used to induce
them to act in a manner that is consistent with the interest of shareholders. Thus, we would
expect to see a positive relation between CEO ownership and risk-taking.
Researchers have documented the impact of ownership structure on firm risk-taking. For
instance, analyzing nonfinancial firms, Agrawal and Mandelker (1987) find a positive relation
between security holdings of managers and the changes in firm variance, while John, Litov, and
Yeung (2008) find that managers enjoying large private benefits of control select suboptimally
conservative investment strategies. Saunders, Strock, and Travlos (1990) find the stockholder
controlled banks exhibit higher risk taking behavior than managerially controlled banks. A recent
study by Laeven and Levine (2009) considers the potential conflicts between managers and
owners and analyzes the relations between the risk-taking of banks, their ownership structures,
and bank regulations. They find that bank risk is generally higher in banks that have controlling
shareholders.
A5. Market-to-book ratio
Market-to-book asset ratio, has been identified an important risk factor in the asset pricing
literature. For instance, Fama and French (1992) point out that firms with high ratios of book-to-
market value (or low market-to-book) are more likely to be in financial distress. We compute this
variable by averaging each firm’s year-end market-to-book asset ratio over the sample period.
In the banking literature, this variable has often been used as a proxy for bank charter value
(see Demsetz, Saindenberg and Strahan 1997; Goyal 2005). A charter has value because of
barriers to entry into the industry and usually it is defined as the discounted stream of future

19
profits that a bank is expected to earn from its access to protected markets.18 Since loss of charter
imposes substantial costs, it is argued that charter value can incentivize banks to adopt prudent
decision-making——the so-called charter-value hypothesis (see Keeley, 1990; Carletti and
Hartmann, 2003). Empirical models of bank risk have focused on this disciplinary role of charter
value. Based on a sample of 367 bank holding companies from 1991—1995, for instance,
Demsetz, Saidenberg and Strahan (1997) found that charter value is negatively associated with
bank risk-taking. Galloway, Lee and Roden (1997) also found that banks with low charter value
assumed significantly more risk.
A6. Other controls
We use average annual return on asset as a control for firms’ profitability and debt/asset
ratio as a control for firms’ leverage. We expect a negative association between profitability and
risk-taking, and positive association between risk-taking and leverage. In addition, we use firm
age to control for firm experience, and we expect that experienced firms are better at handling
risk than less-experienced firms, ceteris paribus.
B. Summary statistics
Table II presents the summary statistics for all key variables. The variable definitions and
the data sources are described in Appendix C. In this table, I also separate the sample into three
subsamples according to their classification for easy comparison. Summary statistics in Table II
shows that the Z-score has a mean of 34 and a standard deviation of 31. This fairly high standard
deviation and the wide range in Z-scores suggest a considerable cross-sectional variation in the
level of firm risk. Further, since the average Z-score is greater than its median, we know it has a
18 See Hellmann, Murdock, and Stiglitz (2000) for a description of this variable.

20
right-skewed distribution. Also noticeable is that investment banks have the lowest average Z-
score followed by commercial banks, and insurance companies have the highest Z-score. Since
higher Z-score means more stability, it seems that investment banks are riskier than their peers,
which holds up to our initial conjecture (this is later confirmed in our regression analysis).

21
Table II Summary statistics. This table reports summary statistics of the main regression variables for all financial institutions (Panel A), commercial banks (Panel B), investment banks (Panel C) and life insurance (Panel D). SIC codes 6020, 6211 and 6311 are used to define commercial banks, investment banks and life insurance, respectively. Sample consists of 258 commercial banks, 38 investment banks and 26 life insurance companies. Statistics based on average annual data over 1998-2008, unless otherwise indicated. Z-score is firm’s return on assets plus the capital asset ratio divided by the standard deviation of asset return over period 1998-2008. σ(ROA) is the volatility of the firm’s return on assets over the period 1998-2008. Equity volatility is standard deviation of annual stock return over 1998-2008. Size is the book total asset (millions). Market-to-book is calculated as market value of equity plus book value of debt divided by book total asset. ROA is the return on asset. Leverage is the debt asset ratio. Director ownership ($) is median director dollar stockholding as of the last year in our sample period (thousands). Director ownership (%) is median director percentage stockholding as of the last year in our sample period. CEO ownership (%) is percentage of CEO stock ownership as of the last year in our sample period. Firm age is proxied by the difference between 2008 and the year that the firm first appears in Compustat monthly stock return database.
Panel A: all financial institutions variable mean median Standard Deviation min max N Z‐score 34.08 25.29 30.82 ‐0.29 203.14 302 ln(Z‐score) 3.10 3.24 1.08 ‐4.09 5.28 300 σ(ROA) 0.02 0.00 0.07 0.00 0.61 302 equity volatility 0.36 0.30 0.25 0.08 2.30 302 size 32,777 2,240 116,119 12 1,027,891 302 ln(size) 7.98 7.71 2.11 2.50 13.84 302 CAR 0.13 0.09 0.14 0.03 0.86 302 market‐to‐book 1.16 1.07 0.43 0.76 4.76 302 ROA 0.01 0.01 0.05 ‐0.41 0.56 302 leverage 0.87 0.91 0.14 0.14 0.97 302 director ownership ($) 1,626 891 2,205 11 14,364 300 ln(director ownership) 13.63 13.70 1.24 9.28 16.48 300 director ownership (%) 0.01 0.00 0.01 0.00 0.05 302 CEO ownership (%) 0.04 0.01 0.10 0.00 0.89 302 firm age 19.01 15.00 11.59 2.00 46.00 302
Panel B: commercial banks variable mean median Standard Deviation min max N Z‐score 38.30 30.70 32.12 2.00 203.14 238 ln(Z‐score) 3.28 3.42 0.94 0.69 5.28 238 σ(ROA) 0.01 0.00 0.01 0.00 0.07 238 equity volatility 0.31 0.29 0.14 0.08 0.92 238 size 24,352 2,112 104,774 79 1,027,891 238 ln(size) 7.92 7.66 1.83 4.37 13.84 238 CAR 0.09 0.09 0.02 0.05 0.23 238 market‐to‐book 1.08 1.07 0.06 0.98 1.48 238 ROA 0.01 0.01 0.01 ‐0.03 0.04 238 leverage 0.91 0.91 0.02 0.77 0.95 238 director ownership ($) 1,721 929 2,254 11 14,364 238 ln(director ownership) 13.74 13.74 1.16 9.28 16.48 238 director ownership (%) 0.01 0.00 0.01 0.00 0.05 238 CEO ownership (%) 0.03 0.01 0.06 0.00 0.53 238 firm age 19.63 15.50 11.38 2.00 46.00 238

22
Table II. (continued)
Penal C: investment banks variable mean median Standard Deviation min max N Z‐score 10.21 8.35 9.04 ‐0.29 39.66 38 ln(Z‐score) 1.90 2.15 1.36 ‐4.09 3.68 36 σ(ROA) 0.12 0.06 0.16 0.00 0.61 38 equity volatility 0.67 0.46 0.50 0.23 2.30 38 size 52,361 689 146,691 12 656,829 38 ln(size) 7.21 6.53 2.95 2.50 13.40 38 CAR 0.37 0.34 0.28 0.03 0.86 38 market‐to‐book 1.73 1.26 1.03 0.76 4.76 38 ROA ‐0.01 0.01 0.15 ‐0.41 0.56 38 leverage 0.63 0.66 0.28 0.14 0.97 38 director ownership ($) 1,174 626 1,626 29 9,069 38 ln(director ownership) 13.23 13.35 1.34 10.29 16.02 38 director ownership (%) 0.00 0.00 0.00 0.00 0.02 38 CEO ownership (%) 0.14 0.03 0.23 0.00 0.89 38 firm age 14.68 11.50 10.00 2.00 44.00 38
Panel D: life insurance variable mean median Standard Deviation min max N Z‐score 30.28 24.71 22.08 2.94 96.98 26 ln(Z‐score) 3.18 3.21 0.73 1.08 4.57 26 σ(ROA) 0.01 0.00 0.01 0.00 0.04 26 equity volatility 0.32 0.31 0.11 0.11 0.64 26 size 81,275 15,824 150,747 78 641,511 26 ln(size) 9.65 9.66 2.22 4.36 13.37 26 CAR 0.12 0.10 0.07 0.03 0.26 26 market‐to‐book 1.03 1.01 0.09 0.88 1.32 26 ROA 0.01 0.01 0.01 0.00 0.03 26 leverage 0.88 0.90 0.07 0.74 0.97 26 director ownership ($) 1,396 615 2,474 14 12,096 24 ln(director ownership) 13.12 13.33 1.63 9.56 16.31 24 director ownership (%) 0.00 0.00 0.00 0.00 0.00 26 CEO ownership (%) 0.03 0.00 0.06 0.00 0.26 26 firm age 19.73 15.00 14.42 4.00 46.00 26

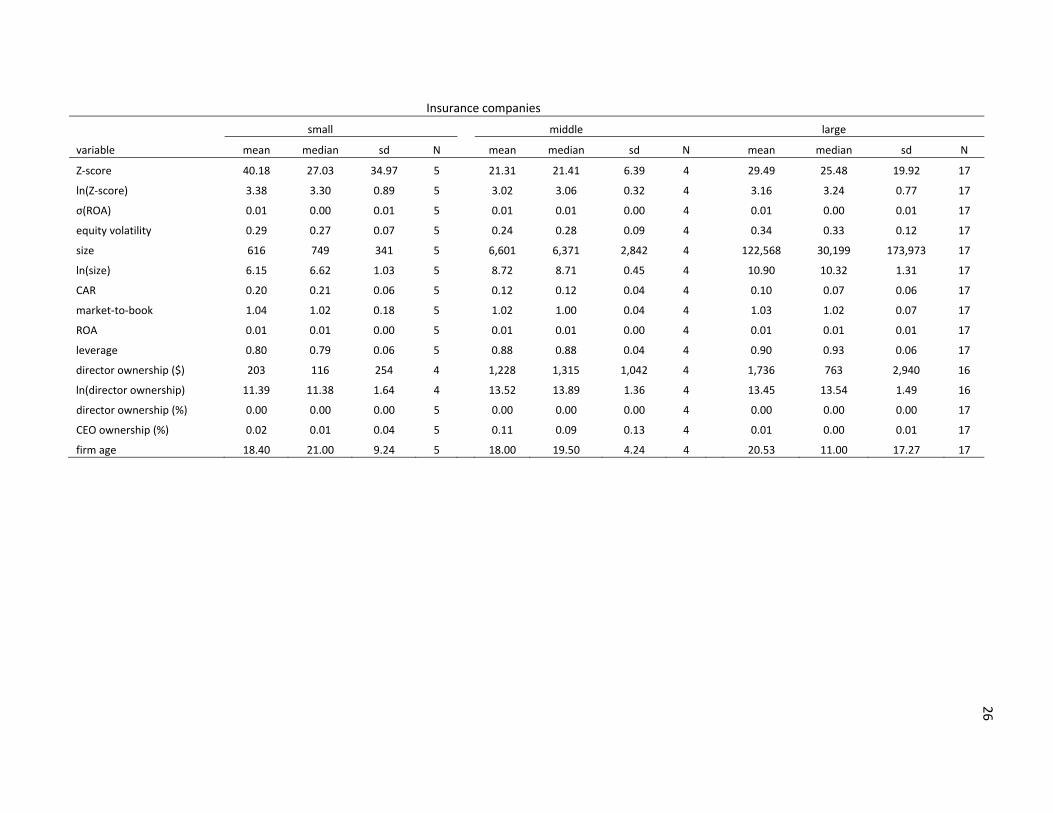
Table II (continued) small = total assets < 1 billion($); middle = total asset ≥ 1 billion & ≤ 10 billion; large = total assets > 10 billions
All financial institutions
small middle Large
variable mean median sd N mean median sd N mean median sd N
Z‐score 34.75 27.03 35.63 107 35.75 29.14 31.03 117 30.64 24.49 22.33 78
ln(Z‐score) 2.94 3.35 1.38 105 3.21 3.37 0.92 117 3.17 3.20 0.75 78
σ(ROA) 0.05 0.00 0.11 107 0.01 0.00 0.02 117 0.01 0.00 0.01 78
equity volatility 0.42 0.32 0.35 107 0.33 0.30 0.16 117 0.31 0.27 0.15 78
size 468 453 249 107 3,682 2,890 2,357 117 120,741 37,856 205,245 78
ln(size) 5.90 6.12 0.90 107 8.01 7.97 0.64 117 10.79 10.54 1.27 78
CAR 0.19 0.10 0.21 107 0.11 0.09 0.07 117 0.09 0.09 0.03 78
market‐to‐book 1.26 1.05 0.69 107 1.09 1.08 0.11 117 1.11 1.09 0.11 78
ROA 0.00 0.01 0.09 107 0.01 0.01 0.01 117 0.01 0.01 0.01 78
leverage 0.81 0.90 0.21 107 0.89 0.91 0.07 117 0.91 0.91 0.03 78
director ownership ($) 948 574 1,116 106 1,728 922 2,189 117 2,403 1,340 2,970 77
ln(director ownership) 13.10 13.26 1.29 106 13.78 13.73 1.07 117 14.12 14.11 1.14 77
director ownership (%) 0.01 0.01 0.01 107 0.00 0.00 0.01 117 0.00 0.00 0.00 78
CEO ownership (%) 0.07 0.02 0.15 107 0.04 0.01 0.07 117 0.01 0.01 0.03 78
firm age 12.34 11.00 6.39 107 17.96 18.00 7.67 117 29.76 27.50 14.12 78
23
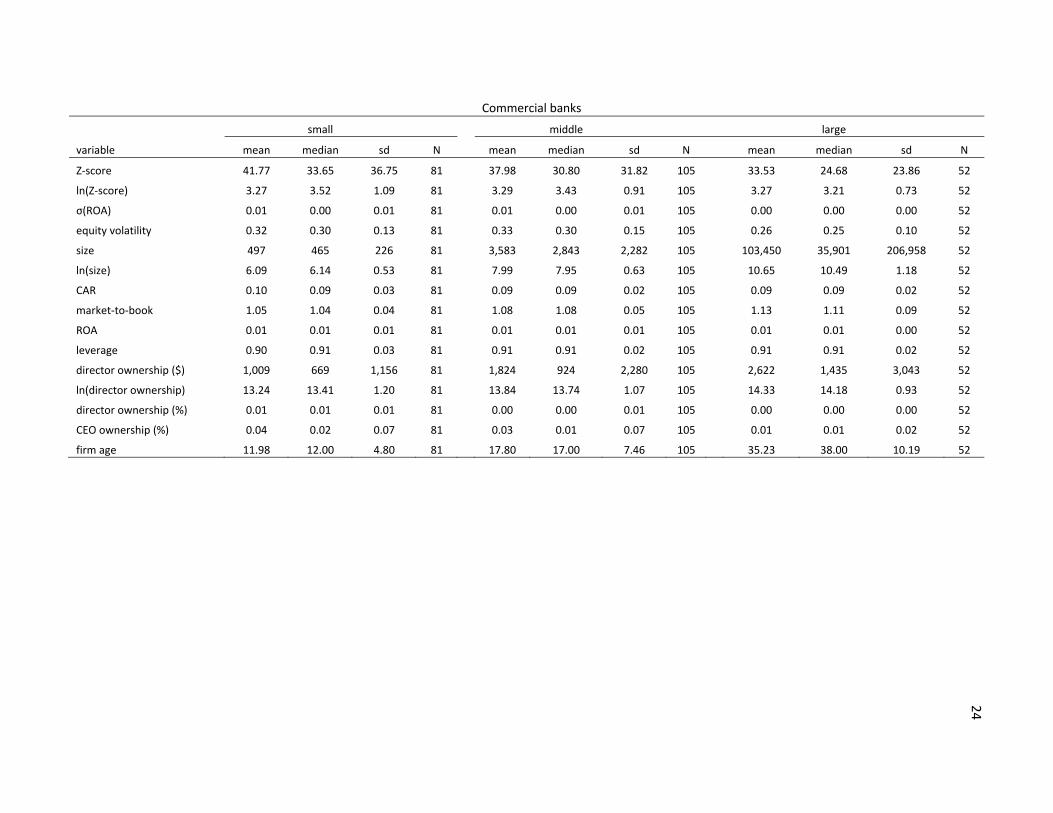
Commercial banks
small middle large
variable mean median sd N mean median sd N mean median sd N
Z‐score 41.77 33.65 36.75 81 37.98 30.80 31.82 105 33.53 24.68 23.86 52
ln(Z‐score) 3.27 3.52 1.09 81 3.29 3.43 0.91 105 3.27 3.21 0.73 52
σ(ROA) 0.01 0.00 0.01 81 0.01 0.00 0.01 105 0.00 0.00 0.00 52
equity volatility 0.32 0.30 0.13 81 0.33 0.30 0.15 105 0.26 0.25 0.10 52
size 497 465 226 81 3,583 2,843 2,282 105 103,450 35,901 206,958 52
ln(size) 6.09 6.14 0.53 81 7.99 7.95 0.63 105 10.65 10.49 1.18 52
CAR 0.10 0.09 0.03 81 0.09 0.09 0.02 105 0.09 0.09 0.02 52
market‐to‐book 1.05 1.04 0.04 81 1.08 1.08 0.05 105 1.13 1.11 0.09 52
ROA 0.01 0.01 0.01 81 0.01 0.01 0.01 105 0.01 0.01 0.00 52
leverage 0.90 0.91 0.03 81 0.91 0.91 0.02 105 0.91 0.91 0.02 52
director ownership ($) 1,009 669 1,156 81 1,824 924 2,280 105 2,622 1,435 3,043 52
ln(director ownership) 13.24 13.41 1.20 81 13.84 13.74 1.07 105 14.33 14.18 0.93 52
director ownership (%) 0.01 0.01 0.01 81 0.00 0.00 0.01 105 0.00 0.00 0.00 52
CEO ownership (%) 0.04 0.02 0.07 81 0.03 0.01 0.07 105 0.01 0.01 0.02 52
firm age 11.98 12.00 4.80 81 17.80 17.00 7.46 105 35.23 38.00 10.19 52
24
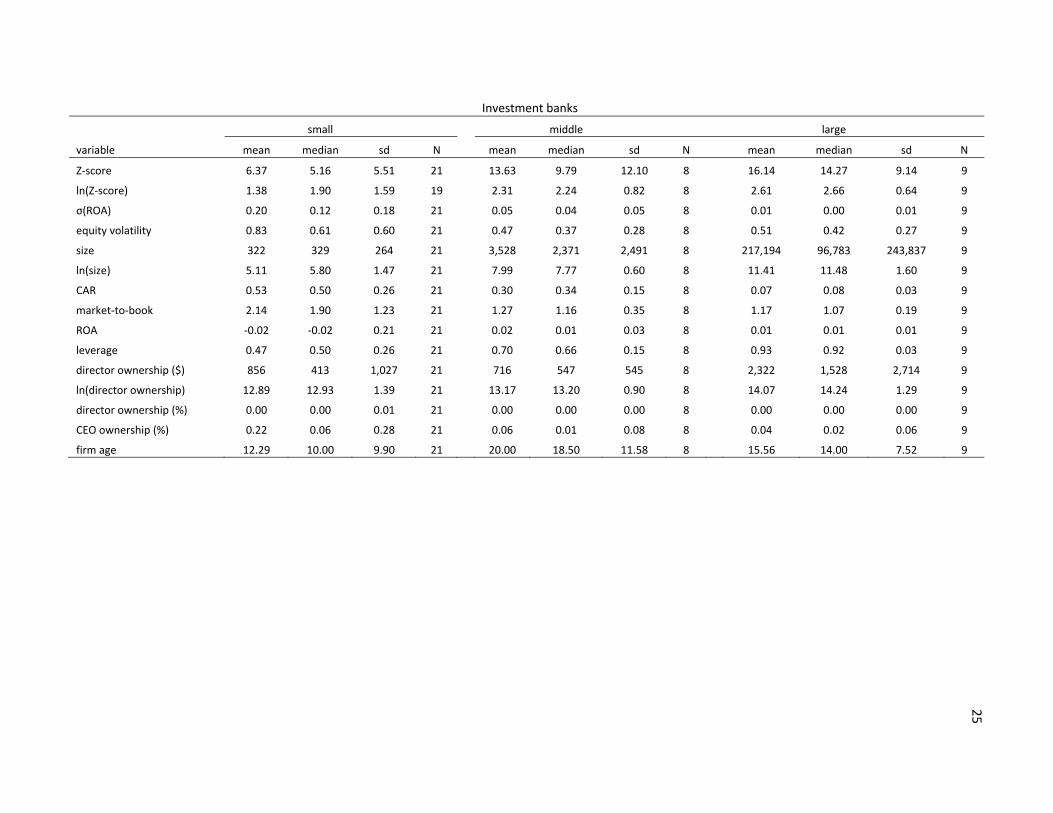
Investment banks
small middle large
variable mean median sd N mean median sd N mean median sd N
Z‐score 6.37 5.16 5.51 21 13.63 9.79 12.10 8 16.14 14.27 9.14 9
ln(Z‐score) 1.38 1.90 1.59 19 2.31 2.24 0.82 8 2.61 2.66 0.64 9
σ(ROA) 0.20 0.12 0.18 21 0.05 0.04 0.05 8 0.01 0.00 0.01 9
equity volatility 0.83 0.61 0.60 21 0.47 0.37 0.28 8 0.51 0.42 0.27 9
size 322 329 264 21 3,528 2,371 2,491 8 217,194 96,783 243,837 9
ln(size) 5.11 5.80 1.47 21 7.99 7.77 0.60 8 11.41 11.48 1.60 9
CAR 0.53 0.50 0.26 21 0.30 0.34 0.15 8 0.07 0.08 0.03 9
market‐to‐book 2.14 1.90 1.23 21 1.27 1.16 0.35 8 1.17 1.07 0.19 9
ROA
‐ ‐0.02 0.02 0.21 21 0.02 0.01 0.03 8 0.01 0.01 0.01 9
leverage 0.47 0.50 0.26 21 0.70 0.66 0.15 8 0.93 0.92 0.03 9
director ownership ($) 856 413 1,027 21 716 547 545 8 2,322 1,528 2,714 9
ln(director ownership) 12.89 12.93 1.39 21 13.17 13.20 0.90 8 14.07 14.24 1.29 9
director ownership (%) 0.00 0.00 0.01 21 0.00 0.00 0.00 8 0.00 0.00 0.00 9
CEO ownership (%) 0.22 0.06 0.28 21 0.06 0.01 0.08 8 0.04 0.02 0.06 9
firm age 12.29 10.00 9.90 21 20.00 18.50 11.58 8 15.56 14.00 7.52 9
25
26
Insurance companies
small middle large
variable mean median sd N mean median sd N mean median sd N
Z‐score 40.18 27.03 34.97 5 21.31 21.41 6.39 4 29.49 25.48 19.92 17
ln(Z‐score) 3.38 3.30 0.89 5 3.02 3.06 0.32 4 3.16 3.24 0.77 17
σ(ROA) 0.01 0.00 0.01 5 0.01 0.01 0.00 4 0.01 0.00 0.01 17
equity volatility 0.29 0.27 0.07 5 0.24 0.28 0.09 4 0.34 0.33 0.12 17
size 616 749 341 5 6,601 6,371 2,842 4 122,568 30,199 173,973 17
ln(size) 6.15 6.62 1.03 5 8.72 8.71 0.45 4 10.90 10.32 1.31 17
CAR 0.20 0.21 0.06 5 0.12 0.12 0.04 4 0.10 0.07 0.06 17
market‐to‐book 1.04 1.02 0.18 5 1.02 1.00 0.04 4 1.03 1.02 0.07 17
ROA 0.01 0.01 0.00 5 0.01 0.01 0.00 4 0.01 0.01 0.01 17
leverage 0.80 0.79 0.06 5 0.88 0.88 0.04 4 0.90 0.93 0.06 17
director ownership ($) 203 116 254 4 1,228 1,315 1,042 4 1,736 763 2,940 16
ln(director ownership) 11.39 11.38 1.64 4 13.52 13.89 1.36 4 13.45 13.54 1.49 16
director ownership (%) 0.00 0.00 0.00 5 0.00 0.00 0.00 4 0.00 0.00 0.00 17
CEO ownership (%) 0.02 0.01 0.04 5 0.11 0.09 0.13 4 0.01 0.00 0.01 17
firm age 18.40 21.00 9.24 5 18.00 19.50 4.24 4 20.53 11.00 17.27 17

27
The other measures of risk, such as volatility of equity return, also indicate the same pattern.
In terms of leverage, commercial banks are the highest, followed by insurance and investment
banks. This result is a little surprising considering the fact that the biggest investment banks are
also the most leveraged firms among financial institutions. In our sample, investment banks take
four places in the top six most highly leveraged firms (see Appendix D). We see this result
because most middle and small sized investment banks do not have this high leverage, which
significantly drives down the average leverage. Lastly, the summary statistics for Z-score are
similar to those reported by Houston et al (2010), as they report a mean log Z-score of 3.240 and
a standard deviation of 1.086, while we have 3.103 and 1.075, respectively.
The average financial institution has $33 billion in assets with a standard deviation of $116
billion, and it ranges from a minimum of $12 million to a maximum of $1 trillion. The huge
standard deviation and range indicate a significant variation in firm size. Examination of the size
distributions by different categories indicates a common pattern: in each category, there are a
few very large companies with the rest being small and middle sized. For example, out of 238
commercial banks, only 11 have assets over $100 billion. This pattern is also demonstrated by
Figure 1, which shows the histograms for all firms, along with firms in their separate categories.
In addition, insurance companies have the highest average size, followed by investment banks
and commercial banks. Due to the highly skewed distribution of size, the natural logarithm
transformation is applied to this variable.

28
Figure 1 Histogram of firm size (in billion dollars)
The governance variable, measured as the natural logarithm of median director dollar
stockholding, has a mean of 13.63 and standard deviation of 1.24 and it ranges from a minimum
of 9.28 to a maximum of 16.48. The distribution of this variable is similar across categories.
Lastly, the sample shows an average firm age of 19 years, with investment banks significantly
younger than commercial banks and insurance companies.
Table III presents the correlation among the key variables. First of all, as expected, all three
risk measures are highly correlated. Secondly, the log of firm size is significantly correlated with
risk as measured by the log(Z-score), volatility of return on asset and equity return, but not raw
Z-score. Firm age is negatively correlated with risk, consistent with our initial conjecture that all
else being equal, older firms have more experience in risk management. Interestingly, we found
that more stable FIs are associated with a lower market-to-book ratio, which is inconsistent with

29
the finding in Demsetz, Saindenberg and Strahan (1996). In addition, the governance variable is
highly correlated with risk as measured by Z-score and volatility of return on assets, but not the
equity volatility. Lastly, CEO ownership is positively correlated with all three risk measures,
indicating that stock ownership by CEO induces risk-taking.

Table III Correlation matrix of main regression variables. This table reports the correlations between the main regression variables. Sample consists of 302 financial institutions. Statistics based on averages of annual data over the period 1998-2008, unless otherwise indicated. Z-score =(ROA+CAR)/σ(ROA). σ(ROA) is the volatility of the firm’s return on assets over the period 1998-2008. Equity volatility is standard deviation of annual stock return over 1998-2008. Size is the total asset (in $ millions). ln(rev) is log of total revenue (in $ millions). Market-to-book is calculated as market value of equity plus book value of debt divided by book total asset. ROA is the return on asset. Leverage is the debt asset ratio. Director ownership ($) is natural logarithm of median director dollar stockholding as of the last year in our sample period. CEO ownership (%) is percentage of CEO stock ownership as of the last year in our sample period. age is firm age as proxied by the difference between 2008 and the year that the firm first appear in Compustat monthly stock return database. p-values denoting the significance level of each correlation coefficients are in parentheses. *, **, and *** indicate significance at the 10%, 5%, and 1% levels, respectively.
30
z_score ln(Z‐score) σ(ROA) equity volatility size ln(size) ln(rev)
Market‐to‐book ROA leverage
director ownership
CEO ownership
ln(Z‐score) 0.807*** (0.000)
σ(ROA)
‐0.271*** ‐0.597*** (0.000) (0.000)
equity ‐0.329*** ‐0.531*** 0.554*** volatility (0.000) (0.000) (0.000)
size ‐0.098* ‐0.034 ‐0.059 ‐0.038 (0.090) (0.555) (0.309) (0.517)
ln(size) ‐0.053 0.106* ‐0.309*** ‐0.256*** 0.588*** (0.358) (0.067) (0.000) (0.000) (0.000)
ln(rev) ‐0.141** ‐0.018 ‐0.111* ‐0.093 0.590*** 0.950*** (0.014) (0.760) (0.055) (0.107) (0.000) (0.000)
market‐to‐ ‐0.168*** ‐0.250*** 0.564*** 0.349*** ‐0.048 ‐0.159*** 0.024 book (0.003) (0.000) (0.000) (0.000) (0.411) (0.006) (0.681)
ROA 0.083 0.236*** ‐0.278*** ‐0.370*** 0.010 0.148** 0.100* 0.275*** (0.149) (0.000) (0.000) (0.000) (0.857) (0.010) (0.084) (0.000)
leverage 0.207*** 0.370*** ‐0.545*** ‐0.305*** 0.108* 0.369*** 0.141** ‐0.573*** 0.036 (0.000) (0.000) (0.000) (0.000) (0.060) (0.000) (0.015) (0.000) (0.534)
director 0.181*** 0.215*** ‐0.116** ‐0.085 0.132** 0.320*** 0.280*** 0.031 0.150*** 0.214*** ownership (0.002) (0.000) (0.044) (0.142) (0.022) (0.000) (0.000) (0.590) (0.009) (0.000)
CEO ‐0.144** ‐0.221*** 0.200*** 0.295*** ‐0.095* ‐0.302*** ‐0.170*** 0.334*** ‐0.073 ‐0.525*** ‐0.159***
ownership (0.012) (0.000) (0.001) (0.000) (0.099) (0.000) (0.003) (0.000) (0.208) (0.000) (0.006)
Age 0.021 0.116** ‐0.183*** ‐0.238*** 0.301*** 0.559*** 0.563*** ‐0.081 0.063 0.113** 0.158*** ‐0.066 (0.722) (0.044) (0.001) (0.000) (0.000) (0.000) (0.000) (0.160) (0.274) (0.049) (0.006) (0.251)
31
i i
CHAPTER 4
Size and firm risk
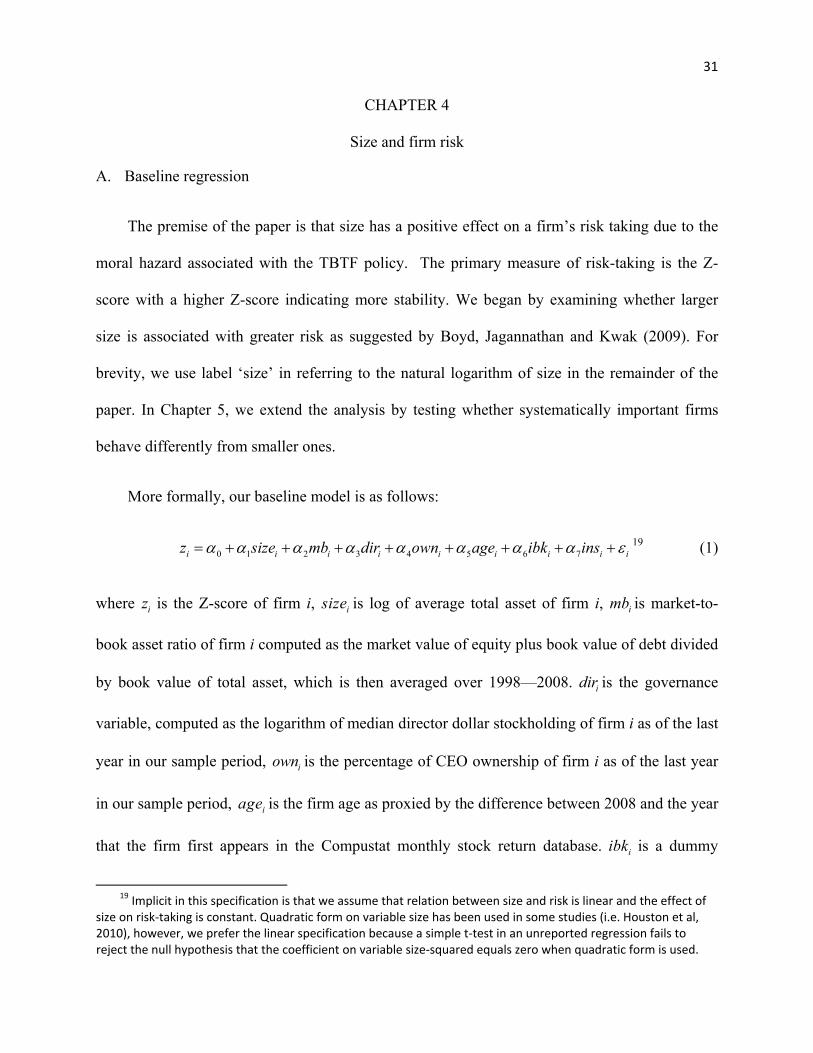
A. Baseline regression
The premise of the paper is that size has a positive effect on a firm’s risk taking due to the
moral hazard associated with the TBTF policy. The primary measure of risk-taking is the Z-
score with a higher Z-score indicating more stability. We began by examining whether larger
size is associated with greater risk as suggested by Boyd, Jagannathan and Kwak (2009). For
brevity, we use label ‘size’ in referring to the natural logarithm of size in the remainder of the
paper. In Chapter 5, we extend the analysis by testing whether systematically important firms
behave differently from smaller ones.
More formally, our baseline model is as follows:
0 1 2 3 4 5 6 7i i i i i i iz size mb dir own age ibk insα α α α α α α α= + + + + + + + +ε
19 (1)
where is the Z-score of firm i, is log of average total asset of firm i, is market-to-
book asset ratio of firm i computed as the market value of equity plus book value of debt divided
by book value of total asset, which is then averaged over 1998—2008. is the governance
variable, computed as the logarithm of median director dollar stockholding of firm i as of the last
year in our sample period, is the percentage of CEO ownership of firm i as of the last year
in our sample period, is the firm age as proxied by the difference between 2008 and the year
that the firm first appears in the Compustat monthly stock return database. is a dummy
iz isize imb
iibk
idir
iown
iage
19 Implicit in this specification is that we assume that relation between size and risk is linear and the effect of size on risk‐taking is constant. Quadratic form on variable size has been used in some studies (i.e. Houston et al, 2010), however, we prefer the linear specification because a simple t‐test in an unreported regression fails to reject the null hypothesis that the coefficient on variable size‐squared equals zero when quadratic form is used.

32
variable, which equals one if firm i is an investment bank and 0 otherwise, is a dummy
variable for an insurance company, and is defined analogously.
iins
iε is the error term and sβ
(s=1…6) are vectors of coefficient estimates. Note that we only include leverage and profitability
as controls in specifications when other risk-taking measures are used as the dependent variable
because the Z-score is a deterministic function of these two variables.
The discrepancies in the level of significance and signs on the variable Z-score and its log
transformation ln(Z-score) from correlation Table III raises concerns about the existence of
outliers. In regression analysis, the presence of outliers can strongly distort the classical least
squares estimator and lead to unreliable results. To investigate whether this is the case, we
perform a series of standard diagnostics such as Cook's D influence statistic and studentized
residuals. Results from these analyses indicate unusual points in our data. Figure 2 also presents
the leverage-versus-squared residuals plot by running four separate OLS regressions in Eq (1),
with Z-score, ln(Z-score), earnings volatility, and equity volatility as the respective dependent
variables. The points far away from the mass of points indicate unusual observations.20 Figure 2
suggests that outliers exist in our sample regardless of which risk measures are used.
20 Appendix E shows some outliers in my sample. They have been manually verified to be accurate.

33
Figure 2 Plot of leverage versus squared-residuals. This figure is generated by running four separate OLS regressions, with Z-score, log of Z-score, log of earnings volatility, and log of equity volatility as respective dependent variables (Eq.1). Leverage on the y-axis measures how far an independent variable deviates from its mean. Normalized residual square on x-axis indicates outliers. Variable definitions are in Appendix A.
The simple diagnostic analysis precludes us from relying on the standard ordinary least
squares (OLS) regression for inference. The common ways to deal with outliers are truncation or
winsorization; we opt out of these approaches for two reasons: first, we verify that those outliers
are not data entry errors; second, the total observations in our sample are rather limited. Instead,
we rely on two other approaches to address this issue: median and robust regression.21
21 Median regression, focusing on the 0.5 quantile, is a special case of quantile regression. The difference between median and OLS regression is that OLS minimizes the squared error loss, while as median regression minimizes the absolute error loss. Median regression is more robust to outliers than least‐squares regression. See Cameron and Trivedi (2005) for details. This method is used by Aggarwal and Samwick (1999). It is the QREG command in Stata, version 10.0. Robust regression is used by Baker and Hall (2004). RREG uses Huber weight iterations followed by biweight iterations. It is the RREG command in Stata, version 10.0. See Hamilton (1991) for details.

34
Table IV presents the results of the regression analysis with both raw Z-score and log Z-
score as the dependent variables. They are estimated using three distinct methods: median,
robust, and OLS regressions. Since the lines between banks, investment banks, and insurance
companies are increasingly blurring,22 I also present the results without industry controls. For
reasons mentioned previously, we focus on raw Z-score. The overarching message from the
regressions presented in Table IV is that bigger size is generally associated with greater risk. Size
enters negatively and is significant at conventional levels. In regressions with the log-
transformation of Z-score, the signs on size are still expected but are less significant. Comparing
the results across estimation methods, we find that both median and robust regressions generate
similar estimates, while the OLS estimate has a much larger magnitude. This is not surprising
considering outliers in our sample.
22 For example, Goldman Sachs and MetLife are now bank holding companies.
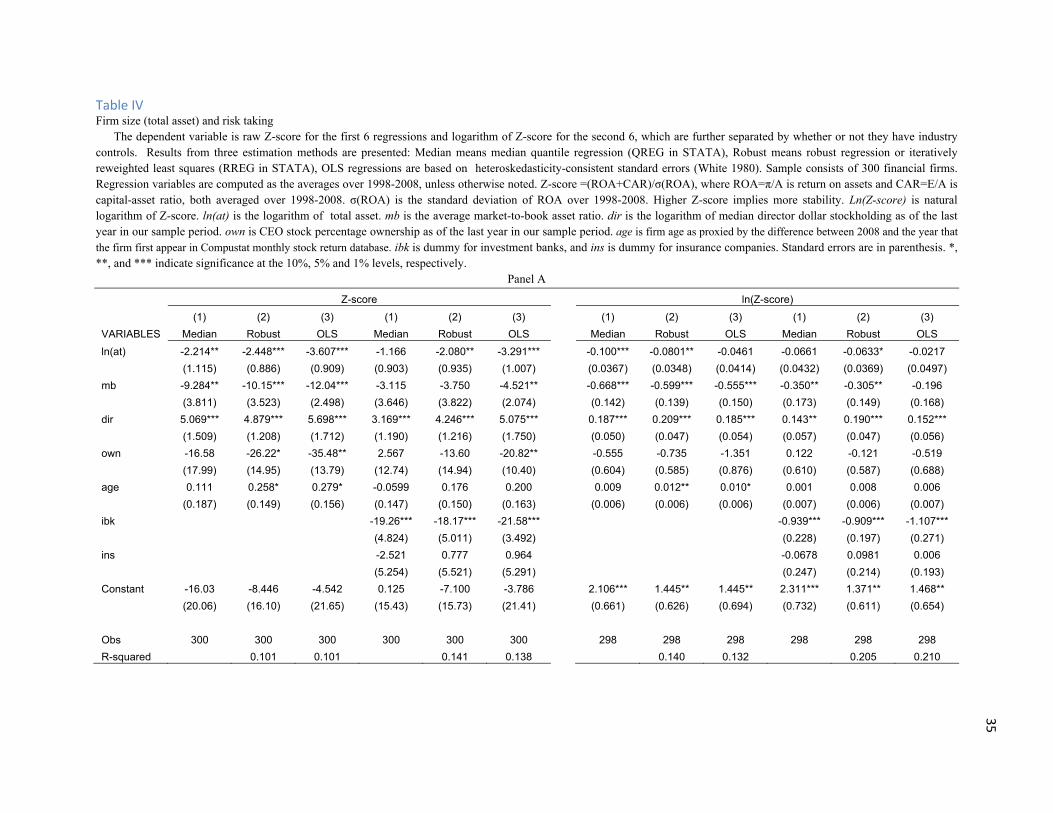
Table IV Firm size (total asset) and risk taking The dependent variable is raw Z-score for the first 6 regressions and logarithm of Z-score for the second 6, which are further separated by whether or not they have industry controls. Results from three estimation methods are presented: Median means median quantile regression (QREG in STATA), Robust means robust regression or iteratively reweighted least squares (RREG in STATA), OLS regressions are based on heteroskedasticity-consistent standard errors (White 1980). Sample consists of 300 financial firms. Regression variables are computed as the averages over 1998-2008, unless otherwise noted. Z-score =(ROA+CAR)/σ(ROA), where ROA=π/A is return on assets and CAR=E/A is capital-asset ratio, both averaged over 1998-2008. σ(ROA) is the standard deviation of ROA over 1998-2008. Higher Z-score implies more stability. Ln(Z-score) is natural logarithm of Z-score. ln(at) is the logarithm of total asset. mb is the average market-to-book asset ratio. dir is the logarithm of median director dollar stockholding as of the last year in our sample period. own is CEO stock percentage ownership as of the last year in our sample period. age is firm age as proxied by the difference between 2008 and the year that the firm first appear in Compustat monthly stock return database. ibk is dummy for investment banks, and ins is dummy for insurance companies. Standard errors are in parenthesis. *, **, and *** indicate significance at the 10%, 5% and 1% levels, respectively.
Panel A
Z-score ln(Z-score) (1) (2) (3) (1) (2) (3) (1) (2) (3) (1) (2) (3)
VARIABLES Median Robust OLS Median Robust OLS Median Robust OLS Median Robust OLS ln(at) -2.214** -2.448*** -3.607*** -1.166 -2.080** -3.291*** -0.100*** -0.0801** -0.0461 -0.0661 -0.0633* -0.0217
(1.115) (0.886) (0.909) (0.903) (0.935) (1.007) (0.0367) (0.0348) (0.0414) (0.0432) (0.0369) (0.0497) mb -9.284** -10.15*** -12.04*** -3.115 -3.750 -4.521** -0.668*** -0.599*** -0.555*** -0.350** -0.305** -0.196
(3.811) (3.523) (2.498) (3.646) (3.822) (2.074) (0.142) (0.139) (0.150) (0.173) (0.149) (0.168) dir 5.069*** 4.879*** 5.698*** 3.169*** 4.246*** 5.075*** 0.187*** 0.209*** 0.185*** 0.143** 0.190*** 0.152***
(1.509) (1.208) (1.712) (1.190) (1.216) (1.750) (0.050) (0.047) (0.054) (0.057) (0.047) (0.056) own -16.58 -26.22* -35.48** 2.567 -13.60 -20.82** -0.555 -0.735 -1.351 0.122 -0.121 -0.519
(17.99) (14.95) (13.79) (12.74) (14.94) (10.40) (0.604) (0.585) (0.876) (0.610) (0.587) (0.688) age 0.111 0.258* 0.279* -0.0599 0.176 0.200 0.009 0.012** 0.010* 0.001 0.008 0.006
(0.187) (0.149) (0.156) (0.147) (0.150) (0.163) (0.006) (0.006) (0.006) (0.007) (0.006) (0.007) ibk -19.26*** -18.17*** -21.58*** -0.939*** -0.909*** -1.107***
(4.824) (5.011) (3.492) (0.228) (0.197) (0.271) ins -2.521 0.777 0.964 -0.0678 0.0981 0.006
(5.254) (5.521) (5.291) (0.247) (0.214) (0.193) Constant -16.03 -8.446 -4.542 0.125 -7.100 -3.786 2.106*** 1.445** 1.445** 2.311*** 1.371** 1.468**
(20.06) (16.10) (21.65) (15.43) (15.73) (21.41) (0.661) (0.626) (0.694) (0.732) (0.611) (0.654)
Obs 300 300 300 300 300 300 298 298 298 298 298 298 R-squared 0.101 0.101 0.141 0.138 0.140 0.132 0.205 0.210
35

36
Table IV (continued) Panel B: interacting firm size with industry dummies
Z-score ln(Z-score) (1) (2) (3) (1) (2) (3) VARIABLES Median Robust OLS Median Robust OLS ln(at) -2.920** -2.977** -5.184*** -0.174*** -0.132*** -0.113***
(1.240) (1.158) (1.493) (0.061) (0.047) (0.043) mb -1.424 -1.807 -1.588 -0.091 -0.190 -0.037
(3.776) (3.755) (1.824) (0.192) (0.154) (0.193) dir 2.668** 3.978*** 5.121*** 0.171*** 0.193*** 0.155***
(1.231) (1.152) (1.745) (0.060) (0.047) (0.054) own 2.608 -4.967 -12.439 0.146 0.315 0.131
(13.903) (14.440) (9.377) (0.667) (0.608) (0.625) age 0.162 0.289* 0.380* 0.016* 0.014** 0.015**
(0.172) (0.160) (0.198) (0.008) (0.007) (0.007) ibk -46.761*** -42.793*** -61.604*** -3.294*** -2.633*** -3.514***
(14.845) (14.479) (12.437) (0.782) (0.629) (1.143) ins -27.796 -13.837 -8.797 -1.469 -0.375 0.264
(24.879) (24.864) (33.792) (1.186) (1.018) (1.107) ibk*size 3.687** 3.365* 5.097*** 0.284*** 0.207*** 0.300**
(1.821) (1.743) (1.527) (0.093) (0.075) (0.120) ins*size 3.069 1.731 1.398 0.190 0.061 -0.006
(2.616) (2.562) (3.357) (0.124) (0.105) (0.119) Constant 14.558 -2.962 3.632 2.162*** 1.656*** 1.791***
(16.308) (15.287) (22.573) (0.794) (0.627) (0.677)
Observations 300 300 300 298 298 298 R-squared 0.142 0.153 0.232 0.252

37
Our governance variable (dir) enters positively and is significant at the 1% level in all
regressions, meaning better governance as measured by median director dollar stockholding is
associated with less risk-taking. This result provides strong evidence that our initial conjecture
based on Diamond and Rajan (2009) is correct. However, it is in sharp contrast to Cheng, Hong
and Scheinkman (2009), who use standard governance measures such as G-index and E-index
and find that governance has no effect on financial firms’ risk-taking. We find similar results, as
shown in Appendix F, when standard governance indices such as G-index and E-index are used
as explanatory variables. The reason is that these indices are mostly measures of anti-takeover
provisions.23 Theoretically, it is hard to make a connection between these provisions and firm
risk-taking. The economic size of coefficient on dir is consequential. A one standard deviation
change in dir (1.24) is associated with a change in Z-score of 5.27 (1.24*4.246), an approximate
21 percent increase from its median (25.29).
Comparing the results from regressions with and without industry control reveals that the
magnitude of the coefficient is smaller in regressions with industry controls, indicating that the
industry fixed effect might play an important role in shaping financial firms’ risk-taking
behavior. This point is confirmed by the finding that investment banks are significantly riskier
than commercial banks: all the coefficients on the investment bank dummy (ibk) are negative and
significant at the 1% level. This result, however, is not driven by leverage as we have
documented in the summary statistics that the average investment bank is less leveraged than
commercial banks. At this point, we are not certain what the underlying factor driving this
relation is: it may be the nature of investment banking business. In fact, Kwast (1989) documents
that securities activities have a higher standard deviation of returns than non-securities activities,
23 The coefficient on size lost its significant because financial firms that are included in the S&P1500 are relatively large companies, and may be subject to sample selection bias.

38
and Allen and Jagtiani (1997) find that securities firms on average have the highest market risk
exposure among all financial institutions. CEO ownership has a negative effect on Z-score, but
enters insignificantly. As expected, the sign of firm age on Z-score is positive, but its effect is
only marginally significant.
As a robustness check, we use total revenue and total market capitalization as our measures
for the size of the firm. The results, with the log of total revenue and log of market capitalization
replacing the log of total asset, are shown in Appendix G and H, respectively. The coefficients on
total revenue are very similar to those in Table IV, except they are slightly larger in magnitude.
Coefficients on other variables are qualitatively the same. The results from total capitalization
are qualitatively similar as well. As an additional robustness check, we restrict our sample to
those firms with total assets less than $10 billion because we are concerned that the extremely
large FIs may be fundamentally different from middle and small sized firms, and we report the
results in Appendix I. As we can see, the results are similar to the previous results.24
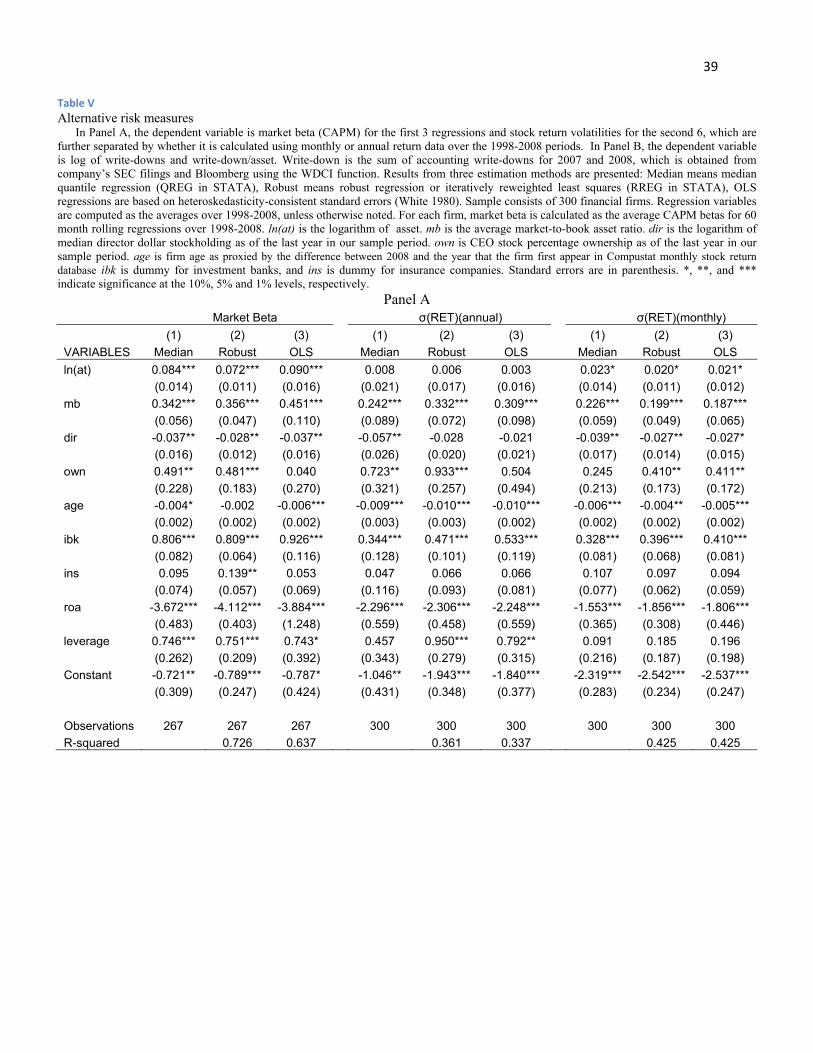
The results from our additional risk measures broadly support our hypothesis. Panel A of
Table V shows regression results with market beta, and monthly and annual stock return
volatility as dependent variables, while Panel B presents the results using write-down as the
dependent variable. Firstly, the coefficients on firm size are positive and significant, especially in
market beta and write-down. Secondly, the coefficients on the governance variable are negative
and significant in the regressions from Panel A but not from Panel B. Lastly, the coefficients on
the investment bank dummy demonstrate a similar pattern. The result that investment banks have
a higher beta is consistent with Allen and Jagtiani (1997).
24 We also ran a separate regression on commercial banks only. The results, shown in Appendix J, support our hypothesis.
39
Table V Alternative risk measures In Panel A, the dependent variable is market beta (CAPM) for the first 3 regressions and stock return volatilities for the second 6, which are further separated by whether it is calculated using monthly or annual return data over the 1998-2008 periods. In Panel B, the dependent variable is log of write-downs and write-down/asset. Write-down is the sum of accounting write-downs for 2007 and 2008, which is obtained from company’s SEC filings and Bloomberg using the WDCI function. Results from three estimation methods are presented: Median means median quantile regression (QREG in STATA), Robust means robust regression or iteratively reweighted least squares (RREG in STATA), OLS regressions are based on heteroskedasticity-consistent standard errors (White 1980). Sample consists of 300 financial firms. Regression variables are computed as the averages over 1998-2008, unless otherwise noted. For each firm, market beta is calculated as the average CAPM betas for 60 month rolling regressions over 1998-2008. ln(at) is the logarithm of asset. mb is the average market-to-book asset ratio. dir is the logarithm of median director dollar stockholding as of the last year in our sample period. own is CEO stock percentage ownership as of the last year in our sample period. age is firm age as proxied by the difference between 2008 and the year that the firm first appear in Compustat monthly stock return database ibk is dummy for investment banks, and ins is dummy for insurance companies. Standard errors are in parenthesis. *, **, and *** indicate significance at the 10%, 5% and 1% levels, respectively.
Panel A Market Beta σ(RET)(annual) σ(RET)(monthly)
(1) (2) (3) (1) (2) (3) (1) (2) (3) VARIABLES Median Robust OLS Median Robust OLS Median Robust OLS ln(at) 0.084*** 0.072*** 0.090*** 0.008 0.006 0.003 0.023* 0.020* 0.021*
(0.014) (0.011) (0.016) (0.021) (0.017) (0.016) (0.014) (0.011) (0.012) mb 0.342*** 0.356*** 0.451*** 0.242*** 0.332*** 0.309*** 0.226*** 0.199*** 0.187***
(0.056) (0.047) (0.110) (0.089) (0.072) (0.098) (0.059) (0.049) (0.065) dir -0.037** -0.028** -0.037** -0.057** -0.028 -0.021 -0.039** -0.027** -0.027*
(0.016) (0.012) (0.016) (0.026) (0.020) (0.021) (0.017) (0.014) (0.015) own 0.491** 0.481*** 0.040 0.723** 0.933*** 0.504 0.245 0.410** 0.411**
(0.228) (0.183) (0.270) (0.321) (0.257) (0.494) (0.213) (0.173) (0.172) age -0.004* -0.002 -0.006*** -0.009*** -0.010*** -0.010*** -0.006*** -0.004** -0.005***
(0.002) (0.002) (0.002) (0.003) (0.003) (0.002) (0.002) (0.002) (0.002) ibk 0.806*** 0.809*** 0.926*** 0.344*** 0.471*** 0.533*** 0.328*** 0.396*** 0.410***
(0.082) (0.064) (0.116) (0.128) (0.101) (0.119) (0.081) (0.068) (0.081) ins 0.095 0.139** 0.053 0.047 0.066 0.066 0.107 0.097 0.094
(0.074) (0.057) (0.069) (0.116) (0.093) (0.081) (0.077) (0.062) (0.059) roa -3.672*** -4.112*** -3.884*** -2.296*** -2.306*** -2.248*** -1.553*** -1.856*** -1.806***
(0.483) (0.403) (1.248) (0.559) (0.458) (0.559) (0.365) (0.308) (0.446) leverage 0.746*** 0.751*** 0.743* 0.457 0.950*** 0.792** 0.091 0.185 0.196
(0.262) (0.209) (0.392) (0.343) (0.279) (0.315) (0.216) (0.187) (0.198) Constant -0.721** -0.789*** -0.787* -1.046** -1.943*** -1.840*** -2.319*** -2.542*** -2.537***
(0.309) (0.247) (0.424) (0.431) (0.348) (0.377) (0.283) (0.234) (0.247)
Observations 267 267 267 300 300 300 300 300 300 R-squared 0.726 0.637 0.361 0.337 0.425 0.425
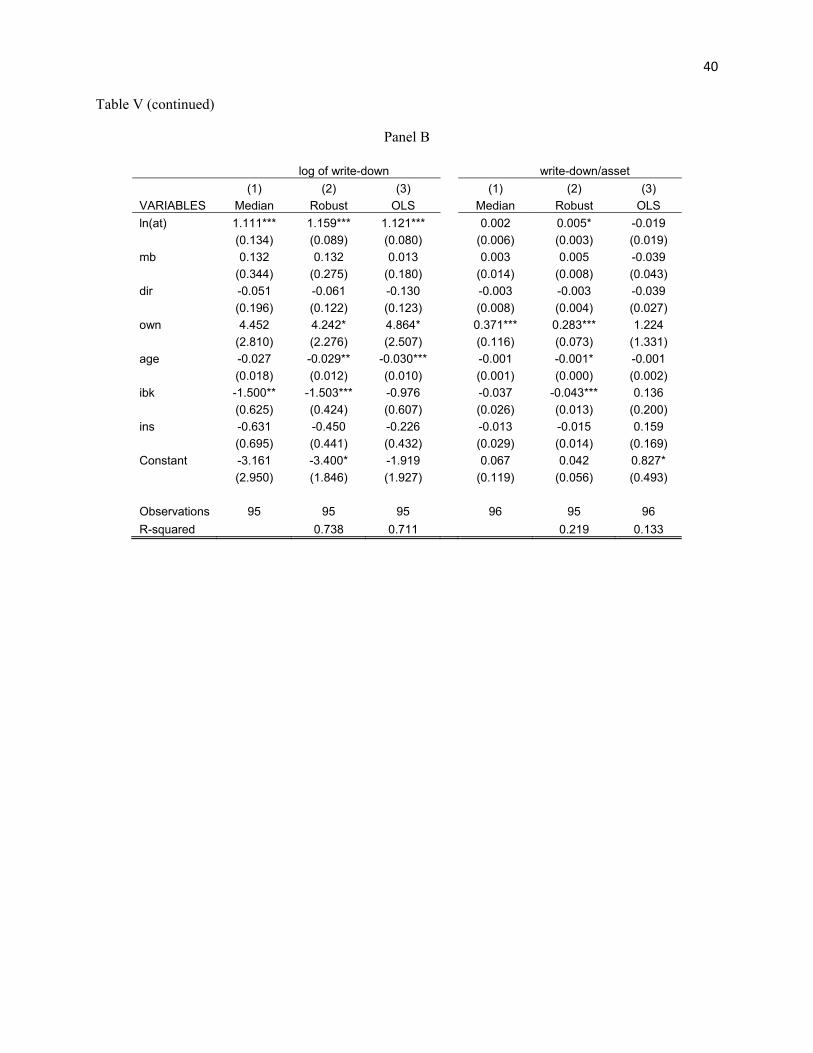
40
Table V (continued)
Panel B
log of write-down write-down/asset (1) (2) (3) (1) (2) (3) VARIABLES Median Robust OLS Median Robust OLS ln(at) 1.111*** 1.159*** 1.121*** 0.002 0.005* -0.019
(0.134) (0.089) (0.080) (0.006) (0.003) (0.019) mb 0.132 0.132 0.013 0.003 0.005 -0.039
(0.344) (0.275) (0.180) (0.014) (0.008) (0.043) dir -0.051 -0.061 -0.130 -0.003 -0.003 -0.039
(0.196) (0.122) (0.123) (0.008) (0.004) (0.027) own 4.452 4.242* 4.864* 0.371*** 0.283*** 1.224
(2.810) (2.276) (2.507) (0.116) (0.073) (1.331) age -0.027 -0.029** -0.030*** -0.001 -0.001* -0.001
(0.018) (0.012) (0.010) (0.001) (0.000) (0.002) ibk -1.500** -1.503*** -0.976 -0.037 -0.043*** 0.136
(0.625) (0.424) (0.607) (0.026) (0.013) (0.200) ins -0.631 -0.450 -0.226 -0.013 -0.015 0.159
(0.695) (0.441) (0.432) (0.029) (0.014) (0.169) Constant -3.161 -3.400* -1.919 0.067 0.042 0.827*
(2.950) (1.846) (1.927) (0.119) (0.056) (0.493)
Observations 95 95 95 96 95 96 R-squared 0.738 0.711 0.219 0.133

41
To summarize: consistent with H1, we have identified that size has a positive effect on risk-
taking, although this effect becomes weaker when the log transformation of Z-score was used.
Better governance can significantly reduce risk-taking, which is consistent with H2; and lastly,
investment banks are riskier than commercial banks, which supports H3.
A1. Endogeneity of firm size
The empirical corporate finance research has long been plagued by the problem of
endogeneity, and this research is no exception. Specifically, we are particularly concerned about
the joint determination of risk-taking and firm size. Previous research has identified that banks
are willing to pay large premium to make acquisitions that will make them sufficiently large and
TBTF (Brewer III and Jagtiani, 2009). Therefore, although firms are more likely to pursue risk-
taking activities when they become larger, it is also likely that high-risk firms have the incentives
to increase their sizes to achieve TBTF status. To address this issue, we use the identification
strategy of instrumental variable (IV). In particular, we make use of variation in whether or not a
firm incorporates in Delaware as an instrument for firm size. The idea for this instrument is that
when a company decides to go public, the decision where to incorporate, while not random,
should be exogenous to the unobservable factors that affect firms’ risk-taking as induced by
moral hazard of TBTF. The validity of an instrument critically hinges on this exclusion
restriction.
Empirical legal and financial studies have investigated extensively why a firm would
choose Delaware as its domicile. For example, Daines (2001) and Bhagat and Romano (2002)
find there is a wealth effect associated with Delaware incorporation, due to the fact that
Delaware corporate law encourages takeover bids and facilitates the sale of public firms by
reducing the cost of acquiring a Delaware firm. Apparently, this wealth effect should have

42
nothing to do with a firm’s risk-taking. Bebchuck and Cohen (2003) identify that favorable anti-
takeover protections are important for a state to attract out-of-state incorporation. 25 From a
different angle, Romano (1985) argues that Delaware’s large store of precedent reduces
transaction costs and uncertainty about legal liability. Lastly, Fisch (2000) notes the peculiar role
of the Delaware judiciary in corporate lawmaking, arguing that Delaware lawmaking offers
Delaware corporations a variety of benefits, including flexibility, responsiveness, insulation from
undue political influence, and transparency. While these factors affect a firm’s domicile decision,
all of them appear centered around the legal environment of Delaware. In addition, other
researchers have argued that a firm’s choice of domicile is unimportant and trivial (Black, 1990)
This literature suggests that our instrumental variable, dummy for Delaware incorporation, does
not belong to the structural equation, we thus conclude that it is a valid instrument.
Table V, Panel A compares Delaware firms with non-Delaware firms in terms of firm
characteristics, revealing that Delaware firms tend to have a larger market-to-book asset ratio,
are more likely to be investment banks, and are less leveraged. Panel B of the Table compares
size and risk-taking for Delaware and non-Delaware firms. It shows that Delaware firms are
significantly larger and riskier. Figure 3 shows the distributions of firm size, revealing a
systematic shift in firm size from non-Delaware firms to Delaware firms.
25 We are concerned that anti‐takeover protections might affect risk‐taking, thus rendering the instrument invalid. However, the regression of Z‐score on the G/E‐indices, which are primarily measures of anti‐takeover provisions, failed to yield significant results (see Table VIII).

43
Table VI Comparison of Delaware and non-Delaware firms This table shows the mean difference in firm characteristics, risk-taking and firm size between Non-Delaware and Delaware firms. Statistics based on average annual data over 1998-2008, unless otherwise indicated. Z-score is firm’s return on assets plus the capital asset ratio divided by the standard deviation of asset return over period 1998-2008. σ(ROA) is the volatility of the firm’s return on assets over the period 1998-2008. σ(RET) is standard deviation of annual stock return over 1998-2008. Market-to-book is calculated as market value of equity plus book value of debt divided by book total asset. ROA is the return on asset. Leverage is the debt asset ratio. Director ownership ($) is natural logarithm of median director dollar stockholding as of the last year in our sample period. CEO ownership (%) is percentage of CEO stock ownership as of the last year in our sample period. age is firm age as proxied by the difference between 2008 and the year that the firm first appears in Compustat monthly stock return database. Investment bank is a dummy which equals one if investment bank, zero otherwise. Insurance company is defined analogously. Panel A
Firm characteristics
Variables market to book ratio
Director Ownership
CEO ownership age
Investment bank
Insurance company ROA Leverage
non‐Delaware 1.110 13.611 0.041 18.791 0.058 0.068 0.004 0.882
Delaware 1.262 13.657 0.048 19.490 0.271 0.125 0.014 0.843
Difference 0.152 0.047 0.007 0.698 0.213 0.057 0.010 ‐0.039
t statistics 2.21 0.30 0.55 0.45 4.40 1.49 1.20 ‐1.990
Panel B
Size measures Risk measures
Variables Log(total asset)
Log(total revenue)
Log(mkt value) Z‐score
log(Z‐score) σ(ROA) σ(RET)
non‐Delaware 7.589 5.086 5.812 38.397 3.260 0.017 0.337
Delaware 8.827 6.556 7.153 24.802 2.770 0.030 0.398
Difference 1.238 1.470 1.341 ‐13.594 ‐0.489 0.013 0.061
t statistics 4.59 5.74 5.15 ‐3.85 ‐3.89 1.45 2.05
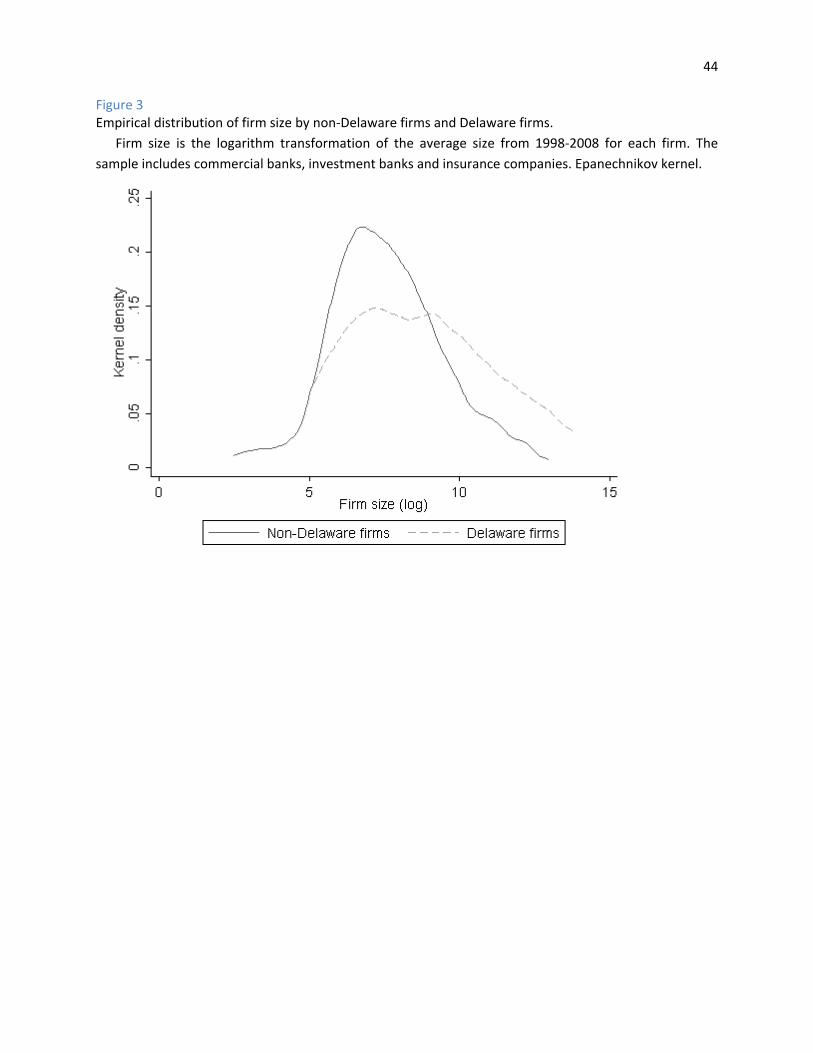
44
Figure 3 Empirical distribution of firm size by non‐Delaware firms and Delaware firms. Firm size is the logarithm transformation of the average size from 1998‐2008 for each firm. The sample includes commercial banks, investment banks and insurance companies. Epanechnikov kernel.

45
i i
The IV approach involves estimating a two-stage model of the following form:
0 1 2 3 4 5 6 7i i i i i i iz size mb dir own age ibk insα α α α α α α α= + + + + + + + +ε
i i
(2)
0 1 2 3 4 5 6 7i i i i i i isize de mb dir own age ibk insβ β β β β β β β= + + + + + + + +υ (3)
where dei is a dummy variable which equals one if firm i is Delaware incorporated, and the rest
of the variables are defined as per Eq. (1)
Identification of the IV model requires a strong correlation between the Delaware dummy
variable and firm size because a weak instrument can lead to large inconsistencies. Results from
the first-stage regression with and without the full set of controls are presented in Table VII, Part
A. For the specification with a full set of controls (col. 2), the entire set of independent variables
explains about 60% of the variation in firm size while the included instrument variable alone
explains about 10%. The standard error is 0.21 and the partial F-statistic on the excluded
instrument is 25.89, which satisfies the weak instrument test (the rule of thumb value is 10) as
discussed in Bound et al (1995) and Staiger and Stock (1997). To further verify this is the case,
we perform a formal weak instrument test as proposed by Stock and Yogo (2005): if the F-
statistic from the first-stage regression exceeds the critical value (using 5% bias), the instrument
is deemed to be valid. As we can see from the bottom of the table, the critical value is 16.38,
which is less than the F-statistic; we thus claim that we do not have a weak instrument problem.
Overall, the results from the first stage regression indicate that Delaware firms on average are
significantly larger than non-Delaware firms. This result is consistent with Bebchuk and Cohen

46
(2004) who identify a similar pattern based on a universe of all publicly traded firms in the
Compustat database at the end of 1999.26
Results from IV estimates for risk-taking, as measured by Z-score, logarithm of Z-score,
standard deviation of return on assets and annual stock return, are reported in Table VII, Part B.
The results on Z-score are not only consistent with but also strengthen our previous findings in
Table IV: the coefficient on size is negative and the magnitude is around four times larger for IV
estimates. This fact suggests that the OLS estimate underestimates the true effect of firm size on
risk-taking. In addition, we find that CEO ownership does have an impact on inducing risk-
taking, consistent with existing theory. The results in Column 3 reveal that size does not have a
significant impact on volatility of stock return. This result is consistent with Demsetz and
Strahan (1997), who do not find evidence that the size of bank holding companies is negatively
correlated with stock return variance. The findings on governance variable and investment banks
are consistent with previous findings.
26 See Table 8, page 403 of their paper.

47
Table VII Two-Stage Least Square (2SLS) IV regression of firm size on risk-taking Part A presents the first-stage regressions of firm size on the instrumental variable (Delaware), and other pre-determined controls included in the second stage regressions of risk-taking on firm size. These controls include market-to-book asset ratio, median director dollar stockholding, CEO stock ownership, firm age, dummy for investment bank, dummy for insurance company, return on asset, and leverage. Part B reports the results from the second-stage regressions of risk-taking on firm size and control variables, in which firm size, instrumented by Delaware, is treated as an endogenous variable. Sample consists of 300 financial firms. Regression variables are computed as the averages over 1998-2008, unless otherwise noted. Delaware is dummy, which equals 1 if a firm is incorporated in Delaware. Z-score = (ROA+CAR)/σ(ROA), where ROA=π/A is return on assets and CAR=E/A is capital-asset ratio, both averaged over 1998-2008. σ(ROA) is the standard deviation of ROA over 1998-2008. Higher Z-score implies more stability. Ln(Z-score) is natural logarithm of Z-score. σ(RETY) is the standard deviation of annual stock return over 1998-2008. σ(RETM) is the standard deviation of monthly stock return over 1998-2008. ln(at) is the logarithm of total asset. mb is the market-to-book asset ratio. dir is the logarithm of median director dollar stockholding as of the last year in our sample period. own is CEO stock percentage ownership as of the last year in our sample period. age is firm age as proxied by the difference between 2008 and the year that the firm first appear in Compustat monthly stock return database ibk is dummy for investment banks, and ins is dummy for insurance companies. Leverage is debt/asset ratio. F-statistic is the partial F-statistic on the instrument. Stock and Yogo (2005) weak instrument tests report the critical value using 5% relative bias tolerance. DWH test is Durbin-Wu-Hausman test of endogeneity. Standard errors are in parenthesis. *, **, and *** indicate significance at the 10%, 5% and 1% levels, respectively.
Part A: First-Stage Regression: Firm Size (log) (1) (2) (3) Delaware 1.238*** 1.046*** 0.923***
(0.270) (0.206) (0.197) mb -0.494* -0.166
(0.260) (0.357) dir 0.411*** 0.327***
(0.074) (0.068) own -4.273*** -2.271**
(1.241) (1.146) age 0.092*** 0.092***
(0.008) (0.008) ibk 0.290 1.430***
(0.491) (0.527) ins 2.003*** 2.103***
(0.463) (0.432) roa 2.941
(2.862) leverage 5.410***
(1.158) Constant 7.589*** 0.879 -3.285**
(0.132) (0.988) (1.355)
Partial R2 0.098 0.088 F-statistic 21.04 25.89 21.99 Observations 302 300 300 R-squared 0.075 0.568 0.623 Stock and Yogo (2005) Weak Instrument Tests - 16.38 16.38

48
Table VII (continued) Part B: Second-Stage Regression: Firm Size on Risk-taking
(1) (2) (3) (4) VARIABLES Z-score ln(Z-score) σ(RETY) σ(RETM) ln(at) -8.348** -0.249* 0.007 0.008
(3.744) (0.149) (0.029) (0.005) mb -6.818** -0.279 0.219*** 0.035***
(3.422) (0.210) (0.082) (0.012) dir 7.258*** 0.248*** -0.001 -0.005**
(2.201) (0.087) (0.014) (0.003) own -44.387** -1.663* 0.337 0.064*
(22.548) (0.917) (0.265) (0.034) age 0.681* 0.027* -0.004 -0.001**
(0.401) (0.015) (0.003) (0.001) ibk -17.565*** -0.890** 0.261** 0.039**
(6.267) (0.376) (0.103) (0.018) ins 12.535 0.526 0.011 -0.005
(10.108) (0.376) (0.074) (0.014) roa -1.996*** -0.363***
(0.698) (0.122) leverage 0.426 0.004
(0.288) (0.054) Constant 0.029 1.659** -0.270 0.072
(23.403) (0.735) (0.274) (0.049)
Observations 300 298 300 300 R-squared 0.082 0.118 0.455 0.459
A2. Time and firm fixed effect
The previous analyses use cross-sectional regressions with average annual data over a 10-
year period. Such a long period raises concerns that any changes in macroeconomic conditions or
market-wide fluctuations could have influenced risk-taking in the financial industry. Even worse,
any unobservable firm fixed effect could also bias our results. To address these concerns, we
apply the identification strategy of the fixed effect model. To make sure there is enough variation
in firm size from one period to the next, we obtain quarterly data during 2001—2008 and divide
it into a two 4-year sub-periods, 2001—2004 and 2005—2008. We choose 2001 instead of 1998
as the starting point as this will avoid the impact of a series of bank-related regulations enacted
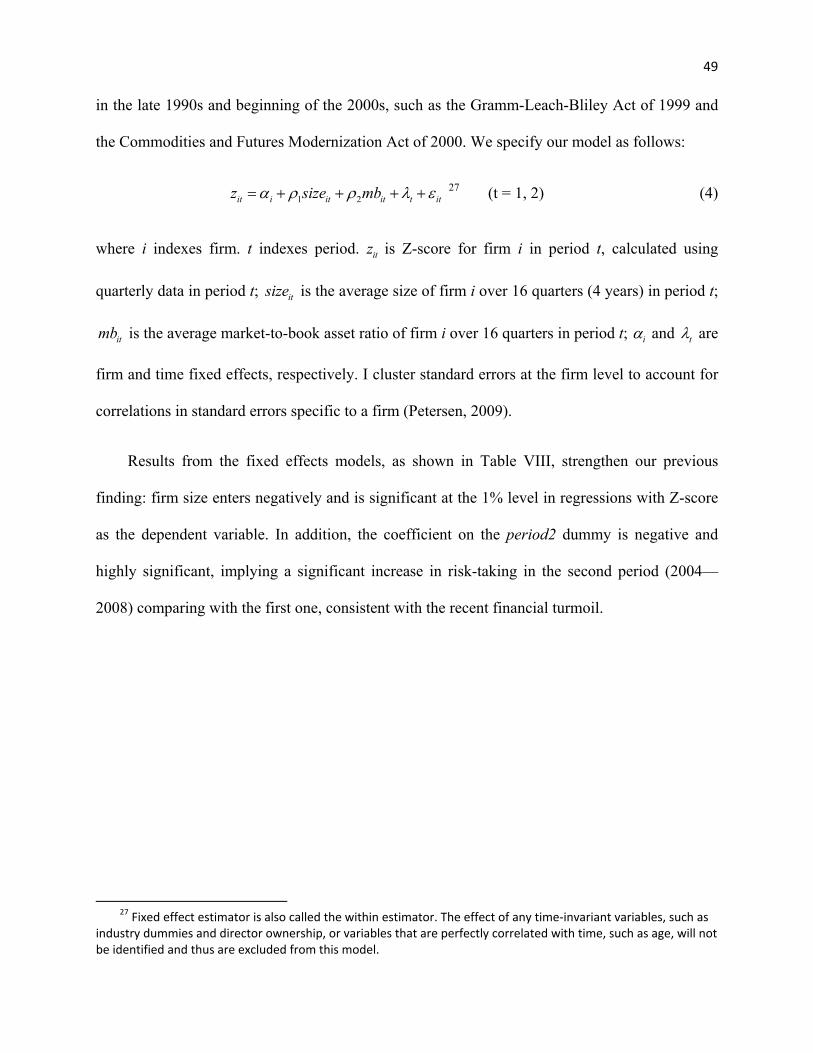
49
in the late 1990s and beginning of the 2000s, such as the Gramm-Leach-Bliley Act of 1999 and
the Commodities and Futures Modernization Act of 2000. We specify our model as follows:
1 2it i it it t itz size mbα ρ ρ λ= + + + +ε 27 (t = 1, 2) (4)
where i indexes firm. t indexes period. is Z-score for firm i in period t, calculated using
quarterly data in period t; is the average size of firm i over 16 quarters (4 years) in period t;
is the average market-to-book asset ratio of firm i over 16 quarters in period t;
itz
itsize
itmb iα and tλ are
firm and time fixed effects, respectively. I cluster standard errors at the firm level to account for
correlations in standard errors specific to a firm (Petersen, 2009).
Results from the fixed effects models, as shown in Table VIII, strengthen our previous
finding: firm size enters negatively and is significant at the 1% level in regressions with Z-score
as the dependent variable. In addition, the coefficient on the period2 dummy is negative and
highly significant, implying a significant increase in risk-taking in the second period (2004—
2008) comparing with the first one, consistent with the recent financial turmoil.
27 Fixed effect estimator is also called the within estimator. The effect of any time‐invariant variables, such as industry dummies and director ownership, or variables that are perfectly correlated with time, such as age, will not be identified and thus are excluded from this model.
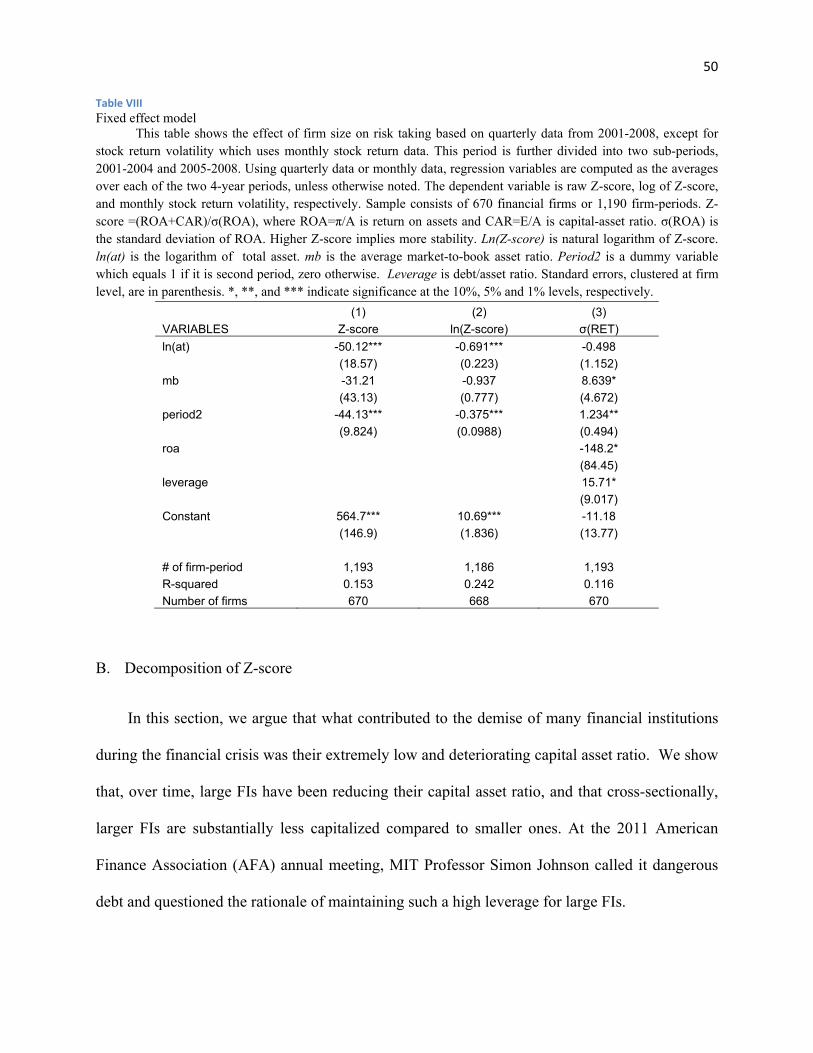
50
Table VIII Fixed effect model This table shows the effect of firm size on risk taking based on quarterly data from 2001-2008, except for stock return volatility which uses monthly stock return data. This period is further divided into two sub-periods, 2001-2004 and 2005-2008. Using quarterly data or monthly data, regression variables are computed as the averages over each of the two 4-year periods, unless otherwise noted. The dependent variable is raw Z-score, log of Z-score, and monthly stock return volatility, respectively. Sample consists of 670 financial firms or 1,190 firm-periods. Z-score =(ROA+CAR)/σ(ROA), where ROA=π/A is return on assets and CAR=E/A is capital-asset ratio. σ(ROA) is the standard deviation of ROA. Higher Z-score implies more stability. Ln(Z-score) is natural logarithm of Z-score. ln(at) is the logarithm of total asset. mb is the average market-to-book asset ratio. Period2 is a dummy variable which equals 1 if it is second period, zero otherwise. Leverage is debt/asset ratio. Standard errors, clustered at firm level, are in parenthesis. *, **, and *** indicate significance at the 10%, 5% and 1% levels, respectively.
(1) (2) (3) VARIABLES Z-score ln(Z-score) σ(RET) ln(at) -50.12*** -0.691*** -0.498
(18.57) (0.223) (1.152) mb -31.21 -0.937 8.639*
(43.13) (0.777) (4.672) period2 -44.13*** -0.375*** 1.234**
(9.824) (0.0988) (0.494) roa -148.2*
(84.45) leverage 15.71*
(9.017) Constant 564.7*** 10.69*** -11.18
(146.9) (1.836) (13.77)
# of firm-period 1,193 1,186 1,193 R-squared 0.153 0.242 0.116 Number of firms 670 668 670
B. Decomposition of Z-score
In this section, we argue that what contributed to the demise of many financial institutions
during the financial crisis was their extremely low and deteriorating capital asset ratio. We show
that, over time, large FIs have been reducing their capital asset ratio, and that cross-sectionally,
larger FIs are substantially less capitalized compared to smaller ones. At the 2011 American
Finance Association (AFA) annual meeting, MIT Professor Simon Johnson called it dangerous
debt and questioned the rationale of maintaining such a high leverage for large FIs.
51
Figure 4 shows the time series of several large financial firms’ capital ratio and return on
asset, such as the AIG, Wells Fargo & Co, and Prudential Financial Group Inc. Figure 4 shows
clearly that those firms’ capital asset ratio has been decreasing steadily, regardless of whether the
whole sample period (Panel A) or just the crisis period (Panel B) is considered. As for the
magnitude of the change, it decreased from above 14% in 1998 to just over 7% in 2008 – an
approximate of 50% decrease, in the case of AIG.

52
Figure 4 Time series of Capital Asset Ratio and Return on Asset for periods: 1998-2008 and 2006-2008 This figure shows the time-series capital asset ratio and return on asset over the whole sample period (1998-2008, Panel A) and the crisis period (2006-2008, Panel B) for the 10 largest firms in my sample.
Panel A
Panel B

53
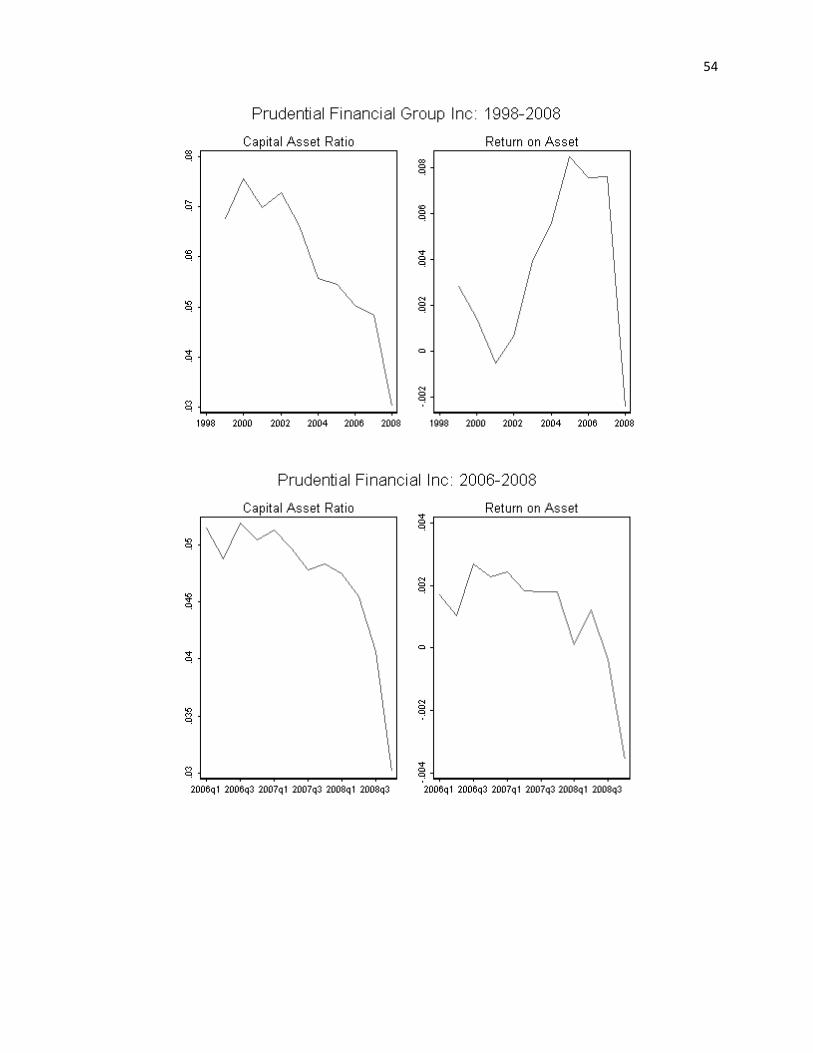
54
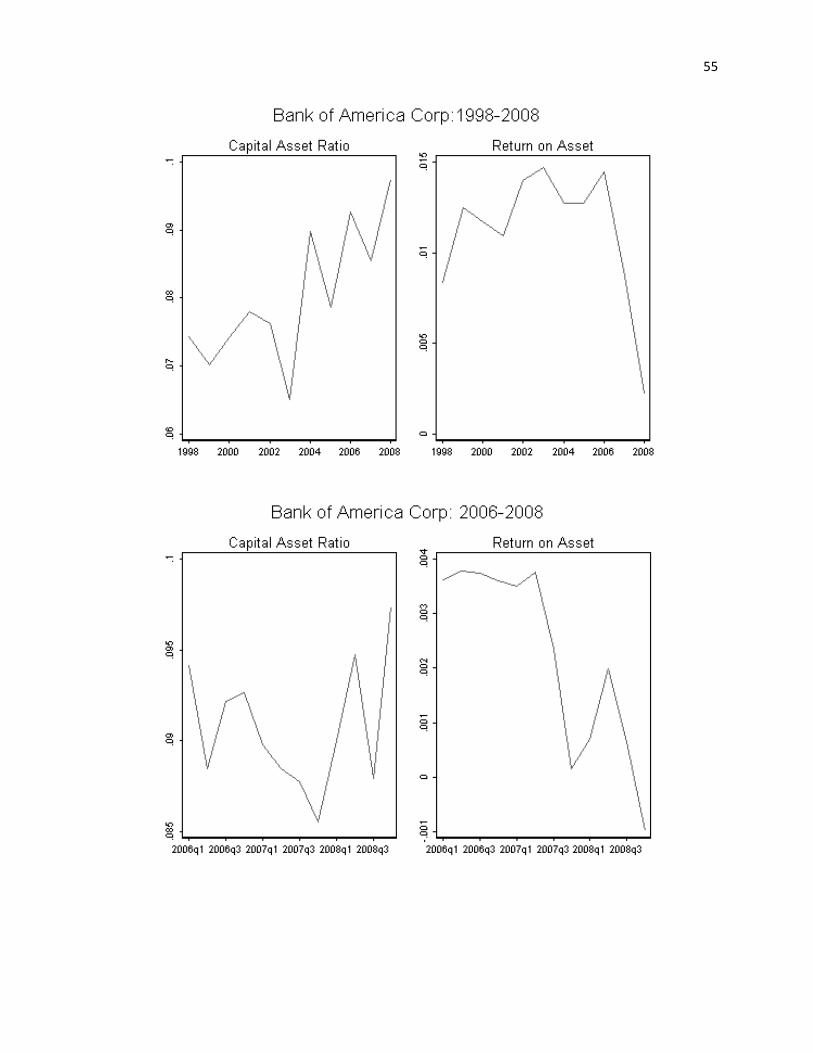
55

56
Also noteworthy from the figure is the change in profitability over time. As a consequence
of the financial crisis, which exposed them to the downside of the risk, not only has the return on
asset become more volatile, it also has decreased dramatically from 2.5% in 1998, to negative
7% in 2008, a magnitude of about 200% drop in profitability. The significant drop in capital
asset ratio and profitability, and a rise in the volatility of profitability contributed to the very low
level of the Z-score. While the capital asset ratio of these large FIs indicates a decreasing
pattern, variation does exist. For example, the Bank of America Corp’s capital ratio has
increased slightly over time.
To further investigate the relationship between capital asset ratio and firm size, we
decompose the Z-score. Z-score has three components –ROA, CAR, and σ(ROA) – and a higher
level of ROA and higher capital asset ratios (CAR) translate into higher Z-scores, while a larger
standard deviation of ROA translates into lower Z-scores28 . Thus, when we find a positive
relation between size and risk-taking, it may attribute to a lower ROA, lower capital ratio, and/or
a higher standard deviation. Therefore, it is possible that size may not necessarily increase the
risk of firm assets, but rather the drop in Z-score may instead be attributed to a decline in the
average bank capital ratio or return on asset. To further explore how the various components of
the Z-score move in response to an increase in firm size, we run regressions treating each of
these Z-score components as a separate dependent variable.29 The empirical results are reported
in Table IX
28 Since the year 2004 when Basel II Accord was implemented is included in our sample period, we are concerned that this event might affect firms’ capital asset ratio. However, simple tests rule out this is the case (see Appendix K). 29 We follow Houston et al, 2010.

57
Table IX Decomposition of Z-score The dependent variables are CAR, log of CAR (panel A), ROA, and σ(ROA) (panel B), respectively. Results from three estimation methods are presented: Median is median quantile regression, Robust is robust regression or iteratively reweighted least squares, OLS is ordinary least squares with White heteroskedasticity-robust standard error. Sample consists of 300 financial firms. Regression variables are computed as the averages over 1998-2008, unless otherwise noted Following Houston et al (2010), ROA is return on assets and CAR is capital-asset ratio, both are averaged over 1998-2008. σ(ROA) is the standard deviation of ROA over 1998-2008. Higher of ROA and CAR imply more stability. The ROA multiplied by 100 is used in regressions. ln(at) is the logarithm of total asset. mb is the market-to-book asset ratio. dir is the logarithm of median director dollar stockholding as of the last year in our sample period. own is CEO stock percentage ownership as of the last year in our sample period. age is firm age as proxied by the difference between 2008 and the year that the firm first appear in Compustat monthly stock return database ibk is dummy for investment banks, and ins is dummy for insurance companies. Leverage is debt/asset ratio. Standard errors are in parenthesis. *, **, and *** indicate significance at the 10%, 5% and 1% levels, respectively.
Panel A: capital asset ratio
CAR ln(CAR) (1) (2) (3) (1) (2) (3) VARIABLES Median Robust OLS Median Robust OLS ln(at) -0.006*** -0.007*** -0.021*** -0.071*** -0.092*** -0.117***
(0.001) (0.001) (0.005) (0.011) (0.012) (0.019) mb 0.137*** 0.193*** 0.083** 0.423*** 0.521*** 0.327***
(0.004) (0.004) (0.040) (0.043) (0.051) (0.114) dir -0.002** -0.002** -0.005 -0.001 -0.010 -0.023
(0.001) (0.001) (0.004) (0.014) (0.015) (0.017) own 0.138*** -0.023 0.250** 0.094 -0.081 0.301
(0.013) (0.014) (0.105) (0.156) (0.183) (0.319) age 0.001*** 0.001*** 0.002*** 0.009*** 0.009*** 0.011***
(0.000) (0.000) (0.001) (0.002) (0.002) (0.003) ibk 0.116*** 0.001 0.192*** 0.772*** 0.699*** 0.753***
(0.005) (0.005) (0.041) (0.057) (0.063) (0.145) ins 0.022*** 0.026*** 0.061*** 0.193*** 0.309*** 0.300***
(0.005) (0.005) (0.014) (0.061) (0.067) (0.098) roa -0.262*** -0.489*** -0.024 -0.856*** -1.291*** 0.078
(0.025) (0.031) (0.322) (0.279) (0.339) (0.850) Constant 0.005 -0.038** 0.189*** -2.473*** -2.285*** -1.742***
(0.014) (0.015) (0.064) (0.181) (0.196) (0.258)
Observations 300 299 300 300 300 300 R-squared 0.925 0.661 0.702 0.608

58
Panel B: ROA and volatility of ROA
ROA σ(ROA) (1) (2) (3) (1) (2) (3) VARIABLES Median Robust OLS Median Robust OLS ln(at) -0.039** -0.029* 0.492 0.029 0.043 -0.004
(0.018) (0.015) (0.446) (0.056) (0.038) (0.042) mb 4.335*** 3.587*** 5.956* 0.662*** 0.648*** 0.743***
(0.069) (0.071) (3.424) (0.219) (0.177) (0.232) dir 0.071*** 0.050*** 0.140 -0.126* -0.159*** -0.147***
(0.021) (0.019) (0.222) (0.069) (0.046) (0.050) own -1.687*** -1.054*** -3.228 -1.637* -1.162* -0.909
(0.262) (0.246) (8.123) (0.855) (0.598) (0.812) age 0.009*** 0.009*** -0.027 0.001 -0.003 -0.002
(0.003) (0.002) (0.043) (0.008) (0.006) (0.006) ibk -0.177* -0.193** -4.404 1.375*** 0.714*** 0.970***
(0.101) (0.092) (3.045) (0.338) (0.232) (0.268) ins 0.209** 0.069 -0.747 0.020 -0.084 0.044
(0.099) (0.085) (1.238) (0.307) (0.213) (0.189) roa -7.630*** -10.833*** -4.720**
(1.458) (1.245) (2.183) leverage 1.127*** 1.385*** 0.876 -2.920*** -4.321*** -3.341***
(0.282) (0.270) (12.023) (0.933) (0.639) (0.827) Constant -5.542*** -4.777*** -11.553 -2.117* -0.369 -1.205
(0.350) (0.328) (11.650) (1.171) (0.799) (0.912)
Observations 300 298 300 300 299 300 R-squared 0.918 0.187 0.609 0.540
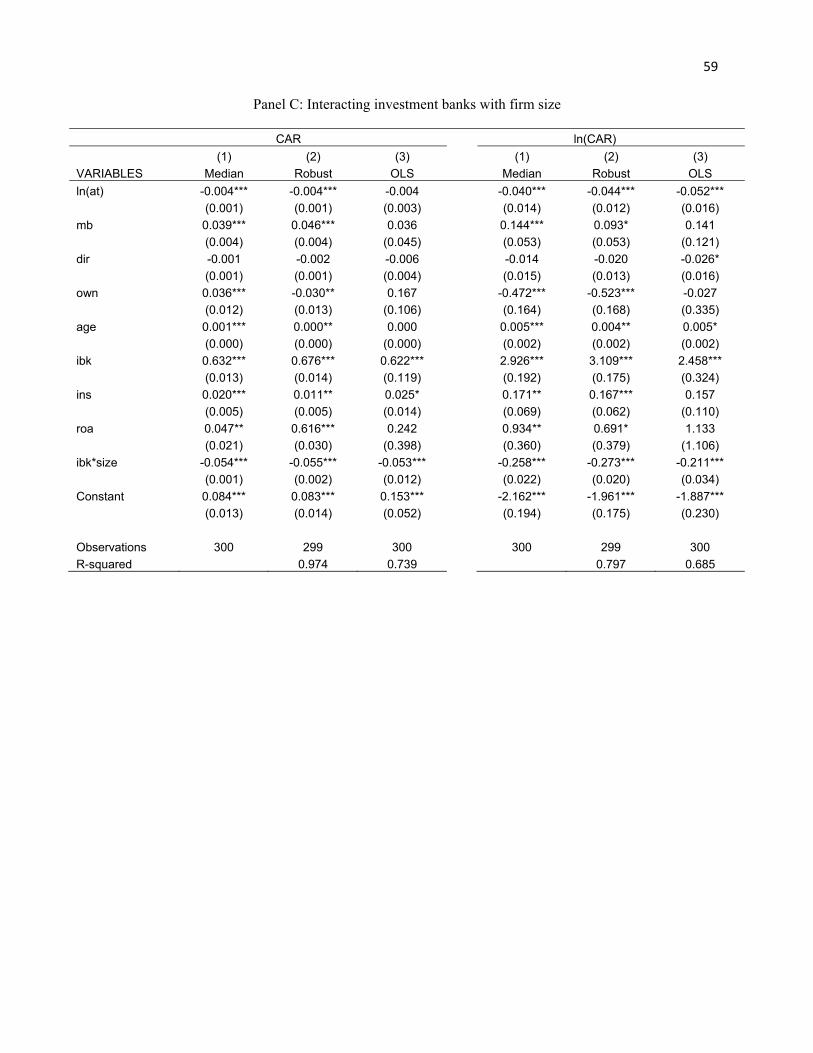
59
Panel C: Interacting investment banks with firm size
CAR ln(CAR) (1) (2) (3) (1) (2) (3) VARIABLES Median Robust OLS Median Robust OLS ln(at) -0.004*** -0.004*** -0.004 -0.040*** -0.044*** -0.052***
(0.001) (0.001) (0.003) (0.014) (0.012) (0.016) mb 0.039*** 0.046*** 0.036 0.144*** 0.093* 0.141
(0.004) (0.004) (0.045) (0.053) (0.053) (0.121) dir -0.001 -0.002 -0.006 -0.014 -0.020 -0.026*
(0.001) (0.001) (0.004) (0.015) (0.013) (0.016) own 0.036*** -0.030** 0.167 -0.472*** -0.523*** -0.027
(0.012) (0.013) (0.106) (0.164) (0.168) (0.335) age 0.001*** 0.000** 0.000 0.005*** 0.004** 0.005*
(0.000) (0.000) (0.000) (0.002) (0.002) (0.002) ibk 0.632*** 0.676*** 0.622*** 2.926*** 3.109*** 2.458***
(0.013) (0.014) (0.119) (0.192) (0.175) (0.324) ins 0.020*** 0.011** 0.025* 0.171** 0.167*** 0.157
(0.005) (0.005) (0.014) (0.069) (0.062) (0.110) roa 0.047** 0.616*** 0.242 0.934** 0.691* 1.133
(0.021) (0.030) (0.398) (0.360) (0.379) (1.106) ibk*size -0.054*** -0.055*** -0.053*** -0.258*** -0.273*** -0.211***
(0.001) (0.002) (0.012) (0.022) (0.020) (0.034) Constant 0.084*** 0.083*** 0.153*** -2.162*** -1.961*** -1.887***
(0.013) (0.014) (0.052) (0.194) (0.175) (0.230)
Observations 300 299 300 300 299 300 R-squared 0.974 0.739 0.797 0.685

60
Panel D: Full interaction
CAR ln(CAR) (1) (2) (3) (1) (2) (3) VARIABLES Median Robust OLS Median Robust OLS ln(at) -0.002* -0.003*** -0.001 -0.022* -0.016 -0.026
(0.001) (0.001) (0.003) (0.013) (0.013) (0.017) mb 0.036*** 0.049*** 0.034 0.159*** 0.071 0.131
(0.004) (0.004) (0.046) (0.047) (0.050) (0.120) dir -0.002 -0.002* -0.006* -0.018 -0.021 -0.026*
(0.001) (0.001) (0.004) (0.013) (0.013) (0.015) own 0.026* -0.033** 0.167 -0.283* -0.562*** -0.030
(0.015) (0.014) (0.107) (0.153) (0.159) (0.334) age 0.000* 0.000 -0.000 0.004** 0.001 0.002
(0.000) (0.000) (0.000) (0.002) (0.002) (0.003) ibk 0.650*** 0.679*** 0.647*** 2.902*** 3.372*** 2.661***
(0.016) (0.015) (0.120) (0.176) (0.172) (0.323) ins 0.173*** 0.203*** 0.182*** 1.798*** 1.953*** 1.437***
(0.027) (0.023) (0.057) (0.275) (0.271) (0.443) roa 0.051* 0.604*** 0.244 -0.027 0.726** 1.150
(0.026) (0.031) (0.399) (0.320) (0.360) (1.110) ibk*size -0.056*** -0.055*** -0.056*** -0.263*** -0.305*** -0.237***
(0.002) (0.002) (0.012) (0.020) (0.020) (0.035) ins*size -0.016*** -0.018*** -0.017*** -0.174*** -0.186*** -0.135***
(0.003) (0.002) (0.006) (0.029) (0.028) (0.046) Constant 0.082*** 0.076*** 0.135*** -2.230*** -2.088*** -2.029***
(0.017) (0.014) (0.051) (0.178) (0.169) (0.218)
Observations 300 299 300 300 299 300 R-squared 0.973 0.743 0.821 0.700

61
Panel E: Interacting investment bank with firm size.
ROA σ(ROA) (1) (2) (3) (1) (2) (3) VARIABLES Median Robust OLS Median Robust OLS ln(at) -0.046*** -0.026* -0.128 0.068 0.064 0.066*
(0.013) (0.015) (0.149) (0.059) (0.043) (0.038) mb 5.222*** 3.419*** 6.535* 0.346* 0.554*** 0.579***
(0.049) (0.062) (3.372) (0.203) (0.174) (0.182) dir 0.041*** 0.048*** 0.220 -0.103 -0.165*** -0.160***
(0.015) (0.016) (0.201) (0.065) (0.047) (0.050) own -1.422*** -0.842*** -1.644 -1.312* -1.068* -1.057
(0.186) (0.215) (8.426) (0.755) (0.601) (0.690) age 0.010*** 0.010*** 0.031 -0.005 -0.007 -0.008
(0.002) (0.002) (0.022) (0.009) (0.006) (0.006) ibk -5.870*** -5.929*** -26.398** 4.244*** 3.940*** 3.779***
(0.219) (0.246) (11.431) (0.991) (0.769) (0.760) ins 0.194*** 0.082 0.390 -0.031 -0.079 -0.087
(0.067) (0.076) (0.695) (0.296) (0.220) (0.192) roa -3.971*** -3.322*** -3.177*
(1.466) (1.143) (1.642) leverage -3.261*** -3.404*** -10.240 -2.103** -1.817** -1.968***
(0.220) (0.267) (14.795) (0.994) (0.743) (0.756) ibk*size 0.490*** 0.487*** 2.524** -0.332*** -0.325*** -0.315***
(0.024) (0.027) (1.061) (0.106) (0.082) (0.078) Constant -2.036*** -0.253 0.534 -3.107*** -2.620*** -2.534***
(0.270) (0.316) (14.639) (1.194) (0.884) (0.912)
Observations 300 298 300 300 300 300 R-squared 0.930 0.287 0.557 0.563

62
Panel F: full interaction
ROA σ(ROA) (1) (2) (3) (1) (2) (3) VARIABLES Median Robust OLS Median Robust OLS ln(at) -0.049*** -0.024 -0.180 0.105* 0.091* 0.085**
(0.013) (0.016) (0.125) (0.057) (0.047) (0.043) mb 5.215*** 3.420*** 6.543* 0.546*** 0.544*** 0.574***
(0.045) (0.063) (3.377) (0.201) (0.174) (0.180) dir 0.040*** 0.048*** 0.221 -0.106* -0.166*** -0.160***
(0.013) (0.016) (0.201) (0.057) (0.047) (0.050) own -1.404*** -0.840*** -1.676 -1.140* -1.043* -1.045
(0.169) (0.216) (8.459) (0.675) (0.598) (0.679) age 0.009*** 0.010*** 0.037* -0.007 -0.010 -0.010
(0.002) (0.002) (0.021) (0.008) (0.006) (0.006) ibk -5.886*** -5.889*** -26.935** 4.918*** 4.245*** 3.984***
(0.207) (0.257) (11.813) (0.855) (0.793) (0.796) ins 0.161 0.181 -2.245 2.306* 1.316 0.873
(0.262) (0.354) (3.334) (1.203) (1.016) (1.208) roa -3.904*** -3.222*** -3.144*
(1.256) (1.137) (1.622) leverage -3.259*** -3.373*** -10.463 -0.897 -1.684** -1.884**
(0.200) (0.270) (14.988) (0.842) (0.744) (0.757) ibk*size 0.492*** 0.483*** 2.588** -0.400*** -0.361*** -0.339***
(0.023) (0.028) (1.106) (0.093) (0.085) (0.083) ins*size 0.005 -0.011 0.277 -0.240** -0.148 -0.101
(0.028) (0.036) (0.303) (0.122) (0.105) (0.131) Constant -2.005*** -0.290 1.021 -4.654*** -2.871*** -2.711***
(0.251) (0.324) (15.036) (1.055) (0.898) (0.919)
Observations 300 298 300 300 300 300 R-squared 0.930 0.288 0.563 0.564

63
We see that an increase in size is associated with a decrease in capital asset ratio at the 1%
significance level across all three estimation methods, consistent with Schmid and Walter (2009).
As for the economic effect, on average, a 10% percent increase in size translates into almost a
one percentage point reduction in capital asset ratio, holding other variables constant. Size
negatively affects return on asset, but only marginally, and size does not decrease earnings
volatility. These results indicate that the lower Z-score is driven primarily by a reduction in
capital, and the size-related economy of scale, if any, does not exist in the financial industry.
Indeed, a large body of empirical literature on the economies of scale of financial firms has
produced inconclusive results.
Our finding is also consistent with Geanakoplos (2010) who argues that extremely high
leverage in boom times has a huge impact on the price of assets, contributing to economic
bubbles and busts. He suggests that the Federal Reserve should manage system-wide leverage,
curtailing leverage in ebullient times, and propping up leverage in anxious times. This finding
has direct policy implications: instead of setting a size threshold, strengthening capital
requirements might be a more direct way to solve the excessive risk-taking problem as
pronounced in the FIs.
Beyond the revealing finding regarding how exactly size affects the Z-score, note that the
results from the specification on CAR in Table IX are consistent with several stylized facts
known from capital structure literature.30 For instance, market-to-book asset ratio is positively
correlated with CAR, ROA is negatively correlated with CAR, and the constant term, which can
30 See Frank and Goyal (2008) for a survey of literature on capital structure.

64
be thought of as a tangible asset, 31 is negatively correlated with CAR. These results are
consistent with the trade-off theory of capital structure.
The control variables also yield interesting and consistent findings. Corporate governance
(dir) is positively associated with ROA and negatively associated with earning volatility, but has
no effect on capital asset ratio. These results suggest better governance enhances firm
performance, consistent with Bhagat and Bolton (2008) who note a significant and positive
relationship between this variable and contemporaneous and next year’s operating performance.
These findings aid us in understanding more about the effect of variable dir on risk-taking as
shown in Table IV: the risk-reducing mechanism of corporate governance is mainly through an
increase in ROA and a reduction in earnings volatility. The market-to-book asset ratio enters
positively in all regressions in Table IX, and is significant at the 1% level. The coefficients on
age indicate that, all else being equal, experienced firms are more profitable, better capitalized,
and better at reducing stock return volatility, as they should be.
CHAPTER 5
Do financial firms of different size behave differently?
A. Specification
After having established that on average, larger firms are riskier than small firms, a natural
question to ask is: do firms of different size cohorts behave differently? Researchers have shown
that the status of TBTF itself has values. For instance, using an event study methodology, O’hara
and Shaw (1990) find a positive wealth effect accruing to TBTF banks. Brewer III and Jagtiani
(2009) document that financial firms were willing to pay at least $14 billion in added premiums
31 Financial firms usually have a relatively small portion of tangible assets, which can be thought of as constant in the specification.
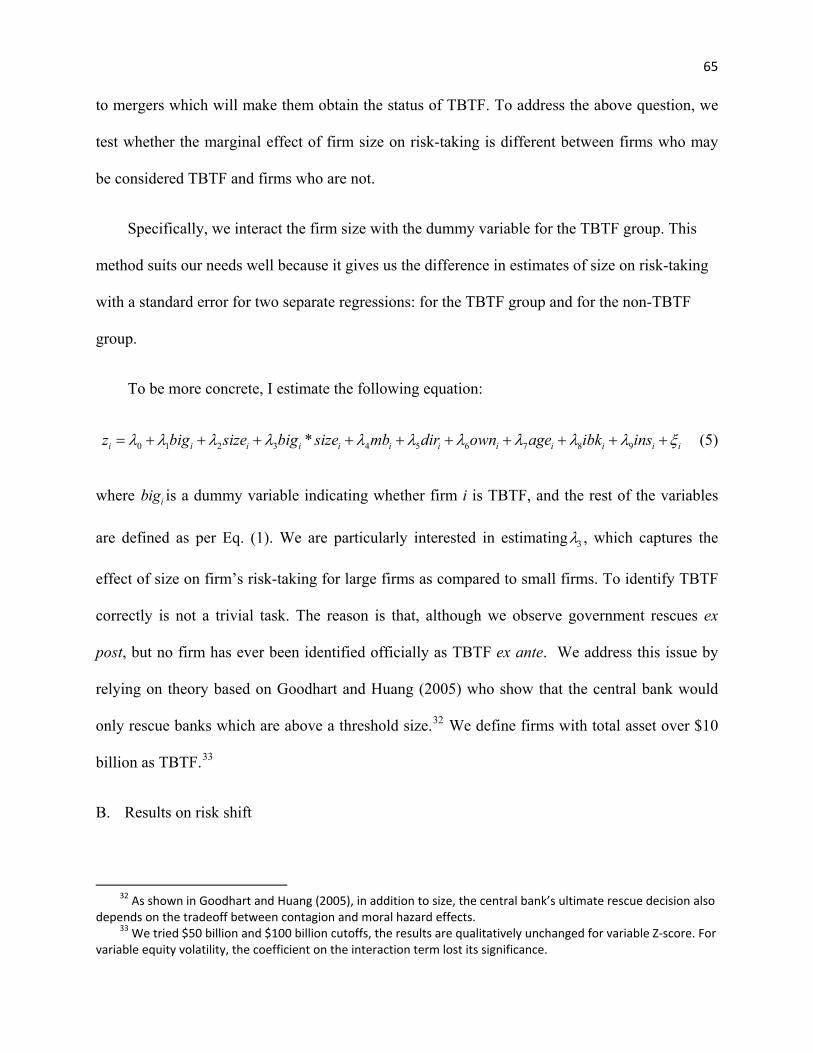
65
i i
to mergers which will make them obtain the status of TBTF. To address the above question, we
test whether the marginal effect of firm size on risk-taking is different between firms who may
be considered TBTF and firms who are not.
Specifically, we interact the firm size with the dummy variable for the TBTF group. This
method suits our needs well because it gives us the difference in estimates of size on risk-taking
with a standard error for two separate regressions: for the TBTF group and for the non-TBTF
group.
To be more concrete, I estimate the following equation:
0 1 2 3 4 5 6 7 8 9*i i i i i i i i i iz big size big size mb dir own age ibk insλ λ λ λ λ λ λ λ λ λ= + + + + + + + + + +ξ (5)
where is a dummy variable indicating whether firm i is TBTF, and the rest of the variables
are defined as per Eq. (1). We are particularly interested in estimating
ibig
3λ , which captures the
effect of size on firm’s risk-taking for large firms as compared to small firms. To identify TBTF
correctly is not a trivial task. The reason is that, although we observe government rescues ex
post, but no firm has ever been identified officially as TBTF ex ante. We address this issue by
relying on theory based on Goodhart and Huang (2005) who show that the central bank would
only rescue banks which are above a threshold size.32 We define firms with total asset over $10
billion as TBTF.33
B. Results on risk shift
32 As shown in Goodhart and Huang (2005), in addition to size, the central bank’s ultimate rescue decision also depends on the tradeoff between contagion and moral hazard effects. 33 We tried $50 billion and $100 billion cutoffs, the results are qualitatively unchanged for variable Z‐score. For variable equity volatility, the coefficient on the interaction term lost its significance.

66
The empirical literature on bank risk-shifting begins with Marcus and Shaked (1984), and it
occurs when the government is exposed to loss from increased asset volatility or leverage
without receiving corresponding adequate compensation for the risk entailed. Systemic FIs have
stronger incentives to engage in riskier activities due to the fact that the risk-shifting is
subsidized: the cost of becoming TBTF is far less than the value of the explicit and implicit
government guarantees.
Results for risk-shifting are shown in Table X with the raw Z-score, the log of Z-score and
equity volatility as respective dependent variables. Again, the results with three estimation
methods are presented. The variable of interest is the interaction term (big_size). The sign on
big_size is negative, meaning an increase in size is associated with greater decrease in Z-score
(and ln(Z-score)) for big firms than for small firms, but it is not significant at conventional level.
The coefficient on big seems contradictory to our previous finding that larger firms are
associated with higher risk-taking. Our explanation is that, for this particular specification, the
coefficient on big tests whether there is difference in risk-taking between big and small firms
when firm size equals zero, which does not bear any meaningful interpretation. Consistent with
the findings in Table IV, governance variable (dir) has a significant effect in reducing firm risk-
taking; investment banks are riskier than commercial banks.
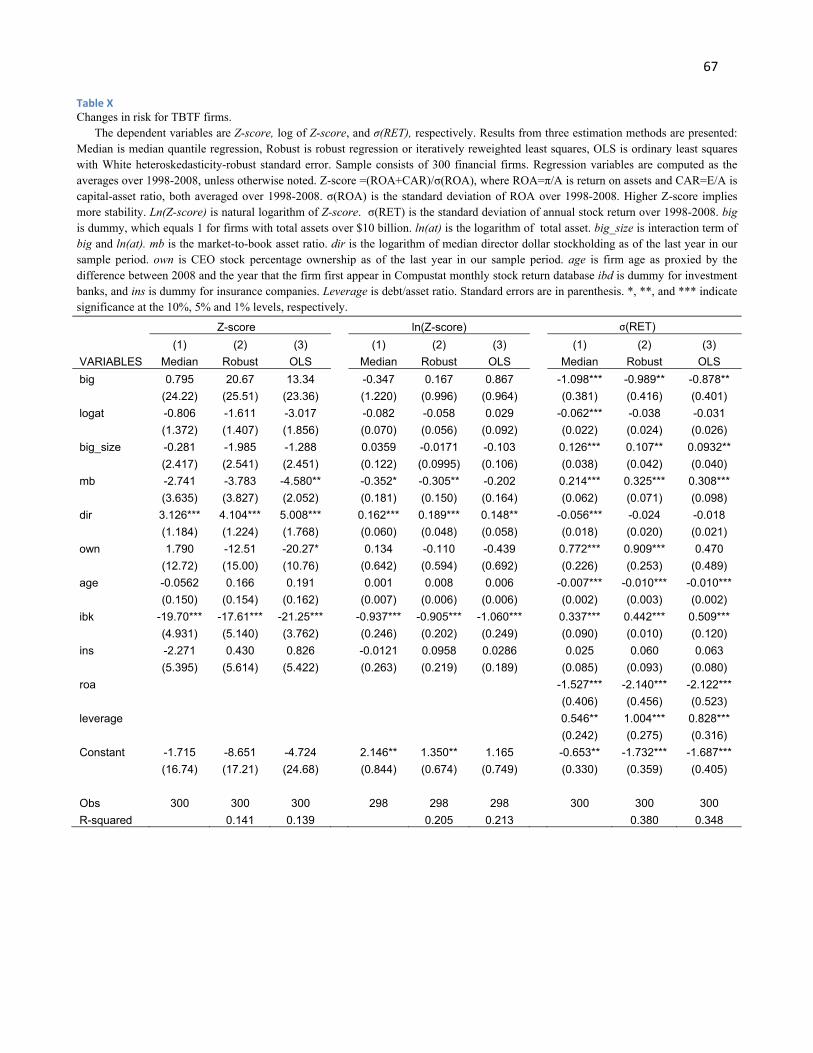
67
Table X Changes in risk for TBTF firms. The dependent variables are Z-score, log of Z-score, and σ(RET), respectively. Results from three estimation methods are presented: Median is median quantile regression, Robust is robust regression or iteratively reweighted least squares, OLS is ordinary least squares with White heteroskedasticity-robust standard error. Sample consists of 300 financial firms. Regression variables are computed as the averages over 1998-2008, unless otherwise noted. Z-score =(ROA+CAR)/σ(ROA), where ROA=π/A is return on assets and CAR=E/A is capital-asset ratio, both averaged over 1998-2008. σ(ROA) is the standard deviation of ROA over 1998-2008. Higher Z-score implies more stability. Ln(Z-score) is natural logarithm of Z-score. σ(RET) is the standard deviation of annual stock return over 1998-2008. big is dummy, which equals 1 for firms with total assets over $10 billion. ln(at) is the logarithm of total asset. big_size is interaction term of big and ln(at). mb is the market-to-book asset ratio. dir is the logarithm of median director dollar stockholding as of the last year in our sample period. own is CEO stock percentage ownership as of the last year in our sample period. age is firm age as proxied by the difference between 2008 and the year that the firm first appear in Compustat monthly stock return database ibd is dummy for investment banks, and ins is dummy for insurance companies. Leverage is debt/asset ratio. Standard errors are in parenthesis. *, **, and *** indicate significance at the 10%, 5% and 1% levels, respectively.
Z-score ln(Z-score) σ(RET) (1) (2) (3) (1) (2) (3) (1) (2) (3)
VARIABLES Median Robust OLS Median Robust OLS Median Robust OLS big 0.795 20.67 13.34 -0.347 0.167 0.867 -1.098*** -0.989** -0.878**
(24.22) (25.51) (23.36) (1.220) (0.996) (0.964) (0.381) (0.416) (0.401) logat -0.806 -1.611 -3.017 -0.082 -0.058 0.029 -0.062*** -0.038 -0.031
(1.372) (1.407) (1.856) (0.070) (0.056) (0.092) (0.022) (0.024) (0.026) big_size -0.281 -1.985 -1.288 0.0359 -0.0171 -0.103 0.126*** 0.107** 0.0932**
(2.417) (2.541) (2.451) (0.122) (0.0995) (0.106) (0.038) (0.042) (0.040) mb -2.741 -3.783 -4.580** -0.352* -0.305** -0.202 0.214*** 0.325*** 0.308***
(3.635) (3.827) (2.052) (0.181) (0.150) (0.164) (0.062) (0.071) (0.098) dir 3.126*** 4.104*** 5.008*** 0.162*** 0.189*** 0.148** -0.056*** -0.024 -0.018
(1.184) (1.224) (1.768) (0.060) (0.048) (0.058) (0.018) (0.020) (0.021) own 1.790 -12.51 -20.27* 0.134 -0.110 -0.439 0.772*** 0.909*** 0.470
(12.72) (15.00) (10.76) (0.642) (0.594) (0.692) (0.226) (0.253) (0.489) age -0.0562 0.166 0.191 0.001 0.008 0.006 -0.007*** -0.010*** -0.010***
(0.150) (0.154) (0.162) (0.007) (0.006) (0.006) (0.002) (0.003) (0.002) ibk -19.70*** -17.61*** -21.25*** -0.937*** -0.905*** -1.060*** 0.337*** 0.442*** 0.509***
(4.931) (5.140) (3.762) (0.246) (0.202) (0.249) (0.090) (0.010) (0.120) ins -2.271 0.430 0.826 -0.0121 0.0958 0.0286 0.025 0.060 0.063
(5.395) (5.614) (5.422) (0.263) (0.219) (0.189) (0.085) (0.093) (0.080) roa -1.527*** -2.140*** -2.122***
(0.406) (0.456) (0.523) leverage 0.546** 1.004*** 0.828***
(0.242) (0.275) (0.316) Constant -1.715 -8.651 -4.724 2.146** 1.350** 1.165 -0.653** -1.732*** -1.687***
(16.74) (17.21) (24.68) (0.844) (0.674) (0.749) (0.330) (0.359) (0.405)
Obs 300 300 300 298 298 298 300 300 300 R-squared 0.141 0.139 0.205 0.213 0.380 0.348

68
Regression results with equity volatility as a dependent variable from the last panel in Table
X are interesting. The coefficient on logat measures the effect of size on risk-taking for small
firms only; they are negative and significant in the median regression, indicating size-related
diversification only exists for firms below a certain threshold size; once firms pass this threshold,
the diversification effect either disappears or attenuates significantly. Finding on roa and
leverage are consistent with Table V as well.
Based on findings from Table X, we conclude that there is no significant evidence that big
firms behave differently than small firms, which is inconsistent with H4.
CHAPTER 6
Policy Implications
The recent financial crisis of 2008 has eroded the economic net worth of many financial
institutions. The consensus has been that TBTF financial firms took too much risk prior to the
crisis. Regarding remedies, many opinions have been expressed such as capping the size of
firms. However, given the difficulty of correctly identifying TBTF financial institutions, serious
concerns have been raised with this simple size constraint. In this paper, we went one step further
to find out that, although we do observe a positive association between firm size and risk-taking,
what is really going on behind the scene is that these firms have taken too much leverage. This
finding has important implications for policy makers: regulations designed to rein in the risk-
taking of financial firms should focus more on capital requirements,34 this suggestion is also
reinforced by the fact that leverage is positively associated with equity volatility. As Judah S.
Kraushaar, managing director of Roaring Brook Capital, L.P., pointed out, “attacking excessive
34 To be clear, what is the optimal capital requirement policy is a question deserving future research and beyond the scope of this paper. Kashyap, Rajan and Stein (2008) have a discussion about this question.

69
leverage in the banking system may go a long way toward dampening the boom-bust cycle that
has become alarmingly intense in recent decades”35.
As a suggestion, for example, regulators can set capital requirements in such a way that they
are proportionate in size36. The common concern for raising capital is that equity is “expensive”
and capital adversely affects bank value. However, recent study on bank capital challenges this
view and provides theoretical and empirical evidence that total bank value and the bank’s equity
capital are positively correlated in the cross-section (Mehran and Thakor, 2010). We agree that
such solution may not be optimal,37 but it has the advantage of tackling the problem from the
root: correcting the distortion in risk-taking incentives. This becomes even more relevant when
policy makers are faced with the thorny problem of correctly categorizing TBTF banks along
with other obstacles mentioned earlier.
Our second finding that corporate governance, measured as median director dollar stock
ownership, can significantly influence firm’s risk-taking also bears its own merits. This measure
is rather simple and intuitive compared with standard governance indices, thus it is relatively
easier for corporate boards to implement when making risk management policies. Our last
finding that investment banks are consistently riskier than commercial banks reminds us of the
watershed events of the 1930s when the so-called Glass-Steagall Act was passed to prohibit
35 “Banks Need Clear Capital Rules”, the Wall Street Journal, January 22, 2010. 36 This point is similar to the recommendation in The Squam Lake Report, where it argues that, if everything else is the same, large banks should face higher capital requirements than small banks. This idea has also been proposed by Congressional Oversight Panel as one way to limit excessive risk‐taking (see, Congressional Oversight Panel, 2009, p. 26). “Of Banks and Bonus”, New York Times, July 27, 2009, has similar arguments as well. 37 Hellmann, Murdock, and Stiglitz (2000) argue that it is impossible to implement any Pareto‐efficient outcome using just capital requirements as the tool of prudential regulation. They propose a combination of deposit rate controls and capital requirements. However, their arguments only apply to deposit‐taking financial firms. Marshall and Prescott (2001) have similar arguments.

70
firms with a commercial banking charter from conducting security business. It provides
justification for the functional separation of investment banking from universal banking.

71
References
Aggarwal, Rajesh K., and Andrew A. Samwick. 1999. The other side of the trade-off: The impact of risk on executive compensation. Journal of Political Economy 107 : 65-105.
Agrawal, Anup, and Gershon N. Mandelker. 1987. Managerial incentives and corporate investment and financing decisions. Journal of Finance 42 : 823-37.
Allen, Linda, and Julapa Jagtiani. 1997. Risk and market segmentation in financial intermediaries' returns. Journal of Financial Services Research 12 : 159-73.
Amihud, Yakov, and Baruch Lev. 1981. Risk reduction as a managerial motive for conglomerate mergers. Bell Journal of Economics 12 : 605-17.
Baker, George P., and Brian J. Hall. 2004. CEO incentives and firm size. Journal of Labor Economics 22 : 767-98.
Baker, Dean, and Travis McArthur. 2009. The value of the "too big to fail" big bank subsidy. Center for Economic and Policy Research Paper.
Balachandran, Sudhakar, Bruce Kogut, and Hitesh Harnal. 2010. Did executive compensation encourage excessive risk-taking in financial institutions? Columbia Working Paper.
Bebchuk, Lucian, and Alma Cohen. 2003. Firms' decisions where to incorporate. Journal of Law and Economics XLVI : 383-425.
Bebchuk, Lucian, Alma Cohen, and Allen Ferrell. 2009. What matters in corporate governance? Review of Financial Studies 22 : 783-827.
Beltratti, Andrea, and Rene M. Stulz. 2010. The credit crisis around the globe: Why did some banks perform better? Fisher College of Business Working Paper no. 2010-03-005.
Bernanke, Ben S. 1983. Nonmonetary effects of the financial crisis in the propagation of the great depression. American Economic Review 73 : 257-76.
Bhagat, Sanjai, and Brian Bolton. 2008. Corporate governance and firm performance. Journal of Corporate Finance 14 : 257-73.
Bhagat, Sanjai, Brian Bolton, and Roberta Romano. 2008. The promise and peril of corporate governance indices. Columbia Law Review 108 : 1803-82.
Bhagat, Sanjai, and Roberta Romano. 2002. Event studies and the law: Part II: Empirical studies of corporate law. American Law and Economics Review 4 : 380-423.
Black, Bernard S. 1990. Is corporate law trivial? a political and economic analysis. Northwestern Law Review 84 : 542-97.

72
Black, Fischer, and Myron Scholes. 1973. The pricing of options and corporate liability. Journal of Political Economy 81 : 637-54.
Bound, John, David A. Jaeger, and Regina M. Baker. 1995. Problems with instrumental variables estimation when the correlation between the instruments and the endogenous explanatory variable is weak. Journal of the American Statistical Association 90 (430): 443-50.
Boyd, John H., Gianni De Nicolo, and Abu M. Jalal. 2006. Bank risk-taking and competition revisited: New theory and new evidence. IMF Working Paper no. WP/06/297, International Monetary Fund.
Boyd, John H., Ravi Jagannathan, and Sungkyu Kwak. 2009. What caused the current financial mess and what can we do about it? Journal of Investment Management 7 : 1-17.
Boyd, John H., and David E. Runkle. 1993. Size and performance of banking firms: Testing the predictions of theory. Journal of Monetary Economics 31 : 47-67.
Brewer III, Elijah, and Julapa Jagtiani. 2009. How much did banks pay to become too-big-to-fail and to become systemically important? Federal Reserve Bank of Philadelphia Working Paper.
Brown, Lawrence D., and Marcus L. Caylor. 2006. Corporate governance and firm valuation. Journal of Accounting and Public Policy 25 : 409-34.
Calomiris, Charles W., and Joseph R. Mason. 2003. Consequences of US bank distress during the depression. American Economic Review 93 : 937-47.
———. 2003. Fundamentals, panic and bank distress during the depression. American Economic Review 93 : 1615-47.
———. 1997. Contagion and bank failure during the great depression: The chicago banking panic of june 1932. American Economic Review 87 : 863-84.
Cameron, A. Colin, and Pravin K. Trivedi. 2005. Microeconometrics: Methods and applicationsCambridge University Press.
Carletti, Elena, and Philipp Hartmann. 2003. Competition and stability: What's special about banking? European Central Bank Working Paper no. 146.
Cheng, Ing-Haw, Harrison Hong, and Jose A. Scheinkman. 2010. Yesterday's heroes: Compensation and creative risk-taking. NBER Working Paper.
Chesney, Marc, Jacob Stromberg, and Alexander F. Wagner. 2010. Risk-taking incentives, governance, and losses in the financial crisis. Swiss Finance Institute Research Paper no. 10-18.
73
Congressional Oversight Panel. January 2009. Special report on regulatory reform.
Daines, Robert. 2001. Does delaware law improve firm value? Journal of Financial Economics 62 : 525-58.
De Nicolo, Gianni. 2000. Size, charter value and risk in banking: An international perspective. International Finance Discussion Paper no. 689, Board of Governors of the Federal Reserve System.
Demirguc-Kunt, Asli, and Harry Huizinga. 2011. Do we need big banks? evidence on performance, strategy and market descipline. European Banking Center Discussion Paper no. 2011-005.
Demsetz, Rebecca S., Marc R. Saidenberg, and Philip E. Strahan. 1997. Agency problems and risk taking at banks. Federal Reserve Bank of New York Working Paper.
Demsetz, Rebecca S., and Philip E. Strahan. 1997. Diversification, size, and risk at bank holding companies. Journal of Money, Credit, and Banking 29 : 300-13.
Dermine, Jean, and Dirk Schoenmaker. 2010. In banking, is small beautiful? Financial Markets, Institutions & Instruments 19 : 1-19.
Diamond, Douglas W., and Raghuram G. Rajan. 2009. The credit crisis: Conjectures about causes and remedies. American Economic Review: Papers & Proceedings 99 (2): 606-10.
———. 2001. Liquidity risk, liquidity creation, and financial fragility: A theory of banking. Journal of Political Economy 109 : 287-327.
Fahlenbrach, Rudiger, and Rene M. Stulz. 2009. Bank CEO incentives and the credit crisis. NBER Working Paper.
Fama, Eugene F., and Kenneth R. French. 1992. The cross-section of expected stock returns. Journal of Finance 47 : 427-65.
Fisch, Jill E. 2000. The peculiar role of the delaware courts in the competition for corporate charters. University of Cincinnati Law Review.
Frank, Murray Z., and Vidhan K. Goyal. 2008. Tradeoff and pecking order theories of debt. In Handbook of corporate finance: Empirical corporate finance., ed. B. Espen Eckbo. Vol. 2North Holland.
French, Kenneth R. 2010. The squam lake report: Fixing the financial systemPrinceton University Press.
Galloway, Tina M., Winson B. Lee, and Dianne M. Roden. 1997. Banks' changing incentives and opportunities for risk taking. Journal of Banking & Finance 21 : 509-27.

74
Geanakoplos, John. 2010. The leverage cycle. Cowles Foundation Discussion Paper no. 1715R.
Gompers, Paul, Joy Ishii, and Andrew Metrick. 2003. Corporate governance and equity prices. Quarterly Journal of Economics 118 : 107-55.
Goodhart, Charles A. E., and Haizhou Huang. 2005. The lender of last resort. Journal of Banking & Finance 29 : 1059-82.
Goyal, Vidhan K. 2005. Market discipline of bank risk: Evidence from subordinated debt contracts. Journal of Financial Intermediation 14 : 318-50.
Hamilton, Lawrence C. 1991. How robust is robust regression? Stata Technical Bulletin 2 : 21-6.
Hellmann, Thomas F., Kevin C. Murkock, and Joseph E. Stiglitz. 2000. Liberalization, moral hazard in banking, and prudential regulation: Are capital regulation enough? American Economic Review 90 : 147-65.
Houston, Joel F., Chen Lin, Ping Lin, and Yue Ma. 2010. Creditor rights, information sharing, and bank risk taking. Journal of Financial Economics 96 (3): 485-512.
Hughes, Joseph P., and Loretta J. Mester. 1998. Bank capitalization and cost: Evidence of scale economies in risk management and signaling. The Review of Economics and Statistics: 314-25.
Hughes, Joseph P., Loretta J. Mester, and Choon-Geol Moon. 2001. Are scale economies in banking elusive or illusive? evidence obtained by incorporating capital structure and risk-taking into models of bank production. Journal of Banking & Finance 25 : 2169-208.
Jensen, Michael, and William Meckling. 1976. Theory of the firm: Managerial behavior, agency costs, and ownership structure. Journal of Financial Economics 3 : 305-60.
John, Kose, Lubomir Litov, and Bernard Yeung. 2008. Corporate governance and risk-taking. Journal of Finance 4 : 1679-728.
Kashyap, Anil K., Raghuram G. Rajan, and Jeremy C. Stein. 2008. Rethinking capital regulation. University of Chicago Working Paper.
Keely, Michael C. 1990. Deposit insurance, risk, and market power in banking. American Economic Review 80 : 1183-200.
Kraushaar, Judah S. January 21, 2010. Banks need clear capital rules. The Wall Street Journal.
Kwast, Myron L. 13. The impact of underwriting and dealing on bank returns and risks. Journal of Banking & Finance: 101-25.
75
Laeven, Luc, and Ross Levine. 2009. Bank governance, regulation and risk-taking. Journal of Financial Economics 93 : 259-75.
Marcus, Alan J., and Isreal Shaked. 1984. The valuation of FDIC deposit insurance using option-pricing estimates. Journal of Money, Credit, and Banking 16 : 446-60.
Marshall, David, and Edward Prescott. Bank capital regulation with and without state contingent penalties. Carnegie Rochester Series 54 : 139-84.
Mehran, Hamid, and Anjan Thakor. 2010. Bank capital and value in the cross-section. Review of Financial Studies.
Morgan, Donald P., and Kevin J. Stiroh. 2005. Too big to fail after all these years. Federal Reserve Bank of New York Staff Reports.
O'hara, Maureen, and Wayne Shaw. 1990. Deposit insurance and wealth effects: The value of being "too big to fail". Journal of Finance 45 : 1587-600.
Paletta, Damian, Deborah Solomon, and David Enrich. January 14, 2010. White house's tax proposal targets big banks' risks. The Wall Street Journal.
Paletta, Damian, and Jonathan Weisman. January 21, 2010. Proposal set to curb bank giants. The Wall Street Journal.
Petersen, Mitchell A. 2009. Estimating standard errors in finance data sets: Comparing approaches. The Review of Financial Studies 22 : 435-80.
Rajan, Raghuram G. 2006. Has finance made the world riskier? European Financial Management 12 : 499-533.
Rime, Bertrand. 2005. Do "too big to fail" expectations boost large banks issuer ratings? Swiss National Bank Research Paper.
Romano, Roberta. 1985. Law as a product: Some pieces of the incorporation puzzle. Journal of Law, Economics and Organization 1 : 225-83.
Saunders, Anthony, Elizabath Strock, and Nickolaos G. Travlos. 1990. Ownership structure, deregulation, and bank risk taking. Journal of Finance 45 : 643-54.
Schmid, Markus M., and Ingo Walter. 2009. Do financial conglomerates create or destroy economic value? Journal of Financial Intermediation 18 : 193-216.
Smith, Cliford W., and Rene M. Stulz. 1985. The determinants of firms' hedging policies. Journal of Financial and Quantitative Analysis 20 : 391-405.
76
Staiger, Douglas, and James H. Stock. Instrumental variables regression with weak instruments. Econometrica 65 (3): 557-86.
Stern, Gary H., and Ron Feldman. 2009. Addressing TBTF by shrinking financial institutions: An initial assessment. The Region.
Stiroh, Kevin J. 2006. New evidence on the determinants of bank risk. Journal of Financial Services Research 30 : 237-63.
Stock, James H., and Motohiro Yogo. 2005. Testing for weak instruments in linear IV regression. In Identification and inference for econometric models: Essays in honor of thomas rothenberg., eds. Donald W. K. Andrews, James H. Stock, 80-108Cambridge: Cambridge University Press.
Tannenbaum, Carl, and Richard Rosen. 2009. The art and science of risk management. Federal Reserve Bank of Chicago Annual Report, .
Vyas, Dushyantkumar. 2011. The timeliness of accounting write-downs by U.S. financial institutions during the financial crisis of 2007-2008. Journal of Accounting Research 49 (3): 823-60.
Walter, Ingo. 2009. The new case for functional separation in wholesale financial services. New York University Working Paper.
White, Halbert. 1980. A heteroskedasticity-consistent covariance matrix estimator and a direct test for heteroskedasticity. Econometrica 48 : 817-38.

77
/
Appendix A Theoretical development of Z‐score (Boyd and Runkle (1993)) Notation: let
, , , / ,profits A assets E equity k E A r Aπ π= = = =− =% % %
In their paper, Z‐score is a measure of probability of failure, which is a state when losses exceed equity:
( ) ( ) ( )k
p E p r k r dπ φ−∞
< − = < = ∫% % r%
If we assume that:
( , )r N ρ σ%
here ρ and σ is the population mean and standard deviation of return on asset, respectively.
Then:
( )p r k<% ( ( ) /p k )τ ρ σ= < −
( )/(0,1)
kN d
ρ στ
−
−∞= ∫
( / / )/(0,1)
E A AN d
π στ
− +
−∞= ∫
(0,1)zN dτ
−
−∞= ∫
here τ is standard normal random variable, N(0,1) is standard normal PDF.
We thus have:
/ /( )
E A A CAR ROAzROA
πσ σ+ +
= =

78
Appendix B Capital Asset Ratio
Definitions:
Tier 1 capital ratio = Tier 1 capital / Risk-adjusted assets
Total capital (Tier 1 and Tier 2) ratio = Total capital (Tier 1 and Tier 2) / Risk-adjusted assets
Leverage ratio = Tier 1 capital / Average total consolidated assets
Common stockholders’ equity ratio = Common stockholders’ equity / Balance sheet assets
Illustration:
In millions of dollars at year-end 2003 2007 2008 Tier 1 capital
Common stockholders’ equity $96,889 $113,447 $70,966 Qualifying perpetual preferred stock 1,125 70,664 Qualifying mandatorily redeemable securities of subsidiary trusts 6,257 23,594 23,899 Minority interest 1,158 4,077 1,268 Total Tier 1 capital $66,871 $89,226 $118,758 Tier 2 capital
Allowance for credit losses 9,545 15,778 12,806 Qualifying debt 13,573 26,690 24,791 Total Tier 2 capital $23,472 $44,895 $37,640 Total capital (Tier 1 and Tier 2) $90,343 $134,121 $156,398 Risk-adjusted assets $750,293 $1,253,321 $996,247
Ratios:
At year-end 2003 2007 2008
Tier 1 capital 8.91% 7.12% 11.92%
Total capital (Tier 1 and Tier 2) 12.04% 10.70% 15.70%
Leverage 5.56% 4.03% 6.08%
Common stockholders’ equity 7.67% 5.19% 3.66%
Source: Citigroup 10-K Note: some items are omitted due to space limit, so numbers may not add up.

79
Appendix C Variable definitions and data sources.
Variable Definition Original sources
Risk measures
Z‐score equals (ROA+CAR/σ(ROA), where ROA=π/A is return on assets and Compustat CAR =E/A is capital‐asset ratio where E equals total liability – total asset, both averaged over 1998‐2008.
σ(ROA) is the standard deviation of ROA over 1998‐2008. Higher Z
implies more stability
ln(Z‐score) equals natural logarithm of Z‐score
ROA Return on assets, averaged over 1998‐2008. Higher value implies more Compustat
stability
CAR Capital asset ratio, averaged over 1998‐2008. Higher value implies more Compustat
stability
σ(ROA) Equals standard deviation of ROA, computed over 1998‐2008 Compustat
σ(RET) equals standard deviation of RET, computed over 1998‐2008. RET is CRSP
annual stock return from 1998 to 2008
write‐down Sum of accounting write‐down for 2007 and 2008 Bloomberg and 10‐K, 10‐Q
Controls
size equals the natural logarithm of the average total asset over 1998‐2008 Compustat
ln(rev) equals the natural logarithm of the average total revenue over Compustat
1998‐2008
mb equals the market‐to‐book value, averaged over 1998‐2008 Compustat
dir equals the median director dollar stockholding as of the last year of RiskMetrics and
the sample period Proxy statement
own equals the percentage of CEO stock ownership, as of the last year of RiskMetrics and
the sample period Proxy statement
age Firm age, calculated as the difference between 2008 and the year that Compustat
firms first appear in the Compustat monthly stock return database
leverage equal total liability divided by total asset, averaged over 1998‐2008 Compustat
ibk a dummy variable that equals one if investment bank, zero otherwise Compustat
ins a dummy variable that equals one if insurance company, zero otherwise Compustat
big equals 1 if total asset is over $10billions, 0 otherwise
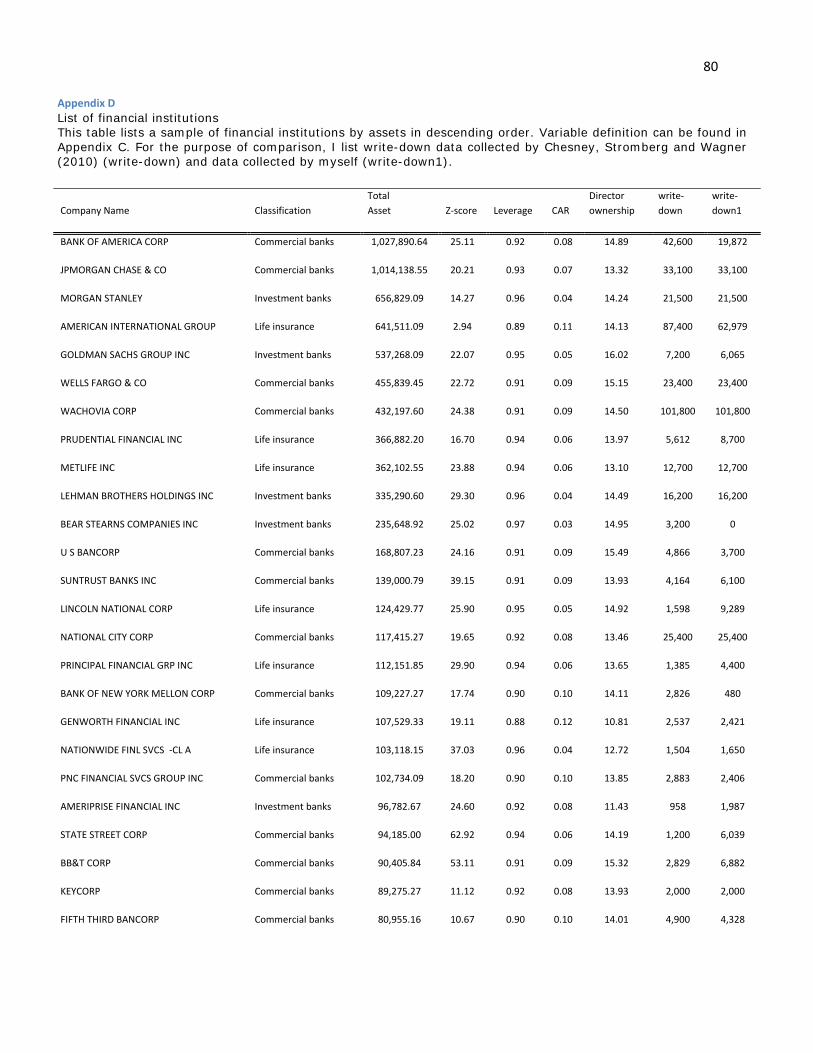
80
Appendix D List of financial institutions This table lists a sample of financial institutions by assets in descending order. Variable definition can be found in Appendix C. For the purpose of comparison, I list write-down data collected by Chesney, Stromberg and Wagner (2010) (write-down) and data collected by myself (write-down1).
Company Name Classification Total Asset Z‐score Leverage CAR
Director ownership
write‐ down
write‐ down1
BANK OF AMERICA CORP Commercial banks 1,027,890.64 25.11 0.92 0.08 14.89 42,600 19,872
JPMORGAN CHASE & CO Commercial banks 1,014,138.55 20.21 0.93 0.07 13.32 33,100 33,100
MORGAN STANLEY Investment banks 656,829.09 14.27 0.96 0.04 14.24 21,500 21,500
AMERICAN INTERNATIONAL GROUP Life insurance 641,511.09 2.94 0.89 0.11 14.13 87,400 62,979
GOLDMAN SACHS GROUP INC Investment banks 537,268.09 22.07 0.95 0.05 16.02 7,200 6,065
WELLS FARGO & CO Commercial banks 455,839.45 22.72 0.91 0.09 15.15 23,400 23,400
WACHOVIA CORP Commercial banks 432,197.60 24.38 0.91 0.09 14.50 101,800 101,800
PRUDENTIAL FINANCIAL INC Life insurance 366,882.20 16.70 0.94 0.06 13.97 5,612 8,700
METLIFE INC Life insurance 362,102.55 23.88 0.94 0.06 13.10 12,700 12,700
LEHMAN BROTHERS HOLDINGS INC Investment banks 335,290.60 29.30 0.96 0.04 14.49 16,200 16,200
BEAR STEARNS COMPANIES INC Investment banks 235,648.92 25.02 0.97 0.03 14.95 3,200 0
U S BANCORP Commercial banks 168,807.23 24.16 0.91 0.09 15.49 4,866 3,700
SUNTRUST BANKS INC Commercial banks 139,000.79 39.15 0.91 0.09 13.93 4,164 6,100
LINCOLN NATIONAL CORP Life insurance 124,429.77 25.90 0.95 0.05 14.92 1,598 9,289
NATIONAL CITY CORP Commercial banks 117,415.27 19.65 0.92 0.08 13.46 25,400 25,400
PRINCIPAL FINANCIAL GRP INC Life insurance 112,151.85 29.90 0.94 0.06 13.65 1,385 4,400
BANK OF NEW YORK MELLON CORP Commercial banks 109,227.27 17.74 0.90 0.10 14.11 2,826 480
GENWORTH FINANCIAL INC Life insurance 107,529.33 19.11 0.88 0.12 10.81 2,537 2,421
NATIONWIDE FINL SVCS ‐CL A Life insurance 103,118.15 37.03 0.96 0.04 12.72 1,504 1,650
PNC FINANCIAL SVCS GROUP INC Commercial banks 102,734.09 18.20 0.90 0.10 13.85 2,883 2,406
AMERIPRISE FINANCIAL INC Investment banks 96,782.67 24.60 0.92 0.08 11.43 958 1,987
STATE STREET CORP Commercial banks 94,185.00 62.92 0.94 0.06 14.19 1,200 6,039
BB&T CORP Commercial banks 90,405.84 53.11 0.91 0.09 15.32 2,829 6,882
KEYCORP Commercial banks 89,275.27 11.12 0.92 0.08 13.93 2,000 2,000
FIFTH THIRD BANCORP Commercial banks 80,955.16 10.67 0.90 0.10 14.01 4,900 4,328

81
REGIONS FINANCIAL CORP Commercial banks 78,609.52 7.43 0.90 0.10 14.08 10,382 10,597
COMERICA INC Commercial banks 51,502.12 25.51 0.91 0.09 14.00 1,523 1,026
NORTHERN TRUST CORP Commercial banks 47,478.26 58.09 0.93 0.07 13.18 283 182
M & T BANK CORP Commercial banks 43,839.52 51.35 0.90 0.10 14.27 309 786
UNIONBANCAL CORP Commercial banks 42,569.22 60.15 0.91 0.09 11.70 615 795
SCHWAB (CHARLES) CORP Investment banks 41,199.04 7.38 0.91 0.09 14.80 75 276
MARSHALL & ILSLEY CORP Commercial banks 39,234.56 7.52 0.90 0.10 14.35 5,511 2,300
POPULAR INC Commercial banks 36,476.47 6.14 0.93 0.07 16.48 1,333 807
HUNTINGTON BANCSHARES Commercial banks 34,732.61 18.09 0.91 0.09 14.20 1,701 2,200
ZIONS BANCORPORATION Commercial banks 33,448.05 20.97 0.91 0.09 15.19 565 1,000
E TRADE FINANCIAL CORP Investment banks 29,426.68 8.95 0.89 0.11 13.53 5,382 3,655
FIRST HORIZON NATIONAL CORP Commercial banks 26,992.31 10.34 0.93 0.07 13.48 1,461 1,143
PROTECTIVE LIFE CORP Life insurance 25,791.57 21.87 0.93 0.07 12.81 587 1,650
SYNOVUS FINANCIAL CORP Commercial banks 22,600.93 11.95 0.89 0.11 14.93 1,456 1,269
COLONIAL BANCGROUP Commercial banks 17,565.28 6.00 0.93 0.07 13.06 1,910 2,108
ASSOCIATED BANC‐CORP Commercial banks 17,278.21 47.38 0.91 0.09 14.25 467 113
WEBSTER FINANCIAL CORP Commercial banks 14,259.03 11.07 0.91 0.09 14.04 551 842
COMMERCE BANCSHARES INC Commercial banks 13,774.55 71.57 0.90 0.10 13.61 187 164
TORCHMARK CORP Life insurance 13,396.81 52.26 0.79 0.21 14.40 115 194
TCF FINANCIAL CORP Commercial banks 12,726.97 27.19 0.92 0.08 15.06 384 384
FIRST BANCORP P R Commercial banks 12,253.73 23.83 0.93 0.07 13.60 351 740
JEFFERIES GROUP INC Investment banks 11,550.13 8.51 0.90 0.10 13.97 267 24
BANK OF HAWAII CORP Commercial banks 11,348.91 23.17 0.92 0.08 14.16 120 81
TD AMERITRADE HOLDING CORP Investment banks 10,752.83 5.20 0.90 0.10 13.21 36 28,324
FULTON FINANCIAL CORP Commercial banks 10,453.88 24.67 0.90 0.10 14.90 200 331
FIRSTMERIT CORP Commercial banks 10,077.32 54.64 0.91 0.09 13.79 89 166
SOUTH FINANCIAL GROUP INC Commercial banks 9,636.92 7.42 0.90 0.10 12.56 1,116 1,264
WILMINGTON TRUST CORP Commercial banks 9,090.36 19.10 0.91 0.09 13.74 341 291
RAYMOND JAMES FINANCIAL CORP Investment banks 8,999.96 39.66 0.87 0.13 13.06 18 105
UMB FINANCIAL CORP Commercial banks 8,495.63 111.09 0.91 0.09 12.73 27 57
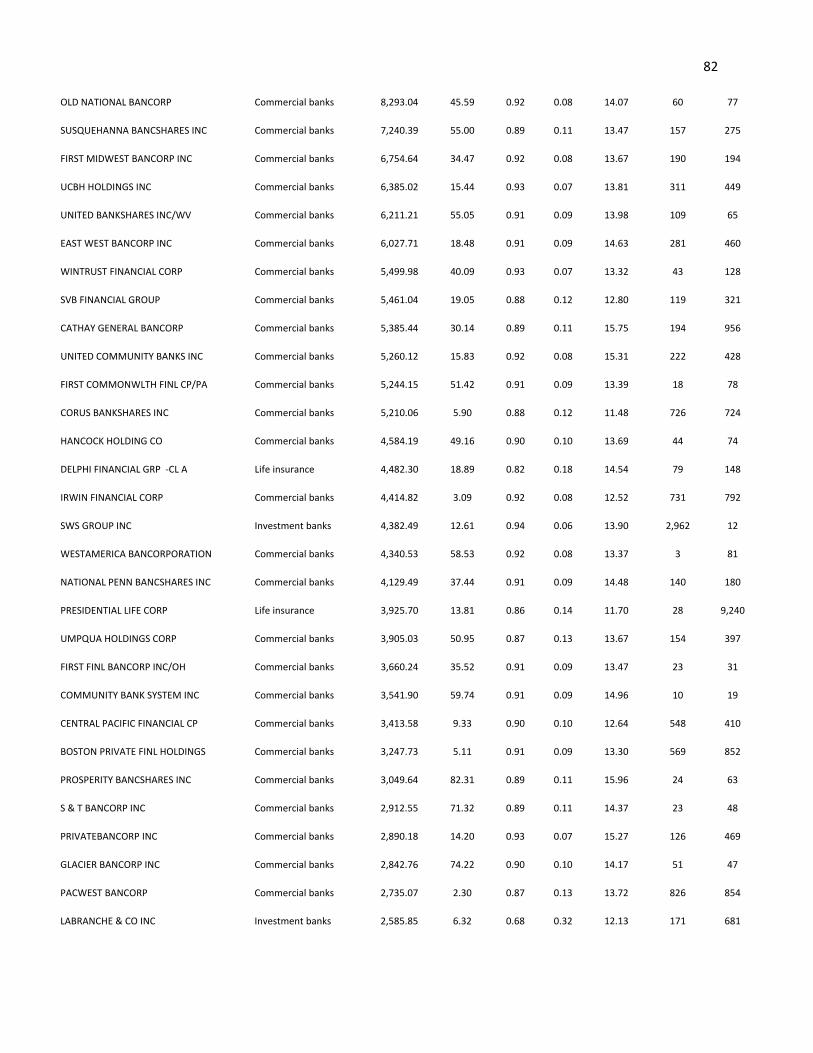
82
OLD NATIONAL BANCORP Commercial banks 8,293.04 45.59 0.92 0.08 14.07 60 77
SUSQUEHANNA BANCSHARES INC Commercial banks 7,240.39 55.00 0.89 0.11 13.47 157 275
FIRST MIDWEST BANCORP INC Commercial banks 6,754.64 34.47 0.92 0.08 13.67 190 194
UCBH HOLDINGS INC Commercial banks 6,385.02 15.44 0.93 0.07 13.81 311 449
UNITED BANKSHARES INC/WV Commercial banks 6,211.21 55.05 0.91 0.09 13.98 109 65
EAST WEST BANCORP INC Commercial banks 6,027.71 18.48 0.91 0.09 14.63 281 460
WINTRUST FINANCIAL CORP Commercial banks 5,499.98 40.09 0.93 0.07 13.32 43 128
SVB FINANCIAL GROUP Commercial banks 5,461.04 19.05 0.88 0.12 12.80 119 321
CATHAY GENERAL BANCORP Commercial banks 5,385.44 30.14 0.89 0.11 15.75 194 956
UNITED COMMUNITY BANKS INC Commercial banks 5,260.12 15.83 0.92 0.08 15.31 222 428
FIRST COMMONWLTH FINL CP/PA Commercial banks 5,244.15 51.42 0.91 0.09 13.39 18 78
CORUS BANKSHARES INC Commercial banks 5,210.06 5.90 0.88 0.12 11.48 726 724
HANCOCK HOLDING CO Commercial banks 4,584.19 49.16 0.90 0.10 13.69 44 74
DELPHI FINANCIAL GRP ‐CL A Life insurance 4,482.30 18.89 0.82 0.18 14.54 79 148
IRWIN FINANCIAL CORP Commercial banks 4,414.82 3.09 0.92 0.08 12.52 731 792
SWS GROUP INC Investment banks 4,382.49 12.61 0.94 0.06 13.90 2,962 12
WESTAMERICA BANCORPORATION Commercial banks 4,340.53 58.53 0.92 0.08 13.37 3 81
NATIONAL PENN BANCSHARES INC Commercial banks 4,129.49 37.44 0.91 0.09 14.48 140 180
PRESIDENTIAL LIFE CORP Life insurance 3,925.70 13.81 0.86 0.14 11.70 28 9,240
UMPQUA HOLDINGS CORP Commercial banks 3,905.03 50.95 0.87 0.13 13.67 154 397
FIRST FINL BANCORP INC/OH Commercial banks 3,660.24 35.52 0.91 0.09 13.47 23 31
COMMUNITY BANK SYSTEM INC Commercial banks 3,541.90 59.74 0.91 0.09 14.96 10 19
CENTRAL PACIFIC FINANCIAL CP Commercial banks 3,413.58 9.33 0.90 0.10 12.64 548 410
BOSTON PRIVATE FINL HOLDINGS Commercial banks 3,247.73 5.11 0.91 0.09 13.30 569 852
PROSPERITY BANCSHARES INC Commercial banks 3,049.64 82.31 0.89 0.11 15.96 24 63
S & T BANCORP INC Commercial banks 2,912.55 71.32 0.89 0.11 14.37 23 48
PRIVATEBANCORP INC Commercial banks 2,890.18 14.20 0.93 0.07 15.27 126 469
GLACIER BANCORP INC Commercial banks 2,842.76 74.22 0.90 0.10 14.17 51 47
PACWEST BANCORP Commercial banks 2,735.07 2.30 0.87 0.13 13.72 826 854
LABRANCHE & CO INC Investment banks 2,585.85 6.32 0.68 0.32 12.13 171 681
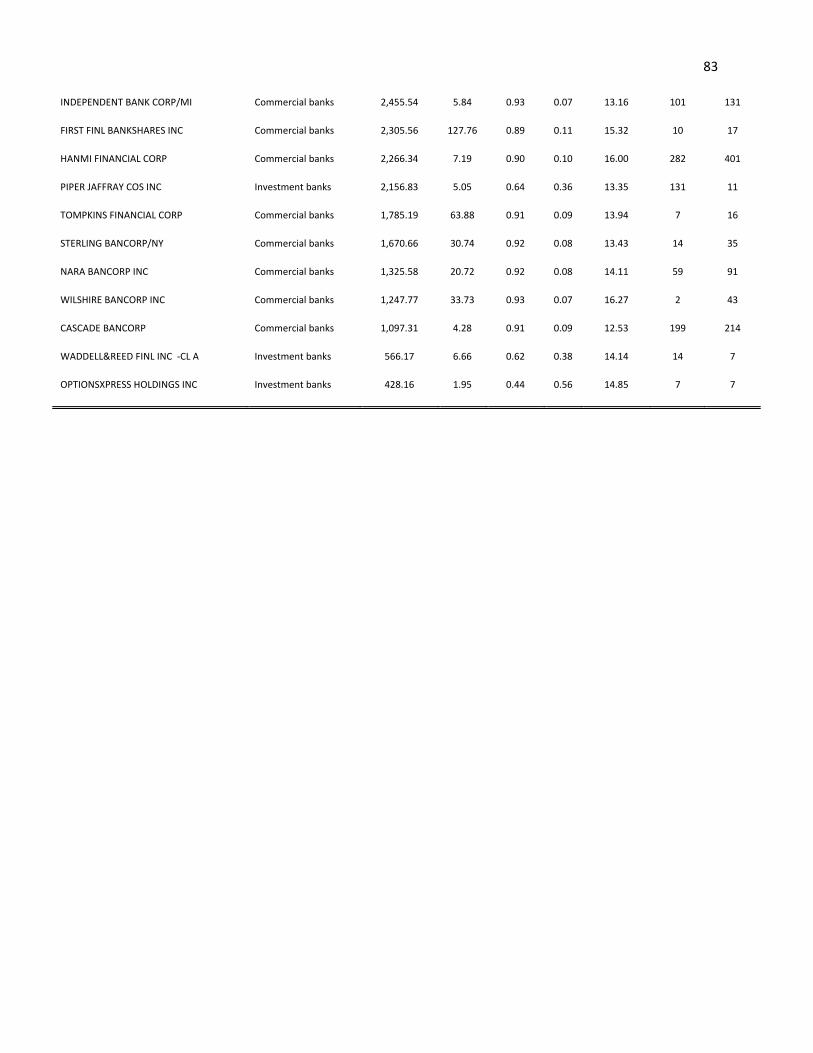
83
INDEPENDENT BANK CORP/MI Commercial banks 2,455.54 5.84 0.93 0.07 13.16 101 131
FIRST FINL BANKSHARES INC Commercial banks 2,305.56 127.76 0.89 0.11 15.32 10 17
HANMI FINANCIAL CORP Commercial banks 2,266.34 7.19 0.90 0.10 16.00 282 401
PIPER JAFFRAY COS INC Investment banks 2,156.83 5.05 0.64 0.36 13.35 131 11
TOMPKINS FINANCIAL CORP Commercial banks 1,785.19 63.88 0.91 0.09 13.94 7 16
STERLING BANCORP/NY Commercial banks 1,670.66 30.74 0.92 0.08 13.43 14 35
NARA BANCORP INC Commercial banks 1,325.58 20.72 0.92 0.08 14.11 59 91
WILSHIRE BANCORP INC Commercial banks 1,247.77 33.73 0.93 0.07 16.27 2 43
CASCADE BANCORP Commercial banks 1,097.31 4.28 0.91 0.09 12.53 199 214
WADDELL&REED FINL INC ‐CL A Investment banks 566.17 6.66 0.62 0.38 14.14 14 7
OPTIONSXPRESS HOLDINGS INC Investment banks 428.16 1.95 0.44 0.56 14.85 7 7
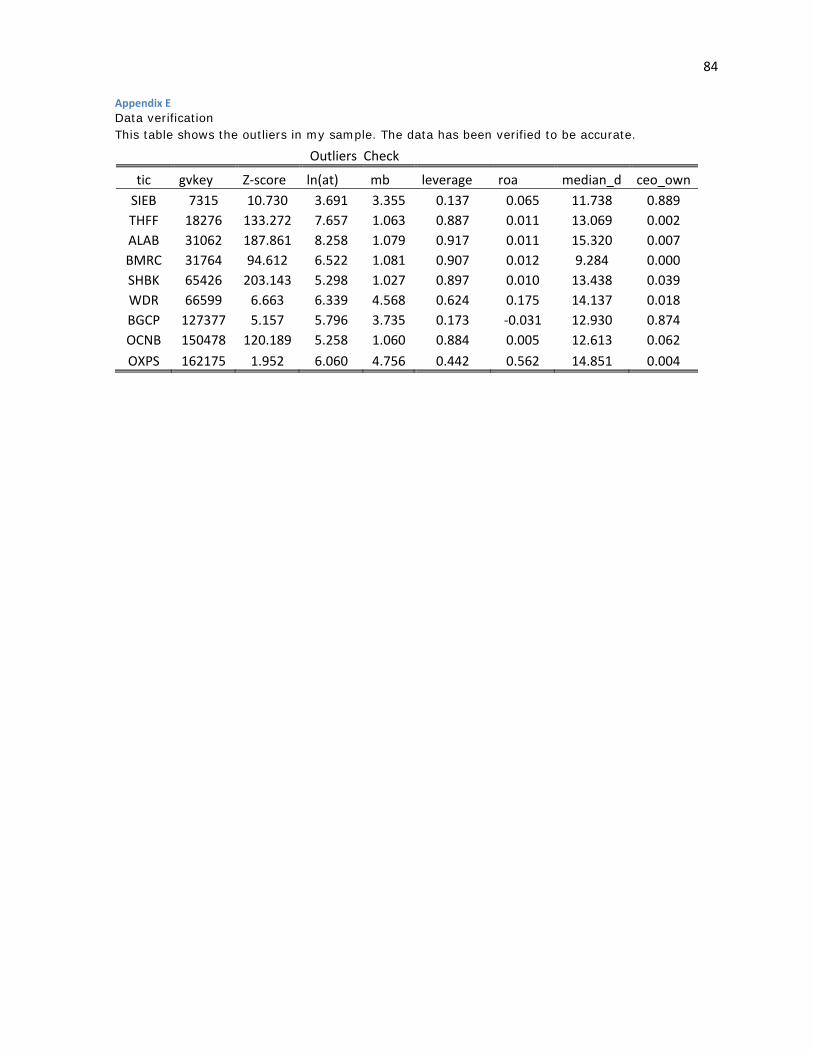
84
Appendix E Data verification This table shows the outliers in my sample. The data has been verified to be accurate.
Outliers Check
tic gvkey Z‐score ln(at) mb leverage roa median_d ceo_ownSIEB 7315 10.730 3.691 3.355 0.137 0.065 11.738 0.889 THFF 18276 133.272 7.657 1.063 0.887 0.011 13.069 0.002 ALAB 31062 187.861 8.258 1.079 0.917 0.011 15.320 0.007 BMRC 31764 94.612 6.522 1.081 0.907 0.012 9.284 0.000 SHBK 65426 203.143 5.298 1.027 0.897 0.010 13.438 0.039 WDR 66599 6.663 6.339 4.568 0.624 0.175 14.137 0.018 BGCP 127377 5.157 5.796 3.735 0.173 ‐0.031 12.930 0.874 OCNB 150478 120.189 5.258 1.060 0.884 0.005 12.613 0.062
OXPS 162175 1.952 6.060 4.756 0.442 0.562 14.851 0.004

Appendix F Governance indices as explanatory variables. G-index is obtained from Andrew Metrick’s website, and E-index is obtained from Lucian Bebchuck’s website. I require non-missing data on G-index, E-index and director ownership for the purpose of direct comparison of these three governance measures. Results from three estimation methods are presented: Median means median quantile regression (QREG in STATA), Robust means robust regression or iteratively reweighted least squares (RREG in STATA), OLS regressions are based on heteroskedasticity-consistent standard errors (White 1980).Regression variables are computed as the averages over 1998-2008, unless otherwise noted. Z-score =(ROA+CAR)/σ(ROA), where ROA=π/A is return on assets and CAR=E/A is capital-asset ratio, both averaged over 1998-2008. σ(ROA) is the standard deviation of ROA over 1998-2008. Higher Z-score implies more stability. Ln(Z-score) is natural logarithm of Z-score. ln(rev) is the logarithm of total revenue. mb is the average market-to-book asset ratio. own is CEO stock percentage ownership as of the last year in our sample period. age is firm age as proxied by the difference between 2008 and the year that the firm first appear in Compustat monthly stock return database ibk is dummy for investment banks, and ins is dummy for insurance companies. Standard errors are in parenthesis. *, **, and *** indicate significance at the 10%, 5% and 1% levels, respectively.
Panel A:Z-score G-index E-index Director Ownership
(1) (2) (3) (1) (2) (3) (1) (2) (3) VARIABLES Median Robust OLS VARIABLES Median Robust OLS VARIABLES Median Robust OLS ln(at) -1.269 -2.172 -3.653** ln(at) -1.459 -2.320 -3.781** ln(at) -0.932 -2.612 -4.276**
(2.179) (1.612) (1.600) (2.304) (1.626) (1.662) (2.209) (1.614) (1.633) mb -3.525 -4.257 -5.927* mb -3.725 -4.353 -6.048* mb -2.833 -5.739 -8.676**
(5.178) (6.092) (3.141) (5.461) (6.146) (3.241) (5.495) (6.126) (3.639) G-index 0.247 -0.0489 -0.256 E-index 0.530 0.496 -2.003 dir 3.444 3.471* 6.263**
(0.978) (0.736) (0.890) (2.198) (1.585) (2.862) (2.656) (1.878) (2.881) own -63.33 -59.88 -51.99 own -63.05 -56.64 -61.97 own -32.57 -44.55 -26.42
(61.43) (50.64) (50.78) (65.95) (51.32) (54.48) (59.04) (50.11) (48.82) age -0.0839 0.207 0.202 age -0.0679 0.239 0.180 age -0.0873 0.214 0.226
(0.258) (0.190) (0.253) (0.274) (0.191) (0.273) (0.262) (0.189) (0.243) ibk -15.46 -13.99* -19.36*** ibk -15.34 -13.62* -21.01** ibk -15.29 -12.31 -15.07**
(10.13) (7.661) (7.049) (10.90) (7.846) (8.300) (10.57) (7.710) (6.487) ins -1.085 0.436 -2.321 ins -1.011 0.725 -2.541 ins 0.732 2.159 0.749
(8.129) (6.516) (7.086) (8.623) (6.577) (7.332) (8.893) (6.563) (6.183) Constant 45.84* 53.64*** 76.75*** Constant 48.36* 52.64*** 82.70*** Constant -6.438 9.974 -6.048
(23.24) (18.08) (20.41) (24.55) (18.43) (25.34) (40.57) (29.68) (33.74)
Observations 117 117 117 Observations 117 117 117 Observations 117 117 117 R-squared 0.090 0.092 R-squared 0.095 0.100 R-squared 0.118 0.146
85

Appendix F (continued) Panel B: ln(Z-score)
G-index E-index Director ownership (1) (2) (3) (1) (2) (3) (1) (2) (3) VARIABLES Median Robust OLS VARIABLES Median Robust OLS VARIABLES Median Robust OLS ln(at) -0.049 -0.058 -0.055 ln(at) -0.058 -0.060 -0.059 ln(at) -0.034 -0.076 -0.073
(0.063) (0.058) (0.050) (0.075) (0.058) (0.050) (0.097) (0.056) (0.049) mb -0.221 -0.227 -0.222* mb -0.225 -0.229 -0.226* mb -0.208 -0.296 -0.297**
(0.147) (0.218) (0.121) (0.174) (0.218) (0.120) (0.238) (0.213) (0.122) G-index 0.011 -0.013 -0.015 E-index 0.024 -0.035 -0.043 dir 0.167 0.167** 0.169**
(0.029) (0.026) (0.024) (0.071) (0.056) (0.061) (0.118) (0.065) (0.068) own -2.894 -2.598 -2.491 own -3.055 -2.645 -2.589 own -2.870 -1.848 -1.707
(1.918) (1.810) (1.708) (2.133) (1.818) (1.723) (3.031) (1.744) (1.568) age -0.003 0.005 0.004 age -0.003 0.004 0.004 age -0.003 0.005 0.005
(0.008) (0.007) (0.007) (0.009) (0.007) (0.007) (0.012) (0.007) (0.007) ibk -0.914*** -0.761*** -0.764*** ibk -0.929*** -0.789*** -0.791*** ibk -0.792* -0.654** -0.642**
(0.291) (0.274) (0.286) (0.352) (0.278) (0.295) (0.463) (0.268) (0.285) ins -0.050 0.003 -0.006 ins -0.050 -0.004 -0.012 ins 0.086 0.082 0.076
(0.234) (0.233) (0.192) (0.282) (0.233) (0.193) (0.387) (0.228) (0.164) Constant 4.111*** 4.188*** 4.179*** Constant 4.226*** 4.227*** 4.236*** Constant 1.578 1.942* 1.890*
(0.655) (0.646) (0.570) (0.785) (0.653) (0.583) (1.819) (1.033) (0.971)
Observations 117 117 117 Observations 117 117 117 Observations 117 117 117 R-squared 0.148 0.154 R-squared 0.149 0.156 R-squared 0.196 0.204
86

Appendix F (continued) Panel C: interacting firm size with industry dummies (Dep: ln(Z-score))
G-index E-index Director ownership (1) (2) (3) (1) (2) (3) (1) (2) (3) VARIABLES Median Robust OLS VARIABLES Median Robust OLS VARIABLES Median Robust OLS ln(at) -0.200 -0.154** -0.145** ln(at) -0.174 -0.167** -0.157** ln(at) -0.150 -0.153** -0.146**
(0.132) (0.073) (0.068) (0.129) (0.074) (0.075) (0.132) (0.072) (0.064) mb 0.062 0.112 0.104 mb 0.055 0.110 0.100 mb -0.083 -0.029 -0.042
(0.282) (0.257) (0.145) (0.296) (0.255) (0.138) (0.309) (0.256) (0.157) G-index -0.045 -0.026 -0.026 E-index -0.053 -0.069 -0.069 dir 0.124 0.147** 0.153**
(0.049) (0.026) (0.026) (0.104) (0.057) (0.069) (0.120) (0.066) (0.070) own -4.118 -3.217* -3.103* own -4.303 -3.204* -3.155* own -4.275 -2.194 -2.033
(3.228) (1.860) (1.837) (3.127) (1.855) (1.896) (3.178) (1.839) (1.827) age 0.014 0.013* 0.012 age 0.010 0.013 0.012 age 0.006 0.012 0.011
(0.015) (0.008) (0.008) (0.014) (0.008) (0.008) (0.014) (0.008) (0.008) ibk -4.642** -4.576*** -4.447*** ibk -4.398* -4.712*** -4.559*** ibk -3.069 -3.619** -3.497***
(2.245) (1.639) (1.185) (2.235) (1.644) (1.245) (2.309) (1.607) (1.248) ins -1.292 -0.946 -0.882 ins -0.602 -1.281 -1.185 ins -0.698 -0.937 -0.900
(2.951) (1.777) (1.266) (2.931) (1.813) (1.493) (2.803) (1.747) (1.167) ibk*size 0.401* 0.405** 0.392*** ibk*size 0.368 0.414** 0.400*** ibk*size 0.241 0.314* 0.304**
(0.226) (0.172) (0.119) (0.222) (0.172) (0.122) (0.232) (0.169) (0.128) ins*size 0.153 0.108 0.100 ins*size 0.089 0.140 0.129 ins*size 0.092 0.110 0.106
(0.288) (0.174) (0.123) (0.288) (0.177) (0.145) (0.277) (0.171) (0.116) Constant 5.345*** 4.636*** 4.581*** Constant 4.958*** 4.754*** 4.686*** Constant 3.030 2.490** 2.358**
(1.204) (0.683) (0.647) (1.185) (0.698) (0.727) (1.874) (1.062) (1.015)
Observations 117 117 117 Observations 117 117 117 Observations 117 117 117 R-squared 0.195 0.196 R-squared 0.199 0.199 R-squared 0.221 0.229
87

Appendix G Firm size (total revenue) and risk taking The dependent variable is raw Z-score for the first 6 regressions and logarithm of Z-score for the second 6, which are further separated by whether or not they have industry controls. Results from three estimation methods are presented: Median means median quantile regression (QREG in STATA), Robust means robust regression or iteratively reweighted least squares (RREG in STATA), OLS regressions are based on heteroskedasticity-consistent standard errors (White 1980). Sample consists of 300 financial firms. Regression variables are computed as the averages over 1998-2008, unless otherwise noted. Z-score =(ROA+CAR)/σ(ROA), where ROA=π/A is return on assets and CAR=E/A is capital-asset ratio, both averaged over 1998-2008. σ(ROA) is the standard deviation of ROA over 1998-2008. Higher Z-score implies more stability. Ln(Z-score) is natural logarithm of Z-score. ln(rev) is the logarithm of total revenue. mb is the average market-to-book asset ratio. dir is the logarithm of median director dollar stockholding as of the last year in our sample period. own is CEO stock percentage ownership as of the last year in our sample period. age is firm age as proxied by the difference between 2008 and the year that the firm first appear in Compustat monthly stock return database ibk is dummy for investment banks, and ins is dummy for insurance companies. Standard errors are in parenthesis. *, **, and *** indicate significance at the 10%, 5% and 1% levels, respectively.
Z-score ln(Z-score) (1) (2) (3) (1) (2) (3) (1) (2) (3) (1) (2) (3)
VARIABLES Median Robust OLS Median Robust OLS Median Robust OLS Median Robust OLS
ln(rev) -2.871*** -3.244*** -4.501*** -1.549 -2.631*** -3.905*** -0.110*** -0.109***
-0.0992**
* -0.0830 -
0.0785** -0.0517 (0.926) (0.865) (0.910) (0.945) (1.000) (1.084) (0.0343) (0.0338) (0.0320) (0.0514) (0.0389) (0.0426)
mb -7.871** -7.847** -8.753*** -2.604 -2.976 -3.250 -0.558*** -0.524*** -0.493*** -0.233 -0.278* -0.189 (3.302) (3.493) (2.230) (3.588) (3.800) (2.078) (0.136) (0.139) (0.153) (0.198) (0.148) (0.165)
dir 5.174*** 4.949*** 5.683*** 3.202*** 4.414*** 5.206*** 0.191*** 0.213*** 0.197*** 0.152** 0.195*** 0.164*** (1.285) (1.176) (1.671) (1.167) (1.214) (1.740) (0.048) (0.046) (0.052) (0.063) (0.047) (0.054)
own 0.954 -24.37* -32.21*** 2.352 -13.70 -20.03** 0.0756 -0.702 -1.425 0.118 -0.125 -0.614 (15.21) (14.43) (12.31) (12.43) (14.77) (10.03) (0.528) (0.565) (0.930) (0.733) (0.577) (0.728)
age 0.206 0.335** 0.368** 0.0129 0.238 0.273 0.008 0.015** 0.015*** 0.004 0.010 0.009 (0.158) (0.147) (0.156) (0.148) (0.156) (0.169) (0.006) (0.006) (0.006) (0.008) (0.006) (0.006)
ibk -17.09*** -14.79*** -16.54*** -0.895*** -0.814*** -1.022*** (5.002) (5.330) (3.593) (0.275) (0.209) (0.283)
ins -2.130 2.769 3.618 -0.0293 0.156 0.0911 (5.180) (5.720) (5.521) (0.291) (0.221) (0.186)
Constant -23.90 -15.20 -13.78 -3.144 -13.92 -13.91 1.713*** 1.205* 1.305* 1.905** 1.157* 1.351** (17.09) (15.78) (21.49) (15.30) (15.84) (21.82) (0.636) (0.617) (0.697) (0.822) (0.613) (0.681)
Obs 300 300 300 300 300 300 298 298 298 298 298 298 R-squared 0.121 0.121 0.147 0.144 0.155 0.149 0.209 0.213
88
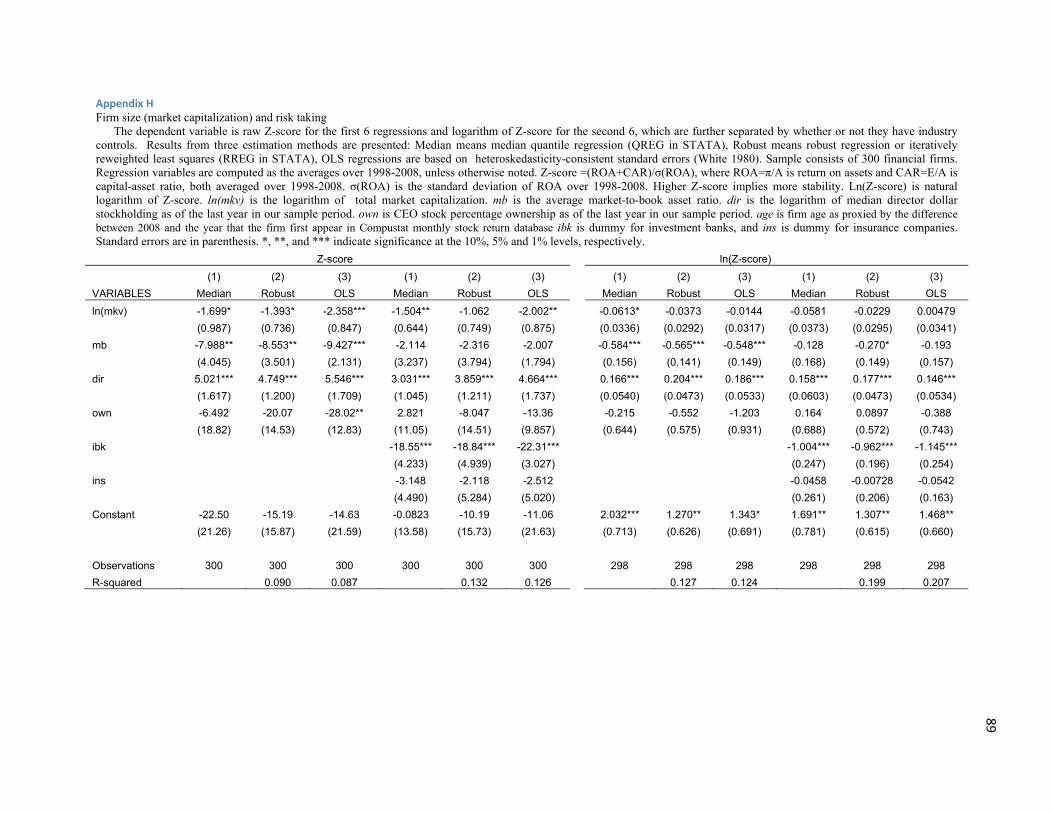
Appendix H Firm size (market capitalization) and risk taking The dependent variable is raw Z-score for the first 6 regressions and logarithm of Z-score for the second 6, which are further separated by whether or not they have industry controls. Results from three estimation methods are presented: Median means median quantile regression (QREG in STATA), Robust means robust regression or iteratively reweighted least squares (RREG in STATA), OLS regressions are based on heteroskedasticity-consistent standard errors (White 1980). Sample consists of 300 financial firms. Regression variables are computed as the averages over 1998-2008, unless otherwise noted. Z-score =(ROA+CAR)/σ(ROA), where ROA=π/A is return on assets and CAR=E/A is capital-asset ratio, both averaged over 1998-2008. σ(ROA) is the standard deviation of ROA over 1998-2008. Higher Z-score implies more stability. Ln(Z-score) is natural logarithm of Z-score. ln(mkv) is the logarithm of total market capitalization. mb is the average market-to-book asset ratio. dir is the logarithm of median director dollar stockholding as of the last year in our sample period. own is CEO stock percentage ownership as of the last year in our sample period. age is firm age as proxied by the difference between 2008 and the year that the firm first appear in Compustat monthly stock return database ibk is dummy for investment banks, and ins is dummy for insurance companies. Standard errors are in parenthesis. *, **, and *** indicate significance at the 10%, 5% and 1% levels, respectively.
Z-score ln(Z-score) (1) (2) (3) (1) (2) (3) (1) (2) (3) (1) (2) (3) VARIABLES Median Robust OLS Median Robust OLS Median Robust OLS Median Robust OLS ln(mkv) -1.699* -1.393* -2.358*** -1.504** -1.062 -2.002** -0.0613* -0.0373 -0.0144 -0.0581 -0.0229 0.00479
(0.987) (0.736) (0.847) (0.644) (0.749) (0.875) (0.0336) (0.0292) (0.0317) (0.0373) (0.0295) (0.0341) mb -7.988** -8.553** -9.427*** -2.114 -2.316 -2.007 -0.584*** -0.565*** -0.548*** -0.128 -0.270* -0.193
(4.045) (3.501) (2.131) (3.237) (3.794) (1.794) (0.156) (0.141) (0.149) (0.168) (0.149) (0.157) dir 5.021*** 4.749*** 5.546*** 3.031*** 3.859*** 4.664*** 0.166*** 0.204*** 0.186*** 0.158*** 0.177*** 0.146***
(1.617) (1.200) (1.709) (1.045) (1.211) (1.737) (0.0540) (0.0473) (0.0533) (0.0603) (0.0473) (0.0534) own -6.492 -20.07 -28.02** 2.821 -8.047 -13.36 -0.215 -0.552 -1.203 0.164 0.0897 -0.388
(18.82) (14.53) (12.83) (11.05) (14.51) (9.857) (0.644) (0.575) (0.931) (0.688) (0.572) (0.743) ibk -18.55*** -18.84*** -22.31*** -1.004*** -0.962*** -1.145***
(4.233) (4.939) (3.027) (0.247) (0.196) (0.254) ins -3.148 -2.118 -2.512 -0.0458 -0.00728 -0.0542
(4.490) (5.284) (5.020) (0.261) (0.206) (0.163) Constant -22.50 -15.19 -14.63 -0.0823 -10.19 -11.06 2.032*** 1.270** 1.343* 1.691** 1.307** 1.468**
(21.26) (15.87) (21.59) (13.58) (15.73) (21.63) (0.713) (0.626) (0.691) (0.781) (0.615) (0.660)
Observations 300 300 300 300 300 300 298 298 298 298 298 298 R-squared 0.090 0.087 0.132 0.126 0.127 0.124 0.199 0.207
89
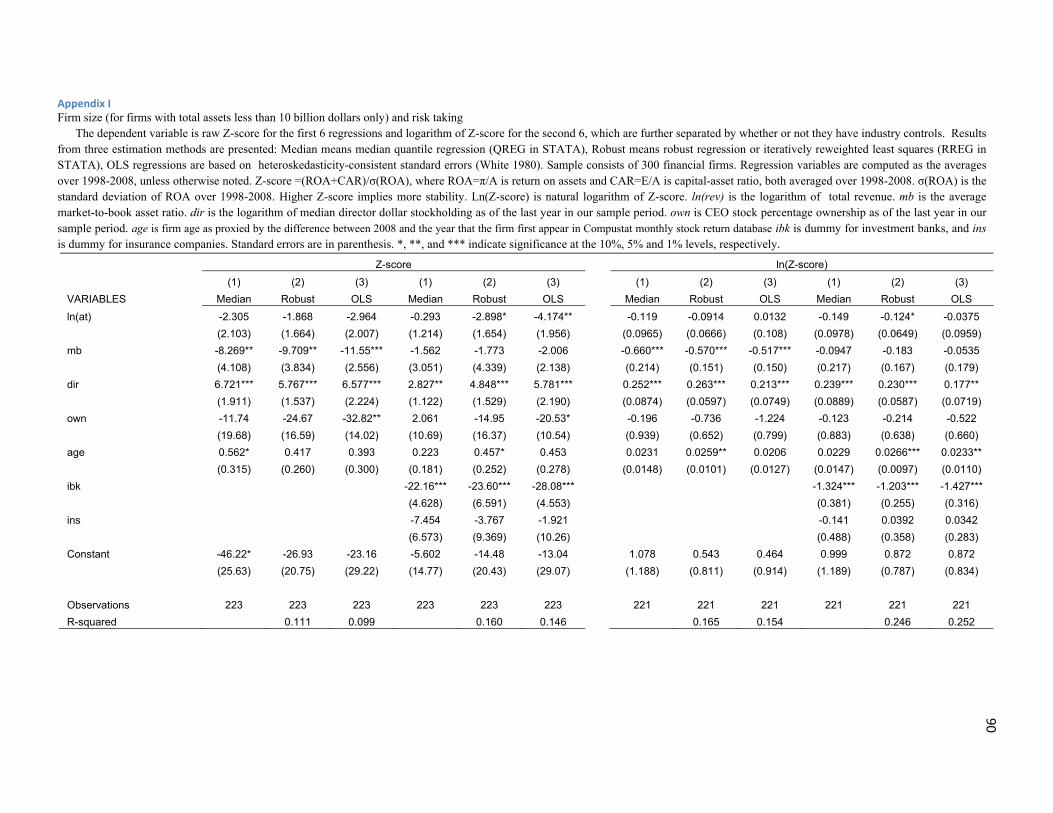
90
Appendix I Firm size (for firms with total assets less than 10 billion dollars only) and risk taking The dependent variable is raw Z-score for the first 6 regressions and logarithm of Z-score for the second 6, which are further separated by whether or not they have industry controls. Results from three estimation methods are presented: Median means median quantile regression (QREG in STATA), Robust means robust regression or iteratively reweighted least squares (RREG in STATA), OLS regressions are based on heteroskedasticity-consistent standard errors (White 1980). Sample consists of 300 financial firms. Regression variables are computed as the averages over 1998-2008, unless otherwise noted. Z-score =(ROA+CAR)/σ(ROA), where ROA=π/A is return on assets and CAR=E/A is capital-asset ratio, both averaged over 1998-2008. σ(ROA) is the standard deviation of ROA over 1998-2008. Higher Z-score implies more stability. Ln(Z-score) is natural logarithm of Z-score. ln(rev) is the logarithm of total revenue. mb is the average market-to-book asset ratio. dir is the logarithm of median director dollar stockholding as of the last year in our sample period. own is CEO stock percentage ownership as of the last year in our sample period. age is firm age as proxied by the difference between 2008 and the year that the firm first appear in Compustat monthly stock return database ibk is dummy for investment banks, and ins is dummy for insurance companies. Standard errors are in parenthesis. *, **, and *** indicate significance at the 10%, 5% and 1% levels, respectively.
Z-score ln(Z-score) (1) (2) (3) (1) (2) (3) (1) (2) (3) (1) (2) (3) VARIABLES Median Robust OLS Median Robust OLS Median Robust OLS Median Robust OLS ln(at) -2.305 -1.868 -2.964 -0.293 -2.898* -4.174** -0.119 -0.0914 0.0132 -0.149 -0.124* -0.0375
(2.103) (1.664) (2.007) (1.214) (1.654) (1.956) (0.0965) (0.0666) (0.108) (0.0978) (0.0649) (0.0959) mb -8.269** -9.709** -11.55*** -1.562 -1.773 -2.006 -0.660*** -0.570*** -0.517*** -0.0947 -0.183 -0.0535
(4.108) (3.834) (2.556) (3.051) (4.339) (2.138) (0.214) (0.151) (0.150) (0.217) (0.167) (0.179) dir 6.721*** 5.767*** 6.577*** 2.827** 4.848*** 5.781*** 0.252*** 0.263*** 0.213*** 0.239*** 0.230*** 0.177**
(1.911) (1.537) (2.224) (1.122) (1.529) (2.190) (0.0874) (0.0597) (0.0749) (0.0889) (0.0587) (0.0719) own -11.74 -24.67 -32.82** 2.061 -14.95 -20.53* -0.196 -0.736 -1.224 -0.123 -0.214 -0.522
(19.68) (16.59) (14.02) (10.69) (16.37) (10.54) (0.939) (0.652) (0.799) (0.883) (0.638) (0.660) age 0.562* 0.417 0.393 0.223 0.457* 0.453 0.0231 0.0259** 0.0206 0.0229 0.0266*** 0.0233**
(0.315) (0.260) (0.300) (0.181) (0.252) (0.278) (0.0148) (0.0101) (0.0127) (0.0147) (0.0097) (0.0110) ibk -22.16*** -23.60*** -28.08*** -1.324*** -1.203*** -1.427***
(4.628) (6.591) (4.553) (0.381) (0.255) (0.316) ins -7.454 -3.767 -1.921 -0.141 0.0392 0.0342
(6.573) (9.369) (10.26) (0.488) (0.358) (0.283) Constant -46.22* -26.93 -23.16 -5.602 -14.48 -13.04 1.078 0.543 0.464 0.999 0.872 0.872
(25.63) (20.75) (29.22) (14.77) (20.43) (29.07) (1.188) (0.811) (0.914) (1.189) (0.787) (0.834)
Observations 223 223 223 223 223 223 221 221 221 221 221 221 R-squared 0.111 0.099 0.160 0.146 0.165 0.154 0.246 0.252

91
Appendix J Firm size (total asset) and risk taking, separated for commercial banks, investment banks and life insurance. The dependent variable is raw Z-score for the first 3 regressions and logarithm of Z-score for the second 3. Results from three estimation methods are presented: Median means median quantile regression (QREG in STATA), Robust means robust regression or iteratively reweighted least squares (RREG in STATA), OLS regressions are based on heteroskedasticity-consistent standard errors (White 1980). Sample consists of 238 commercial banks. Regression variables are computed as the averages over 1998-2008, unless otherwise noted. Z-score =(ROA+CAR)/σ(ROA), where ROA=π/A is return on assets and CAR=E/A is capital-asset ratio, both averaged over 1998-2008. σ(ROA) is the standard deviation of ROA over 1998-2008. Higher Z-score implies more stability. Ln(Z-score) is natural logarithm of Z-score. ln(at) is the logarithm of total asset. mb is the average market-to-book asset ratio. dir is the logarithm of median director dollar stockholding as of the last year in our sample period. own is CEO stock percentage ownership as of the last year in our sample period. age is firm age as proxied by the difference between 2008 and the year that the firm first appear in Compustat monthly stock return database. Standard errors are in parenthesis. *, **, and *** indicate significance at the 10%, 5% and 1% levels, respectively.
Panel A: commercial banks only (total assets) Z-score ln(Z-score)
(1) (2) (3) (1) (2) (3) VARIABLES Median Robust OLS Median Robust OLS ln(at) -5.301** -5.602*** -7.377*** -0.245*** -0.193*** -0.184***
(2.058) (1.704) (1.948) (0.086) (0.060) (0.056) mb 59.430* 42.908 50.064* 1.983 1.671 1.831*
(34.923) (30.711) (29.174) (1.437) (1.090) (1.055) dir 3.019 5.015*** 5.845** 0.173** 0.194*** 0.177***
(2.023) (1.643) (2.425) (0.083) (0.058) (0.068) own -28.141 -29.788 -39.049** -2.098 -1.656 -1.545
(32.772) (29.174) (17.729) (1.497) (1.036) (0.980) age 0.403 0.521** 0.605** 0.020 0.019** 0.020**
(0.305) (0.250) (0.293) (0.013) (0.009) (0.009) Constant -40.827 -46.321 -48.430 0.444 0.061 -0.037
(37.974) (32.862) (34.926) (1.563) (1.167) (1.121)
Observations 238 238 238 238 238 238 R-squared 0.072 0.080 0.084 0.082
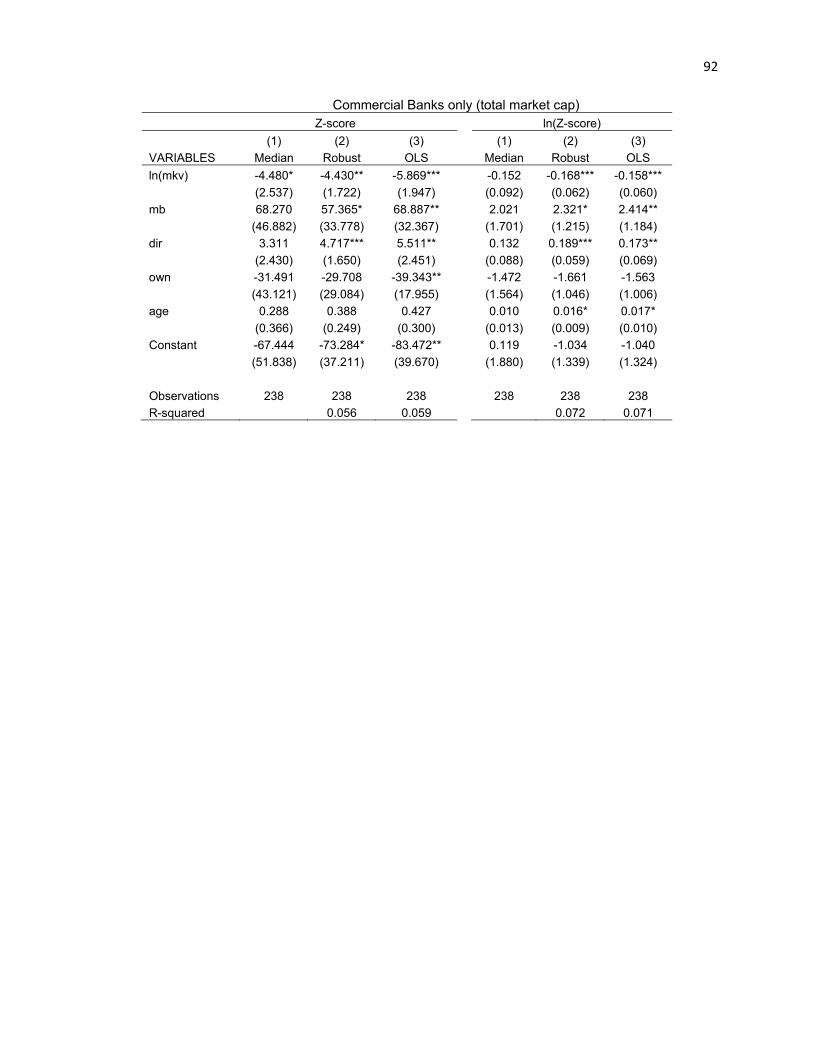
92
Commercial Banks only (total market cap) Z-score ln(Z-score)
(1) (2) (3) (1) (2) (3) VARIABLES Median Robust OLS Median Robust OLS ln(mkv) -4.480* -4.430** -5.869*** -0.152 -0.168*** -0.158***
(2.537) (1.722) (1.947) (0.092) (0.062) (0.060) mb 68.270 57.365* 68.887** 2.021 2.321* 2.414**
(46.882) (33.778) (32.367) (1.701) (1.215) (1.184) dir 3.311 4.717*** 5.511** 0.132 0.189*** 0.173**
(2.430) (1.650) (2.451) (0.088) (0.059) (0.069) own -31.491 -29.708 -39.343** -1.472 -1.661 -1.563
(43.121) (29.084) (17.955) (1.564) (1.046) (1.006) age 0.288 0.388 0.427 0.010 0.016* 0.017*
(0.366) (0.249) (0.300) (0.013) (0.009) (0.010) Constant -67.444 -73.284* -83.472** 0.119 -1.034 -1.040
(51.838) (37.211) (39.670) (1.880) (1.339) (1.324)
Observations 238 238 238 238 238 238 R-squared 0.056 0.059 0.072 0.071

93
Panel B: Investment banks only Z-score ln(Z-score)
(1) (2) (3) (1) (2) (3) VARIABLES Median Robust OLS Median Robust OLS ln(at) 1.815 1.729*** 1.879*** 0.088 0.144** 0.290*
(1.097) (0.516) (0.524) (0.084) (0.067) (0.143) mb -1.437 -1.275 -1.345 -0.274 -0.215 0.025
(2.319) (1.304) (0.813) (0.197) (0.158) (0.251) dir 1.311 0.297 -0.027 0.257* 0.094 -0.099
(1.787) (1.040) (0.902) (0.145) (0.128) (0.201) own 14.773 10.333* 10.122* 0.923 1.417* 1.182
(12.045) (6.058) (5.429) (0.977) (0.762) (0.759) age 0.050 0.073 0.127 0.029 0.014 0.021
(0.228) (0.125) (0.137) (0.018) (0.015) (0.015) Constant -21.885 -7.168 -3.958 -2.163 -0.321 0.523
(20.254) (12.116) (10.707) (1.710) (1.500) (1.583)
Observations 38 38 38 36 36 36 R-squared 0.402 0.420 0.331 0.297

94
Panel C: Insurance companies only Z-score ln(Z-score)
(1) (2) (3) (1) (2) (3) VARIABLES Median Robust OLS Median Robust OLS ln(at) -0.398 -0.524 -5.147 -0.013 0.029 -0.184
(1.306) (1.305) (3.386) (0.044) (0.052) (0.107) mb 12.613 22.030 3.866 0.740 1.879 -0.844
(22.819) (30.684) (41.820) (0.765) (1.213) (2.162) dir 3.432* 3.829** 5.905** 0.161*** 0.171** 0.240***
(1.652) (1.577) (2.278) (0.055) (0.062) (0.083) own -23.323 -46.379 -108.314* -1.296 -1.962 -2.899*
(27.499) (40.188) (62.187) (0.922) (1.589) (1.454) age -0.059 0.029 0.042 -0.002 0.006 -0.004
(0.188) (0.189) (0.447) (0.006) (0.007) (0.012) Constant -28.280 -42.329 1.189 0.497 -1.328 2.849
(36.200) (35.210) (60.327) (1.214) (1.392) (3.087)
Observations 24 24 24 24 24 24 R-squared 0.364 0.291 0.549 0.335
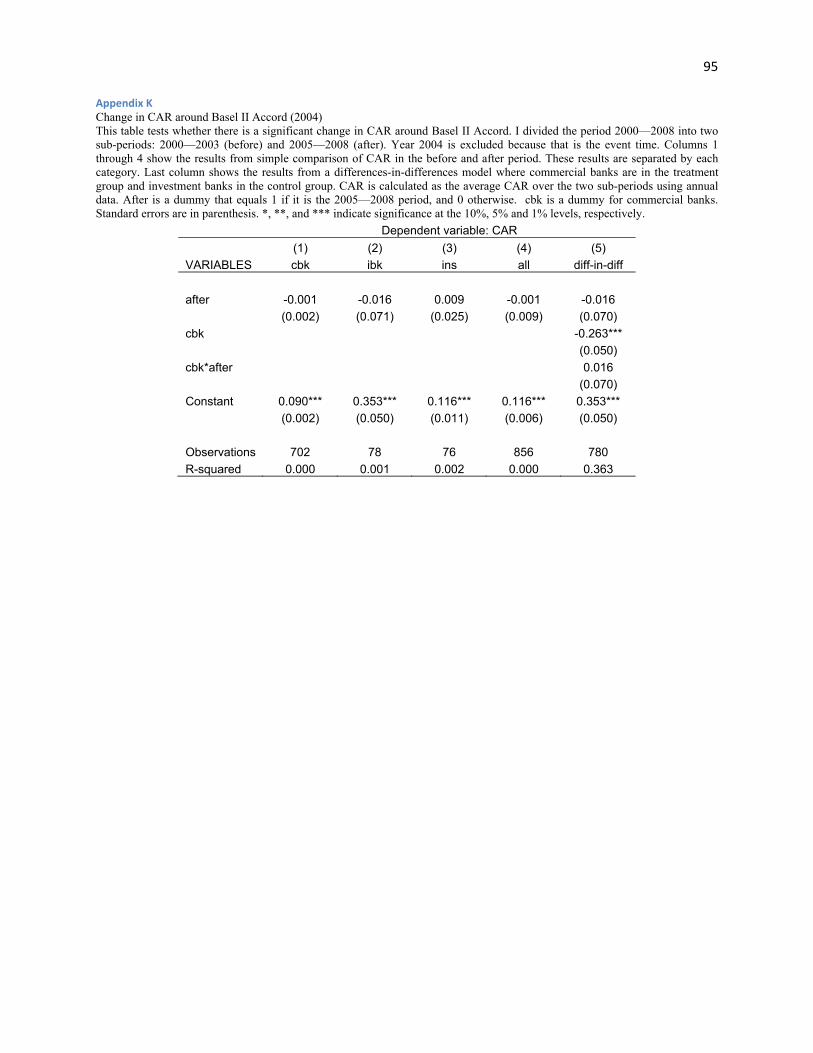
95
Appendix K Change in CAR around Basel II Accord (2004) This table tests whether there is a significant change in CAR around Basel II Accord. I divided the period 2000—2008 into two sub-periods: 2000—2003 (before) and 2005—2008 (after). Year 2004 is excluded because that is the event time. Columns 1 through 4 show the results from simple comparison of CAR in the before and after period. These results are separated by each category. Last column shows the results from a differences-in-differences model where commercial banks are in the treatment group and investment banks in the control group. CAR is calculated as the average CAR over the two sub-periods using annual data. After is a dummy that equals 1 if it is the 2005—2008 period, and 0 otherwise. cbk is a dummy for commercial banks. Standard errors are in parenthesis. *, **, and *** indicate significance at the 10%, 5% and 1% levels, respectively.
Dependent variable: CAR (1) (2) (3) (4) (5) VARIABLES cbk ibk ins all diff-in-diff after -0.001 -0.016 0.009 -0.001 -0.016
(0.002) (0.071) (0.025) (0.009) (0.070) cbk -0.263***
(0.050) cbk*after 0.016
(0.070) Constant 0.090*** 0.353*** 0.116*** 0.116*** 0.353***
(0.002) (0.050) (0.011) (0.006) (0.050)
Observations 702 78 76 856 780 R-squared 0.000 0.001 0.002 0.000 0.363
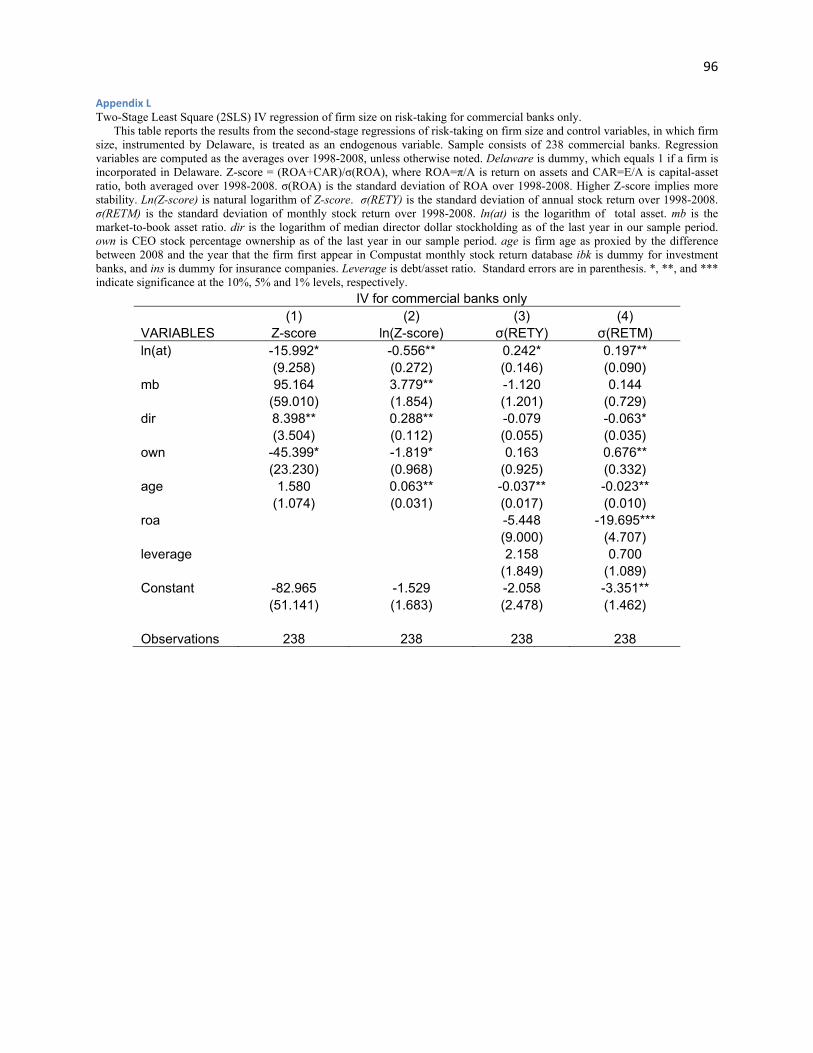
96
Appendix L Two-Stage Least Square (2SLS) IV regression of firm size on risk-taking for commercial banks only. This table reports the results from the second-stage regressions of risk-taking on firm size and control variables, in which firm size, instrumented by Delaware, is treated as an endogenous variable. Sample consists of 238 commercial banks. Regression variables are computed as the averages over 1998-2008, unless otherwise noted. Delaware is dummy, which equals 1 if a firm is incorporated in Delaware. Z-score = (ROA+CAR)/σ(ROA), where ROA=π/A is return on assets and CAR=E/A is capital-asset ratio, both averaged over 1998-2008. σ(ROA) is the standard deviation of ROA over 1998-2008. Higher Z-score implies more stability. Ln(Z-score) is natural logarithm of Z-score. σ(RETY) is the standard deviation of annual stock return over 1998-2008. σ(RETM) is the standard deviation of monthly stock return over 1998-2008. ln(at) is the logarithm of total asset. mb is the market-to-book asset ratio. dir is the logarithm of median director dollar stockholding as of the last year in our sample period. own is CEO stock percentage ownership as of the last year in our sample period. age is firm age as proxied by the difference between 2008 and the year that the firm first appear in Compustat monthly stock return database ibk is dummy for investment banks, and ins is dummy for insurance companies. Leverage is debt/asset ratio. Standard errors are in parenthesis. *, **, and *** indicate significance at the 10%, 5% and 1% levels, respectively.
IV for commercial banks only (1) (2) (3) (4) VARIABLES Z-score ln(Z-score) σ(RETY) σ(RETM) ln(at) -15.992* -0.556** 0.242* 0.197**
(9.258) (0.272) (0.146) (0.090) mb 95.164 3.779** -1.120 0.144
(59.010) (1.854) (1.201) (0.729) dir 8.398** 0.288** -0.079 -0.063*
(3.504) (0.112) (0.055) (0.035) own -45.399* -1.819* 0.163 0.676**
(23.230) (0.968) (0.925) (0.332) age 1.580 0.063** -0.037** -0.023**
(1.074) (0.031) (0.017) (0.010) roa -5.448 -19.695***
(9.000) (4.707) leverage 2.158 0.700
(1.849) (1.089) Constant -82.965 -1.529 -2.058 -3.351**
(51.141) (1.683) (2.478) (1.462)
Observations 238 238 238 238

97
Appendix M Fixed effect: two periods (quarterly data) This table shows the effect of firm size on risk taking based on quarterly data from 1998-2008, except for stock return volatility which uses monthly stock return data. This period is further divided into two sub-periods, 1998-2003 and 2004-2008. Using quarterly data or monthly data, regression variables are computed as the averages over each of the two 4-year periods, unless otherwise noted. The dependent variable is raw Z-score, log of Z-score, and monthly stock return volatility, respectively. Sample consists of 675 financial firms or 1,210 firm-periods. Z-score =(ROA+CAR)/σ(ROA), where ROA=π/A is return on assets and CAR=E/A is capital-asset ratio. σ(ROA) is the standard deviation of ROA. Higher Z-score implies more stability. Ln(Z-score) is natural logarithm of Z-score. ln(at) is the logarithm of total asset. mb is the average market-to-book asset ratio. Period2 is a dummy variable which equals 1 if it is second period, zero otherwise. Leverage is debt/asset ratio. Standard errors, clustered at firm level, are in parenthesis. *, **, and *** indicate significance at the 10%, 5% and 1% levels, respectively.
(1) (2) (3) VARIABLES Z-score ln(Z-score) σ(RET)
ln(at) -19.93* -0.281** 0.390
(11.67) (0.138) (0.965) mb 7.663 -0.220 5.191**
(7.857) (0.170) (2.482) period2 8.397 0.0503 -1.206**
(9.377) (0.0822) (0.479) roa -75.85
(50.16) leverage 4.942
(8.427) Constant 245.2*** 6.461*** -2.537
(79.96) (1.020) (11.83)
Observations 1,210 1,206 1,210 R-squared 0.004 0.016 0.147 Number of firms 675 674 675

98
Appendix N Fixed effect: four periods (quarterly data) This table shows the effect of firm size on risk taking based on quarterly data from 1998-2008, except for stock return volatility which uses monthly stock return data. This period is further divided into four sub-periods, 1998-2000, 2001-2003, 2004-2006 and 2007-2008. Using quarterly data or monthly data, regression variables are computed as the averages over each of the four 3-year periods, unless otherwise noted. The dependent variable is raw Z-score, log of Z-score, and monthly stock return volatility, respectively. Sample consists of 674 financial firms or 2,207 firm-periods. Z-score =(ROA+CAR)/σ(ROA), where ROA=π/A is return on assets and CAR=E/A is capital-asset ratio. σ(ROA) is the standard deviation of ROA. Higher Z-score implies more stability. Ln(Z-score) is natural logarithm of Z-score. ln(at) is the logarithm of total asset. mb is the average market-to-book asset ratio. Period2 is a dummy variable which equals 1 if it is second period, zero otherwise. Period3 and period4 are defined accordingly. Leverage is debt/asset ratio. Standard errors, clustered at firm level, are in parenthesis. *, **, and *** indicate significance at the 10%, 5% and 1% levels, respectively.
(1) (2) (3) VARIABLES Z-score ln(Z-score) σ(RET)
ln(at) 21.989** 0.062 -0.419 (10.896) (0.101) (0.557)
mb 3.418 -0.215 4.584*** (9.842) (0.290) (1.609)
period2 38.258*** 0.415*** -1.577*** (10.075) (0.065) (0.240)
period3 61.278*** 0.601*** -3.738*** (12.750) (0.090) (0.383)
period4 -68.392*** -0.516*** 1.610*** (15.641) (0.112) (0.489)
roa -85.888*** (31.988)
leverage 9.437* (5.466)
Constant 2.975 4.236*** 0.010 (75.147) (0.806) (6.915)
Observations 2,207 2,198 2,207 R-squared 0.124 0.213 0.329 Number of firms 674 674 674
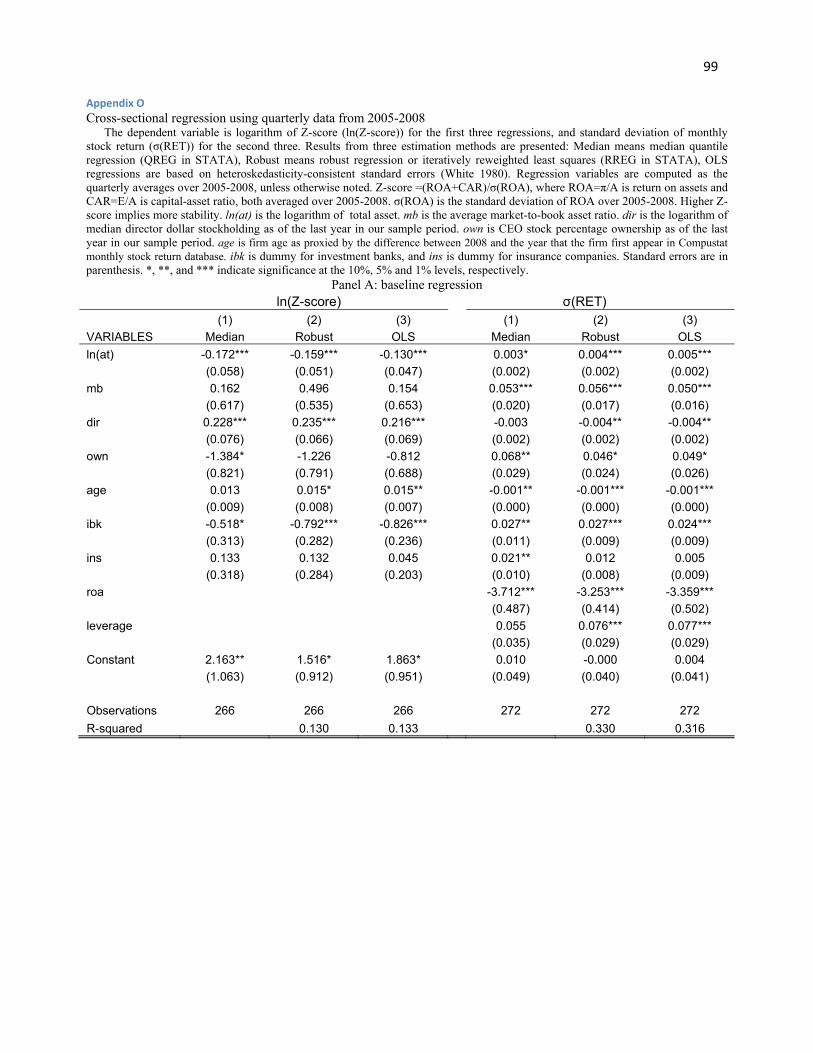
99
Appendix O Cross-sectional regression using quarterly data from 2005-2008 The dependent variable is logarithm of Z-score (ln(Z-score)) for the first three regressions, and standard deviation of monthly stock return (σ(RET)) for the second three. Results from three estimation methods are presented: Median means median quantile regression (QREG in STATA), Robust means robust regression or iteratively reweighted least squares (RREG in STATA), OLS regressions are based on heteroskedasticity-consistent standard errors (White 1980). Regression variables are computed as the quarterly averages over 2005-2008, unless otherwise noted. Z-score =(ROA+CAR)/σ(ROA), where ROA=π/A is return on assets and CAR=E/A is capital-asset ratio, both averaged over 2005-2008. σ(ROA) is the standard deviation of ROA over 2005-2008. Higher Z-score implies more stability. ln(at) is the logarithm of total asset. mb is the average market-to-book asset ratio. dir is the logarithm of median director dollar stockholding as of the last year in our sample period. own is CEO stock percentage ownership as of the last year in our sample period. age is firm age as proxied by the difference between 2008 and the year that the firm first appear in Compustat monthly stock return database. ibk is dummy for investment banks, and ins is dummy for insurance companies. Standard errors are in parenthesis. *, **, and *** indicate significance at the 10%, 5% and 1% levels, respectively.
Panel A: baseline regression ln(Z-score) σ(RET)
(1) (2) (3) (1) (2) (3) VARIABLES Median Robust OLS Median Robust OLS ln(at) -0.172*** -0.159*** -0.130*** 0.003* 0.004*** 0.005***
(0.058) (0.051) (0.047) (0.002) (0.002) (0.002) mb 0.162 0.496 0.154 0.053*** 0.056*** 0.050***
(0.617) (0.535) (0.653) (0.020) (0.017) (0.016) dir 0.228*** 0.235*** 0.216*** -0.003 -0.004** -0.004**
(0.076) (0.066) (0.069) (0.002) (0.002) (0.002) own -1.384* -1.226 -0.812 0.068** 0.046* 0.049*
(0.821) (0.791) (0.688) (0.029) (0.024) (0.026) age 0.013 0.015* 0.015** -0.001** -0.001*** -0.001***
(0.009) (0.008) (0.007) (0.000) (0.000) (0.000) ibk -0.518* -0.792*** -0.826*** 0.027** 0.027*** 0.024***
(0.313) (0.282) (0.236) (0.011) (0.009) (0.009) ins 0.133 0.132 0.045 0.021** 0.012 0.005
(0.318) (0.284) (0.203) (0.010) (0.008) (0.009) roa -3.712*** -3.253*** -3.359***
(0.487) (0.414) (0.502) leverage 0.055 0.076*** 0.077***
(0.035) (0.029) (0.029) Constant 2.163** 1.516* 1.863* 0.010 -0.000 0.004
(1.063) (0.912) (0.951) (0.049) (0.040) (0.041)
Observations 266 266 266 272 272 272 R-squared 0.130 0.133 0.330 0.316
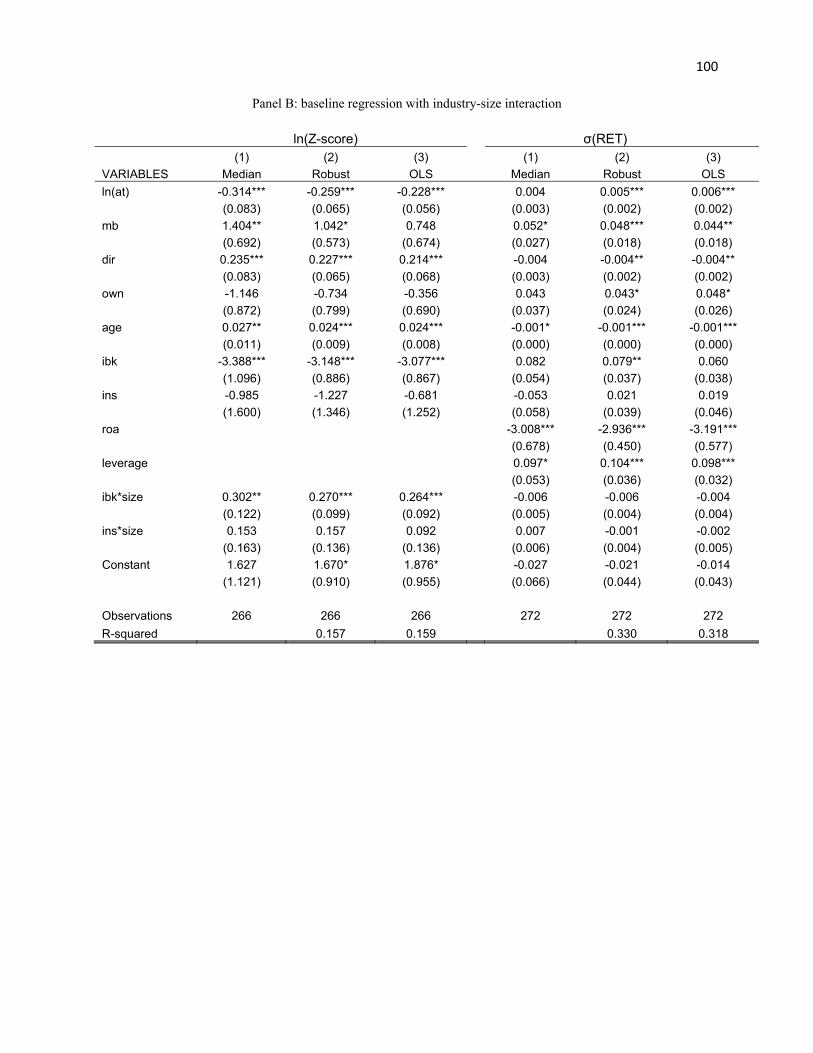
100
Panel B: baseline regression with industry-size interaction
ln(Z-score) σ(RET) (1) (2) (3) (1) (2) (3) VARIABLES Median Robust OLS Median Robust OLS ln(at) -0.314*** -0.259*** -0.228*** 0.004 0.005*** 0.006***
(0.083) (0.065) (0.056) (0.003) (0.002) (0.002) mb 1.404** 1.042* 0.748 0.052* 0.048*** 0.044**
(0.692) (0.573) (0.674) (0.027) (0.018) (0.018) dir 0.235*** 0.227*** 0.214*** -0.004 -0.004** -0.004**
(0.083) (0.065) (0.068) (0.003) (0.002) (0.002) own -1.146 -0.734 -0.356 0.043 0.043* 0.048*
(0.872) (0.799) (0.690) (0.037) (0.024) (0.026) age 0.027** 0.024*** 0.024*** -0.001* -0.001*** -0.001***
(0.011) (0.009) (0.008) (0.000) (0.000) (0.000) ibk -3.388*** -3.148*** -3.077*** 0.082 0.079** 0.060
(1.096) (0.886) (0.867) (0.054) (0.037) (0.038) ins -0.985 -1.227 -0.681 -0.053 0.021 0.019
(1.600) (1.346) (1.252) (0.058) (0.039) (0.046) roa -3.008*** -2.936*** -3.191***
(0.678) (0.450) (0.577) leverage 0.097* 0.104*** 0.098***
(0.053) (0.036) (0.032) ibk*size 0.302** 0.270*** 0.264*** -0.006 -0.006 -0.004
(0.122) (0.099) (0.092) (0.005) (0.004) (0.004) ins*size 0.153 0.157 0.092 0.007 -0.001 -0.002
(0.163) (0.136) (0.136) (0.006) (0.004) (0.005) Constant 1.627 1.670* 1.876* -0.027 -0.021 -0.014
(1.121) (0.910) (0.955) (0.066) (0.044) (0.043)
Observations 266 266 266 272 272 272 R-squared 0.157 0.159 0.330 0.318

Appendix P Decomposition of Z-score using quarterly data from 2005-2008 The dependent variables are CAR, ROA, and σ(ROA), respectively. Results from three estimation methods are presented: Median is median quantile regression, Robust is robust regression or iteratively reweighted least squares, OLS is ordinary least squares with White heteroskedasticity-robust standard error. Regression variables are computed as the quarterly averages over 2005-2008, unless otherwise noted Following Houston et al (2010), ROA is return on assets and CAR is capital-asset ratio, both are averaged over 2005-2008. σ(ROA) is the standard deviation of ROA over 1998-2008. Higher of ROA and CAR imply more stability. The ROA multiplied by 100 is used in regressions. ln(at) is the logarithm of total asset. mb is the market-to-book asset ratio. dir is the logarithm of median director dollar stockholding as of the last year in our sample period. own is CEO stock percentage ownership as of the last year in our sample period. age is firm age as proxied by the difference between 2008 and the year that the firm first appear in Compustat monthly stock return database ibk is dummy for investment banks, and ins is dummy for insurance companies. Leverage is debt/asset ratio. Standard errors are in parenthesis. *, **, and *** indicate significance at the 10%, 5% and 1% levels, respectively.
Panel A: baseline decomposition
101
ROA CAR σ(ROA) (1) (2) (3) (1) (2) (3) (1) (2) (3) VARIABLES Median Robust OLS Median Robust OLS Median Robust OLS ln(atq) -0.007 -0.008 0.036 -0.005*** -0.002** -0.018*** 0.107* 0.164*** 0.160***
(0.006) (0.006) (0.033) (0.002) (0.001) (0.004) (0.065) (0.050) (0.042) mb 1.496*** 1.477*** 1.101 0.252*** 0.206*** 0.218*** 1.503** 1.153** 1.181**
(0.053) (0.062) (0.692) (0.017) (0.011) (0.065) (0.700) (0.541) (0.594) dir 0.034*** 0.026*** 0.051** -0.003 -0.002 -0.001 -0.118 -0.169*** -0.165***
(0.007) (0.007) (0.026) (0.002) (0.001) (0.004) (0.080) (0.060) (0.060) own -0.329*** 0.081 0.287 0.190*** -0.060*** 0.248*** 0.127 0.411 0.362
(0.084) (0.091) (0.707) (0.026) (0.016) (0.079) (0.898) (0.748) (0.600) age 0.002*** 0.002*** 0.002 0.001** 0.000* 0.001*** -0.006 -0.010 -0.011*
(0.001) (0.001) (0.004) (0.000) (0.000) (0.001) (0.010) (0.007) (0.006) ibk -0.022 -0.018 -0.252 0.074*** -0.008 0.153*** 0.323 0.296 0.312
(0.034) (0.034) (0.181) (0.009) (0.006) (0.038) (0.379) (0.296) (0.259) ins 0.027 0.066** 0.001 0.020** -0.010* 0.048*** -0.025 -0.114 -0.102
(0.031) (0.031) (0.103) (0.009) (0.006) (0.014) (0.341) (0.260) (0.184) roa -2.229*** -5.440*** -2.850 -0.844*** -1.002*** -1.029***
(0.478) (0.283) (1.794) (0.165) (0.133) (0.146) leverage 0.656*** 0.666*** 1.026 -3.489*** -3.571*** -3.476***
(0.085) (0.094) (0.719) (1.190) (0.933) (0.891) Constant -2.432*** -2.323*** -2.966*** -0.112*** -0.076*** -0.015 -4.074** -3.240** -3.331***
(0.122) (0.133) (1.071) (0.031) (0.019) (0.078) (1.652) (1.287) (1.246)
Observations 272 271 272 272 272 272 266 266 266 R-squared 0.736 0.177 0.778 0.691 0.442 0.478
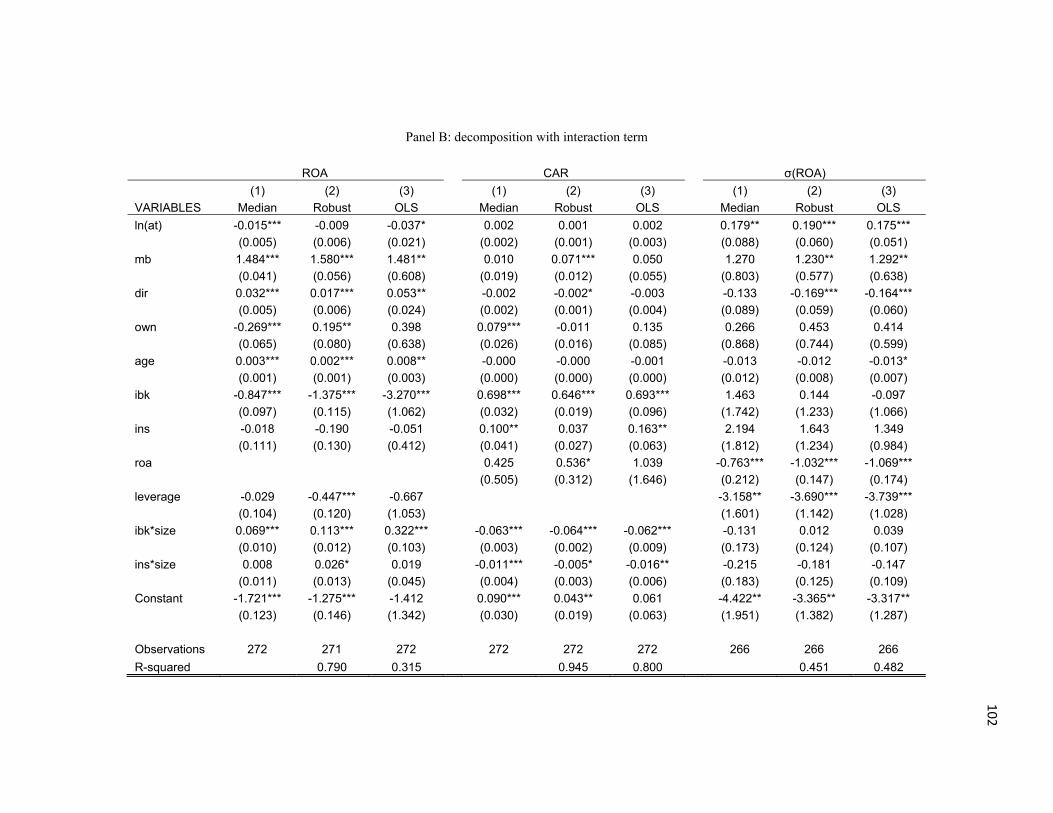
102
Panel B: decomposition with interaction term
ROA CAR σ(ROA) (1) (2) (3) (1) (2) (3) (1) (2) (3) VARIABLES Median Robust OLS Median Robust OLS Median Robust OLS ln(at) -0.015*** -0.009 -0.037* 0.002 0.001 0.002 0.179** 0.190*** 0.175***
(0.005) (0.006) (0.021) (0.002) (0.001) (0.003) (0.088) (0.060) (0.051) mb 1.484*** 1.580*** 1.481** 0.010 0.071*** 0.050 1.270 1.230** 1.292**
(0.041) (0.056) (0.608) (0.019) (0.012) (0.055) (0.803) (0.577) (0.638) dir 0.032*** 0.017*** 0.053** -0.002 -0.002* -0.003 -0.133 -0.169*** -0.164***
(0.005) (0.006) (0.024) (0.002) (0.001) (0.004) (0.089) (0.059) (0.060) own -0.269*** 0.195** 0.398 0.079*** -0.011 0.135 0.266 0.453 0.414
(0.065) (0.080) (0.638) (0.026) (0.016) (0.085) (0.868) (0.744) (0.599) age 0.003*** 0.002*** 0.008** -0.000 -0.000 -0.001 -0.013 -0.012 -0.013*
(0.001) (0.001) (0.003) (0.000) (0.000) (0.000) (0.012) (0.008) (0.007) ibk -0.847*** -1.375*** -3.270*** 0.698*** 0.646*** 0.693*** 1.463 0.144 -0.097
(0.097) (0.115) (1.062) (0.032) (0.019) (0.096) (1.742) (1.233) (1.066) ins -0.018 -0.190 -0.051 0.100** 0.037 0.163** 2.194 1.643 1.349
(0.111) (0.130) (0.412) (0.041) (0.027) (0.063) (1.812) (1.234) (0.984) roa 0.425 0.536* 1.039 -0.763*** -1.032*** -1.069***
(0.505) (0.312) (1.646) (0.212) (0.147) (0.174) leverage -0.029 -0.447*** -0.667 -3.158** -3.690*** -3.739***
(0.104) (0.120) (1.053) (1.601) (1.142) (1.028) ibk*size 0.069*** 0.113*** 0.322*** -0.063*** -0.064*** -0.062*** -0.131 0.012 0.039
(0.010) (0.012) (0.103) (0.003) (0.002) (0.009) (0.173) (0.124) (0.107) ins*size 0.008 0.026* 0.019 -0.011*** -0.005* -0.016** -0.215 -0.181 -0.147
(0.011) (0.013) (0.045) (0.004) (0.003) (0.006) (0.183) (0.125) (0.109) Constant -1.721*** -1.275*** -1.412 0.090*** 0.043** 0.061 -4.422** -3.365** -3.317**
(0.123) (0.146) (1.342) (0.030) (0.019) (0.063) (1.951) (1.382) (1.287)
Observations 272 271 272 272 272 272 266 266 266 R-squared 0.790 0.315 0.945 0.800 0.451 0.482

103
Appendix Q Differences-in-differences model This table provides the regression results of the following differences-in-differences model (similar to Purnanandam (2010, RFS)):
0 1 2 31
*k K
it i i itk
risk after size after size Xβ β β β β=
=
= + + + + +∑ ε
We divide the 2005-2008 period into two sub-periods: 2005Q1-2007Q1, the before-crisis period, and 2007Q2-2008Q4, the crisis period, and compare the risk-taking in these two distinct periods. The dependent variable, riskit, is either Z-score or volatility of monthly stock return, calculated using either quarterly or monthly data for firm i for both periods. after is a dummy that is set to one for the crisis period, and zero before-crisis period. sizei is the average total asset over quarters before the crisis. X stands for a set of control variables. mb is the average market-to-book ratio for firm i; roa is average return on asset for firm i; leverage is average debt to asset ratio for firm i. Since we have balanced panel, we take the difference between these two periods and instead estimate the following simplified model:
1 31
*k K
it i itk
risk size after Xβ β β=
=
Δ = + + Δ +Δ∑ ε
(1) (2) (3) (4) VARIABLES ln(Z-score) σ(RET) Δsize*after -0.121*** -0.113*** 0.010*** 0.010***
(0.030) (0.030) (0.001) (0.002) Δmb -0.387** 0.012
(0.150) (0.011) Δroa -0.248
(0.264) Δleverage 0.130
(0.135) Constant -0.310 -0.405* -0.012 -0.011
(0.221) (0.223) (0.010) (0.015)
Observations 524 524 524 524 R-squared 0.029 0.036 0.102 0.120
Related Documents


![Ghana: Non-Bank Financial Institutions Business …...NON-BANK FINANCIAL INSTITUTIONS BUSINESS [BOG] RULES (AS APPLICABLE TO NON-DEPOSIT TAKING INSTITUTIONS) BANK OF GHANA NON-BANK](https://static.cupdf.com/doc/110x72/5e5b7d7377393d790959caf8/ghana-non-bank-financial-institutions-business-non-bank-financial-institutions.jpg)