Size dependent melting mechanisms of iron nanoclusters Haiming Duan a, * , Feng Ding b , Arne Rose ´n a , Avetik R. Harutyunyan c , Stefano Curtarolo d , Kim Bolton a,e a Physics Department, Go ¨ teborg University, SE-412 96 Go ¨ teborg, Sweden b ME&MS Department, Rice University, Houston, TX 77005, USA c Honda Research Institute USA Inc., Columbus, OH 43212, USA d ME&MS, Duke University, Durham, NC 27708, USA e School of Engineering, University College of Bora ˚ s, SE-501 90, Bora ˚ s, Sweden Received 1 September 2006; accepted 3 January 2007 Available online 9 January 2007 Abstract Molecular dynamics simulations were used to study the change in the mechanism of iron cluster melting with increasing cluster size. Melting of smaller clusters (e.g., Fe 55 and Fe 100 ) occurs over a large temperature interval where the phase of the cluster repeatedly oscil- lates between liquid and solid. In contrast, larger clusters (e.g., Fe 300 ) have sharper melting points with surface melting preceding bulk melting. The importance of the simulation time, the force field and the definition of cluster melting is also discussed. Ó 2007 Elsevier B.V. All rights reserved. Keywords: Iron cluster; Molecular dynamics; Melting mechanism 1. Introduction Nanoscale clusters are becoming increasingly important in many technological applications, such as the use of pure metal or alloy nanocatalysts for carbon nanotube produc- tion. For example, pure iron catalysts are used in the car- bon vapour deposition (CVD) production of single- walled carbon nanotubes (SWNTs) [1]. These particles are believed to act as catalysts for the decomposition of carbon feedstock as well as templates for the nucleation and growth of the SWNTs [2]. An important step that links these two roles is the diffusion of carbon from the decom- position site to the growing nanotube structure, which is expected to be affected by the liquid or solid phase of the nanocluster [1,3]. It is therefore important to know how the melting point of these clusters depends on, for example, cluster size and carbon content, and to understand cluster dynamics of solid, molten and melting clusters that may affect carbon diffusion. There have been numerous experimental [4–10] and the- oretical [11–13] studies of cluster melting. These have lead to the development and application of various models of melting, such as the homogeneous melting model with a liquid layer [5], the liquid-layer melting model [14,15], the liquid nucleation and growth model with an unstable liquid layer [16,17], the liquid drop model [18] and the surface phonon instability model [19]. All of these models, which generally fit well to experimental measurements, yield a (near) linear decrease in melting point with decreasing clus- ter diameter. Other studies have focused on phase coexis- tence in finite systems [20], the pre-melting transitions between two stable solid structures [21–23], the formation of ‘liquid-like’ surface layers on solid particles that pre- cedes bulk melting [24–26], the bistability between liquid and solid phases at temperatures below complete melting [27,28] and high cluster melting temperatures for very small clusters [29] and magic number geometries [30]. 0301-0104/$ - see front matter Ó 2007 Elsevier B.V. All rights reserved. doi:10.1016/j.chemphys.2007.01.005 * Corresponding author. Tel.: +46 31 7723296; fax: +46 31 7723496. E-mail address: [email protected] (H. Duan). www.elsevier.com/locate/chemphys Chemical Physics 333 (2007) 57–62

Welcome message from author
This document is posted to help you gain knowledge. Please leave a comment to let me know what you think about it! Share it to your friends and learn new things together.
Transcript

www.elsevier.com/locate/chemphys
Chemical Physics 333 (2007) 57–62
Size dependent melting mechanisms of iron nanoclusters
Haiming Duan a,*, Feng Ding b, Arne Rosen a, Avetik R. Harutyunyan c,Stefano Curtarolo d, Kim Bolton a,e
a Physics Department, Goteborg University, SE-412 96 Goteborg, Swedenb ME&MS Department, Rice University, Houston, TX 77005, USAc Honda Research Institute USA Inc., Columbus, OH 43212, USA
d ME&MS, Duke University, Durham, NC 27708, USAe School of Engineering, University College of Boras, SE-501 90, Boras, Sweden
Received 1 September 2006; accepted 3 January 2007Available online 9 January 2007
Abstract
Molecular dynamics simulations were used to study the change in the mechanism of iron cluster melting with increasing cluster size.Melting of smaller clusters (e.g., Fe55 and Fe100) occurs over a large temperature interval where the phase of the cluster repeatedly oscil-lates between liquid and solid. In contrast, larger clusters (e.g., Fe300) have sharper melting points with surface melting preceding bulkmelting. The importance of the simulation time, the force field and the definition of cluster melting is also discussed.� 2007 Elsevier B.V. All rights reserved.
Keywords: Iron cluster; Molecular dynamics; Melting mechanism
1. Introduction
Nanoscale clusters are becoming increasingly importantin many technological applications, such as the use of puremetal or alloy nanocatalysts for carbon nanotube produc-tion. For example, pure iron catalysts are used in the car-bon vapour deposition (CVD) production of single-walled carbon nanotubes (SWNTs) [1]. These particlesare believed to act as catalysts for the decomposition ofcarbon feedstock as well as templates for the nucleationand growth of the SWNTs [2]. An important step that linksthese two roles is the diffusion of carbon from the decom-position site to the growing nanotube structure, which isexpected to be affected by the liquid or solid phase of thenanocluster [1,3]. It is therefore important to know howthe melting point of these clusters depends on, for example,
0301-0104/$ - see front matter � 2007 Elsevier B.V. All rights reserved.
doi:10.1016/j.chemphys.2007.01.005
* Corresponding author. Tel.: +46 31 7723296; fax: +46 31 7723496.E-mail address: [email protected] (H. Duan).
cluster size and carbon content, and to understand clusterdynamics of solid, molten and melting clusters that mayaffect carbon diffusion.
There have been numerous experimental [4–10] and the-oretical [11–13] studies of cluster melting. These have leadto the development and application of various models ofmelting, such as the homogeneous melting model with aliquid layer [5], the liquid-layer melting model [14,15], theliquid nucleation and growth model with an unstable liquidlayer [16,17], the liquid drop model [18] and the surfacephonon instability model [19]. All of these models, whichgenerally fit well to experimental measurements, yield a(near) linear decrease in melting point with decreasing clus-ter diameter. Other studies have focused on phase coexis-tence in finite systems [20], the pre-melting transitionsbetween two stable solid structures [21–23], the formationof ‘liquid-like’ surface layers on solid particles that pre-cedes bulk melting [24–26], the bistability between liquidand solid phases at temperatures below complete melting[27,28] and high cluster melting temperatures for very smallclusters [29] and magic number geometries [30].
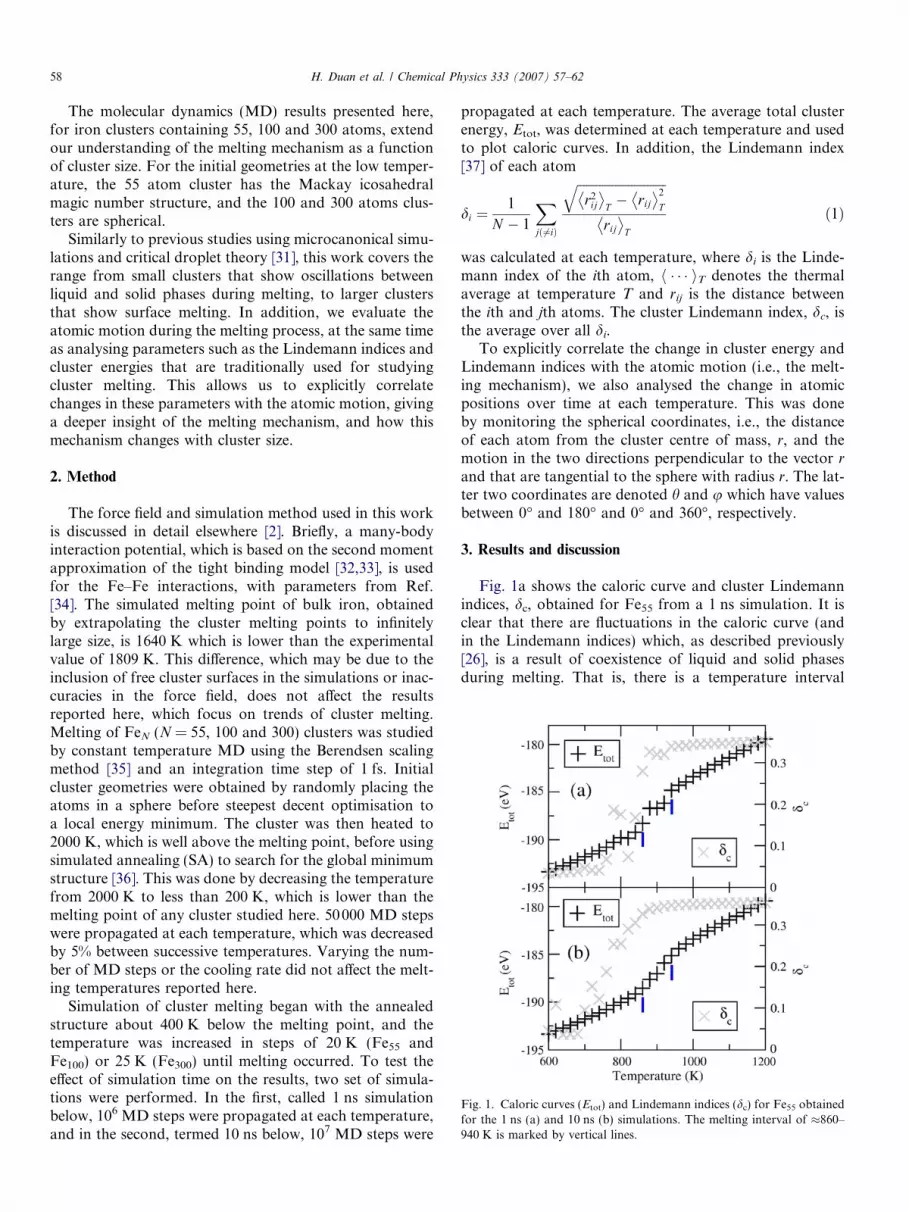
Fig. 1. Caloric curves (Etot) and Lindemann indices (dc) for Fe55 obtainedfor the 1 ns (a) and 10 ns (b) simulations. The melting interval of �860–940 K is marked by vertical lines.
58 H. Duan et al. / Chemical Physics 333 (2007) 57–62
The molecular dynamics (MD) results presented here,for iron clusters containing 55, 100 and 300 atoms, extendour understanding of the melting mechanism as a functionof cluster size. For the initial geometries at the low temper-ature, the 55 atom cluster has the Mackay icosahedralmagic number structure, and the 100 and 300 atoms clus-ters are spherical.
Similarly to previous studies using microcanonical simu-lations and critical droplet theory [31], this work covers therange from small clusters that show oscillations betweenliquid and solid phases during melting, to larger clustersthat show surface melting. In addition, we evaluate theatomic motion during the melting process, at the same timeas analysing parameters such as the Lindemann indices andcluster energies that are traditionally used for studyingcluster melting. This allows us to explicitly correlatechanges in these parameters with the atomic motion, givinga deeper insight of the melting mechanism, and how thismechanism changes with cluster size.
2. Method
The force field and simulation method used in this workis discussed in detail elsewhere [2]. Briefly, a many-bodyinteraction potential, which is based on the second momentapproximation of the tight binding model [32,33], is usedfor the Fe–Fe interactions, with parameters from Ref.[34]. The simulated melting point of bulk iron, obtainedby extrapolating the cluster melting points to infinitelylarge size, is 1640 K which is lower than the experimentalvalue of 1809 K. This difference, which may be due to theinclusion of free cluster surfaces in the simulations or inac-curacies in the force field, does not affect the resultsreported here, which focus on trends of cluster melting.Melting of FeN (N = 55, 100 and 300) clusters was studiedby constant temperature MD using the Berendsen scalingmethod [35] and an integration time step of 1 fs. Initialcluster geometries were obtained by randomly placing theatoms in a sphere before steepest decent optimisation toa local energy minimum. The cluster was then heated to2000 K, which is well above the melting point, before usingsimulated annealing (SA) to search for the global minimumstructure [36]. This was done by decreasing the temperaturefrom 2000 K to less than 200 K, which is lower than themelting point of any cluster studied here. 50000 MD stepswere propagated at each temperature, which was decreasedby 5% between successive temperatures. Varying the num-ber of MD steps or the cooling rate did not affect the melt-ing temperatures reported here.
Simulation of cluster melting began with the annealedstructure about 400 K below the melting point, and thetemperature was increased in steps of 20 K (Fe55 andFe100) or 25 K (Fe300) until melting occurred. To test theeffect of simulation time on the results, two set of simula-tions were performed. In the first, called 1 ns simulationbelow, 106 MD steps were propagated at each temperature,and in the second, termed 10 ns below, 107 MD steps were
propagated at each temperature. The average total clusterenergy, Etot, was determined at each temperature and usedto plot caloric curves. In addition, the Lindemann index[37] of each atom
di ¼1
N � 1
Xjð6¼iÞ
ffiffiffiffiffiffiffiffiffiffiffiffiffiffiffiffiffiffiffiffiffiffiffiffiffiffiffiffir2
ij
� �T� rij
� �2
T
q
rij
� �T
ð1Þ
was calculated at each temperature, where di is the Linde-mann index of the ith atom, h � � � iT denotes the thermalaverage at temperature T and rij is the distance betweenthe ith and jth atoms. The cluster Lindemann index, dc, isthe average over all di.
To explicitly correlate the change in cluster energy andLindemann indices with the atomic motion (i.e., the melt-ing mechanism), we also analysed the change in atomicpositions over time at each temperature. This was doneby monitoring the spherical coordinates, i.e., the distanceof each atom from the cluster centre of mass, r, and themotion in the two directions perpendicular to the vector r
and that are tangential to the sphere with radius r. The lat-ter two coordinates are denoted h and u which have valuesbetween 0� and 180� and 0� and 360�, respectively.
3. Results and discussion
Fig. 1a shows the caloric curve and cluster Lindemannindices, dc, obtained for Fe55 from a 1 ns simulation. It isclear that there are fluctuations in the caloric curve (andin the Lindemann indices) which, as described previously[26], is a result of coexistence of liquid and solid phasesduring melting. That is, there is a temperature interval
H. Duan et al. / Chemical Physics 333 (2007) 57–62 59
(�860–940 K seen by the vertical lines in the figure) wherethe cluster repeatedly oscillates between being completelyliquid and completely solid. However, as discussed below,the oscillations are also a result of the short simulationtime, and the solid–liquid coexistence does not lead tooscillations in the caloric curve when one obtains statisti-cally converged results.
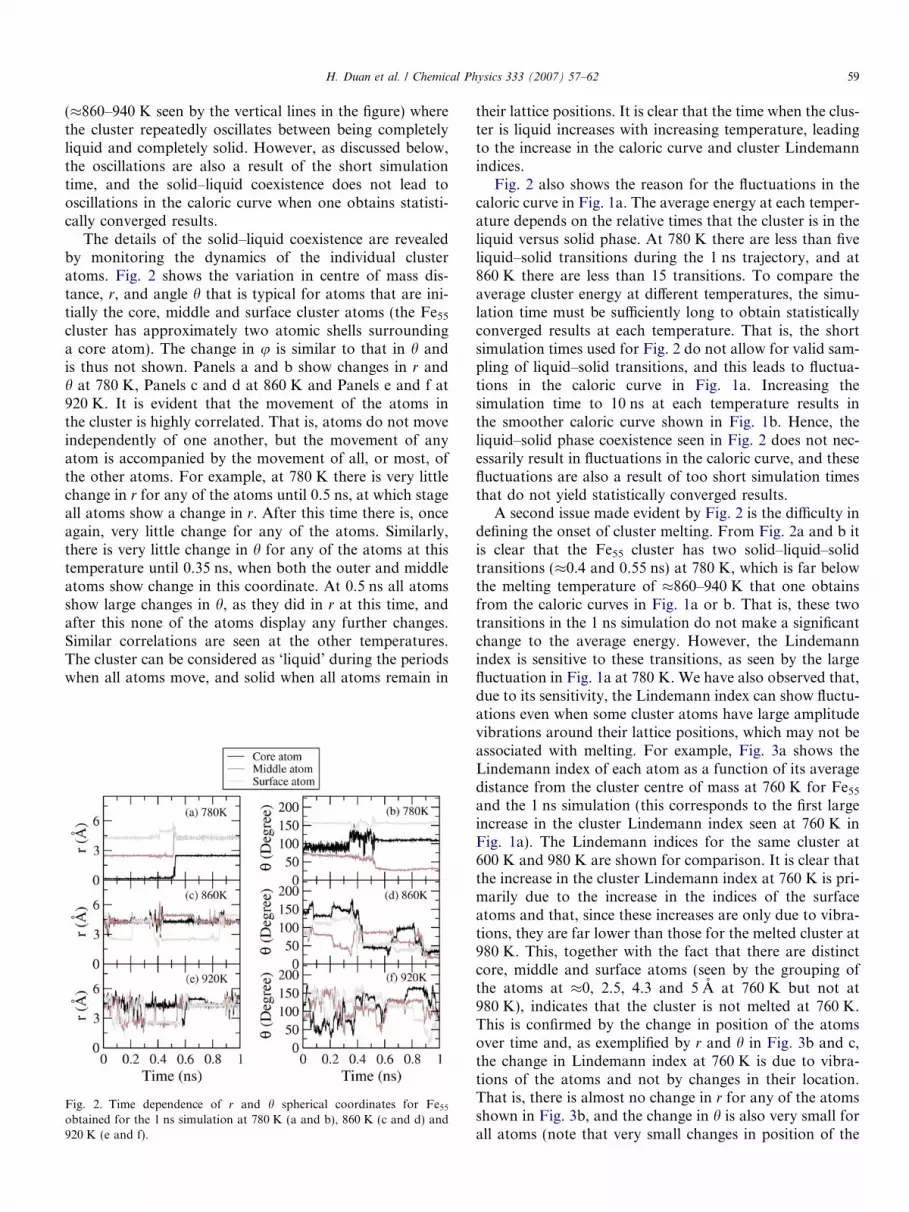
The details of the solid–liquid coexistence are revealedby monitoring the dynamics of the individual clusteratoms. Fig. 2 shows the variation in centre of mass dis-tance, r, and angle h that is typical for atoms that are ini-tially the core, middle and surface cluster atoms (the Fe55
cluster has approximately two atomic shells surroundinga core atom). The change in u is similar to that in h andis thus not shown. Panels a and b show changes in r andh at 780 K, Panels c and d at 860 K and Panels e and f at920 K. It is evident that the movement of the atoms inthe cluster is highly correlated. That is, atoms do not moveindependently of one another, but the movement of anyatom is accompanied by the movement of all, or most, ofthe other atoms. For example, at 780 K there is very littlechange in r for any of the atoms until 0.5 ns, at which stageall atoms show a change in r. After this time there is, onceagain, very little change for any of the atoms. Similarly,there is very little change in h for any of the atoms at thistemperature until 0.35 ns, when both the outer and middleatoms show change in this coordinate. At 0.5 ns all atomsshow large changes in h, as they did in r at this time, andafter this none of the atoms display any further changes.Similar correlations are seen at the other temperatures.The cluster can be considered as ‘liquid’ during the periodswhen all atoms move, and solid when all atoms remain in
Fig. 2. Time dependence of r and h spherical coordinates for Fe55
obtained for the 1 ns simulation at 780 K (a and b), 860 K (c and d) and920 K (e and f).
their lattice positions. It is clear that the time when the clus-ter is liquid increases with increasing temperature, leadingto the increase in the caloric curve and cluster Lindemannindices.
Fig. 2 also shows the reason for the fluctuations in thecaloric curve in Fig. 1a. The average energy at each temper-ature depends on the relative times that the cluster is in theliquid versus solid phase. At 780 K there are less than fiveliquid–solid transitions during the 1 ns trajectory, and at860 K there are less than 15 transitions. To compare theaverage cluster energy at different temperatures, the simu-lation time must be sufficiently long to obtain statisticallyconverged results at each temperature. That is, the shortsimulation times used for Fig. 2 do not allow for valid sam-pling of liquid–solid transitions, and this leads to fluctua-tions in the caloric curve in Fig. 1a. Increasing thesimulation time to 10 ns at each temperature results inthe smoother caloric curve shown in Fig. 1b. Hence, theliquid–solid phase coexistence seen in Fig. 2 does not nec-essarily result in fluctuations in the caloric curve, and thesefluctuations are also a result of too short simulation timesthat do not yield statistically converged results.
A second issue made evident by Fig. 2 is the difficulty indefining the onset of cluster melting. From Fig. 2a and b itis clear that the Fe55 cluster has two solid–liquid–solidtransitions (�0.4 and 0.55 ns) at 780 K, which is far belowthe melting temperature of �860–940 K that one obtainsfrom the caloric curves in Fig. 1a or b. That is, these twotransitions in the 1 ns simulation do not make a significantchange to the average energy. However, the Lindemannindex is sensitive to these transitions, as seen by the largefluctuation in Fig. 1a at 780 K. We have also observed that,due to its sensitivity, the Lindemann index can show fluctu-ations even when some cluster atoms have large amplitudevibrations around their lattice positions, which may not beassociated with melting. For example, Fig. 3a shows theLindemann index of each atom as a function of its averagedistance from the cluster centre of mass at 760 K for Fe55
and the 1 ns simulation (this corresponds to the first largeincrease in the cluster Lindemann index seen at 760 K inFig. 1a). The Lindemann indices for the same cluster at600 K and 980 K are shown for comparison. It is clear thatthe increase in the cluster Lindemann index at 760 K is pri-marily due to the increase in the indices of the surfaceatoms and that, since these increases are only due to vibra-tions, they are far lower than those for the melted cluster at980 K. This, together with the fact that there are distinctcore, middle and surface atoms (seen by the grouping ofthe atoms at �0, 2.5, 4.3 and 5 A at 760 K but not at980 K), indicates that the cluster is not melted at 760 K.This is confirmed by the change in position of the atomsover time and, as exemplified by r and h in Fig. 3b and c,the change in Lindemann index at 760 K is due to vibra-tions of the atoms and not by changes in their location.That is, there is almost no change in r for any of the atomsshown in Fig. 3b, and the change in h is also very small forall atoms (note that very small changes in position of the

Fig. 3. Atomic Lindemann indices, di, as a function of the atom’s averagedistance from the cluster centre of mass at 600, 760 and 980 K for Fe55 andthe 1 ns simulation (a), and the time dependence of r and h at 760 K (b andc).
Fig. 4. Caloric curve (Etot) and Lindemann indices (dc) for Fe300 obtainedfrom the 10 ns simulation.
60 H. Duan et al. / Chemical Physics 333 (2007) 57–62
core atom can yield large changes in h for this atom). Forthese reasons, and since there are significant fluctuations inthe Lindemann indices even for the longer 10 ns trajectories(Fig. 1b), we use the caloric curves to determine the meltingtemperatures in this work. This is consistent with experi-mentally measured melting points which are usually deter-mined from latent heats. However, the choice of theparameter (Lindemann index or cluster energy) dependson how one identifies the onset of melting, and it is impor-tant to clearly state which parameter one uses to obtain thesimulated melting point.
The melting mechanism of the Fe100 cluster is very sim-ilar to that of the Fe55 cluster, showing that the mechanismis not specific for magic number clusters. Similarly to thediscussion above, there are fluctuations in the caloric curvefor the shorter 1 ns simulation, making it difficult to iden-tify a melting interval. However, the caloric curve obtainedfrom the 107 step simulation was smooth (similar to that ofFig. 1b) and yielded a melting interval of 760 to 800 K. Themelting interval is thus narrower than that of Fe55, as isexpected for larger clusters. It is noteworthy that the
Fe100 cluster melts at a lower temperature than Fe55, whichis due to the increased stability of the magic number clusteras previously seen for Ga clusters [30]. Preliminary resultsof studies based on other iron clusters show that clustersthat have similar sizes to Fe55 but that are not magic num-ber clusters (e.g., Fe50 and Fe60) have melting points(�640–780 K) that are lower than that of Fe55.
Very different melting is seen for larger clusters. Fig. 4shows the caloric curve and Lindemann indices for Fe300
obtained from the 10 ns simulation (similar results areobserved for the 1 ns simulation). The melting point at�1100 K is sharp, which is consistent with the trend thatlarger clusters have narrower melting intervals. Also, incontrast to the results obtained from the smaller clusters,the change in Lindemann indices is in fairly good agree-ment with the change in total energy, although it stilloccurs at slightly lower temperatures.
The melting mechanism is also very different for theselarger clusters. Fig. 5a and b show the change in r and hfor inner and surface atoms of Fe300 at 1075 K obtainedfrom the 10 ns trajectory. It is clear that the movement ofinner and surface atoms is not strongly correlated (as theywere in Fig. 2 for Fe55) and that the surface atom is moremobile. For example, the surface atom exhibits twochanges in r and h between 1 and 2 ns, and a very largechange in these variables at 10 ns. This is not accompaniedby similarly large changes in the inner atom coordinates,where r remains almost constant over the entire trajectoryand the fluctuations in h (which are rather large since this isthe inner atom) are not pronounced at the times when theouter atom showed large amplitude motion. This largeamplitude motion of the outer atoms that is not accompa-nied by similar motion of the inner atoms is associated with‘surface melting’ or a ‘liquid-like layer’, and is also evidentin Fig. 5c, which shows the atomic Lindemann indices forFe300 obtained from the 10 ns simulation at 900, 1075 and1100 K. Similarly to the small clusters, one can identifyinner and ‘surface’ atoms at temperatures below melting.However, in contrast to the smaller clusters, the surfaceatoms just below melting (1075 K) have Lindemann indices

Fig. 5. Time dependence of r and h for Fe300 obtained from the 10 nssimulation at 1075 K (a and b), and the atomic Lindemann indices, di, as afunction of the atom’s average distance from the cluster centre of mass at900, 1075 and 1100 K.
H. Duan et al. / Chemical Physics 333 (2007) 57–62 61
of similar magnitude to the atoms in the molten cluster,and there is a clear clustering of the average centre of masspositions of these atoms (around 8 A in the figure).
It is important to note that this paper focuses on quali-tative results, i.e., trends in the melting intervals and mech-anisms with changes in cluster size. This is partly due to thedifficulty in defining the onset of the melting (using theLindemann indices would yield different melting pointsbut the same trends), but also because of possible inaccura-cies in the force field used for these calculations. We havethus not focussed on quantitative results such as the spe-cific cluster size(s) where the change from ‘solid–liquidcoexistence’ to ‘surface melting’ mechanism occurs. How-ever, of significance here is that other force fields, includingthose for gold [22] and aluminium [26] clusters, show sim-ilar trends as those seen here, which indicates that theresults reported here are not an artefact of the force field.
4. Conclusion
The molecular dynamics studies presented here showthat small and large iron clusters have different melting
mechanisms. Melting of smaller clusters (e.g., Fe55 andFe100) occurs over a large temperature range, where thereare repeated transitions between the liquid and solidphases. That is, at any particular instant the cluster isentirely liquid (seen by the simultaneous motion of all, ormost, cluster atoms) or entirely solid. In contrast, largerclusters have sharper melting points, and ‘liquid-like’ sur-face regions simultaneously coexist with solid cluster coresat temperatures below melting. Hence, although bothmechanisms can be described as liquid–solid phase coexis-tence, the coexistence for the small clusters is over time andfor the large clusters over space.
The work presented here focuses on qualitative trends inthe change in melting points and mechanisms with clustersize, which are not sensitive to the simulation time, forcefield, or if the Lindemann index or caloric curve is usedin the analysis.
Acknowledgements
The authors are grateful for time allocated on the Swed-ish National Supercomputing facilities. Financial supportwas obtained from the Swedish Research Council, theSwedish Foundation for Strategic Research (CARAMELconsortium) and The Honda Research Institute, Inc.
References
[1] A.R. Harutyunyan, E. Mora, T. Tokune, Appl. Phys. Lett. 87 (2005)051919.
[2] F. Ding, K. Bolton, A. Rosen, J. Phys. Chem. B 108 (2004) 17369.[3] F. Ding, A. Rosen, K. Bolton, Carbon 43 (2005) 2215.[4] T. Castro, R. Reifenberger, E. Choi, R.P. Andres, Phys. Rev. B 42
(1990) 8548.[5] P.A. Buffat, J.P. Borel, Phys. Rev. A 13 (1976) 2287.[6] K.F. Peters, J.B. Cohen, Y.W. Chung, Phys. Rev. B 57 (1998) 13430.[7] S.L. Lai, J.Y. Guo, V. Petrova, G. Ramanath, L.H. Allen, Phys. Rev.
Lett. 77 (1996) 99.[8] S.L. Lai, J.R.A. Carlsson, L.H. Allen, Appl. Phys. Lett. 72 (1998)
1098.[9] M. Dipple, A. Maier, V. Gimple, H. Wider, W.E. Evenson, R.L.
Rasera, G. Schatz, Phys. Rev. Lett. 87 (2001) 095505.[10] M. Zhang, M.Yu. Efremov, F. Schiettekatte, E.A. Olson, A.T. Kwan,
S.L. Lai, T. Wisleder, J.E. Greene, L.H. Allen, Phys. Rev. B 62 (2000)10548.
[11] Y. Qi, T. Cagin, W.L. Johnson, W.A. Goddard, J. Chem. Phys. 115(2001) 385.
[12] F. Ding, K. Bolton, A. Rosen, J. Vac. Sci. Technol. A 22 (2004) 1471.[13] F. Ding, A. Rosen, K. Bolton, Phys. Rev. B 70 (2004) 075416.[14] C.R.M. Wronski, J. Appl. Phys. 18 (1967) 1731.[15] K.J. Hanszen, Z. Phys. 157 (1960) 523.[16] R.R. Vanfleet, J.M. Mochel, Surf. Sci. 341 (1995) 40.[17] H. Reiss, P. Mirabel, R.L. Wetten, J. Phys. Chem. 92 (1988) 7241.[18] K.K. Nanda, S.N. Sahu, S.N. Behera, Phys. Rev. A 66 (2002) 013208.[19] M. Wautelet, J. Phys. D: App. Phys. 24 (1991) 343.[20] D.J. Wales, R.S. Berry, Phys. Rev. Lett. 73 (1994) 2875.[21] C.L. Cleveland, W.D. Luedtke, U. Landman, Phys. Rev. Lett. 81
(1998) 2036.[22] D. Schebarchov, S.C. Hendy, Phys. Rev. B 73 (2006) 121402-1.[23] D. Schebarchov, S.C. Hendy, Phys. Rev. Lett. 95 (2005) 116101.[24] F. Ercolessi, W. Andreoni, E. Tosatti, Phys. Rev. Lett. 66 (1991) 911.[25] R.E. Kunz, R.S. Berry, Phys. Rev. Lett. 71 (1993) 3987.

62 H. Duan et al. / Chemical Physics 333 (2007) 57–62
[26] G.A. Breaux, C.M. Neal, B. Cao, M.F. Jarrold, Phys. Rev. Lett. 94(2005) 173401-1.
[27] J.D. Honeycutt, H.C. Andersen, J. Phys. Chem. 91 (1987) 4590.[28] S. Alavi, D.L. Thompson, J. Phys. Chem. A 110 (2006) 1518.[29] G.A. Breaux, R.C. Benirschke, T. Sugai, B.S. Kinnear, M.F. Jarrold,
Phys. Rev. Lett. 91 (2003) 215508-1.[30] K. Joshi, S. Krishnamurty, D.G. Kanhere, Phys. Rev. Lett. 96 (2006)
135703-1.[31] S.C. Hendy, Phys. Rev. B 71 (2005) 115404.
[32] V. Rosato, M. Guillope, B. Legrand, Philos. Mag. A 59 (1989) 321.[33] R.P. Gupta, Phys. Rev. B 23 (1981) 6265.[34] J. Stanek, G. Marest, H. Jaffrezic, H. Binczycka, Phys. Rev. B 52
(1995) 8414.[35] H.J.C. Berendsen, J.P.M. Postma, W.F. van Gunsteren, A. DiNola,
J.R. Haak, J. Chem. Phys. 81 (1984) 3684.[36] S. Kirkpatrick, C.D. Gelatt Jr., M.P. Vecchi, Science 220 (1983) 671.[37] F.A. Lindemann, Phys. Z. 11 (1910) 609.
Related Documents


