12/23/2014 1 12/23/2014 1 DMAIC

Six Sigma Project on Increase in Productivity through Waste Reduction
Jul 16, 2015
Welcome message from author
This document is posted to help you gain knowledge. Please leave a comment to let me know what you think about it! Share it to your friends and learn new things together.
Transcript
12/23/20141 12/23/20141
DMAIC
12/23/20142
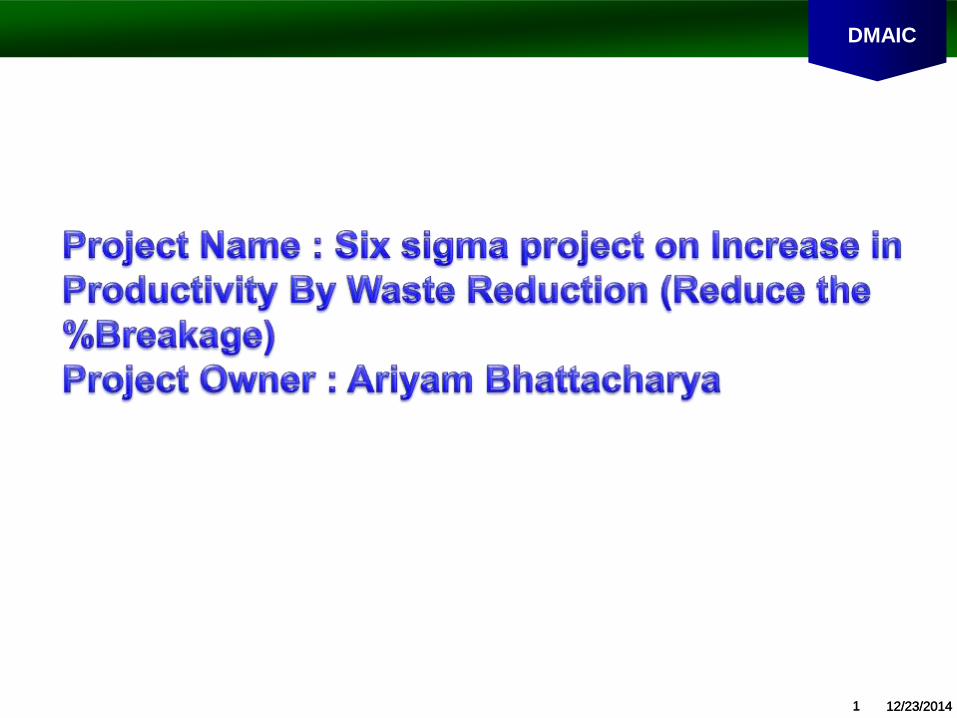
Customer Sample Comments
Key Output Characteristics
Important to Customer
(CTQ's)
VP • The objective is to increase the overall
productivity & minimise the waste without
compromising quality
• Improvement in productivity
• Reduce waste
• Quality
Process owner • We have to reduce the total no of breakage
and maintain the breakage below 3% .
• Improvement in Productivity
• Reduce % of breakage.
DefineMap the Project

12/23/20143
Project Charter Define
Project Leader: Soumen Jana Team Members
Business Case: “X” has been one of the leading biscuit brands in
India for the last 8 decades. “X” is reputed to enjoy the most sales
among all biscuit brands in the world. Its biscuits offer a fantastic
combination of quality, taste, and nutrition. “X” biscuits are
available even in faraway villages. At present the company has a 40
percent share of the Indian market for biscuits and is a multi-million
dollar organization.
Stakeholders VP
Sponsor GM
SME Sen Manager
Team Member SME,QA, 2 Associates, Financial controller, GB, BB
Problem Statement: For the period of June 10 to Jan 11 the total productivity was reduced as
%breakage is more than 3.
Goal Statement:To improve process productivity by decreasing the total no of breakage.
%Breakage should be decreased to below 3.
Project In Scope: 1. Production, Quality, vendors and store
Project Out of Scope:
Timelines/Milestones/Phases
Start Date End Date
Start date: 1h Feb 2011 -
DEFINE 15th Feb 2011 10th March
MEASURE 11th March 15th April
ANALYZE 17th April 30th May
IMPROVE 5th May 20th June
CONTROL 25th June 15th Aug 2011
12/23/20144
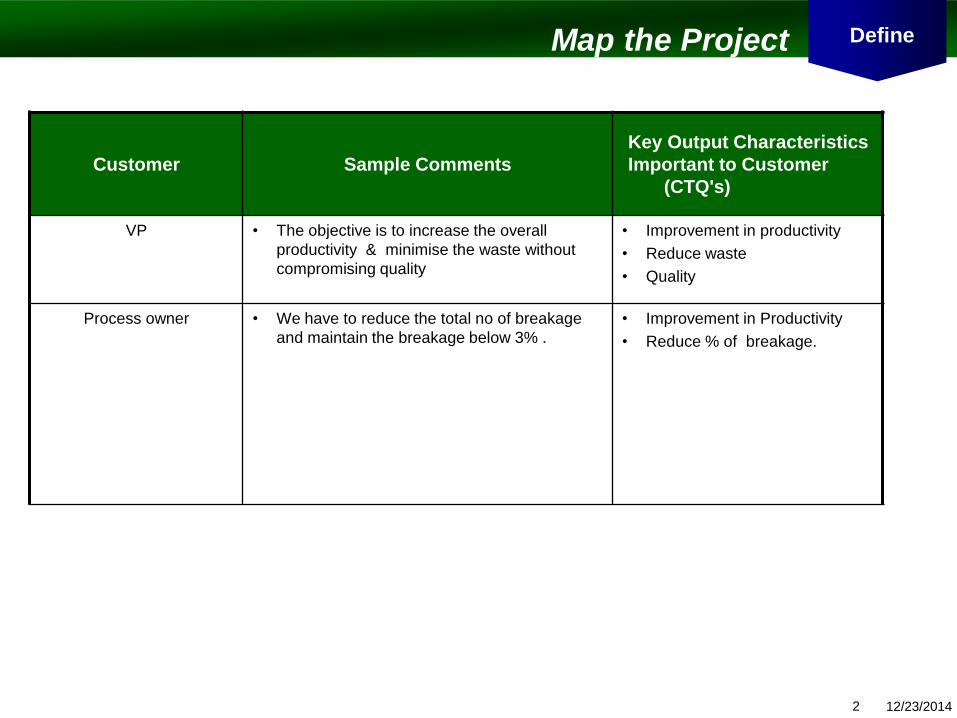
Key Stakeholders Define Measure Analyze Improve Control
VP I
GM A R A M A
Senior Manager M M M M M
BB M M M M M
GB M M M M M
M1,M2 -- --- M M M
Financial controller I I I I M
Message Audience Media Who When
Communication Plan
Define
ARMI Worksheet
ARMI & Communication Plan

12/23/20145
Customer Output Process Input Supplier
COPIS Define
Purchase Raw
Materials
Quality
Inspection
Issue RMs to
production
Mixing of RMs
in predefined
condition
Dough Making
Designing &
cutting
Vendors Order placed Raw Material Store and Quality
Warehouse RM sampleApproved RMs Production
Warehouse and
QualityApproved RM
Start Process Production
Production
operatorRaw material
charging as
per sequence
Homogeneous
pasteProduction
Production Paste Proper Dough Production
Production Proper Dough Proper shape Production
12/23/20146
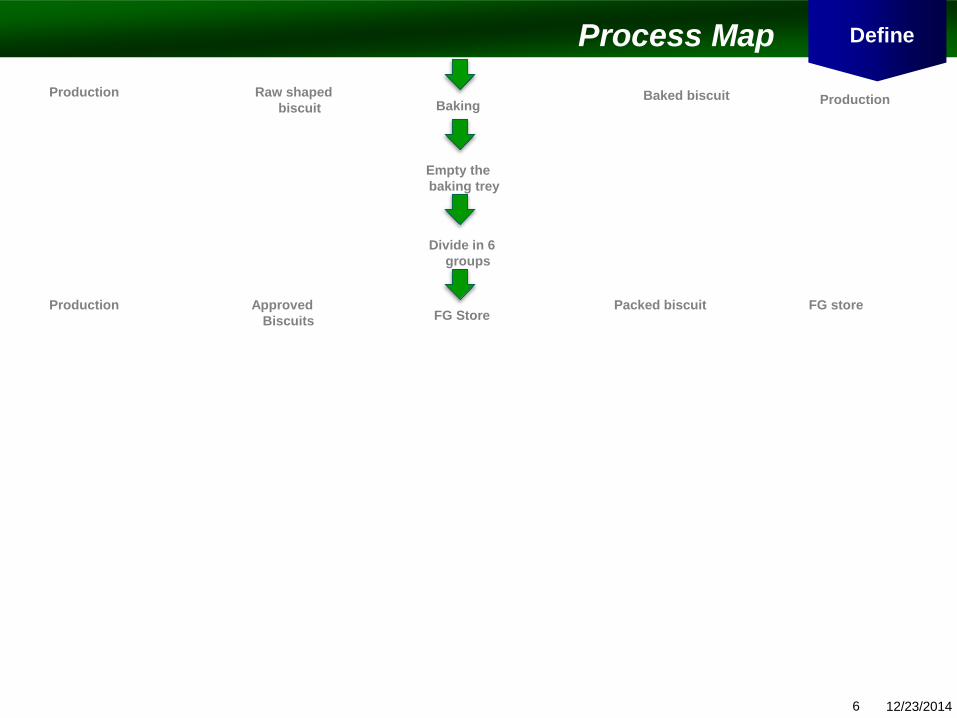
Process Map Define
Baking
Empty the
baking trey
Divide in 6
groups
FG Store
Production Raw shaped
biscuitBaked biscuit Production
Production Approved
Biscuits
Packed biscuit FG store

12/23/20147
Y Operational
Definition
Defect
Definition
Performance
Standard
Specification
Limit
Opportunity
%Breakage It is defined as the
percentage of total
no of biscuits
broken against total
production
%Breakage greater
than 3
%Breakage <=3 USL = 3
LSL = 0
Daily
Y Data Type UnitDecimal to
be Used
Data Base
Container
Existing or
new data
base
If New when
data base
would be
ready.
Plan start
date for
DCP
%Breakage Discrete No Upto Two Excel Existing NA 11th March
11
Data Collection Plan
Equipment
Used for
measurement
Equipment
Calibration
Information
Responsibility
Any
Training
need
Operator
Information
Measure

12/23/20148
Measurement System Analysis
Rule Rule Description Acceptable Result
AR&R % of
Tolerance<10%
B
% Contribution
(R&R Std
deviation)
Smaller than
Part-to-part
variance
CNumber of distinct
categories>4
Overall Gage result
Minitab Descriptive Stats
Insert Minitab session window descriptive stats.
For discrete data use the attribute gage study
exhibit from Minitab
Measure

12/23/20149
Measure
Median 4.25
Mean 4.430
Mode 4.969
Std Dev 0.924
Cp 0.541
Cpk -0.516
Z value -1.547
Z Score of the process is really poor, there is immediate need to improve the process capability
Process capability Analysis
12/23/201410
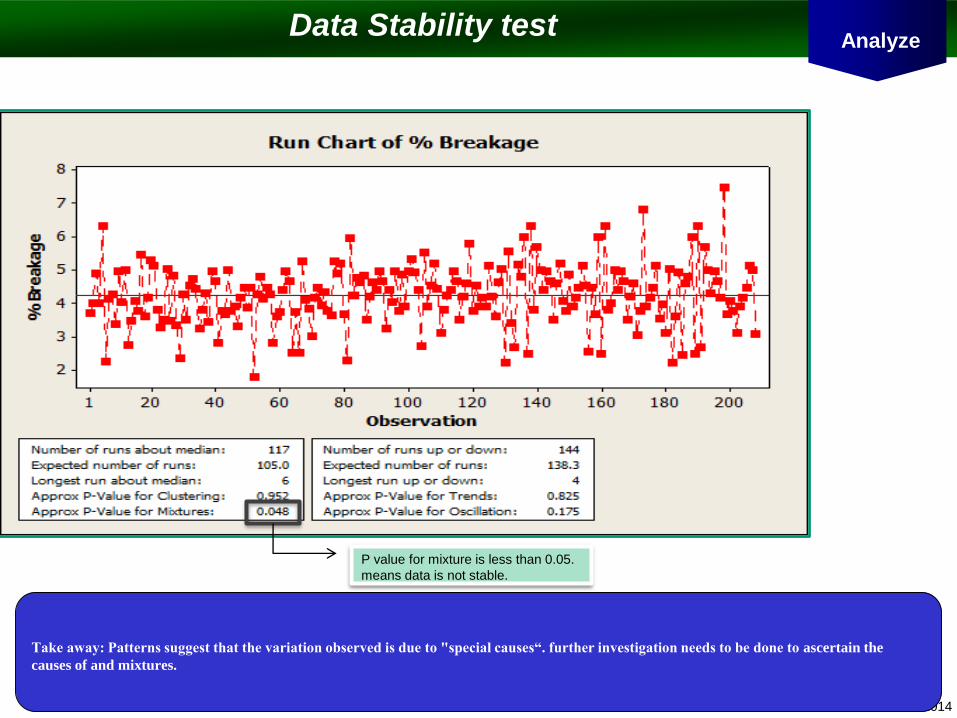
Data Stability test
Take away: Patterns suggest that the variation observed is due to "special causes“. further investigation needs to be done to ascertain the
causes of and mixtures.
P value for mixture is less than 0.05.
means data is not stable.
Analyze
12/23/201411
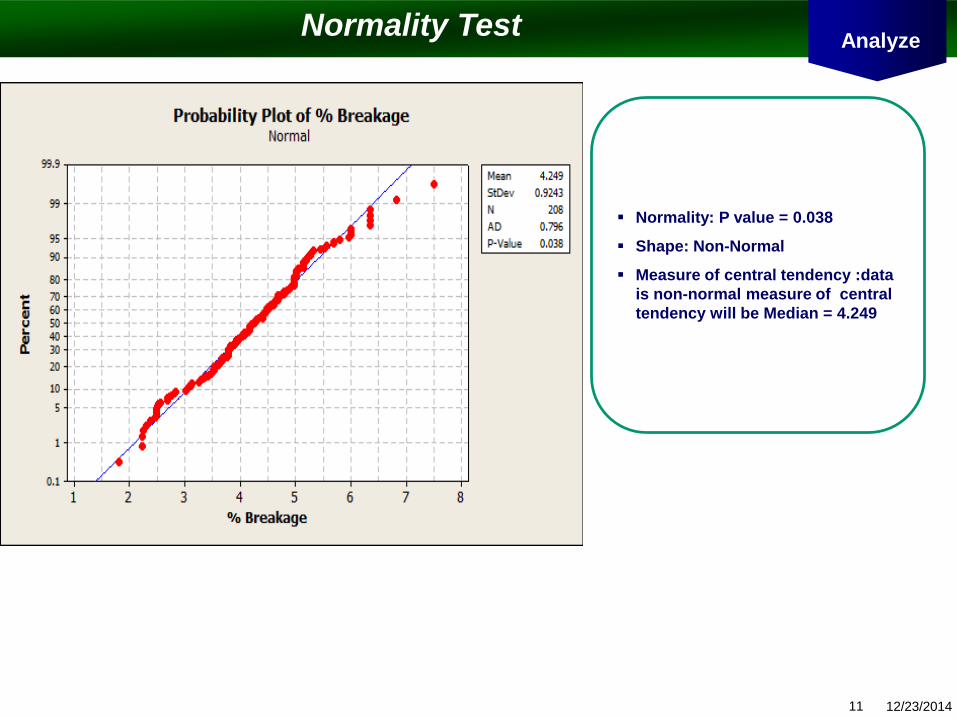
Normality Test
Normality: P value = 0.038
Shape: Non-Normal
Measure of central tendency :data
is non-normal measure of central
tendency will be Median = 4.249
Analyze
12/23/201412
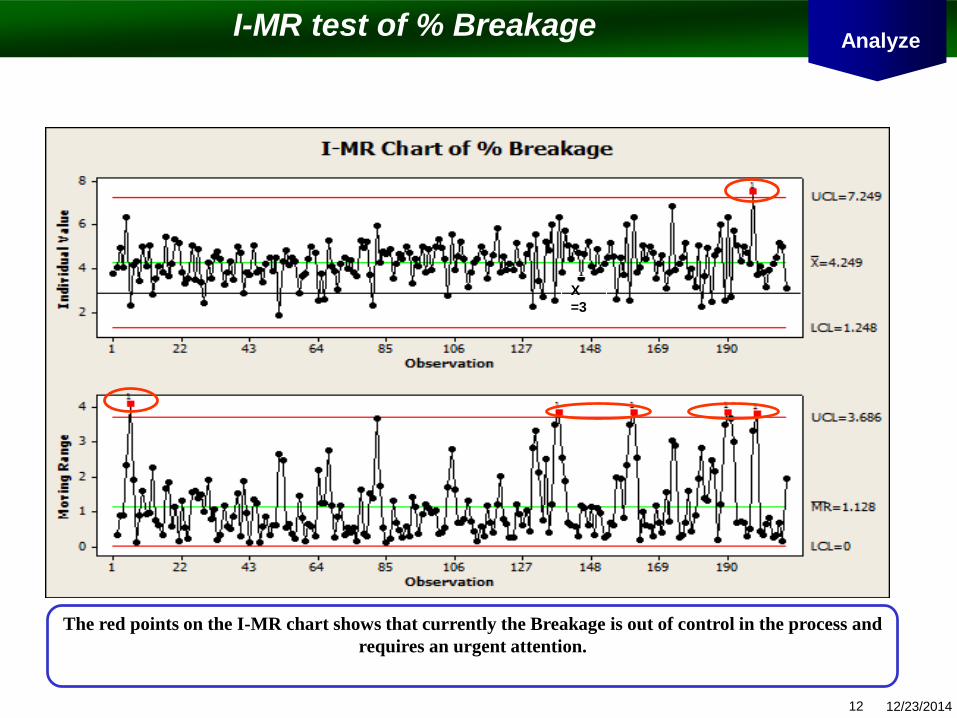
I-MR test of % BreakageAnalyze
The red points on the I-MR chart shows that currently the Breakage is out of control in the process and
requires an urgent attention.
X
=3

12/23/201413
Proposed tests according to problem and factor’s data typeAnalyze
S No. Potential Cause Operational Definition Data Type Test of be performed
1%Breakage from
MachinesPercentage of broken biscuit for each machine against total biscuit produced
Cont Correlation & Regression
2 Baking time Time required for baking of biscuits produced in a day ContCorrelation & Regression
3 Baking temp. Temp. required for baking of biscuit produced in a day Cont Correlation & Regression
4 Oven Used for baking of biscuits Discrete 1-sample sign.
5 WAP(maida%) ContCorrelation & Regression
6 Oval heat up time Cont Correlation & Regression
7 Vendor of Maida Discrete 1-sample sign.
8 Moisture %(maida) Moisture present in maida in percentage ContCorrelation & Regression
9 Moisture (Ghee%)Moisture present in ghee in percentage
ContCorrelation & Regression
10 Vendor of Ghee Discrete 1-sample sign.

12/23/201414
Regression Analysis: % Breakage versus %A
The regression equation is
% Breakage = 3.57 + 0.817 %A
Predictor Coef SE Coef T P
%A 0.8170 0.1039 7.87 0.000
S = 0.812521 R-Sq = 23.1% R-Sq(adj) =
22.7%
AnalyzeRegression Test between %Breakage & %Breakage from each machine
Regression Analysis: % Breakage
versus %B
The regression equation is
% Breakage = 4.04 + 0.305 %B
Predictor Coef SE Coef T P
%B 0.3046 0.1446 2.11 0.036
S = 0.916705 R-Sq = 2.1% R-
Sq(adj) = 1.6%
Regression Analysis: % Breakage versus
%C
The regression equation is
% Breakage = 3.73 + 0.855 %C
Predictor Coef SE Coef T P
%C 0.8550 0.1332 6.42 0.000
S = 0.845816 R-Sq = 16.7% R-Sq(adj) =
16.3%
Regression Analysis: % Breakage
versus %D
The regression equation is
% Breakage = 4.36 - 0.328 %D
Predictor Coef SE Coef T
P
%D -0.3283 0.3136 -1.05
0.296
Regression Analysis: % Breakage
versus %E
The regression equation is
% Breakage = 3.75 + 0.908 %E
Predictor Coef SE Coef T P
%E 0.9079 0.1925 4.72 0.000
S = 0.880239 R-Sq = 9.7% R-Sq(adj)
= 9.3%
The regression equation is
% Breakage = 3.47 + 0.641 %F
Predictor Coef SE Coef T P
%F 0.64115 0.08125 7.89 0.000
S = 0.811917 R-Sq = 23.2% R-Sq(adj)
= 22.8%
The Regression test shows that since the P-Value is < 0.05, %Breakage from Machine A,B,C,E,F (X) has impact
on Total % Breakage (Y).

12/23/201415
Regression Analysis: % Breakage versus
Baking Time
The regression equation is
% Breakage = 2.70 + 0.0933 Baking Time
Predictor Coef SE Coef T P
Baking Time 0.09331 0.04421 2.11 0.036
S = 0.916668 R-Sq = 2.1% R-Sq(adj) =
1.6%
Regression Test between %Breakage &
%Breakage from each machineRegression Test between %Breakage & Baking time
Analyze
The Regression test shows that since the P-Value is < 0.05, Baking time has impact on % Breakage (Y).

12/23/201416
Regression Analysis: % Breakage versus Baking Temp
The regression equation is
% Breakage = 13.6 - 0.0443 Baking Temp
Predictor Coef SE Coef T P
Baking Temp -0.04434 0.02049 -2.16 0.032
S = 0.916172 R-Sq = 2.2% R-Sq(adj) = 1.7%
Regression Test between %Breakage & Baking temp Analyze
The Regression test shows that since the P-Value is < 0.05, Baking temp has a –ve impact on % Breakage (Y).
12/23/201417
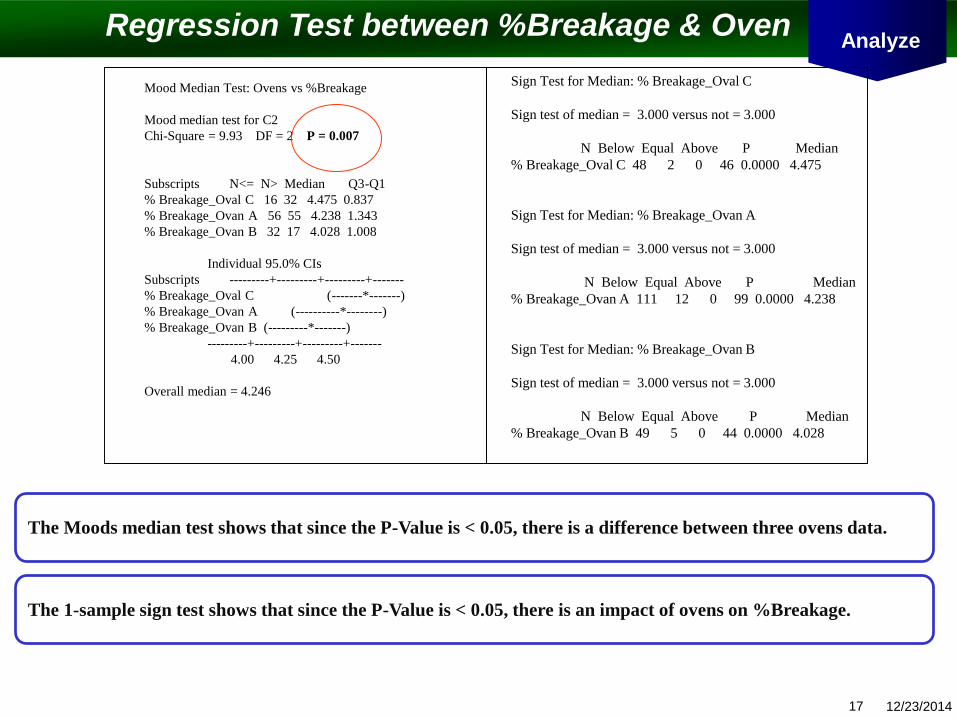
Mood Median Test: Ovens vs %Breakage
Mood median test for C2
Chi-Square = 9.93 DF = 2 P = 0.007
Subscripts N<= N> Median Q3-Q1
% Breakage_Oval C 16 32 4.475 0.837
% Breakage_Ovan A 56 55 4.238 1.343
% Breakage_Ovan B 32 17 4.028 1.008
Individual 95.0% CIs
Subscripts ---------+---------+---------+-------
% Breakage_Oval C (-------*-------)
% Breakage_Ovan A (----------*--------)
% Breakage_Ovan B (---------*-------)
---------+---------+---------+-------
4.00 4.25 4.50
Overall median = 4.246
Regression Test between %Breakage & OvenAnalyze
The Moods median test shows that since the P-Value is < 0.05, there is a difference between three ovens data.
Sign Test for Median: % Breakage_Oval C
Sign test of median = 3.000 versus not = 3.000
N Below Equal Above P Median
% Breakage_Oval C 48 2 0 46 0.0000 4.475
Sign Test for Median: % Breakage_Ovan A
Sign test of median = 3.000 versus not = 3.000
N Below Equal Above P Median
% Breakage_Ovan A 111 12 0 99 0.0000 4.238
Sign Test for Median: % Breakage_Ovan B
Sign test of median = 3.000 versus not = 3.000
N Below Equal Above P Median
% Breakage_Ovan B 49 5 0 44 0.0000 4.028
The 1-sample sign test shows that since the P-Value is < 0.05, there is an impact of ovens on %Breakage.
12/23/201418
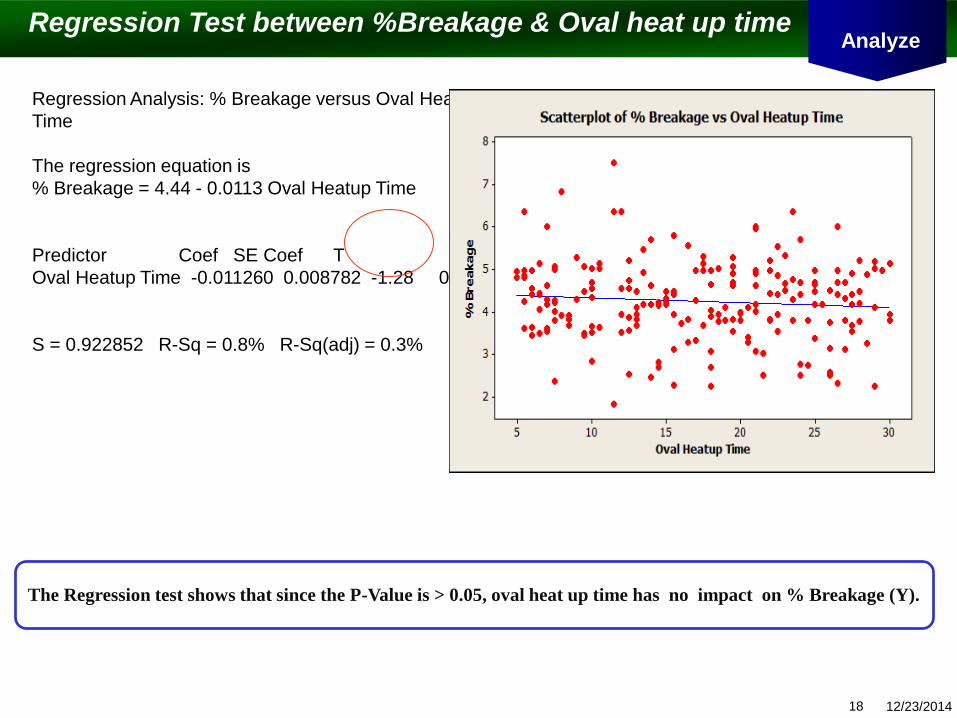
Regression Analysis: % Breakage versus Oval Heatup
Time
The regression equation is
% Breakage = 4.44 - 0.0113 Oval Heatup Time
Predictor Coef SE Coef T P
Oval Heatup Time -0.011260 0.008782 -1.28 0.201
S = 0.922852 R-Sq = 0.8% R-Sq(adj) = 0.3%
Regression Test between %Breakage & Oval heat up timeAnalyze
The Regression test shows that since the P-Value is > 0.05, oval heat up time has no impact on % Breakage (Y).
12/23/201419
Regression Test between %Breakage & Wap (maida%)Analyze
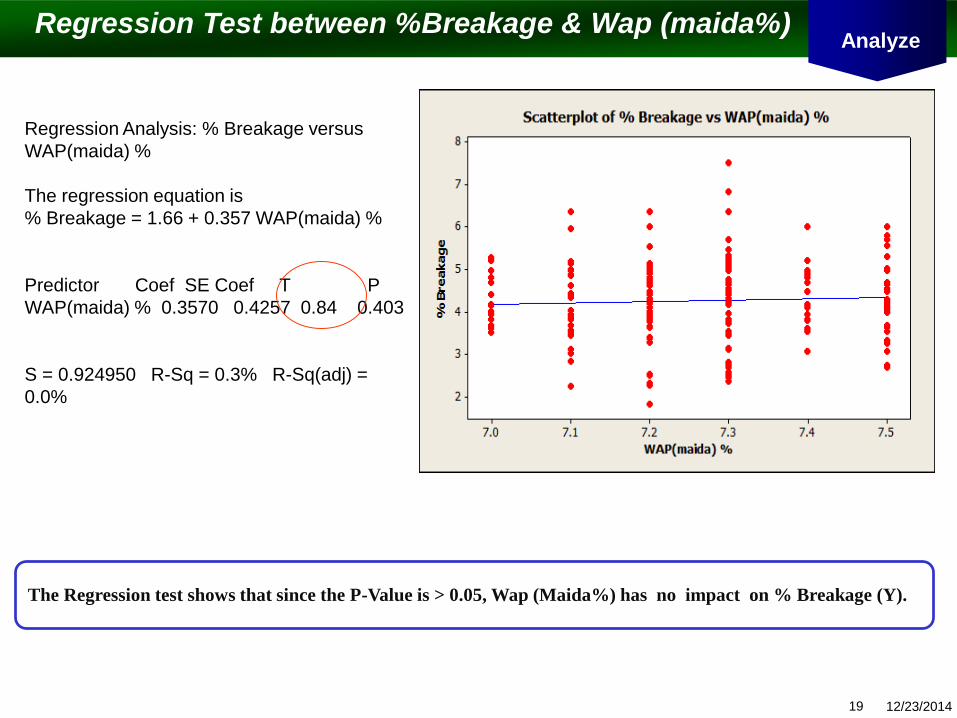
Regression Analysis: % Breakage versus
WAP(maida) %
The regression equation is
% Breakage = 1.66 + 0.357 WAP(maida) %
Predictor Coef SE Coef T P
WAP(maida) % 0.3570 0.4257 0.84 0.403
S = 0.924950 R-Sq = 0.3% R-Sq(adj) =
0.0%
The Regression test shows that since the P-Value is > 0.05, Wap (Maida%) has no impact on % Breakage (Y).

12/23/201420
Regression Test between %Breakage & Maida vendorAnalyze
Mood Median Test: Maida vendors
Mood median test for C2
Chi-Square = 1.61 DF = 2 P = 0.446
Subscripts N<= N> Median Q3-Q1
% Breakage_Bikajee 55 57 4.270 1.143
% Breakage_Kalkaji 26 19 4.097 1.298
% Breakage_Panwar 23 28 4.413 1.156
Individual 95.0% CIs
Subscripts -------+---------+---------+---------
% Breakage_Bikajee (--------*-------)
% Breakage_Kalkaji (----------*------------)
% Breakage_Panwar (-------------*------)
-------+---------+---------+---------
4.00 4.25 4.50
Overall median = 4.246
The Moods median test shows that since the P-Value is >0.05, there is no difference between data of Maida
vendors
The 1-sample sign test shows that since the P-Value is < 0.05, there is an impact of Maida vendors on
%Breakage.
Sign Test for Median: % Breakage_Kalkaji
Sign test of median = 3.000 versus not = 3.000
N Below Equal Above P Median
% Breakage_Kalkaji 45 5 0 40 0.0000 4.097
Sign Test for Median: % Breakage_Panwar
Sign test of median = 3.000 versus not = 3.000
N Below Equal Above P Median
% Breakage_Panwar 51 4 0 47 0.0000 4.413
12/23/201421
Regression Test between %Breakage & Moisture % in MaidaAnalyze
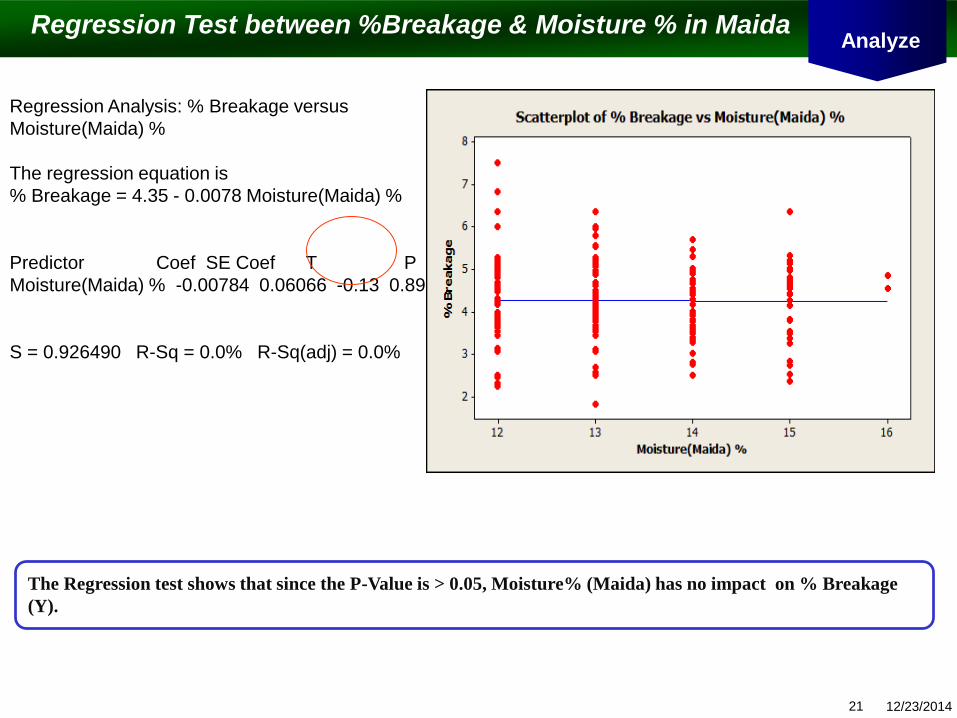
Regression Analysis: % Breakage versus
Moisture(Maida) %
The regression equation is
% Breakage = 4.35 - 0.0078 Moisture(Maida) %
Predictor Coef SE Coef T P
Moisture(Maida) % -0.00784 0.06066 -0.13 0.897
S = 0.926490 R-Sq = 0.0% R-Sq(adj) = 0.0%
The Regression test shows that since the P-Value is > 0.05, Moisture% (Maida) has no impact on % Breakage
(Y).

12/23/201422
Regression Test between %Breakage & Moisture % in GheeAnalyze
Regression Analysis: % Breakage versus Moisture(Ghee) %
The regression equation is
% Breakage = 1.15 + 0.243 Moisture(Ghee) %
Predictor Coef SE Coef T P
Moisture(Ghee) % 0.24349 0.05938 4.10 0.000
S = 0.890878 R-Sq = 7.5% R-Sq(adj) = 7.1%
The Regression test shows that since the P-Value is < 0.05, Moisture% (Ghee) has an impact on % Breakage
(Y).

12/23/201423
Regression Test between %Breakage & Vendor for GheeAnalyze
Sign Test for Median: % Breakage_Amul
Sign test of median = 3.000 versus not = 3.000
N Below Equal Above P Median
% Breakage_Amul 78 7 0 71 0.0000 4.086
Sign Test for Median: % Breakage_Gopal
Sign test of median = 3.000 versus not = 3.000
N Below Equal Above P Median
% Breakage_Gopal 58 6 0 52 0.0000 4.402
Sign Test for Median: % Breakage_Madhusudan
Sign test of median = 3.000 versus not = 3.000
N Below Equal Above P Median
% Breakage_Madhusudan 71 6 0 65 0.0000 4.400
Sign Test for Median: % Breakage_MD
Sign test of median = 3.000 versus not = 3.000
N Below Equal Above P Median
% Breakage_MD 1 0 0 1 1.0000 4.554
Mood Median Test: C2 versus Subscripts
Mood median test for C2
Chi-Square = 3.82 DF = 2 P = 0.148
Subscripts N<= N> Median Q3-Q1
% Breakage_Amul 46 32 4.086 1.089
% Breakage_Gopal 26 32 4.402 1.186
% Breakage_Madhusudan 32 39 4.400 1.156
% Breakage_MD 0 1 4.554 *
Individual 95.0% CIs
Subscripts --------+---------+---------+--------
% Breakage_Amul (----------*-------)
% Breakage_Gopal (-----------*----------)
% Breakage_Madhusudan (---------*-------)
% Breakage_MD
--------+---------+---------+--------
4.00 4.25 4.50
Overall median = 4.246
The Moods median test shows that since the P-
Value is >0.05, there is no difference between data
of Ghee vendors
The 1-sample sign test shows that since the P-Value is < 0.05, there is an impact of Ghee vendors on %Breakage.
12/23/201424
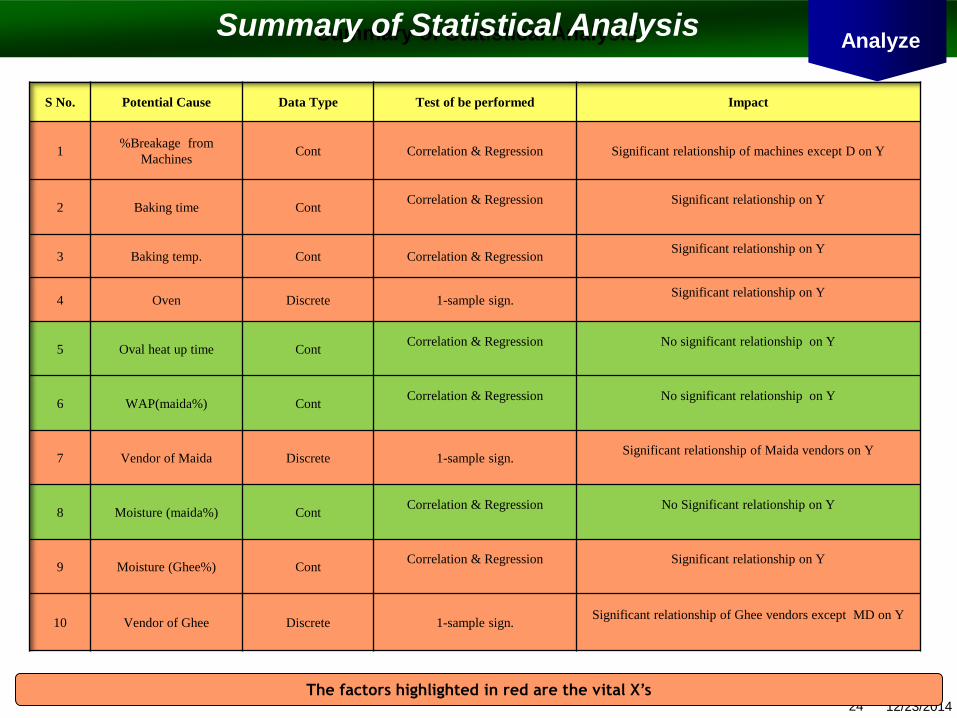
S No. Potential Cause Data Type Test of be performed Impact
1%Breakage from
MachinesCont Correlation & Regression Significant relationship of machines except D on Y
2 Baking time ContCorrelation & Regression Significant relationship on Y
3 Baking temp. Cont Correlation & RegressionSignificant relationship on Y
4 Oven Discrete 1-sample sign.Significant relationship on Y
5 Oval heat up time ContCorrelation & Regression No significant relationship on Y
6 WAP(maida%) ContCorrelation & Regression No significant relationship on Y
7 Vendor of Maida Discrete 1-sample sign.Significant relationship of Maida vendors on Y
8 Moisture (maida%) ContCorrelation & Regression No Significant relationship on Y
9 Moisture (Ghee%) ContCorrelation & Regression Significant relationship on Y
10 Vendor of Ghee Discrete 1-sample sign.Significant relationship of Ghee vendors except MD on Y
Summary of Statistical AnalysisSummary of Statistical AnalysisAnalyze
The factors highlighted in red are the vital X’s
Related Documents