The TQM Journal Volume 21, Issue 6, 2009, pp.549-635 Six Sigma in the Indian software industry: some observations and results from a pilot survey Rupa Mahanti, Jiju Antony (pp. 549-564) Keywords: Communication technologies , Computer software , Critical success factors , India , Quality , Six sigma ArticleType: Research paper Barriers faced by engineers when applying design of experiments Martín Tanco, Elisabeth Viles, Laura Ilzarbe, Ma Jesus Alvarez (pp. 565-575) Keywords: Experimental design , Industrial engineering , Statistical methods of analysis ArticleType: Literature review The relationship between quality management and the speed of new product development Hongyi Sun, Yangyang Zhao, Hon Keung Yau (pp. 576-588) Keywords: Consumer satisfaction , Continuous improvement , Customer service management , Manufacturing industries , Product development , Total quality management ArticleType: Research paper A proposed framework for combining ISO 9001 quality system and quality function deployment Paulo A. Cauchick Miguel, José Celso Sobreiro Dias (pp. 589-606) Keywords: ISO 9000 series , Product development , Quality function deployment , Quality systems ArticleType: Research paper Total quality management in Indian industries: relevance, analysis and directions Raj Kumar, Dixit Garg, T.K. Garg (pp. 607-622) Keywords: India , Manufacturing industries , Total quality management ArticleType: Research paper Does size matter for Six Sigma implementation?: Findings from the survey in UK SMEs Maneesh Kumar, Jiju Antony, Alex Douglas (pp. 623-635) Keywords: Continuous improvement , Critical success factors , Performance measures , Six sigma , Small to medium-sized enterprises , United Kingdom ArticleType: Research paper Book Review Voice of the Customer: Capture and Analysis Vol : 21 Issue: 6 Author(s): K. Narasimhan Lean Six Sigma for Supply Chain Management: The 10-Step Solution Process Vol : 21 Issue: 6 Author(s): K. Narasimhan

Welcome message from author
This document is posted to help you gain knowledge. Please leave a comment to let me know what you think about it! Share it to your friends and learn new things together.
Transcript
The TQM Journal Volume 21, Issue 6, 2009, pp.549-635
Six Sigma in the Indian software industry: some observations and results from a pilot survey Rupa Mahanti, Jiju Antony (pp. 549-564) Keywords: Communication technologies, Computer software, Critical success factors, India, Quality, Six sigma ArticleType: Research paper
Barriers faced by engineers when applying design of experiments Martín Tanco, Elisabeth Viles, Laura Ilzarbe, Ma Jesus Alvarez (pp. 565-575) Keywords: Experimental design, Industrial engineering, Statistical methods of analysis ArticleType: Literature review
The relationship between quality management and the speed of new product development Hongyi Sun, Yangyang Zhao, Hon Keung Yau (pp. 576-588) Keywords: Consumer satisfaction, Continuous improvement, Customer service management, Manufacturing industries, Product development, Total quality management ArticleType: Research paper
A proposed framework for combining ISO 9001 quality system and quality function deployment Paulo A. Cauchick Miguel, José Celso Sobreiro Dias (pp. 589-606) Keywords: ISO 9000 series, Product development, Quality function deployment, Quality systems ArticleType: Research paper
Total quality management in Indian industries: relevance, analysis and directions Raj Kumar, Dixit Garg, T.K. Garg (pp. 607-622) Keywords: India, Manufacturing industries, Total quality management ArticleType: Research paper
Does size matter for Six Sigma implementation?: Findings from the survey in UK SMEs Maneesh Kumar, Jiju Antony, Alex Douglas (pp. 623-635) Keywords: Continuous improvement, Critical success factors, Performance measures, Six sigma, Small to medium-sized enterprises, United Kingdom ArticleType: Research paper
Book Review
Voice of the Customer: Capture and Analysis Vol : 21 Issue: 6 Author(s): K. Narasimhan
Lean Six Sigma for Supply Chain Management: The 10-Step Solution Process Vol : 21 Issue: 6 Author(s): K. Narasimhan
Six Sigma in the Indian softwareindustry: some observations and
results from a pilot surveyRupa MahantiKolkata, India, and
Jiju AntonyCentre for Research in Six Sigma and Process Excellence (CRISSPE),
Department of DMEM, Strathclyde Institute for Operations Management,University of Strathclyde, Glasgow, UK
Abstract
Purpose – The aim of this paper is to present the results from an empirical investigation of SixSigma in the Indian software industry
Design/methodology/approach – The paper begins with a review of literature of Six Sigma andits role in the software industry. The importance of Six Sigma in the software domain is presented,followed by presentation of the results from an empirical investigation of Six Sigma in the Indiansoftware industry
Findings – The research reflects the status of Six Sigma application and implementation in thesoftware industry, identifies the commonly used statistical and non statistical and softwareengineering tools and frameworks used within software business; and determines the critical successfactors (CSFs) for a successful Six Sigma initiative in the software/IT industry. The most importantfactor was management commitment and involvement. Documentation management and suppliers’involvement were found to be the least important factors.
Research limitations/implications – This study was carried out with some boundaries like thenumber of companies, available resources, time constraints, etc.
Practical implications – This paper dispels the myths concerning the unsuitability of Six Sigma inthe software arena. At the same time it highlights the status of Six Sigma implementation in Indiansoftware organizations and the critical success factors for implementation of Six Sigma.
Originality/value – Little research has been carried out in terms of empirical survey relating to theapplication of Six Sigma in the software industry like that demonstrated in this paper. The paper willbe valuable for quality professionals and management personnel in software organizations.
Keywords Six sigma, Computer software, Critical success factors, Communication technologies, Quality,India
Paper type Research paper
IntroductionSoftware quality is often seen as an elusive and mysterious subject; it is perhaps themost ignored topic in the world of software development (Kenett and Baker, 1999). Formany business leaders, software quality is often viewed as a luxury; something thatcan be sacrificed, if necessary, for added functionality, faster development, or lowercosts. However, the quality of software is of paramount importance to everyone,including users and developers. Because of fierce global competition, many softwarecompanies are suffering financial setbacks, and hence they are trying to control costs(Phan et al., 1995). Software organizations are also fighting for survival and excellence
The current issue and full text archive of this journal is available at
www.emeraldinsight.com/1754-2731.htm
Six Sigma in theIndian software
industry
549
The TQM JournalVol. 21 No. 6, 2009
pp. 549-564q Emerald Group Publishing Limited
1754-2731DOI 10.1108/17542730910995837
in an atmosphere of global competition. To maintain sound competition, the softwarecompanies need to differentiate their products in ways that are meaningful to theircustomers. Quality is a proven way to achieve this differentiation (Humphrey, 1989).Successful software development organizations have found that an organizationalcommitment to quality expedites software development process, reduces costs, andallows new features to be added with greater ease. This is because an organization thatdevelops low-quality software, whether for internal use or for sale, is essentiallyalways looking backward, spending time and money fixing defects in “completed”software (Bessin, 2004). Both practitioners and academicians agree that softwarequality improvement techniques lead to a reduction in software development costs andtherefore, software quality is one of the critical issues (Kan et al., 1994; Weinberg, 1996;Yang, 2001). An abundance of tools, techniques, and philosophies have been developedfor minimizing errors and improving overall software quality (Parzinger and Nath,1998). A number of quality standards, methodologies and frameworks such as ISO9000, TQM, Malcolm Baldridge National Quality Award, Six Sigma, CapabilityMaturity Model (SEI-CMM), Capability Maturity Integration Model (SEI-CMMI), TeamSoftware Process (TSP), People Software Process (PSP), People Capability MaturityIntegration Model (P-CMMI) have been embraced by organizations to improve theirproducts and services.
Jovanoic and Shoemaker (1997) argued that ISO 9000 is appropriate for softwaredevelopment processes as well. Jalote (2000) found the Software Engineering Institute’sCapability Maturity Model (CMM) to be a widely used framework for qualitymanagement in software companies. Organizations that have acquired the fifth level ofCMM and PCMM are expected to maintain very high quality standards (Harter et al.,2000). Issac et al. (2004) proposed a descriptive TQM model for quality management inthe software industry.
Six Sigma is the new star in the quality world (Tennant, 2001). Six Sigma is abusiness improvement strategy that seeks to find and eliminate causes of defects ormistakes in business processes by focusing on outputs that are of critical importance tocustomers (Snee, 2000). Six Sigma has both management and technical components.The focus of management component is to select the right people for Six Sigmaprojects, select the right process metrics, provide resources for Six Sigma training,provide clear direction and guidance with regard to project selection, etc. The focus oftechnical component is on process improvement by reducing variation, creating datathat explains process variation and using statistical tools and techniques for problemsolving. The concept of implementation of Six Sigma methodology was pioneered atMotorola in the 1980 s with the aim of reducing quality costs. After Motorola, SixSigma has been exploited by many organizations such as GE, Honeywell, Sony,Caterpillar, J P Morgan, American Express, Common Wealth Health Corporation,Lloyds TSB to name but a few here.
Six Sigma has its roots in manufacturing. The proven potential of Six Sigma toprovide competitive advantage to manufacturing industries has initiated theimplementation of Six Sigma to the software industry as well. Although theapplication of Six Sigma in the software industry is in its infancy stage, a number ofsources in the existing literature have discussed about the applicability of Six Sigma insoftware development projects (Antony and Fergusson, 2004; Binder, 1997; Hong andGoh, 2003; Mahanti and Antony, 2006).
TQM21,6
550
The implementation of Six Sigma in the software industry is still in its infancy. Thesoftware industry is currently still young, without sufficient knowledge and adequatestandards to guarantee fault-free software. Typical software processes operate atbetween 2.3 and 3.0 sigma (Mahanti and Antony, 2006). The best software processesoperate at 4 to 5 sigma. If we use a single line of source code to represent a uniqueopportunity for defect, it means a typical software development process generates atheoretical average of 66,803 defects per million lines of source code. The large defectnumber suggests significant effort wasted in producing defects during thedevelopment process. The final product delivered to the customer is only 93.332percent defect free. On the other hand, by deploying the Six-Sigma methodology, aSix-Sigma process claims that only an average of 3.4 defects per million lines of sourcecode is produced. The final product delivered to the client is 99.9997 percent defect free(Hong and Goh, 2004).
Software Six Sigma is the application of statistical and non-statistical tools to thesoftware process, and software work products throughout the software developmentlife cycle to measure, analyze and reduce defects, cycle time, schedule slippage, effortslippage, effort variation and schedule variation (Mahanti, 2005). Though surveys havebeen conducted in the implementation of various software process improvement andquality methodologies like TQM, Capability Maturity Model standards and ISOstandards in Indian software organizations no survey research has been conducted inconnection to the implementation of Six Sigma in Indian software organizations (Jalote,2000; Issac et al., 2004; Issac et al., 2004). The findings present in this paper are possiblythe first of its kind in the Indian software organizations. This paper begins with areview of literature on Six Sigma and its role in the software industry, followed by theimportance of Six Sigma in the software business and finally the presentation of resultsfrom an empirical investigation of Six Sigma in the Indian software industry.
Six Sigma and its role in the software industry: a review of literatureSix Sigma starts from a practical problem, translates it into a statistical domain, worksout a statistical solution and then translates it back to a practical solution. Sigma is astatistical unit of measure, which reflects process capability of any process. Sigmavalue is perfectly correlated to such characteristics as defects-per-unit, parts-permillion defective and the probability of a failure/error. Six Sigma methodology:
. focuses on the customer and is based on data;
. integrates well with other software quality initiatives like CMM and CMMI;
. is measurable, unlike other quality systems; and
. is an effective approach for removing defects from products.
Six Sigma is based on two basic methodologies:
(1) Define, Measure, Analyze, Improve and Control (DMAIC).
(2) Design for Six Sigma (DFSS). DFSS follows the Define, Measure, Analyze,Design, Optimize and Verify methodology (DMADOV).
The success of Six Sigma in the manufacturing domain has been reported all over theworld. A report from the Black & Decker Corporation illustrates this. In January 30,2003, the company announced that, despite the weak economic conditions, by focusing
Six Sigma in theIndian software
industry
551
on Six-Sigma in the process of restructuring, operating profit for the Power Tools andAccessories segment increased 38% from the fourth quarter a year ago (ApplianceMagazine.com, 2003).
However, the application of Six Sigma in the software domain has been a subject ofmuch debate and conjecture and is still less widely accepted than CMM, CMMI or GQM(Goal Question Metric). One aspect of resistance to the application of Six Sigma to thesoftware process is as follows. An example is a study by Binder (1997), which identifiesthree major difficulties involved in applying the Six Sigma model to software. Theseare classified as “processes”, “characteristics” and “uniqueness”. “Processes” refers tothe relative “fuzziness” of software process compared to manufacturing processeswhere the application of the Six Sigma model is well established and documented.“Characteristics” highlights the difficulties in taking meaningful measurements suchas what constitutes a fault, fault densities, etc. “Uniqueness” refers to the observationthat, unlike manufactured products that are generally mass produced, softwareproducts are generally “one-off” and identical copies can be easily made.
Six Sigma aims to align business products within customer specifications using adata-driven approach. However, a software product is essentially intangible until itreaches system integration and test phase. There are difficulties in applying Six Sigmato the software industry, due to its statistical foundations in manufacturing andassumptions on process variation. Another barrier to the successful application of SixSigma to software is a lack of adequate product and process metrics (Janieszewski andGeorge, 2004). In addition, software development is a cognition-intensive activity and asoftware process itself is an intellectual process; one must first visualize and documentit, for example, before one can measure and manage it. However, Six Sigma does notspecifically address this situation (Card, 2000; Hong and Goh, 2003; Hong and Goh,2004). The fit between Six Sigma and software project management methodology is notalways obvious. Some of the common Six Sigma tools do not easily lend themselves tosoftware projects. Part of the reason is possibly that engineering and manufacturinghave evolved over hundreds of years, software development is only a few decades old(Aggarwal, 2004).
Software development processes can be fully characterized by three simplemeasurements (Janieszewski and George, 2004):
(1) time – the time required to perform a specific task;
(2) size – the size of the product produced; and
(3) defects – the number of defects, the type of defects, time to eliminate defects, etc.
A total of 90 percent of the processes in a software services company are repeatableand can be improved by the process improvement. Success of Six Sigma in themanufacturing domain has encouraged its application in the software domain. In the1999 SEI survey of high maturity software organizations, it is shown that among the36 top maturity organizations surveyed worldwide out of the millions, only sevenorganizations institutionalized the Six Sigma practice as part of the organization’sstandard software process and four organizations followed it frequently (Paulk et al.,2000). Less than 20 percent of 194 companies monitoring software quality stated thatthey use Six Sigma to improve the quality of internally developed applications(Information Week, 2003). In a survey carried out in the UK software industry out of 15companies that responded to the Six Sigma survey, ten companies were applying the
TQM21,6
552
principles of Six Sigma. The companies participating in the survey regarded requirementanalysis as a potential area to improve followed by operation, maintenance and testing(Antony and Fergusson, 2004). Adoption and application of Six Sigma tools in thesoftware industry requires Six Sigma training tailored to the intended environment ofuse to improve the software quality and creation and selection of meaningful metrics thatgive insight into how to meet business goals. The need for training tailored to theintended environment of use even more critical in software, because learning ismaximized when the problems and examples are directly relevant to the studentsimmediate needs and because software is different (Gack, 2003). An industrial black belttraining programme typically takes six months (Goyal and James, 2003).
In each DMAIC cycle, Six Sigma experts analyze their processes to find out whereand how defects occur, measure them and eliminate problems. Hallowell (2003)suggested that Design for Six Sigma (DFSS) in software development supplements theusual define, measure, analyze, improve, control (DMAIC) process. Six Sigma achievesdramatic improvement in business performance through a precise understanding ofcustomer requirements and the elimination of defects from existing processes,products, and services. Six Sigma is a methodology to organize the tools of the trade ina way that they can be executed on business issues that really matter, by people whoreally care (Hayes, 2004).
The Software Engineering Institute (SEI) found Six Sigma is a feasible enabler ofdomain specific process improvement technology. Most software organizations followthe CMM (Capability Maturity Model) or CMMI (Capability Maturity ModelIntegration) for software process improvement. CMM is a reference model forinducting the software process maturity into different levels (Paulk et al., 1993). Thematurity of an organization’s software process helps to predict a project’s ability tomeet its goals. Projects in Level 1 organizations experience wide variations inachieving cost, schedule, functionality, and quality targets. As maturity increases, thedifference between targeted results and actual results decreases across projects, thevariability of actual results around targeted results decreases and targeted resultsimprove as the maturity of the organization increases. CMM is a good framework fortechnical process topics but does not get at the issue of management accountability andorganizational behavior change. Six Sigma actually addresses the tools and the rootcauses of the lack of needed change, management accountability and organizationalbehavior (Hayes, 2004).
Six Sigma is also not a complete replacement for CMM, technology tools, or otheremerging best practices (Hayes, 2004). In fact, Six Sigma and Capability MaturityModel (CMM) are complimentary (Card, 2000; Murugappan et al., 2003). In fact, SixSigma directly contributes to Maturity Level 5 – continuous optimization of keyprocess areas. Also there are organizations, where implementation of Six Sigma hashelped in attaining higher CMM levels. Northrop Grumman Mission Systems, forexample, used Six Sigma to help in its move from Maturity Level 3 of the SEI CMMImodels to Level 5 in just one year (Heinz, 2004). While the CMM focuses ontransformation of the organization and does not explicitly require better results, SixSigma drives deeper into the process and requires measurements in place for processimprovement. Six Sigma can also be used in conjunction with a model-based approachlike CMMI. It fits well with CMMI’s measurement and analysis process area(Janieszewski and George, 2004; Gack and Robison, 2003).
Six Sigma in theIndian software
industry
553
Goal question metric (GQM) together with other practical software measurement(PSM) paradigms shows compatibility and consistency with the objective of Six Sigma.GQM matches well with the Define-Measure phases of Six Sigma. An integration of SixSigma and GQM can strengthen the Define and Measure phases of Six Sigma. A goodSix Sigma program incorporates GQM and other PSM paradigms into one cohesiveprogram. No matter which software life cycle model is chosen, the DMAIC frameworkcan always be integrated, although more work needs to be done in this area.
Significance of Six Sigma in ITSoftware development for business critical systems has emerged as a core discipline thatevery company has to perform in. Software projects are often positioned at the criticalinterface between a company’s products and / or services and the company’s customers.However, software projects are associated with a high degree of risk. About 25 percent ofsoftware projects are cancelled because they are late, over budget, have unacceptablylow quality or experience some combination of these problems. A Standish Group surveyof 8,000 software projects found that the average project exceeded planned budget by 90percent, its schedule by 120 percent and project cancellation of 25 percent due to somecombinations of delays, budget overruns, or poor quality. Requirement failures(reflecting needs not originally recognized or correctly understood, leading to substantialand costly rework late in the software development cycle) are associated with 80 percentof failed (late or cancelled) software projects. Execution failures (incorrect and overlyoptimistic estimates, leading to long delays and cost overruns) are a factor in 65 percentof failed software projects. Execution failures (leading to poor software quality, heavilyback-loaded costs, and very high levels of rework – commonly 40 percent of total cost)are a factor in 60 percent of failed software projects.
A division of Hewlett Packard decided to release its product despite a continuingincoming defect trend during the test phase. This resulted in a costly update after therelease, a steady need for defect repairs and a product with a bad quality reputation(Grady, 1996). Nowadays software is performing more critical tasks than ever before.Software failures in mission critical systems often jeopardize public safety. Adiscovery by Britain’s nuclear regulatory agency that a power plant scheduled to beginoperation was potentially unsafe due to inadequate software designed to manage thereactor in the event of an emergency (Schwartz, 1996). Software failures have causeddisasters in the past. In February 1991, a software failure in Patriot missile’s radarsystem allowed an Iraqi Scud to penetrate their air defense system and slam into anAmerican barracks in Saudi Arabia, killing 28 people during the Gulf War (Schmitt,1991). The benefit of Six Sigma to mission critical systems is rather significant.
The above points accentuate the necessity to decrease defects in complex andmission critical software. Owing to the extremely high costs involved in achieving theSix Sigma standard, it is unlikely that a software development team will achieve a trueSix Sigma level. However this doesn’t diminish the value of Six Sigma and havingminimal defects as a goal. However software failures can cause customerdissatisfaction which may result in software companies losing business to theircompetitors (Hong and Goh, 2003). Although the true statistical meaning of Six Sigmai.e. 3.4 defects per million opportunities does not hold, in this case Six Sigma forsoftware is more about using the methodology to achieve “continual processimprovement” than it is about achieving a statistical Six Sigma process output.
TQM21,6
554
Research methodologyResearch methodology can be viewed as the process taken to accomplish the keyobjectives of the research undertaken. The authors have undertaken a survey-basedapproach to assess the status of Six Sigma in the Indian software industry. A survey isa means of “gathering information about the characteristics, actions, or opinions of alarge group of people, referred to as a population” (Tanur, 1982). In a survey-basedapproach, data are collected by means of questionnaires or interviews. The choice ofdata collection method such as mail questionnaire, telephone interviews or face-to-faceinterviews is significant because it affects the quality and cost of the data collected. Forexample, mail questionnaires are very good for gathering factual data, but they are lesseffective when sensitive data and complex data are needed. In general, quality and costare highest with face-to-face interviews or telephone interviews whereas quality andcost are lower with mail questionnaires and group administration.
The purpose of survey research is to find out what situations, events, attitudes oropinions are occurring in a population. Survey research aimed at description asks simplyabout the distribution of some phenomena in a population or among subgroups of apopulation. Exploratory surveys should be used as the basis for developing concepts andmethods for more detailed, systematic descriptive or explanatory surveys (Babbie, 1973,Fowler, 1984). In short, the whole purpose of an exploratory survey is to elicit a widevariety of responses from individuals with varying viewpoints in a loosely structuredmanner as the basis for design of a more careful survey. Exploratory surveys are differentfrom pilot studies. The pilot study is a small-scale rehearsal of a systematic survey aimedat testing questions, question flow, and questionnaire format with representatives of thetarget population. Exploratory surveys frequently are used prior to pilot studies todetermine what concepts should be measured and how to measure them best.
To establish the broad view of Six Sigma within the organization and to developissues for the semi-structured interviews, a survey questionnaire was developed. Thequestionnaire was designed and adapted based on the published work of similarstudies carried out by Antony and Fergusson (2004); Antony and Banuelas (2002); andanother study carried out in the US industry (Dusarme, 2003). The questionnaire usedin this study consisted of two parts: the background of the company and the CSFs ofSix Sigma. The first part was primarily aimed to understand some of the fundamentalissues such as the size of the company, current status of Six Sigma, common Six Sigmatools and techniques used within software industry, financial gains generated from SixSigma initiative to date and so on. A total of 19 critical success factors (CSFs) and 39variables were derived mainly from the literature (Adams et al., 2003; Antony andBanuelas, 2002; Breyfoggle, 1999; Snee and Hoerl, 2003; Pande et al., 2000) anddiscussions with software quality professionals. The second part consisted of these 19CSFs with 39 variables. All factors were ranked on a five-point scale (1 ¼ not veryimportant, 2 ¼ not important, 3 ¼ important, 4 ¼ very important and 5 ¼ critical).
The objectives of this empirical study were to:. understand the status of Six Sigma application and implementation in software
industry (that is, key metrics used to measure the service performance, six sigmacapability level of the core business processes, criteria used to measure thesuccess of the Six Sigma program etc.);
Six Sigma in theIndian software
industry
555
. identify the most and least commonly used statistical and non statistical andsoftware engineering tools, techniques, methodologies and frameworks usedwithin software business; and
. determine the critical success factors (CSFs) for a successful Six Sigma initiativein the Indian software/IT industry
An e-mail survey was used to gather survey data. The advantages of the e-mail surveyapproach to data collection are (Nueman, 2003; Sarantakos, 1998, Bachmann et al.,1996; Kittleson, 1995; Sproull, 1986):
. inexpensive;
. possibility of very rapid surveying;
. results are produced quickly;
. questionnaires are completed in the respondents’ convenience;
. anonymity is greatly assured; and
. respondents are at liberty to provide objective views on sensitive issues, and soon and so forth.
In this study, a total of 100 questionnaires were sent to software companies. The list ofcompanies was obtained from NASSCOM database as well as using search engines(www.google.com). The criteria used to select the companies were Six Sigmacertification, CMM certification, service areas and employee strength. The samplechosen was a representative sample. The response rate from the companies was about20 percent (i.e. 20 companies). However, just 12 companies were actively applying theprinciples of Six Sigma.
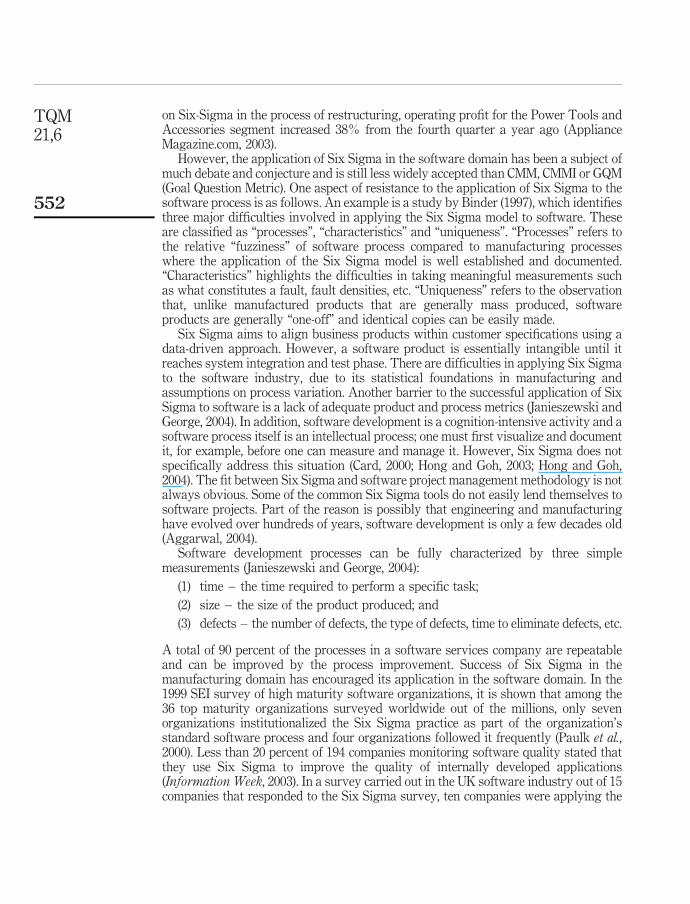
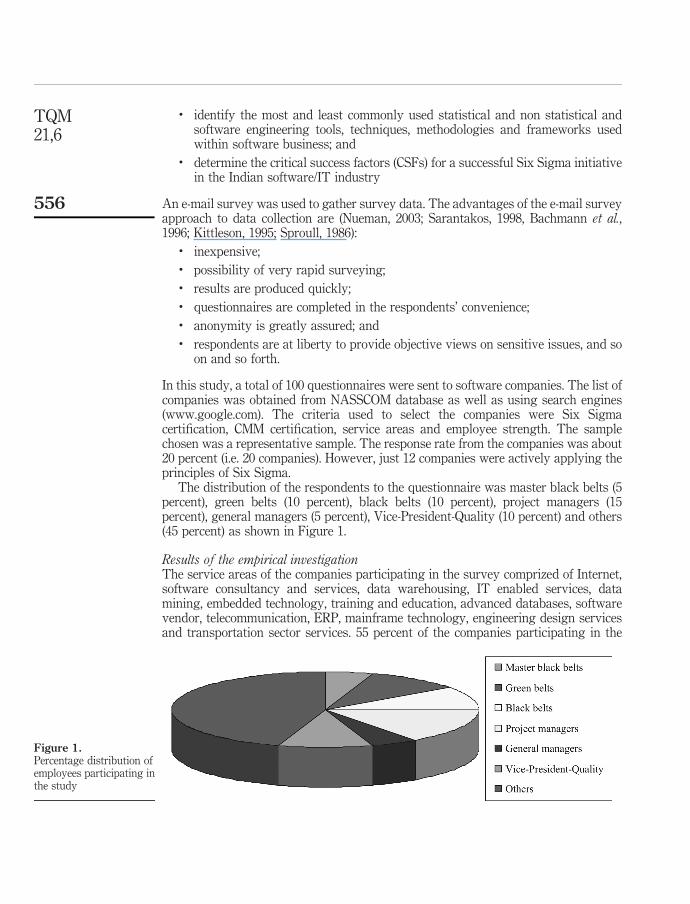
The distribution of the respondents to the questionnaire was master black belts (5percent), green belts (10 percent), black belts (10 percent), project managers (15percent), general managers (5 percent), Vice-President-Quality (10 percent) and others(45 percent) as shown in Figure 1.
Results of the empirical investigationThe service areas of the companies participating in the survey comprized of Internet,software consultancy and services, data warehousing, IT enabled services, datamining, embedded technology, training and education, advanced databases, softwarevendor, telecommunication, ERP, mainframe technology, engineering design servicesand transportation sector services. 55 percent of the companies participating in the
Figure 1.Percentage distribution ofemployees participating inthe study
TQM21,6
556
survey had multiple service areas. The rest, 45 percent, had only one service area. Ofthe companies 50 percent had software consultancy and services as one of their serviceareas. Also, 60 percent of the participants of the Six Sigma survey were big companieswith more than 1,000 employees. Of the respondents 10 percent hailed from companieswith number of employees between 501 and 1,000. Also, 25 percent of the respondentswere companies with 301-500 employees. The remaining 5 percent of the companieshad less than 100 employees. It was also observed that more than 80 percent of all thecompanies (Six Sigma and non-Six Sigma companies) participated in the survey hadformal quality management system in place. Of all respondents 25 percent had totalquality management in place.
The participants were also asked to prioritize the key attributes that are importantin the software development process. These attributes were derived from the literature(Pressman, 2001) and through interactions with professionals in the software industry.The participants were asked to assign a rank in the range of 1 to 11 with 1 being themost important and 11 being the least. The average scores are as follows:
. functionality – 1;
. correctness – 1.1;
. reliability – 1.4;
. consistency – 1.8;
. cost, timeliness, efficiency – 2.2;
. integrity – 2.35;
. maintainability – 2.9;
. usability – 3;
. complexity, reusability – 3.8;
. interoperability – 5.23; and
. portability – 5.7.
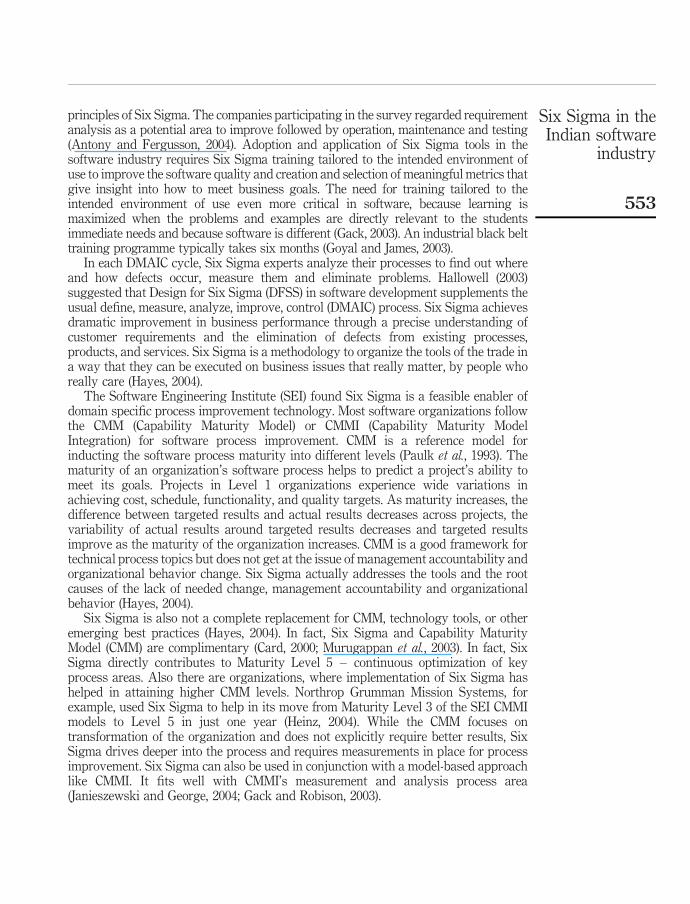
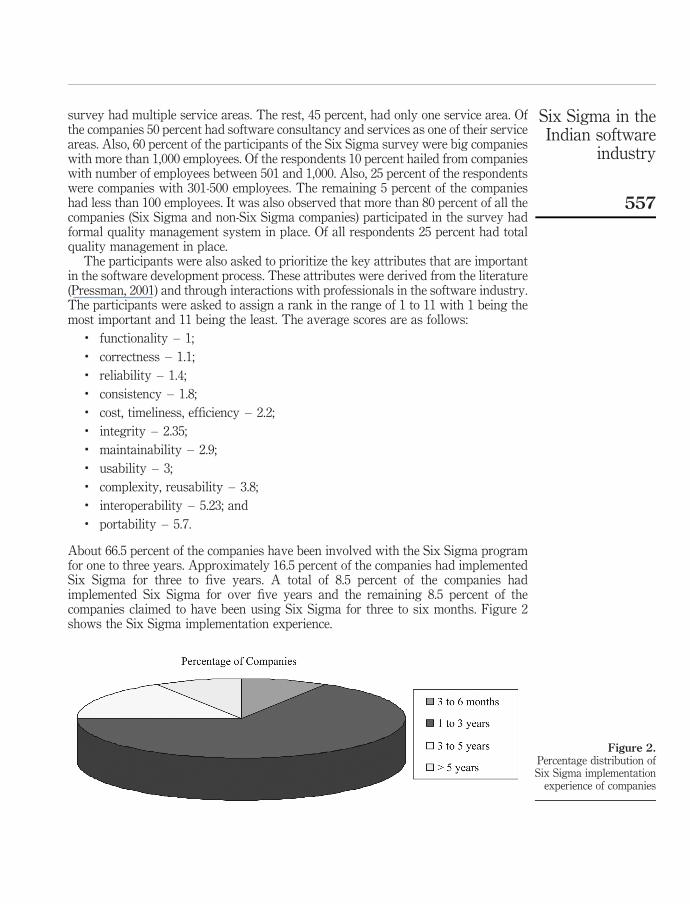
About 66.5 percent of the companies have been involved with the Six Sigma programfor one to three years. Approximately 16.5 percent of the companies had implementedSix Sigma for three to five years. A total of 8.5 percent of the companies hadimplemented Six Sigma for over five years and the remaining 8.5 percent of thecompanies claimed to have been using Six Sigma for three to six months. Figure 2shows the Six Sigma implementation experience.
Figure 2.Percentage distribution ofSix Sigma implementation
experience of companies
Six Sigma in theIndian software
industry
557
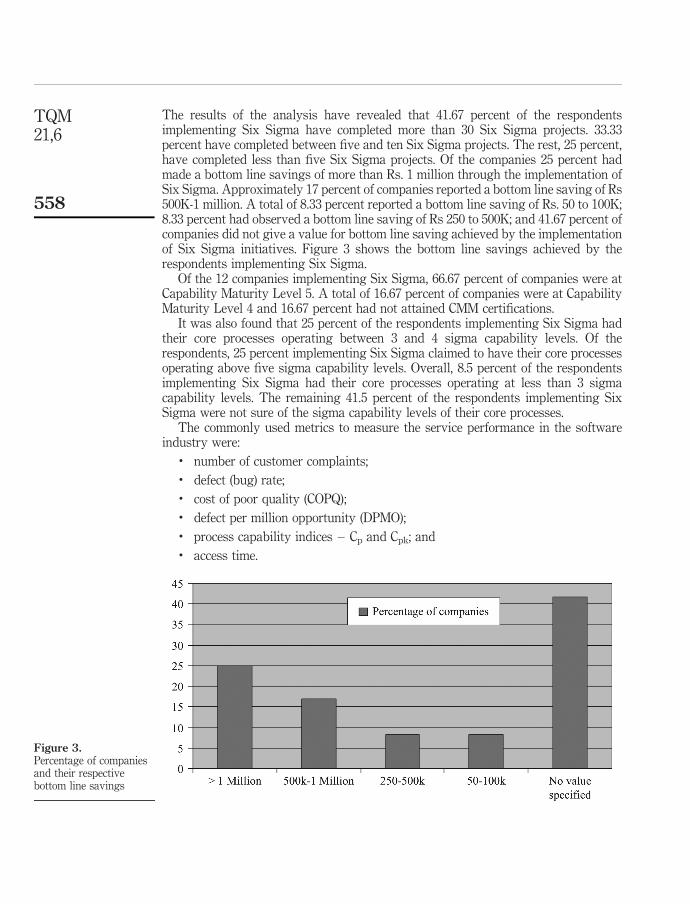
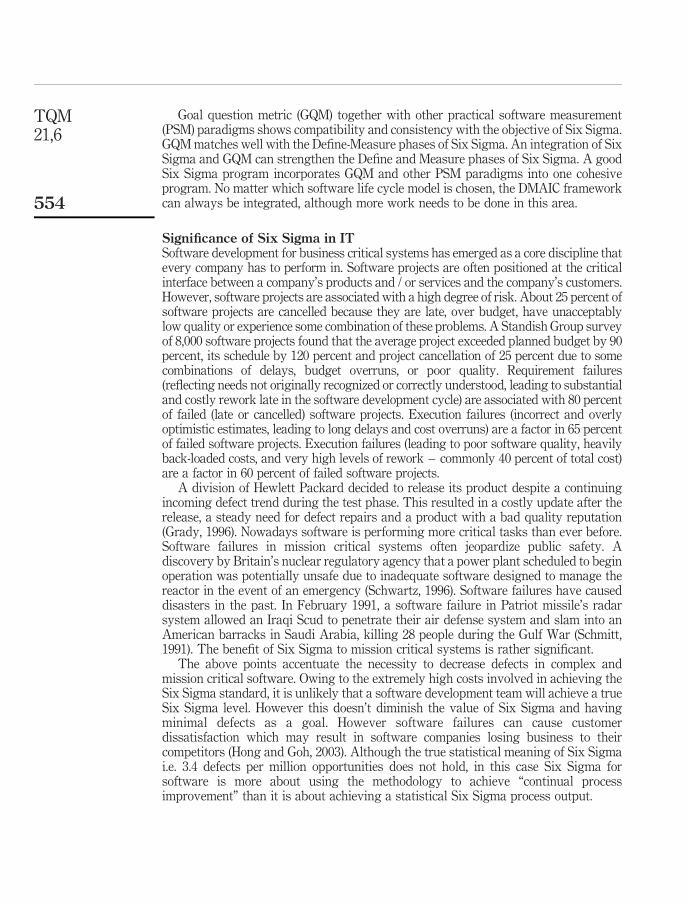
The results of the analysis have revealed that 41.67 percent of the respondentsimplementing Six Sigma have completed more than 30 Six Sigma projects. 33.33percent have completed between five and ten Six Sigma projects. The rest, 25 percent,have completed less than five Six Sigma projects. Of the companies 25 percent hadmade a bottom line savings of more than Rs. 1 million through the implementation ofSix Sigma. Approximately 17 percent of companies reported a bottom line saving of Rs500K-1 million. A total of 8.33 percent reported a bottom line saving of Rs. 50 to 100K;8.33 percent had observed a bottom line saving of Rs 250 to 500K; and 41.67 percent ofcompanies did not give a value for bottom line saving achieved by the implementationof Six Sigma initiatives. Figure 3 shows the bottom line savings achieved by therespondents implementing Six Sigma.
Of the 12 companies implementing Six Sigma, 66.67 percent of companies were atCapability Maturity Level 5. A total of 16.67 percent of companies were at CapabilityMaturity Level 4 and 16.67 percent had not attained CMM certifications.
It was also found that 25 percent of the respondents implementing Six Sigma hadtheir core processes operating between 3 and 4 sigma capability levels. Of therespondents, 25 percent implementing Six Sigma claimed to have their core processesoperating above five sigma capability levels. Overall, 8.5 percent of the respondentsimplementing Six Sigma had their core processes operating at less than 3 sigmacapability levels. The remaining 41.5 percent of the respondents implementing SixSigma were not sure of the sigma capability levels of their core processes.
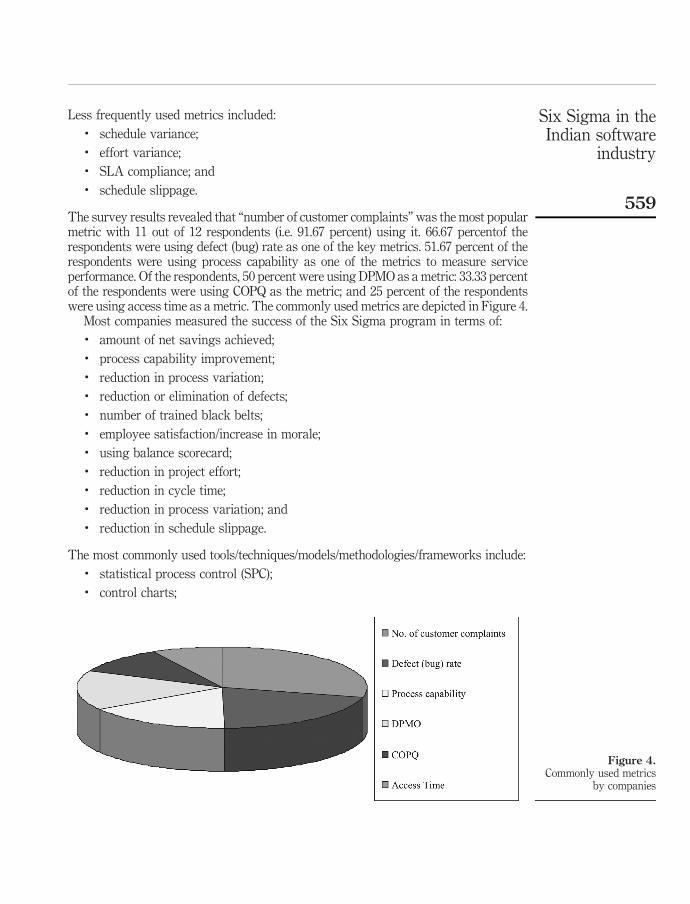
The commonly used metrics to measure the service performance in the softwareindustry were:
. number of customer complaints;
. defect (bug) rate;
. cost of poor quality (COPQ);
. defect per million opportunity (DPMO);
. process capability indices – Cp and Cpk; and
. access time.
Figure 3.Percentage of companiesand their respectivebottom line savings
TQM21,6
558
Less frequently used metrics included:. schedule variance;. effort variance;. SLA compliance; and. schedule slippage.
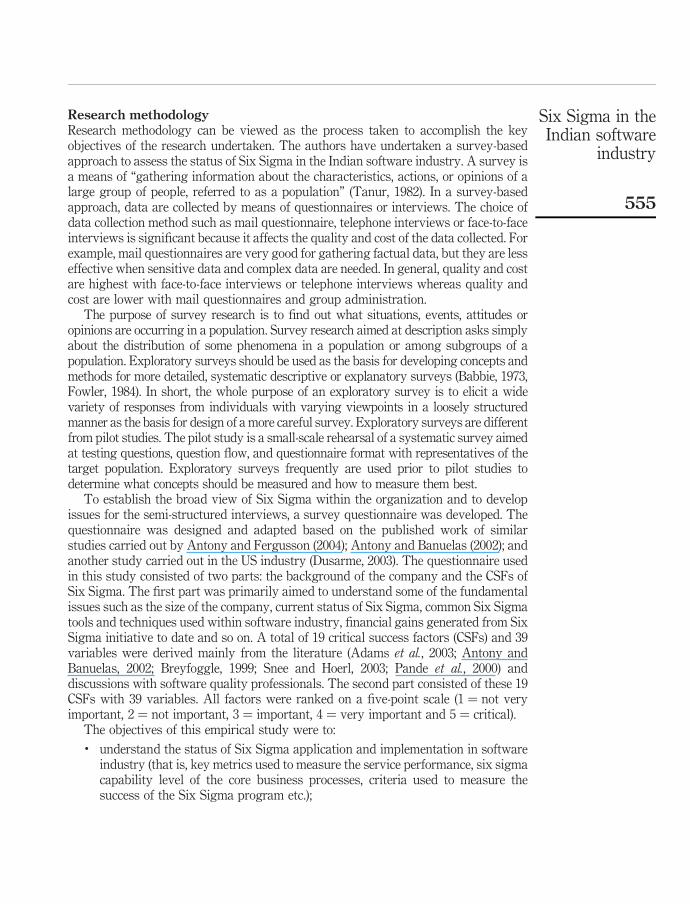
The survey results revealed that “number of customer complaints” was the most popularmetric with 11 out of 12 respondents (i.e. 91.67 percent) using it. 66.67 percentof therespondents were using defect (bug) rate as one of the key metrics. 51.67 percent of therespondents were using process capability as one of the metrics to measure serviceperformance. Of the respondents, 50 percent were using DPMO as a metric: 33.33 percentof the respondents were using COPQ as the metric; and 25 percent of the respondentswere using access time as a metric. The commonly used metrics are depicted in Figure 4.
Most companies measured the success of the Six Sigma program in terms of:. amount of net savings achieved;. process capability improvement;. reduction in process variation;. reduction or elimination of defects;. number of trained black belts;. employee satisfaction/increase in morale;. using balance scorecard;. reduction in project effort;. reduction in cycle time;. reduction in process variation; and. reduction in schedule slippage.
The most commonly used tools/techniques/models/methodologies/frameworks include:. statistical process control (SPC);. control charts;
Figure 4.Commonly used metrics
by companies
Six Sigma in theIndian software
industry
559
. fishbone diagram;
. gap analysis;
. inspection;
. CMM (capability maturity model);
. regression;
. process mapping;
. quality function deployment (QFD);
. failure mode and effect analysis (FMEA); and
. process capability analysis (PCA).
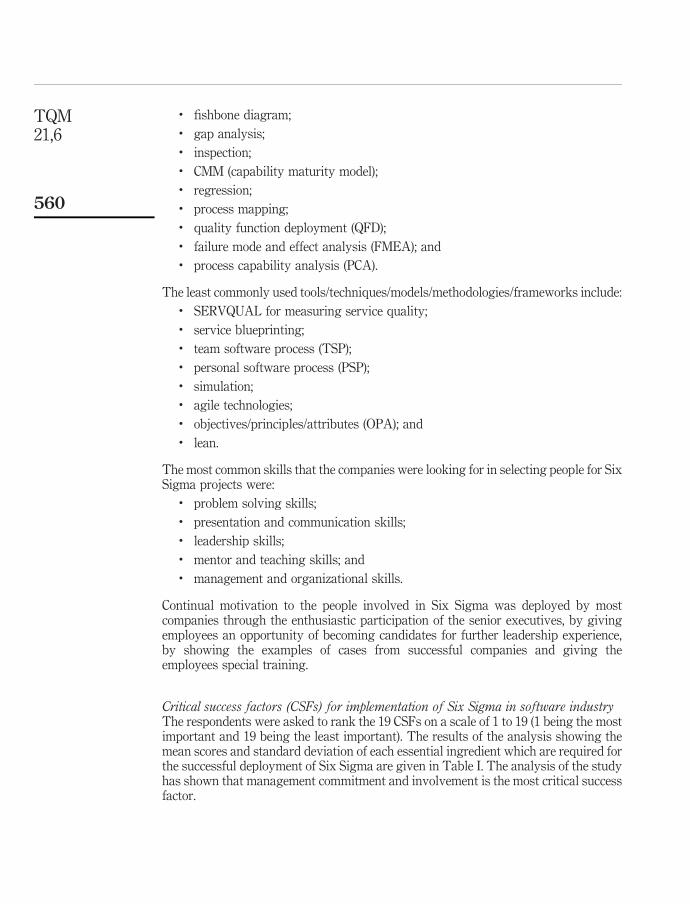
The least commonly used tools/techniques/models/methodologies/frameworks include:. SERVQUAL for measuring service quality;. service blueprinting;. team software process (TSP);. personal software process (PSP);. simulation;. agile technologies;. objectives/principles/attributes (OPA); and. lean.
The most common skills that the companies were looking for in selecting people for SixSigma projects were:
. problem solving skills;
. presentation and communication skills;
. leadership skills;
. mentor and teaching skills; and
. management and organizational skills.
Continual motivation to the people involved in Six Sigma was deployed by mostcompanies through the enthusiastic participation of the senior executives, by givingemployees an opportunity of becoming candidates for further leadership experience,by showing the examples of cases from successful companies and giving theemployees special training.
Critical success factors (CSFs) for implementation of Six Sigma in software industryThe respondents were asked to rank the 19 CSFs on a scale of 1 to 19 (1 being the mostimportant and 19 being the least important). The results of the analysis showing themean scores and standard deviation of each essential ingredient which are required forthe successful deployment of Six Sigma are given in Table I. The analysis of the studyhas shown that management commitment and involvement is the most critical successfactor.
TQM21,6
560
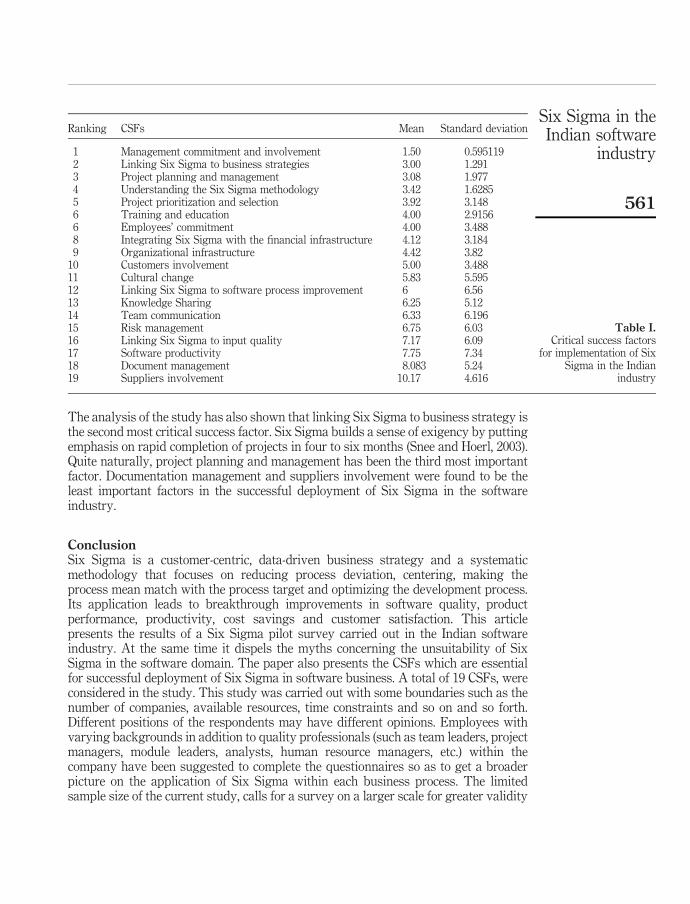
The analysis of the study has also shown that linking Six Sigma to business strategy isthe second most critical success factor. Six Sigma builds a sense of exigency by puttingemphasis on rapid completion of projects in four to six months (Snee and Hoerl, 2003).Quite naturally, project planning and management has been the third most importantfactor. Documentation management and suppliers involvement were found to be theleast important factors in the successful deployment of Six Sigma in the softwareindustry.
ConclusionSix Sigma is a customer-centric, data-driven business strategy and a systematicmethodology that focuses on reducing process deviation, centering, making theprocess mean match with the process target and optimizing the development process.Its application leads to breakthrough improvements in software quality, productperformance, productivity, cost savings and customer satisfaction. This articlepresents the results of a Six Sigma pilot survey carried out in the Indian softwareindustry. At the same time it dispels the myths concerning the unsuitability of SixSigma in the software domain. The paper also presents the CSFs which are essentialfor successful deployment of Six Sigma in software business. A total of 19 CSFs, wereconsidered in the study. This study was carried out with some boundaries such as thenumber of companies, available resources, time constraints and so on and so forth.Different positions of the respondents may have different opinions. Employees withvarying backgrounds in addition to quality professionals (such as team leaders, projectmanagers, module leaders, analysts, human resource managers, etc.) within thecompany have been suggested to complete the questionnaires so as to get a broaderpicture on the application of Six Sigma within each business process. The limitedsample size of the current study, calls for a survey on a larger scale for greater validity
Ranking CSFs Mean Standard deviation
1 Management commitment and involvement 1.50 0.5951192 Linking Six Sigma to business strategies 3.00 1.2913 Project planning and management 3.08 1.9774 Understanding the Six Sigma methodology 3.42 1.62855 Project prioritization and selection 3.92 3.1486 Training and education 4.00 2.91566 Employees’ commitment 4.00 3.4888 Integrating Six Sigma with the financial infrastructure 4.12 3.1849 Organizational infrastructure 4.42 3.82
10 Customers involvement 5.00 3.48811 Cultural change 5.83 5.59512 Linking Six Sigma to software process improvement 6 6.5613 Knowledge Sharing 6.25 5.1214 Team communication 6.33 6.19615 Risk management 6.75 6.0316 Linking Six Sigma to input quality 7.17 6.0917 Software productivity 7.75 7.3418 Document management 8.083 5.2419 Suppliers involvement 10.17 4.616
Table I.Critical success factors
for implementation of SixSigma in the Indian
industry
Six Sigma in theIndian software
industry
561
of the findings from this research. Because of limited budget and time constraints, aface-to face interview could be carried out for only five of the companies responded tothe survey questionnaire. An e-mail survey was carried out for the rest of thecompanies. The scaled questions have disadvantages because respondents often do notuse the whole scale, whatever response they tick, we do not know why a particularresponse was chosen. Semi-structured interviews with people at different levels of SixSigma knowledge and expertise have been conducted to obtain a deeper understandingof the Six Sigma practices in the software industry.
References
Adams, C., Gupta, P. and Wilson, C. (2003), Six Sigma Deployment, Butterworth-Heinemann,London.
Antony, J. and Banuelas, R. (2002), “Key ingredients for the effective implementation of a SixSigma program”, Measuring Business Excellence, Vol. 6 No. 4, pp. 20-7.
Antony, J. and Fergusson, C. (2004), “Six Sigma in the software industry: results from a pilotstudy”, Managerial Auditing Journal, Vol. 19 No. 8, pp. 1025-32.
Aggarwal, M. (2004), Six Sigma Meets Software Development, available at: www.isixsigma.com/library/content/ (accessed 15 April, 2004).
Appliance Magazine.com (2003), Black & Decker Announces Q4 and Full-year Financials,available at: www.appliancemagazine.com/news.cfm?newsid¼3216
Babbie, E.R. (1973), Survey Research Methods, Wadsworth Publishing, Belmont, CA.
Bachmann, D., Elfrink, J. and Vazzana, G. (1996), “Tracking the progress of e-mail versussnail-mail”, Marketing Research, Vol. 8, pp. 31-5.
Bessin, G. (2004), “The business value of software quality”, The Rational Edge, pp. 1-8.
Binder, R.V. (1997), “Can a manufacturing quality model work for software?”, IEEE Software,Vol. 14 No. 5, pp. 101-5.
Breyfoggle, F.W. (1999), Implementing Six Sigma: Smarter Solutions Using Statistical Methods,Wiley, New York, NY.
Card, D.N. (2000), “Sorting out Six Sigma and CMM”, IEEE Software, May/June, pp. 11-13.
Dusarme, D. (2003), Six Sigma Survey: Big Success – What about the Other 98 Percent?, availableat: www.qualitydigest.com (accessed 15 April, 2004).
Fowler, F.J. Jr (1984), Survey Research Methods, Sage Publications, Beverly Hills, CA.
Gack, G.A. and Robison, K. (2003), “Integrating improvement initiatives: connecting six sigmafor software, CMMI, personal software process, and team software process”, SoftwareQuality Professional, Vol. 5 No. 4, pp. 5-13.
Grady, R.B. (1996), “Software failure analysis for high return process improvement decisions”,Hewlett-Packard Journal, Vol. 47, pp. 15-24.
Goyal, N. and James, V.F. (2003), Medical Transcription Case Study, available at: www.isixsigma.com/library/content/c030203a.asp
Hallowell, D. (2003), “Understanding and integrating the voice of the customer”, paper presentedat the Six Sigma in Software Conference, San Jose, CA, January.
Harter, D.E., Krishnan, M.S. and Slaughter, S.A. (2000), “Effects of process maturity on quality,cycle time, and effort in software development”, Management Science, Vol. 46, pp. 451-66.
Hayes, B.J. (2004), Six Sigma for Software . . . More Than a New Tool, available at: www.isixsigma.com/library/content
TQM21,6
562
Heinz, L. (2004), Using Six Sigma in Software Development, available at: www.sei.cmu.edu/news-at-sei/features/2004/1/feature-3.htm
Hong, G.Y. and Goh, T.N. (2003), “Six-Sigma in software quality”, The TQM Magazine, Vol. 15No. 6, pp. 364-73.
Hong, G.Y. and Goh, T.N. (2004), “A comparison of Six-Sigma and GQM approaches in softwaredevelopment”, International Journal of Six Sigma and Competitive Advantage, Vol. 1 No. 1,pp. 65-75.
Humphrey, W. (1989), Managing the Software Process, Addison-Wesley, Reading, MA.
InformationWeek (2003), “Software quality”, InformationWeek, 26 May.
Issac, G., Rajendran, C. and Anantharaman, R.N. (2004), “A holistic framework for TQM in thesoftware industry: a confirmatory factor analysis approach”, Vol. 11 No. 3, pp. 35-60.
Jalote, P. (2000), CMM in Practice, Addison-Wesley, Reading, MA.
Janieszewski, S. and George, E. (2004), Six Sigma and Software Process Improvement, pp. 1-12,available at: www.SoftwareSixSigma.com (accessed 15 April, 2004).
Jovanovic, V. and Shoemaker, D. (1997), “ISO9001 standard and software quality improvement”,Benchmarking for Quality Management and Technology, Vol. 4, pp. 149-59.
Kan, S.H., Basili, V.R. and Shapiro, L.N. (1994), “Software quality: an overview from theperspective of total quality management”, IBM Systems Journal, Vol. 33, pp. 4-19.
Kittleson, M.J. (1995), “An assessment of the response rate via the postal service and e-mail”,Health Values, Vol. 18, pp. 27-9.
Kenett, R.S. and Baker, R.S. (1999), Software Process Quality: Management Control, MarcelDekker, New York, NY.
Mahanti, R. (2005), “Six Sigma for software”, Software Quality Professional, Vol. 8 No. 1,pp. 12-26.
Mahanti, R. and Antony, J. (2006), “Six Sigma in software industries: some case studies andobservations”, International Journal of Six Sigma and Competitive Advantage, Vol. 2 No. 3,pp. 263-90.
Murugappan, M., Keeni, G. and Blending, C.M.M. (2003), “Blending CMM and Six Sigma to meetbusiness goals”, IEEE Software, Vol. 20 No. 2, pp. 42-8.
Neuman, W.L. (2003), Social Research Methods: Qualitative and Quantitative Approaches, 5th ed.,Pearson Education, Upper Saddle River, NJ.
Pande, P., Neuman, R. and Cavanagh, R. (2000), The Six Sigma Way: How GE, Motorola andother Top Companies are Honing their Performance, McGraw-Hill, New York, NY.
Parzinger, M.J. and Nath, R. (1998), “TQM implementation factors for software development: anempirical study”, Software Quality Journal, Vol. 7 Nos 3-4, pp. 239-60.
Paulk, M.C., Goldenson, D. and White, D. (2000), The 1999 Survey of High MaturityOrganizations, Special Report, CMU/SEI-2000-SR-002, Software Engineering Institute, LosAlamitos, CA, February.
Paulk, M.C., Curtis, B., Chrissis, M. and Weber, C.V. (1993), Capability Maturity Model forSoftware, Version 1.1, CMU/SEI-93-TR-24, DTIC Number ADA263403, SoftwareEngineering Institute, Los Alamitos, CA.
Phan, D.D., George, J.F. and Vogel, D.R. (1995), “Managing software quality in a very largedevelopment project (case study)”, Information and Management, Vol. 29, pp. 277-85.
Pressman, R.V. (2001), Software Engineering A Practitioner’s Approach, Tata McGraw-HillPublishing Company Limited, New Delhi, India.
Six Sigma in theIndian software
industry
563
Sarantakos, S. (1998), Social Research, 2nd ed., Macmillan, London.
Schmitt, E. (1991), Computer Failure Let Scud Through, The Morning Call, Allenton, PA.
Schwartz, E.I. (1996), “Trust me, I’m your software”, Discover, Vol. 17, pp. 78-81.
Snee, R.D. (2000), “Impact of Six Sigma on quality engineering”, Quality Engineering, Vol. 12No. 3, pp. 9-14.
Snee, R.D. and Hoerl, R.W. (2003), Leading Six Sigma, FT Prentice-Hall, Englewood Cliffs, NJ.
Sproull, S. (1986), “Using electronic mail for data collection in organizational research”, Academyof Management Journal, Vol. 29, pp. 159-69.
Tanur, J.M. (1982), Advances in Methods for Large-Scale Surveys and Experiments, Behavioraland Social Science Research: A National Resource, Part II, National Academy Press,Washington, DC.
Tennant, G. (2001), Six Sigma: SPC and Six Sigma in Manufacturing and Services, GowerPublishing Company, Aldershot.
Weinberg, M.G. (1996), Quality Software Management – 2, Dorset House Publishing, New York,NY.
Yang, Y.H. (2001), “Software quality management and ISO 9000 implementation”, IndustrialManagement & Data Systems, Vol. 101 No. 7, pp. 329-36.
Further reading
Janiszewski, S., George, E. and Integrating, P.S.P. (2004), “TSP and Six Sigma”, Software QualityProfessional, Vol. 6 No. 4, pp. 4-13.
Corresponding authorJiju Antony can be contacted at: [email protected]
TQM21,6
564
To purchase reprints of this article please e-mail: [email protected] visit our web site for further details: www.emeraldinsight.com/reprints
Barriers faced by engineers whenapplying design of experiments
Martın Tanco, Elisabeth Viles, Laura Ilzarbe and Ma Jesus AlvarezTECNUN, University of Navarra, Gipuzkoa, Spain
Abstract
Purpose – The purpose of this article is to provide an extensive review of the barriers faced byengineers when applying design of experiments (DoE). The aim is to help new practitioners learn fromthe past and avoid possible barriers that they may encounter when applying DoE in industry.
Design/methodology/approach – An exhaustive literary review was carried out to find articles inwhich hindrances to the application of DoE were mentioned. The information is organised andgrouped into 16 barriers with this end in mind.
Findings – The 16 barriers can be classified into three different groups: business barriers;educational barriers; and technical barriers. It is shown that DoE can be successfully applied withoutovercoming every barrier, although it is inconvenient to do so.
Practical implications – Although DoE is commonly found in statistics and quality literature, it isclearly underused in industry. The paper brings together ideas from those with experience in DoE todetect the reasons behind this anomaly.
Originality/value – Very little material has been published regarding the difficulty of applyingDoE. Unfortunately, what is available is repetitive, unstructured and incomplete. The paper isintended to encourage discussion between practitioners and experts, in order to find a way to define,categorise and eventually overcome the most problematic barriers.
Keywords Industrial engineering, Experimental design, Statistical methods of analysis
Paper type Literature review
IntroductionEngineers engage in a variety of activities such as developing new products, improvingprevious designs and maintaining, controlling and improving ongoing manufacturingprocess, among others. Experimentation is frequently carried out in unison with thoseactivities. Therefore, since variation is ever-present in these activities, most engineers(and scientists) end up using statistics, regardless of their background (Gunter, 1985).
Lye (2005) defines the Design of Experiments (DoE) as a methodology forsystematically applying statistics to experimentation. Although DoE provides a quickand cost-effective method to understand and optimise products and processes (Antony,2002), not enough industries carry out experimentation with a pre-establishedstatistical methodology. Surveys (Gremyr et al., 2003; Bergquist and Albing, 2006;Tanco et al., 2008) and numerous articles (Hoadley and Kettering, 1990; Hahn andHoerl, 1998; Costa et al., 2006; Antony et al., 1998) reflect the existence of a substantialgap between theoretical development of DoE and its application in industry.
Although very little has been published regarding the difficulty of DoE application,we share Costa’s (2006) opinion that the material available is indeed useful foridentifying barriers. Therefore, the purpose of this research is to detect the barriers tothe application of DoE by means of an extensive literature review.
In section 2, we present the methodology used for the bibliographic review. Insection 3, we present the barriers hindering the widespread use of DoE among
The current issue and full text archive of this journal is available at
www.emeraldinsight.com/1754-2731.htm
Barriers facedby engineers
565
The TQM JournalVol. 21 No. 6, 2009
pp. 565-575q Emerald Group Publishing Limited
1754-2731DOI 10.1108/17542730910995846
engineers. In section 4, an analogy to better understand the barriers and the difficultyin overcoming them is given. Conclusions can be found in section 5.
Review scopeIn order to detect the barriers to the widespread use of DoE, we started with abrainstorming session among our group of researchers. We tried to pinpoint thebarriers based on our experience with DoE application. Afterwards, an exhaustivereview of relevant literature of the last 25 years was carried out. Our first approach wasto search for any mention of problems with DoE application in the journals thatpublish DoE-related articles. Then, in order to augment the collection of detectedproblems, we decided to resort the ISI Web of KnowledgeSM database[1].
Barriers to the widespread usage of DoELimited information about these barriers is available in industry literature.Furthermore, the information is scattered, repetitive and extremely subjective.Therefore, we used affinity diagrams to classify the barriers into fewer groups. In spiteof the considerable effort taken to classify and define them, some of the barriers maynot seem entirely exclusive or independent from each other. Even though some barriersmay be partly caused or affected by the others, we have chosen to include themseparately in an effort to find a practical solution.
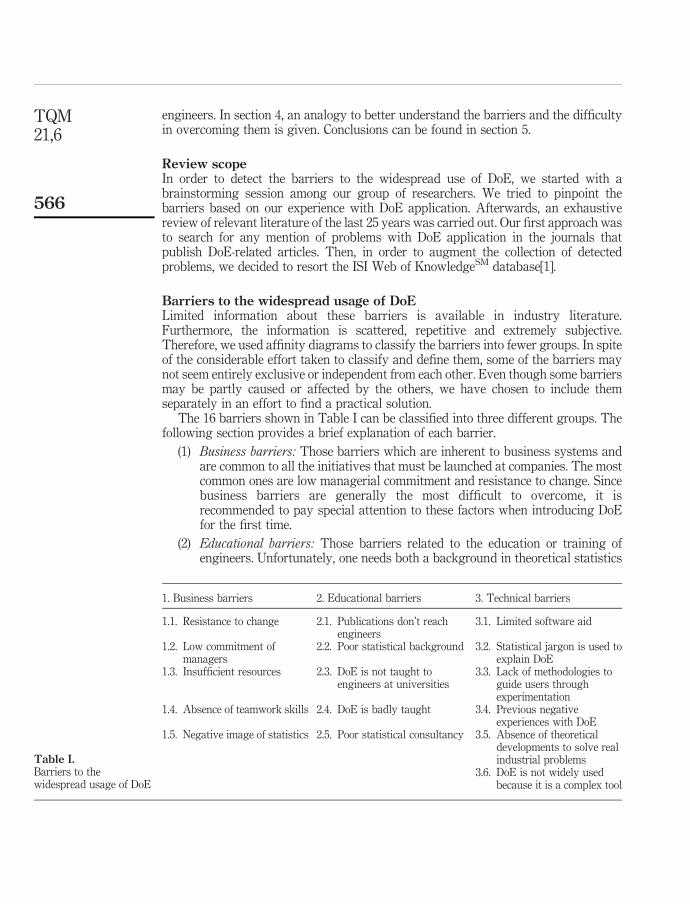
The 16 barriers shown in Table I can be classified into three different groups. Thefollowing section provides a brief explanation of each barrier.
(1) Business barriers: Those barriers which are inherent to business systems andare common to all the initiatives that must be launched at companies. The mostcommon ones are low managerial commitment and resistance to change. Sincebusiness barriers are generally the most difficult to overcome, it isrecommended to pay special attention to these factors when introducing DoEfor the first time.
(2) Educational barriers: Those barriers related to the education or training ofengineers. Unfortunately, one needs both a background in theoretical statistics
1. Business barriers 2. Educational barriers 3. Technical barriers
1.1. Resistance to change 2.1. Publications don’t reachengineers
3.1. Limited software aid
1.2. Low commitment ofmanagers
2.2. Poor statistical background 3.2. Statistical jargon is used toexplain DoE
1.3. Insufficient resources 2.3. DoE is not taught toengineers at universities
3.3. Lack of methodologies toguide users throughexperimentation
1.4. Absence of teamwork skills 2.4. DoE is badly taught 3.4. Previous negativeexperiences with DoE
1.5. Negative image of statistics 2.5. Poor statistical consultancy 3.5. Absence of theoreticaldevelopments to solve realindustrial problems
3.6. DoE is not widely usedbecause it is a complex tool
Table I.Barriers to thewidespread usage of DoE
TQM21,6
566
and specific training to apply these techniques. All aspects that influence theeducation of DoE are included in this group.
(3) Technical barriers: Those barriers which are inherent to DoE. Included in thisgroup, among others, are existing problems with methodologies that guideusers through the experimentation process, software support and the absence oftheoretical development to solve real industrial problems.
Business barriersResistance to changeResistance to change is an almost inevitable consequence of the introduction of newbusiness techniques (Owen, 2003). The danger of systematically rejecting all newinitiatives is what is known as the fifth discipline of Senge (Senge, 1990):
If you only know how to hammer nails, you will always try to solve everything with ahammer. When you fail, the reason is that the hammer is too small.
Engineers often perform one factor at a time (OFAT) experiments. Thus, engineersmust be convinced that what they have been doing for years can be improved upon(Czitrom, 1999). Responses from engineers with high resistance to change may includethe following (Owen, 2003; Steinberg and Hunter, 1984; Amstong et al., 1990):
. “Experimental design tells me what I already know”;
. “I need to make additional effort to prove what I already know”;
. “It sounds good, but it is not applicable to my job”;
. “It looks great, but when can I use it?”.
Low commitment of managersAny statistical method will ultimately fail unless management is receptive to facts anddata (Schmidt and Lausnby, 2005). Too many managers are unaware of the importanceof statistical techniques in processes and product development. They do not instinctivelythink statistically, mainly because they are not convinced that statistical thinking addsany value to management and decision-making (John and Johnson, 2002).
This barrier is mainly due to the lack of managerial training, since business schoolsde-emphasise one of the key aspects in the field of quality and systems thinking:understanding through data and its statistical analysis (Schippers, 1998; McAleveyand Everett, 2003). On the other hand, some managers do recognise the value ofexperimentation, but they only use experiments to confirm their initial assumptions(Schoemaker and Gunther, 2006).
Insufficient resourcesMany engineers believe that applying DoE requires more resources (time, cost, etc.)than traditional approaches, although they usually appreciate the technique’sproblem-solving potential (Amstong et al., 1990; Owen, 2003). They believe that DoE istoo resource-demanding and compromises equipment availability (Bergquist andAlbing, 2006; Owen, 2003). Moreover, when off-line experiments are unfeasible andproduction load is high, they believe that applying DoE is too expensive.
Barriers facedby engineers
567
Absence of teamwork skillsSince experimentation is a team process, its success depends on involving the rightpeople and having them work as a team (Knowlton and Keppinger, 1993), which is noteasy. Moreover, one of the common obstacles when it comes to teamwork is the lack ofcommunication within the group (Antony et al., 1998). Poor interpersonal relationshipsand lack of communication may cause the project to fail (Amstong et al., 1990). Whenpeople with different backgrounds such as engineers, managers and statisticians forma group, they have to bridge a gap of knowledge and experience to successfully workas a team during each step of the process (Tay and Butler, 1999).
Negative image of statisticsMany engineers are reluctant to apply DoE because it requires the use of statistics,planning and discipline (Anderson and Kraber, 1999). They see statistical methods asirrelevant and arcane (Gunter, 1985). Not only does statistics lack visibility, it lacksinfluence as a discipline. Some engineers see statisticians as only compilers of data(Marquardt, 1987).
Statistics tends to be among the least popular subjects at universities. Hogg (1991)said that since statistics is generally badly taught, it is easy to understand why eventhe most intelligent students are averse to something that seems unnecessarilycomplicated and not very useful. Consequently, most engineers have a negative imageof statistics (Hoadley and Kettering, 1990). The word statistics tends to invoke fear andresistance towards its use (Antony et al., 1998; Anderson and Kraber, 1999).
Educational barriersPublications do not reach engineersEngineers, especially those from small and medium enterprises (SME), do not haveaccess to books and articles that explain DoE in detail (Amstong et al., 1990). Moreover,the publications that are available tend to be of limited usefulness since they aregenerally focused on mathematical problems rather than on the whole experimentationprocess. Few practical experiences (especially in services), and even fewer examples offailures in experimentation, are published (Bergquist and Albing, 2006).
Furthermore, most of the material is in English, which has become the internationallanguage of science and of peer-reviewed publications. Unfortunately, many engineersand statisticians in the developing world lack adequate English reading skills and,therefore, cannot use such materials (Romeu, 2006).
Poor statistical backgroundAnother factor that hinders the use of DoE is the lack of familiarity that practicingengineers have with statistical concepts related to DoE methods (Chen, 1991; Bergquistand Albing, 2006). Unfortunately, the education that engineers receive in statistics is alltoo often deficient and inadequate (Antony et al., 1998; Romeu, 2006; Costa et al., 2006).
Results of a survey carried out by Romeu (2006) of several quality, reliability andmanufacturing engineers in New York and Florida (via the Isostat ASA group) andmembers of the European Network for Business and Industrial Statistics (ENBIS)support this hypothesis. The majority (66 per cent) of graduated engineers (BS level)have either deficient training in statistics or none whatsoever.
TQM21,6
568
Statistics courses are generally inadequate and overly focused on probability theoryand hypothesis testing. Moreover, statistics education is presented almost exclusivelyas deductive, to the detriment of inductive development. The only experimentsstudents participate in, if any, are based on demonstration and are often of limitededucational value (Bisgaard, 1991). Consequently, the statistics needed to implementDoE is generally misunderstood and wrongly applied. We must address the followingquestions (Gunter, 1985; Viles, 2006): What type of statistics should engineers study?;Is one statistics course enough? Does this training provide the understanding and toolsnecessary to meet the productivity and quality challenges of today?
DoE is not taught to engineers at universitiesAlthough statistical experimentation design is considered to be an essential componentof engineering training, engineers and scientists receive little or no training in DoE atthe university level (Gunter, 1985). Consequently, many often leave universitieswithout a proper understanding of the power of statistics and are likely to regardstatistics as useless to their future careers (Bisgaard, 1989).
Most statistics professors believe that one course is not enough to teach the conceptsthat engineers and scientists need. However, we cannot expect a student to sit throughmore than a one-semester course if it does not appear to be either useful or relevant(Bisgaard, 1991).
DoE is badly taughtThe way in which DoE is taught is generally inadequate (Funkenbusch, 2005; Kenett,1987; Wilson, 2002). Engineering teachers have also been traditionally unaware of howvital experimentation is to an engineer’s daily work (Bisgaard, 1991). The mostcommon criticisms of the teaching of statistics in the USA are that it is too academic infocus, excessively theoretical and divorced from the real problems that can appear inthe industrial and business world. We share Romero’s opinion (Romero et al., 1995) thatthese criticisms also describe the teaching of statistics in most European countries.
Planning is not generally emphasised, so courses tend to be overly focused on choosingthe design and analysis (Coleman and Montgomery, 1993). As much as 70-80 per cent ofmost DoE training courses and text books are dedicated to analysis and design selection.Courses are organised and taught as a kind of logical cookbook of statistical formulasrather than in response to the real needs of practical engineering (Gunter, 1985).
Unfortunately, working with practical examples or real student experimentation isnot encouraged. It doesn’t help that professors usually lack practical experience, sinceteaching DoE through textbook examples does not fully shed light on how to identifyand formulate problems, identify factors and determine the performance of physicalexperiments (Coleman and Antony, 2000). If problem-solving skills using statisticalmethods and DoE had been successfully taught to engineers, today all engineeringteachers would be including it in their classes (Bisgaard, 1991). There is a clearconsensus that academia needs to change the way it teaches business statistics (Johnand Johnson, 2002).
Poor statistical consultancyMost statisticians do not seem to become involved deeply enough in the field of scienceto understand scientific problems in their contexts (Hoadley and Kettering, 1990; Box
Barriers facedby engineers
569
et al., 2005). Moreover, consultants tend to oversell the technique or to create unrealisticexpectations of the benefits reaped from DoE. They seem to convince companies thatexperimental design is the answer to all of their problems (Owen, 2003). Consultationinaccuracy such as creating unrealistic expectations and failing to go to the core of theproblem are common among consultants. Moreover, many SMEs cannot afford theseservices.
Technical barriersLimited software aidIn the past, the spread of DoE was hampered by both a lack of proper training and toolsto help implement DoE in industry (Joglekar and Kackar, 1989). Although manycommercial software products which aid in experimentation analysis are availablenowadays, they are not adequate enough to satisfy industrial needs (Costa et al., 2006;Antony et al., 1998). Most commercially available DoE software programmes are madeup of little more than catalogues of standard designs presented in a logical sequence.They lead to the erroneous application of statistical methods and are poor at handlingspecial technical features (Tay and Butler, 1999). Finally, they are too focused ondesign and analysis selection and do not cover the entire experimentation process.
Statistical jargon is used to explain DoEMost statistics textbooks for engineers are written by statisticians (Amstong et al.,1990). Consequently, many references in these books are written in statistical jargon orterminology that is unfamiliar to engineers and technicians (Hoadley and Kettering,1990; Schneider, 2006). Specific language (jargon) can be an obstacle to students whenlearning DoE (Wilson, 2002). These explanations do not ease the application of DoE,although they must be understood by the appropriate manufacturing personnel(Amstong et al., 1990).
Lack of methodologies to guide users through experimentationTay and Butler (1999) present a review of DoE methodologies, which states that twobasic types of methodologies are in use today:
(1) Classical techniques: Developed in the UK and the USA during the 1920s.Includes full-factorial designs, fractional factorial designs, D-optimal designsand Response surface designs.
(2) Taguchi methods: Developed by engineer Genechi Taguchi in Japan during the1950 s. His original work is documented in his two-volume book (Taguchi,1987). A number of novel designs and analyses are promoted, as are orthogonalarrays and signal-to-noise ratio analysis.
Both types have their proponents and opponents, and the discussion between the twohas become heated at times (Box et al., 1988). Tay and Butler also emphasise that thereis a lack of experimental planning and managerial guidance in the field. This is in partdue to the fact that industry literature gives little attention to the methodologies neededto carry out DoE implementation, focusing rather on data analysis. In order forexperimental design to be successfully applied in today’s industrial environment, amixture of statistics, planning, engineering, communication and teamwork skills arerequired (Antony, 1999).
TQM21,6
570
Moreover, existing material is limited to a collection of unstructured, unorganisedand uneven elements (Romeu, 2006). There is a real need to develop a simplified seriesof operational steps that lead to a proper solution (Amstong et al., 1990).
Previous negative experiences with DoENegative experiences with DoE may make companies reluctant to use DoE again. Themajority of negative DoE experiences can be classified into two groups. First, thoserelated to technical issues, such as (Coleman and Montgomery, 1993; Anderson andKraber, 1999):
. choosing unreasonably large or small designs;
. inadequate and/or inaccurate measurement of responses or factors;
. running experiments in an incorrect order;
. lacking awareness of assumptions: knowing how to evaluate them, knowingalternatives when they are needed; and
. undesirable combinations of variable control levels in the design.
Second, mistakes that may be due to non-technical issues such as (Leon et al., 1993;Knowlton and Keppinger, 1993; Box and Liu, 1999; Gunter, 1993; Robinson, 2000;Peace, 1993; Anderson-Cook, 2006).
. not choosing the right factors and appropriate levels;
. underestimating non-statistical aspects in planning and conducting experiments;
. lack of planning; and
. carrying out one-shot experimentation, instead of iterating when possible.
Absence of theoretical developments to solve real industrial problemsMost of the development of DoE is mathematically complex. The complexity of someproblems, due to restrictions in the factors and available experiments, makes itimpossible for engineers to find a solution using the current DoE technique.
DoE is not widely used because it is a complex toolSome engineers believe that DoE is a difficult technique because of the inherentcomplexity of the tools involved (Costa et al., 2006; Antony et al., 1998; Tay and Butler,1999). Unfortunately, the development of DoE is often too mathematically complex forthose not well-versed in mathematics (Schmidt and Case, 2002). It doesn’t help thatmany engineers don’t use DoE frequently: many users work with DoE fewer than twicea year. This makes it quite difficult to develop an intuitive feel for procedures that areused so rarely (Grant, 2006).
Successful application of DoE analogyTo better explain some concepts; we believe it is useful to present an analogy, shown inFigure 1. As can be seen, in order to successfully apply DoE, it is necessary to climbthree consecutive ladders. Each ladder represents a group of barriers. The order inwhich they are presented is not important, but successful application of DoE cannot beaccomplished unless all ladders are climbed. This concept is of great importance as
Barriers facedby engineers
571
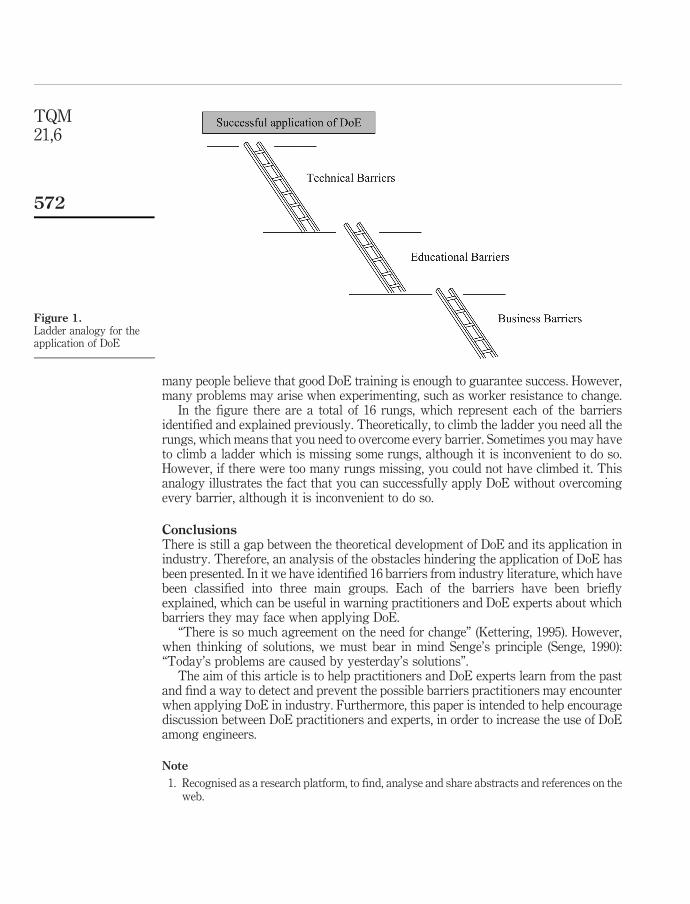
many people believe that good DoE training is enough to guarantee success. However,many problems may arise when experimenting, such as worker resistance to change.
In the figure there are a total of 16 rungs, which represent each of the barriersidentified and explained previously. Theoretically, to climb the ladder you need all therungs, which means that you need to overcome every barrier. Sometimes you may haveto climb a ladder which is missing some rungs, although it is inconvenient to do so.However, if there were too many rungs missing, you could not have climbed it. Thisanalogy illustrates the fact that you can successfully apply DoE without overcomingevery barrier, although it is inconvenient to do so.
ConclusionsThere is still a gap between the theoretical development of DoE and its application inindustry. Therefore, an analysis of the obstacles hindering the application of DoE hasbeen presented. In it we have identified 16 barriers from industry literature, which havebeen classified into three main groups. Each of the barriers have been brieflyexplained, which can be useful in warning practitioners and DoE experts about whichbarriers they may face when applying DoE.
“There is so much agreement on the need for change” (Kettering, 1995). However,when thinking of solutions, we must bear in mind Senge’s principle (Senge, 1990):“Today’s problems are caused by yesterday’s solutions”.
The aim of this article is to help practitioners and DoE experts learn from the pastand find a way to detect and prevent the possible barriers practitioners may encounterwhen applying DoE in industry. Furthermore, this paper is intended to help encouragediscussion between DoE practitioners and experts, in order to increase the use of DoEamong engineers.
Note
1. Recognised as a research platform, to find, analyse and share abstracts and references on theweb.
Figure 1.Ladder analogy for theapplication of DoE
TQM21,6
572
References
Amstong, R.P., Box, G.E.P., Godfrey, A.B., Hahn, G.J., Hooper, J.H., Hunter, J.S., Mackay, J.,Moore, D.S., Snee, R.D., Tribus, M. andWangen, L.E. (1990), “Commentary: is there really acommunications gap between statisticians and engineers?”, Technometrics, Vol. 32,pp. 249-74.
Anderson, M.J. and Kraber, S.L. (1999), “Eight keys to successful DoE”, Quality Digest, Vol. 19.
Anderson-Cook, C. (2006), “What and when to randomize”, Quality Progress, Vol. 39, pp. 59-62.
Antony, J. (1999), “Ten useful and practical tips for making your industrial experimentssuccessful”, The TQM Magazine, Vol. 11, pp. 252-6.
Antony, J. (2002), “Training for design of experiments using a catapult”, Quality and ReliabilityEngineering International, Vol. 18, pp. 29-35.
Antony, J., Kaye, M. and Frangou, A. (1998), “A strategic methodology to the use of advancedstatistical quality improvement techniques”, The TQM Magazine, Vol. 10, pp. 169-76.
Bergquist, B. and Albing, M. (2006), “Statistical methods – does anyone really use them?”, TotalQuality Management and Business Excellence, Vol. 17, pp. 961-72.
Bisgaard, S. (1989), “The quality detective: a case study. Philosophical transactions of the RoyalSociety of London. Series A”, Mathematical and Physical Sciences, Vol. 327, pp. 489-511.
Bisgaard, S. (1991), “Teaching statistics to engineers”, The American Statistician, Vol. 45,pp. 274-83.
Box, G.E.P. and Liu, P.Y.T. (1999), “Statistics as a catalyst to learning by scientific method. PartI”, Journal of Quality Technology, Vol. 31, pp. 1-15.
Box, G.E.P., Bisgaard, S. and Fung, C. (1988), “An explanation and critique of Taguchi’scontribution to quality engineering”, International Journal of Quality & ReliabilityManagement, Vol. 4, pp. 123-31.
Box, G.E.P., Hunter, J.S. and Hunter, W.G. (2005), Statistics for Experimenters – Design,Innovation and Discovery, John Wiley and Sons, New York, NY.
Coleman, D.E. and Montgomery, D.C. (1993), “A systematic approach to planning for a designedindustrial experiment”, Technometrics, Vol. 35, pp. 1-12.
Coleman, S. and Antony, J. (2000), “Teaching fractional factorial experiments via course delegatedesigned experiments”, Quality Assurance, Vol. 7, pp. 37-48.
Costa, N.R.P., Pires, A.R. and Ribeiro, C.O. (2006), “Guidelines to help practitioners of design ofexperiments”, TQM Magazine, Vol. 18, pp. 386-99.
Czitrom, V. (1999), “One factor at a time versus designed experiment”, The American Statistician,Vol. 53, pp. 126-31.
Chen, F.T. (1991), “A personal computer based expert system framework for the design ofexperiments”, Proceedings of the 13th Annual Conference on Computers and IndustrialEngineering, Orlando, FL, March 9-13.
Funkenbusch, P.D. (2005), Practical Guide to Designed Experiments. A Unified ModularApproach, Marcel Dekker, New York, NY.
Grant, F. (2006), “Planning for the unexpected”, Scientific Computing World, February-March,pp. 24-7.
Gremyr, I., Arvidsson, M. and Johansson, P. (2003), “Robust design methodology: a status in theSwedish manufacturing industry”, Quality and Reliability Engineering International,Vol. 19, pp. 285-93.
Gunter, B.H. (1985), “Improved statistical training for engineers – prerequisite to quality”,Quality Progress, Vol. 18 No. 11, pp. 37-40.
Barriers facedby engineers
573
Gunter, B.H. (1993), “Discussion: a systematic approach to planning for a designed industrialexperiment”, Technometrics, Vol. 35, pp. 13-14.
Hahn, G.J. and Hoerl, R. (1998), “Key challenges for statisticians in business and industry”,Technometrics, Vol. 40, pp. 195-200.
Hoadley, B.A. and Kettering, J.R. (1990), “Communications between statisticians andengineers/physical scientist”, Technometrics, Vol. 32, pp. 243-7.
Hogg, R.V. (1991), “Statistical education: improvements are badly needed”, The AmericanStatistician, Vol. 45, pp. 342-3.
Joglekar, A.M. and Kackar, R.N. (1989), “Graphical and computer-aided approaches to planexperiments”, Quality and Reliability Engineering International, Vol. 5, pp. 113-23.
John, J.A. and Johnson, D.G. (2002), Statistical Thinking for Effective Management, ICOTS6, CapeTown.
Kenett, R.S. (1987), “Some experiences teaching factorial design in introductory statisticscourses”, Journal of Applied Statistics, Vol. 14, pp. 219-27.
Kettering, J.R. (1995), “What industry needs”, The American Statistician, Vol. 49, pp. 2-4.
Knowlton, J. and Keppinger, R. (1993), “The experimentation process”, Quality Progress, Vol. 6,pp. 43-7.
Leon, R.V., Shoemaker, A.C. and Tsui, K.-L. (1993), “Discussion: a systematic approach toplanning for a designed industrial experiment”, Technometrics, Vol. 35, pp. 21-4.
Lye, L.M. (2005), “Tools and toys for teaching design of experiments methodology”, Proceedingsof the 33rd Annual General Conference of the Canadian Society for Civil Engineering.Toronto, Ontario, Canada, June 2-4.
McAlevey, L. and Everett, A.M. (2003), “How can the quality gap be bridged? Avoiding a futureof specialist isolation through statistics education”, Total Quality Management andBusiness Excellence, Vol. 14, pp. 801-10.
Marquardt, D.W. (1987), “The importance of statisticians”, Journal of American StatisticalAssociation, Vol. 82, pp. 1-7.
Owen, M.R.E.A. (2003), “A scientist’s viewpoint on promoting effective use of experimentaldesign: ten things a scientist wants to know about experimental design”, PharmaceuticalStatistics, Vol. 2, pp. 15-29.
Peace, G.S. (1993), Taguchi Methods: A Hands-On Approach, Addison Wesley, New York, NY.
Robinson, G.K. (2000), Practical Strategies for Experimentation, Wiley, Chichester.
Romero, R., Ferrer, A., Capilla, C., Zunica, L., Balasch, S., Serra, V. and Alcover, R. (1995),“Teaching statistics to engineers: an innovative pedagogical experience”, Journal ofStatistics Education, Vol. 3 No. 1.
Romeu, J.L. (2006), Teaching Engineering Statistics to Practicing Engineers, ICOTS-7, Salvador.
Schippers, W.L. (1998), “Applicability of statistical process control techniques”, Journal ofProduction Economics, Vol. 56-57, pp. 525-35.
Schmidt, S. and Case, K. (2002), “Communicating design of experiments (DoE), tonon-statisticians”, available at: www.aircad.com
Schmidt, S.R. and Lausnby, R.G. (2005), Understanding Industrial Designed Experiments, AirAcademy Press, Colorado Springs, CO.
Schneider, G. (2006), “Process analysis with design of experiments”, available at: www.queng.com
TQM21,6
574
Schoemaker, P.J.H. and Gunther, R.E. (2006), “The wisdom of deliberate mistake”, HarvardBusiness Review, June, pp. 109-15.
Senge, P.M. (1990), The Fifth Discipline – The Art and Practice of the Learning Organizations,Random House, London.
Steinberg, D.M. and Hunter, W.G. (1984), “Experimental design: review and comment”,Technometrics, Vol. 26, pp. 71-97.
Taguchi, G. (1987), System of Experimental Design: Engineering Methods to Optimize Quality andMinimize Cost, UNIPUB/Kraus International, White Plains, NY.
Tanco, M., Viles, E., Ilzarbe, L. and Alvarez, M.J. (2008), “Is design of experiments really used? Asurvey of Basque industries”, Journal of Engineering Design, Vol. 19 No. 5, pp. 447-60.
Tay, K.-M. and Butler, C. (1999), “Methodologies for experimental design: a survey, comparisonand future predictions”, Quality Engineering, Vol. 11, pp. 343-56.
Viles, E. (2006), “Statistics for industrial engineers”, Scientific Computing World, June/July,pp. 40-1.
Wilson, R.J. (2002), What Does This Have to Do with Us? Teaching Statistics to Engineers,ICOTS6, Cape Town.
Corresponding authorMartin Tanco can be contacted at: [email protected]
Barriers facedby engineers
575
To purchase reprints of this article please e-mail: [email protected] visit our web site for further details: www.emeraldinsight.com/reprints
The relationship between qualitymanagement and the speed of new
product developmentHongyi Sun, Yangyang Zhao and Hon Keung Yau
Department of Manufacturing Engineering and Engineering Management,City University of Hong Kong, Hong Kong
Abstract
Purpose – The speed of new product development (NPD) has been a key factor in a firm’s degree ofcompetitiveness. The tools and philosophy of quality management have been widely used to improveand control product quality. However, there is a lack of literature on the relationship between qualitymanagement and NPD. This paper aims to report on a study that investigates the influence of qualitymanagement on the speed of NPD.
Design/methodology/approach – The philosophy of quality management refers to total qualitymanagement (TQM). Tools for quality management include teamwork, continuous improvement (CI),value analysis (VA) and quality function deployment (QFD). This study begins by comparingliterature in concurrent engineering (CE) and TQM, which leads to several common principles and fivehypotheses. The hypotheses are tested using survey data from 700 manufacturing companies in 20countries.
Findings – The research reveals that TQM, Team, VA and QFD are positively correlated with thespeed of NPD, meaning that the tools and philosophy of quality management have a positive influenceon the speed of NPD. However, no relationship is found between CI and the speed of NPD.
Research limitations/implications – This paper tests hypotheses using survey data. It revealsthe empirical relationship between quality management and the speed of NPD but does not providedetails regarding the mechanism of influence between the two. Consequently, case studies should beconducted in the future to probe into the details. Additionally, new quality methods like Six Sigma canalso be included in a future study, since Six Sigma covers both quality and NPD.
Practical implications – This study proposes that companies that have implemented TQM andother quality management tools will have a better foundation for implementing new NPD approacheslike CE and design for manufacturing and assembly. This is especially encouraging for those originalengineering manufacturing (OEM) firms that would like to change from OEM to original designmanufacturing/original brand manufacturing (ODM/OBM). OEM companies typically implementTQM but invest very little in NPD.
Originality/value – This paper fills the gap in research exploring the links between qualitymanagement and NPD. It addresses the concern over whether quality management may hinder NPD.The critical issues for implementing quality management such as culture change, learning, changemanagement, and team building can all be applied to implementing NPD methods such as CE. Theresult also supports the concept of “design the quality into products”. It is beneficial for employees inquality and NPD to share and work together.
Keywords Total quality management, Product development, Consumer satisfaction,Manufacturing industries, Customer service management, Continuous improvement
Paper type Research paper
The current issue and full text archive of this journal is available at
www.emeraldinsight.com/1754-2731.htm
The research reported in this paper is fully supported by a Strategic Research Grant (SRG7002298) from the City University of Hong Kong, Hong Kong, PRC.
TQM21,6
576
The TQM JournalVol. 21 No. 6, 2009pp. 576-588q Emerald Group Publishing Limited1754-2731DOI 10.1108/17542730910995855
1. IntroductionOver the past two decades, there have been a number of fundamental trends affectingmanufacturing industries. Among these, there has been a significant trend towardsspeeding up the rate of new product development (NPD). Some firms have madesubstantial progress in reducing NPD cycle times (Ali, 2000); specific accelerationtechniques can be used in this effort (Gonzales and Palacios, 2002; Langerak andHultink, 2008). Today, reduction of time in NPD offers a new source of competitiveadvantage. Companies that develop new products faster successfully obtain thecompetitive advantage (Gupta et al., 1992; Yam et al., 1996). Realising the importance ofNPD, researchers have conducted a huge amount of research on critical factors forsuccessful NPD (Balachandra and Friar, 1997; Cooper and Kleinschmidt, 1995; Pooltonand Barclay, 1998; Koufteros, 1995; Song and Montoya-Weiss, 1998).
However, based on the review of 47 studies regarding the determinants of newproduct performance across several disciplines, Montoya-Weiss and Calantone (1994)conclude that “much research on the drivers of new product performance has beendisjointed and lacking with respect to concise conclusions in which factors shouldcommand the most attention.” More researchers (Millson et al., 1992; Nijssen et al.,1995; Droge et al., 2000) suggest that a group of practices (as opposed to individualitems) should be studied, since these approaches are not separated but work together.
In this study, the TQM philosophy and some quality tools are studied in the contextof NPD. TQM applies an all-encompassing, quality-focused management approach toproviding products and services that satisfy customer requirements. TQM is aphilosophy that stresses a systematic, integrated, and consistent perspective involvingeveryone and everything. NPD should be influenced if a company has implementedTQM. This is because the philosophy and some tools of NPD are similar to those ofTQM, as elaborated in the literature section.
2. Literature review and hypothesis formulation2.1 Concurrent engineering (CE) and total quality management (TQM)Product development previously followed a sequential, over-the-wall approach thatnormally lead to a longer period of NPD. However, the new philosophy suggests anintegrated approach called Current Engineering (CE). Wu and Grady (1999) define CEas “the consideration, during the design phase, of the factors associated with the lifecycle of the product”. This technique bridges the gap between upstream design anddownstream manufacturing by enhancing intensive information sharing andteamwork. Bullinger and Warschat (1995) state that parallelisation, standardisationand integration are the three keys to a CE-oriented product development process.
CE suggests that organisational structures be more open and that teamwork andinformation have common ownership, be shared freely and be easily and freelyaccessible. CE is therefore the integration of all company resources needed for productdevelopment, like people, information and tools and resources. Many organisationshave formed some development teams under the CE approach to implement their ideasand to convert research to company profit and have gotten very good results over thepast few years.
One component of CE is Design for Manufacturing and Assembly (DFMA). Thismeans design for ease of manufacturing and assembly. The main objective is to reducethe number of separate parts to reduce the product cost. DFMA emphasises effective
Qualitymanagement
and NPD
577
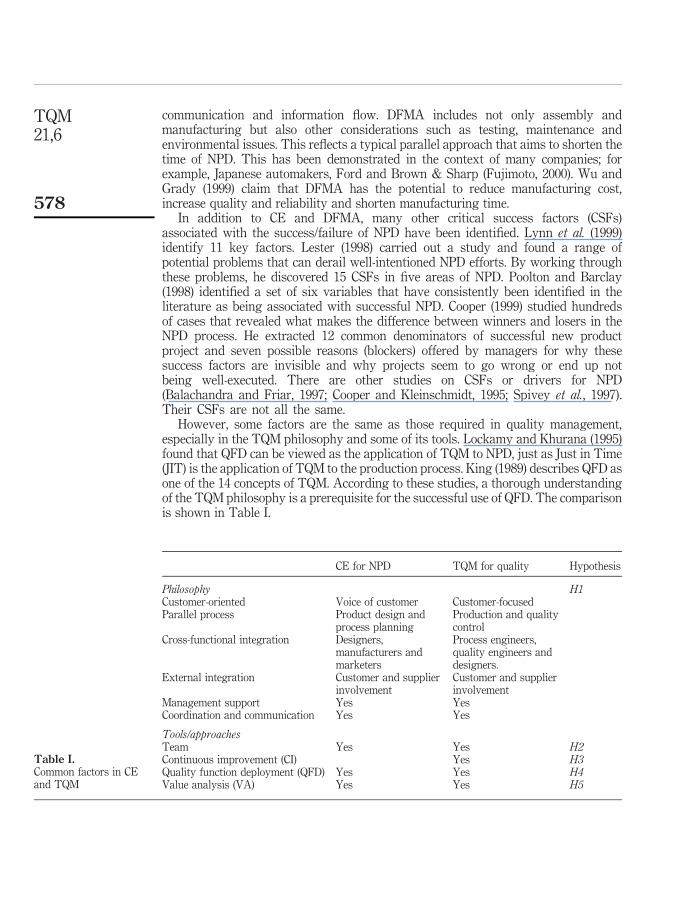
communication and information flow. DFMA includes not only assembly andmanufacturing but also other considerations such as testing, maintenance andenvironmental issues. This reflects a typical parallel approach that aims to shorten thetime of NPD. This has been demonstrated in the context of many companies; forexample, Japanese automakers, Ford and Brown & Sharp (Fujimoto, 2000). Wu andGrady (1999) claim that DFMA has the potential to reduce manufacturing cost,increase quality and reliability and shorten manufacturing time.
In addition to CE and DFMA, many other critical success factors (CSFs)associated with the success/failure of NPD have been identified. Lynn et al. (1999)identify 11 key factors. Lester (1998) carried out a study and found a range ofpotential problems that can derail well-intentioned NPD efforts. By working throughthese problems, he discovered 15 CSFs in five areas of NPD. Poolton and Barclay(1998) identified a set of six variables that have consistently been identified in theliterature as being associated with successful NPD. Cooper (1999) studied hundredsof cases that revealed what makes the difference between winners and losers in theNPD process. He extracted 12 common denominators of successful new productproject and seven possible reasons (blockers) offered by managers for why thesesuccess factors are invisible and why projects seem to go wrong or end up notbeing well-executed. There are other studies on CSFs or drivers for NPD(Balachandra and Friar, 1997; Cooper and Kleinschmidt, 1995; Spivey et al., 1997).Their CSFs are not all the same.
However, some factors are the same as those required in quality management,especially in the TQM philosophy and some of its tools. Lockamy and Khurana (1995)found that QFD can be viewed as the application of TQM to NPD, just as Just in Time(JIT) is the application of TQM to the production process. King (1989) describes QFD asone of the 14 concepts of TQM. According to these studies, a thorough understandingof the TQM philosophy is a prerequisite for the successful use of QFD. The comparisonis shown in Table I.
CE for NPD TQM for quality Hypothesis
Philosophy H1Customer-oriented Voice of customer Customer-focusedParallel process Product design and
process planningProduction and qualitycontrol
Cross-functional integration Designers,manufacturers andmarketers
Process engineers,quality engineers anddesigners.
External integration Customer and supplierinvolvement
Customer and supplierinvolvement
Management support Yes YesCoordination and communication Yes Yes
Tools/approachesTeam Yes Yes H2Continuous improvement (CI) Yes H3Quality function deployment (QFD) Yes Yes H4Value analysis (VA) Yes Yes H5
Table I.Common factors in CEand TQM
TQM21,6
578
Quality management systems based on TQM aim to enhance product quality,providing organisations with a means of achieving higher quality processes. As adirect consequence of this, customer satisfaction is improved (Pfeifer, 2002). These arethe requirements for both existing and new products. TQM aims for quality principlesto be applied broadly throughout an organisation or set of business processes. If acompany implements TQM, this should influence NPD (if any is ongoing) as well.Therefore, it is reasonable to propose the relationship between quality managementtools and NPD in this way.
H1. Companies that have implemented the TQM philosophy develop newproducts faster.
2.2 TeamTeamwork in the manufacturing industries has increased significantly. Increases inproduct and process complexity and shorter product lives have been the major reasonsfor this shift (Funk, 1992). Many articles have stated that teamwork is one of the majorelements of CE, which provides a systematic and integrated approach to theintroduction and design of products (Kinna, 1995; Harding et al., 1999). Functions suchas design and engineering are integrated into teams so that continuous and completeinformation can be exchanged. As the commencement of each distinct stage is notdependent upon the full completion of the preceding stage, overlapping activities cantake place, leading to concurrency in product development. In addition, teamworkquality is significantly related to improved performance in terms of NPD (Dayan andBenedetto, 2009).
The application of CE and NPD depends on the ability to build, empower andnurture teams. Well functioning teams help the integration of all factors like customersatisfaction, user needs, technology base, material, manufacturing capability, andsupport capabilities. Successful teams overcome the shortcomings of hierarchicalstructures and generate quality decisions (Spivey et al., 1997). Henke et al. (1993)emphasise that the key discriminators are not the way the team is managed, but thedecision-making process used by the team. Musselwhite (1990), in another researchstudy, reported that over 80 per cent of the projects using a cross-functional team metor exceeded commercial exceptions, compared with 60 per cent of projects headed bytechnical line management, 50 per cent of projects headed by technical projectmanagement and only 20 per cent of one-person operations. These studies havedemonstrated the fact that properly forming a development team can help a companybe successful in NPD. When team members discuss and share ideas and providedifferent solutions to problems at different stages, the best results possible will beachieved, including decreased development cycle time, decreased cost and moreefficient use of resources.
The above discussion suggests that in a product development process withcross-functional teams, training, group decision-making, the commitment of teammembers and top management and high project importance, product designs may beachieved in less time and with lower costs.
H2. Companies that have implemented a team structure should develop newproducts faster.
Qualitymanagement
and NPD
579
2.3 Continuous improvementKaizen is a Japanese word meaning continuous improvement (CI). Imai, whointroduced the term kaizen in 1986, defined it as “ongoing improvement involvingeveryone – top managers and workers”. It is an umbrella concept covering most ofthose “uniquely Japanese” practices that have once achieved worldwide fame (Masaak,1986). In order to introduce improvements in innovation performance, CI has been usedto change the NPD processes that some organisations use (Dooley and Johnson, 2001).
NPD can take advantage of kaizen by reducing product cycle-time, increasingproduct quality and simplifying the development process. As production technologyadvances and customer demand for product variety increases, the rate at which newproducts are introduced into the market is more rapid. Thus, the product life cycle ismuch shorter. The speed-to-market in today’s fast-paced, competitive environment issignificantly positively associated with new product success (Kate and William, 1999).The improvement of existing products through the addition of new features, the designof more user-friendly operations or even the reduction of redundant parts can createmore new products. These new products can be upgraded again into yet more newproducts according to market demand. Hence, the traditional product life cycle ofdevelopment, growth, maturity and decline is now shortened to produce more andmore new products. Obviously, the time that it takes to modify an existing product sothat it becomes new is shorter than the time required to develop a new product fromscratch. This CI, kaizen, has reduced product cycle-time and hence sent products intothe marketplace more quickly. In fact, this strategy has been employed by manycompanies in recent years. Intel launched several new products each year just byimproving the clock speed of one CPU. By using the planning, doing, checking andaction (PDCA) cycle and TQM tools, kaizen can simplify the process of NPD, resultingin better quality and lower price (Sirvanci and Durmaz, 1994).
We have discussed in the previous section the fact that teamwork presents apositive contribution to NPD. However, cross-functional teams may encounter manyproblems, often in terms of conflict-resolution. Kaizen enables management to take asystematic and collaborative approach to cross-functional problem solving byestablishing a corporate culture in which everyone can freely admit these problems(Masaak, 1986). New technologies and machines play important roles in NPDnowadays. However, without proper operation and utilisation by individuals, they donot benefit the company. The set-up of teams that share expertise and build up a kaizenculture – one that continuously improves every process and every procedure in everyway – helps push the company toward success.
H3. Companies that have implemented CI should develop new products morequickly.
2.4 Value analysisThe purpose of value analysis/value engineering (VA/VE) is to simplify products andprocesses (Fowler, 1990). Its objective is to achieve equivalent or better performance ata lower cost while maintaining all functional requirements defined by the customer.VA does this by identifying and eliminating unnecessary costs. Technically, VA/VEdeals with products already in production and is used to analyse product specificationsand requirements, as shown in production documents and purchase requests.Typically, purchasing departments use VA as a cost-reduction technique. Performed
TQM21,6
580
before the production stage, VE is considered a cost-avoidance method. In practice,however, there is alternation between the two for a given product. This occurs becausenew materials, processes and so forth require the application of VA techniques toproducts that have previously undergone VE.
NPD is the means by which companies continually renew themselves. New productsare the lifeblood of manufacturing organisations. For many companies today, newproducts will represent as much as half of their sales in the next three to four years.Even more importantly, most of their sales and profit growth will stem from newproducts. This indicates the importance of VA to the development process for newproducts (Prasad, 1998; DellIsola, 1997).
H4. Companies that have implemented VA should develop new products morequickly.
2.5 Quality function deploymentQuality function deployment (QFD) (Karbhari, 1994; Zairi and Youssef, 1995;Abdul-Rahman et al., 1999; Tsai et al., 2002) is a systematic product developmentmethodology that insures that products and services are designed with the “Voice ofthe Customer” in mind. When a cross-functional team uses QFD, dynamic productsbecome a reality. Applying QFD leads to a reduction in cycle time, engineeringchanges, scrap and rework and warranty returns.
QFD links customer requirements or “whats” with the appropriate engineeringdesign characteristics, or “hows”, so that the voice of the customer is translated intoproduct designs and specifications. Building quality is an important step in movingfrom customer requirements to production requirements. QFD offers productdevelopment teams the opportunity to achieve significant improvements overtraditional product development practices. QFD may also enable the firm to cutproduct costs and reduce time-to-market.
QFD can be used to develop innovative products (Miguel, 2007). It offers productdevelopment teams the opportunity to achieve significant improvements overtraditional product development practices. QFD creates an information-intensiveatmosphere in which communication increases and ideas are freely exchanged. Thishas a positive impact on developing product concepts and devising designs that meetcustomer quality and performance objectives. QFD may also enable the firm to cutproduct costs and reduce time-to-market. QFD is able to simplify the manufacturingprocess, but overall product costs appear to be only slightly less when QFD is appliedthan when traditional practices are used. The reason for this small improvement inproduct costs and time-to-market may be a lack of experience with QFD. For manyorganisations, this was a first attempt to apply QFD and the first application of QFD toa particular product. As companies gain experience with QFD and learn to apply itmore effectively, product costs and time-to-market may decline.
H5. Companies that have implemented QFD should develop new products morequickly.
Based on the formulation of the five hypotheses, a framework is proposed as shown inFigure 1.
Qualitymanagement
and NPD
581
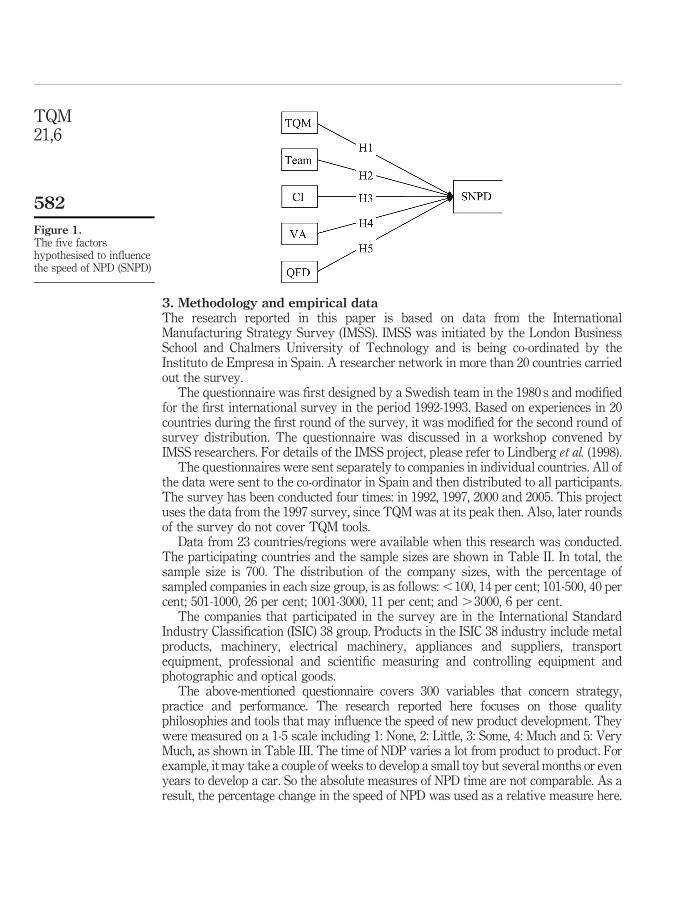
3. Methodology and empirical dataThe research reported in this paper is based on data from the InternationalManufacturing Strategy Survey (IMSS). IMSS was initiated by the London BusinessSchool and Chalmers University of Technology and is being co-ordinated by theInstituto de Empresa in Spain. A researcher network in more than 20 countries carriedout the survey.
The questionnaire was first designed by a Swedish team in the 1980 s and modifiedfor the first international survey in the period 1992-1993. Based on experiences in 20countries during the first round of the survey, it was modified for the second round ofsurvey distribution. The questionnaire was discussed in a workshop convened byIMSS researchers. For details of the IMSS project, please refer to Lindberg et al. (1998).
The questionnaires were sent separately to companies in individual countries. All ofthe data were sent to the co-ordinator in Spain and then distributed to all participants.The survey has been conducted four times: in 1992, 1997, 2000 and 2005. This projectuses the data from the 1997 survey, since TQM was at its peak then. Also, later roundsof the survey do not cover TQM tools.
Data from 23 countries/regions were available when this research was conducted.The participating countries and the sample sizes are shown in Table II. In total, thesample size is 700. The distribution of the company sizes, with the percentage ofsampled companies in each size group, is as follows: ,100, 14 per cent; 101-500, 40 percent; 501-1000, 26 per cent; 1001-3000, 11 per cent; and .3000, 6 per cent.
The companies that participated in the survey are in the International StandardIndustry Classification (ISIC) 38 group. Products in the ISIC 38 industry include metalproducts, machinery, electrical machinery, appliances and suppliers, transportequipment, professional and scientific measuring and controlling equipment andphotographic and optical goods.
The above-mentioned questionnaire covers 300 variables that concern strategy,practice and performance. The research reported here focuses on those qualityphilosophies and tools that may influence the speed of new product development. Theywere measured on a 1-5 scale including 1: None, 2: Little, 3: Some, 4: Much and 5: VeryMuch, as shown in Table III. The time of NDP varies a lot from product to product. Forexample, it may take a couple of weeks to develop a small toy but several months or evenyears to develop a car. So the absolute measures of NPD time are not comparable. As aresult, the percentage change in the speed of NPD was used as a relative measure here.
Figure 1.The five factorshypothesised to influencethe speed of NPD (SNPD)
TQM21,6
582
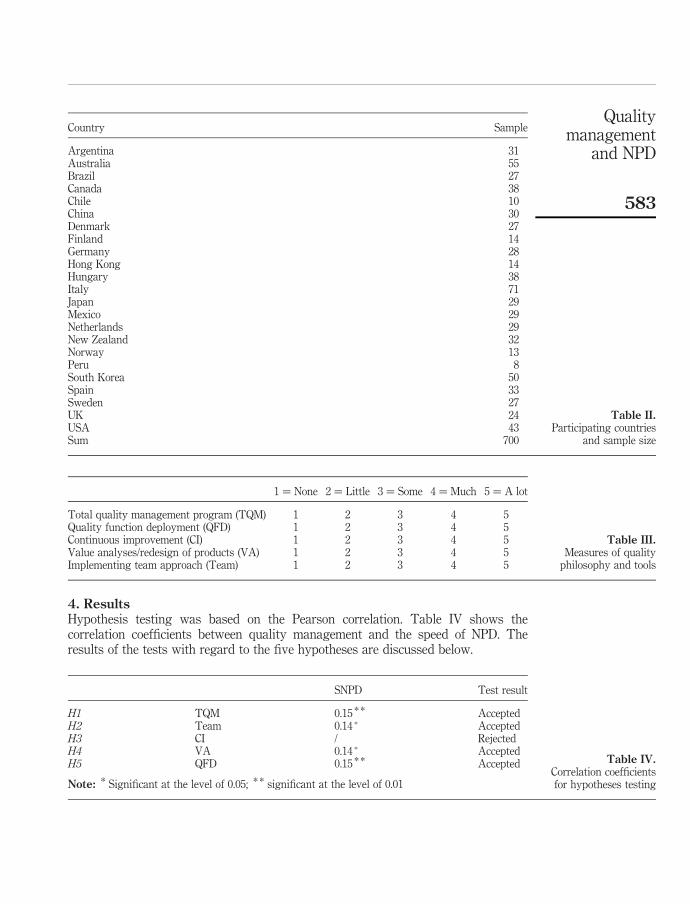
4. ResultsHypothesis testing was based on the Pearson correlation. Table IV shows thecorrelation coefficients between quality management and the speed of NPD. Theresults of the tests with regard to the five hypotheses are discussed below.
1 ¼ None 2 ¼ Little 3 ¼ Some 4 ¼ Much 5 ¼ A lot
Total quality management program (TQM) 1 2 3 4 5Quality function deployment (QFD) 1 2 3 4 5Continuous improvement (CI) 1 2 3 4 5Value analyses/redesign of products (VA) 1 2 3 4 5Implementing team approach (Team) 1 2 3 4 5
Table III.Measures of quality
philosophy and tools
SNPD Test result
H1 TQM 0.15 * * AcceptedH2 Team 0.14 * AcceptedH3 CI / RejectedH4 VA 0.14 * AcceptedH5 QFD 0.15 * * Accepted
Note: * Significant at the level of 0.05; * * significant at the level of 0.01
Table IV.Correlation coefficientsfor hypotheses testing
Country Sample
Argentina 31Australia 55Brazil 27Canada 38Chile 10China 30Denmark 27Finland 14Germany 28Hong Kong 14Hungary 38Italy 71Japan 29Mexico 29Netherlands 29New Zealand 32Norway 13Peru 8South Korea 50Spain 33Sweden 27UK 24USA 43Sum 700
Table II.Participating countries
and sample size
Qualitymanagement
and NPD
583
The correlation between the TQM philosophy and the speed of NPD is 0.15. Thecorrelation is positively significant at a level of 0.01. Therefore, H1 is accepted. Thisimplies that companies with TQM tend to develop new products more quickly. FromTable IV, it is also evident that the correlation between team and the speed of NPD is0.14. This correlation is positively significant at the level of 0.05. Therefore, H2 isaccepted. This means that teamwork also helps companies’ speed up NPD. However,the correlation between CI and the speed of NPD is not significant. Therefore, H3 isrejected. Additionally, VA is correlated with the speed of NPD (r ¼ 0.14, p , 0.05). Asa result, H4 is accepted. This means VA is also a useful tool for shortening the time ofNPD. Finally, QFD is also significantly correlated with the speed of NPD (r ¼ 0.15,p , 0.01). Thus, H5 is also accepted. This suggests that QFD is an effective tool forspeeding NPD.
The research reveals that four of the five hypotheses were validated by the data.This implies that companies with TQM and relevant tools should experience fasterNPD. The only hypothesis that was rejected is the one about continuous improvement.There is little understanding of the practical issues surrounding the adoption of CI inNPD processes (Caffyn and Grantham, 2003). So far, no empirical research has beenfound about CI and speeding up NPD. The topic will be left for future research. Theresults and their implications will be discussed in the next section.
5. Discussions and conclusionsThis research reveals that there is positive correlation between quality managementand the speed of NPD. It should be pointed out that the correlation coefficients arerather slight, although they are positive and significant. This is perhaps due to the factthat TQM and relevant tools are mostly implemented in production areas for qualityimprovement. They do influence the design department, but to a limited extent.Nevertheless, the results imply great usefulness for NPD. It is well known that CE isthe most efficient method of NDP. This research tells us that various quality tools suchas TQM, team, VA and QFD also support NPD. The result further supports theconclusion that there are commonalities between CE and TQM, as shown in Table I.The result also has useful implications for practice and research.
First, a company may not be able to implement all of the methods at once. Thisresearch may suggest a pattern in terms of the adoption/implementation oforganisational practices. It is suggested that a company first implements basicmethods, such as the team approach and the TQM philosophy and then progresses tomore complicated methods like CE and DFMA. Compared with TQM, CE is relativelynew, and companies have limited experiences with it. This is especially true for thosecompanies in developing countries. Since the basic managerial principles andphilosophy are the same, the experience of implementing TQM can be used in CEimplementation. The major issues surrounding TQM implementation, such as culturalchanges, learning-curve effects, change management and team building, are all thesame to CE implementation.
Second, the result is useful to original engineering manufacturing (OEM) companiestransferring from OEM to original design manufacturing/original brandmanufacturing (ODM/OMB). These companies worry that they do not have enoughresources and expertise when it comes to implementing CE for NPD. This projectreveals that if companies have implemented TQM and employed other quality tools,
TQM21,6
584
they should have a good basis for speeding up NPD as well. This is especially usefulfor most Hong Kong and Chinese companies, which are mostly OEM-based and areeager to increase their NPD capability.
Finally, it must be pointed out that speed is not the only goal of NPD. The speed ofNPD development may not guarantee the quality of the NPD. In fact, Lukas and Menon(2004) found that NPD that is too slow or too rapid leads to quality problems in the newproduct. Wheelwright and Clark (1992) suggested that NPD should aim for speed,efficiency and quality. Langerak et al. (1999) suggested that NPD is a trade-off processin which time-to-market, quality, cost and customer value should all be considered.There is a new tendency to incorporate quality improvement into NPD, asdemonstrated by the new trend of transferring from Six Sigma for qualityimprovement to Design for Six Sigma. “Design the quality into products” has becomethe new slogan in NPD, as well as in quality management. However, TQM philosophyand tools have not been studied enough in the context of NPD. Bellary and Murthy(1999) tried to link TQM and NPD in a conceptual model. However, the empiricalresearch linking quality and NPD is not substantial. This paper will, we hope, triggermore research on the quality management on NPD, visa versa.
References
Abdul-Rahman, H., Kwan, C.L. and Woods, P.C. (1999), “Quality function deployment inconstruction design: application in low-cost housing design”, International Journal ofQuality & Reliability Management, Vol. 16 No. 6, pp. 591-605.
Ali, A. (2000), “The impact of innovativeness and development time on new product performancefor small firms”, Marketing Letters, Vol. 11 No. 2, pp. 151-63.
Balachandra, R. and Friar, J.H. (1997), “Factors for success in R&D projects and new productinnovation: a contextual framework”, IEEE Transactions on Engineering Management,Vol. 44, pp. 276-87.
Bellary, A. and Murthy, D.N.P. (1999), “New product development process and total qualitymanagement”, Proceedings of the PICMET 99. Portland International Conference onTechnology and Innovation Management, Vol. 1, 25-29 July, p. 329.
Bullinger, H.J. and Warschat, J. (1995), Concurrent Engineering Systems, The Way to SuccesfulProduct Development, Springer-Verlag, Berlin.
Caffyn, S. and Grantham, A. (2003), “Fostering continuous improvement within new productdevelopment processes”, International Journal of Technology Management, Vol. 26 No. 8,pp. 843-78.
Cooper, R.G. (1999), “From experience: the invisible success factors in product innovation”,Journal of Product Innovation Management, Vol. 16 No. 2, pp. 115-33.
Cooper, R.G. and Kleinschmidt, E.J. (1995), “Benchmarking the firms critical success factors innew project development”, Journal of Product Innovation Management, Vol. 12 No. 5,pp. 374-91.
Dayan, M. and Benedetto, C.A.D. (2009), “Antecedents and consequences of teamwork quality innew product development projects – an empirical investigation”, European Journal ofInnovation Management, Vol. 12 No. 1, pp. 129-55.
DellIsola, A. (1997), Value Engineering: Practical Applications – For Design, Construction,Maintenance & Operations, R.S. Means Company Publisher, Kingston, MA.
Qualitymanagement
and NPD
585
Dooley, K. and Johnson, D. (2001), “Changing the new product development process –reengineering or continuous quality improvement”, Measuring Business Excellence, Vol. 5No. 4, pp. 32-8.
Droge, C., Jayaram, J. and Vickery, S.K. (2000), “The ability to minimize the timing of newproduct development and introduction: an examination of antecedent factors in the NorthAmerican automobile supplier industry”, Journal of Product Innovation Management,Vol. 17, pp. 24-40.
Fowler, T.C. (1990), Value Analysis in Design, Van Nostrand Reinhold, New York, NY.
Fujimoto, T. (2000), “Shortening lead time through early problem-solving – a new round ofcapacity-building competition in the auto industry”, in Jurgen, U. (Ed.), New ProductDevelopment and Production Networks, Springer, Berlin.
Funk, J. (1992), The Teamwork Advantage: An Inside Look at Japanese Product and TechnologyDevelopment, Productivity Press, Cambridge, MA.
Gonzales, F.J.M. and Palacios, T.M.B. (2002), “The effect of new product development techniqueson new product success in Spanish firms”, Industrial Marketing Management, Vol. 31No. 4, pp. 305-15.
Gupta, A.K., Brockhoff, K. and Weisenfeild, U. (1992), “Making trade-offs in new productdevelopment process: a German/US comparison”, Journal of Product InnovationManagement, Vol. 9 No. 1, pp. 11-18.
Harding, J.A., Omar, A.R. and Popplewell, K. (1999), “Applications of QFD within a concurrentengineering environment”, International Journal of Agile Management Systems, Vol. 1No. 2, p. 88.
Henke, J.W., Karchenberg, A.R. and Lyons, T.F. (1993), “Perspective: cross-functional teams;good concept, poor implementation!”, Journal of Product Innovation Management, Vol. 10,pp. 216-29.
Karbhari, V.M. (1994), “Total quality design: an approach for customer satisfaction in criticaladvanced technologies”, Benchmarking for Quality Management & Technology, Vol. 1No. 1, pp. 5-8.
Kate, L.G. and William, R. (1999), “Key factors in increasing speed to market and improving newproduct success rates”, Industrial Marketing Management, Vol. 28, pp. 319-26.
King, R. (1989), Better Design in Half the Time, Methuen, Cambridge, MA.
Kinna, R. (1995), “Teamworking and concurrent engineering – a success story”, World ClassDesign to Manufacture, Vol. 2 No. 3, pp. 5-9.
Koufteros, X. (1995), “Time-based competition: developing a nomological network of constructsand instrument development”, dissertation, The University of Toledo, Toledo, OH.
Langerak, F. and Hultink, E.J. (2008), “The effect of new product development accelerationapproaches on development speed: a case study”, Journal of Engineering and TechnologyManagement, Vol. 25, pp. 157-67.
Langerak, F., Peelen, E. and Nijssen, E. (1999), “A laddering approach to the use of methods andtechniques to reduce the cycle time of new-to-the-firm products”, The Journal of ProductInnovation Management, Vol. 16 No. 2, pp. 173-83.
Lester, D.H. (1998), “Critical success factors for new product development”, Research TechnologyManagement, Vol. 41 No. 1, pp. 36-43.
Lindberg, P., Voss, C. and Blackmon, K. (Eds.) (1998), International Manufacturing Strategies:Context, Content and Changes, Kluwer Academic Press, Kingston upon Thames.
TQM21,6
586
Lockamy, A. and Khurana, A. (1995), “Quality function deployment: total quality managementfor new product design”, International Journal of Quality & Reliability Management, Vol. 12No. 6, pp. 73-84.
Lukas, B.A. and Menon, A. (2004), “New product quality: intended and unintended consequencesof new product development speed”, Journal of Business Research, Vol. 57 No. 11, p. 1258.
Lynn, G.S., Abel, K.D., Valentine, W.S. and Wright, R.C. (1999), “Key Factors in increasing speedto market and improving new product success rates”, Industrial Marketing Management,Vol. 28, pp. 320-9.
Masaak, I. (1986), Kaizen: The Key to Japanese Competitive Success, Random House, New York,NY.
Miguel, P.A.C. (2007), “Innovative new product development: a study of selected QFD casestudies”, The TQM Magazine, Vol. 19 No. 6, pp. 617-25.
Millson, M.R., Raj, S.P. and Wilemon, D. (1992), “A survey of major approaches for acceleratingnew product development”, Journal of Product Innovation Management, Vol. 9, pp. 53-63.
Montoya-Weiss, M.M. and Calantone, R. (1994), “Determinants of new product performance: areview and meta-analysis”, Journal of Product Innovation Management, Vol. 11,pp. 397-417.
Musselwhite, W.C. (1990), “Time-base innovation: the new competitive advantage”, Training andDevelopment Journal, Vol. 44 No. 1, pp. 53-6.
Nijssen, E.J., Arbouw, A.R.L. and Commandeur, H.R. (1995), “Accelerating new productdevelopment: a preliminary empirical test of a hierarchy of implementation”, Journal ofProduct Innovation Management, Vol. 12 No. 2, pp. 99-109.
Pfeifer, T. (2002), Quality Management – Strategies, Methods, Techniques, Hanser, Munchen.
Poolton, J. and Barclay, I. (1998), “New product development from past research to futureapplications”, Industrial Marketing Management, Vol. 27, pp. 197-212.
Prasad, B. (1998), “A method for measuring total value towards designing goods and services”,The TQM Magazine, Vol. 10 No. 4, pp. 258-75.
Sirvanci, M.B. and Durmaz, M. (1994), “Cycle-time and cost improvement by designedexperiments”, The International Journal of Quality & Reliability Management, Vol. 11 No. 6,pp. 21-6.
Song, X.M. and Montoya-Weiss, M.M. (1998), “Critical development activities for really newversus incremental products”, The Journal of Product Innovation Management, Vol. 15No. 2, pp. 124-35.
Spivey, W.A., Munson, J.M. and Wolcott, J.H. (1997), “Improving the new product developmentprocess: a fractal paradigm for high-technology products”, Journal of Product InnovationManagement, Vol. 14 No. 3, pp. 203-18.
Tsai, Y.C., Chin, K.S. and Yang, J.B. (2002), “A hybrid QFD framework for new productdevelopment”, The Asian Journal on Quality, Vol. 3 No. 2, pp. 138-58.
Wheelwright, S.C. and Clark, K.B. (1992), Revolutionizing Product Development: Quantum Leapsin Speed, Efficiency, and Quality, Free Press, New York, NY.
Wu, P. and Grady, P. (1999), “A concurrent engineering approach to design for assembly”,Concurrent Engineering, Vol. 7 No. 3, pp. 231-43.
Yam, C.M.R., Chin, K.S. and Tang, P.Y. (1996), “New product development strategies for HongKong manufacturing industries”, The International Journal of Human Factors inManufacturing, Vol. 6 No. 3, pp. 233-41.
Qualitymanagement
and NPD
587
Zairi, M. and Youssef, M.A. (1995), “Quality function deployment: a main pillar for successfultotal quality management and product development”, International Journal of Quality &Reliability Management, Vol. 12 No. 6, pp. 9-23.
Further reading
Hair, J.F., Anderson, R.E., Tatham, R.L. and Black, W.C. (1988), Multivariate Data Analysis,Prentice Hall, Englewood Cliffs, NJ.
Kochan, T.A. (1988), “On the human side of technology”, ICL Technical Journal, Vol. 6,pp. 391-400.
About the authorsHongyi Sun is an Associate Professor in the Department of Manufacturing Engineering andEngineering Management, City University of Hong Kong. Dr Sun’s research and teachinginterests include quality management, management of technological innovation andentrepreneurship and manufacturing strategy. Hongyi Sun can be contacted at:[email protected]
Yangyang Zhao is a Research Assistant in the Department of Manufacturing Engineeringand Engineering Management, City University of Hong Kong. She is interested in managementof technology and innovation.
Hon Keung Yau is an Instructor at the Department of Manufacturing Engineering andEngineering Management, City University of Hong Kong. Dr Yau’s research interests includequality management and organisational learning.
TQM21,6
588
To purchase reprints of this article please e-mail: [email protected] visit our web site for further details: www.emeraldinsight.com/reprints
A proposed framework forcombining ISO 9001 qualitysystem and quality function
deploymentPaulo A. Cauchick Miguel
Universidade Nove de Julho – Uninove, Sao Paulo, Brazil, and
Jose Celso Sobreiro DiasFundacao de Ensino Octavio Bastos, Sao Paulo, Brazil
Abstract
Purpose – ISO 9001 certification assures that a company employs a quality system, which providestrust for the customers but this system does not assure the quality of the products. It is then necessaryto apply other methods and tools to achieve the demanded quality. This paper aims to propose aframework for combining ISO 9001 requirements with quality function deployment (QFD).
Design/methodology/approach – A theoretical framework is developed followed by an empiricalapplication. The framework consists of three components: quality assurance items, critical operationalfunctions, and requirements of the ISO 9001: 2000 quality management system. The framework is thenapplied in a company that produces surge arresters.
Findings – Main results indicate that the proposed framework may assist in developing productsand prioritising quality assurance items, critical operational functions, and ISO 9001: 2000requirements. The empirical application provided an effective case of QFD full usage. In addition, theapplication was useful to the company not only for achieving a better organizational quality structure,but also for recording company knowledge through QFD.
Research limitations/implications – For more extensive empirical validation further replicationsamong other samples are needed for external validation of the findings.
Originality/value – Although QFD is extensively explored in the literature, this paper is one of thefew published studies that report and discuss the use of QFD with ISO 9001. In addition, the proposedframework may be useful for practitioners and academics, who deal with the subject of quality.
Keywords ISO 9000 series, Quality function deployment, Quality systems, Product development
Paper type Research paper
1. IntroductionThe contribution of QFD to new product development activities has been pointed out byseveral authors in recent years. Since its creation in the 1960 s, numerous successfulapplications have been reported in a wide range of industries. A comprehensive review ofsuch applications can be found in Chan and Wu (2002). Nevertheless, to achieve product
The current issue and full text archive of this journal is available at
www.emeraldinsight.com/1754-2731.htm
The authors acknowledge the cooperation of the company where the study was conducted.Nevertheless, this paper reflects only the view of the authors, not the official view of thecompany. The authors also wish to express their gratitude to the referees who did contribute tothe improvement of this article as well as to Ms Ann Puntch for English revision. One of theauthors is also affiliated to the Production Engineering Department of the Polytechnic Schoolfrom the University of Sao Paulo – USP and this institution should also be acknowledged.
Combining ISO9001 quality
system and QFD
589
The TQM JournalVol. 21 No. 6, 2009
pp. 589-606q Emerald Group Publishing Limited
1754-2731DOI 10.1108/17542730910995864
quality, QFD alone might not be enough. In order to obtain design quality, qualityassurance must be in place and purposeful quality control points established to assuredesign requirements. Additionally, a documentation system and a quality assurancestructure should also exist in order to actually establish processes, procedures andmanagement resources. These are necessary to implement quality assurance and control.
Quality assurance has evolved over recent decades. It began in order to correctdefects in products and then to prevent defective products being made in the first place,especially in the quality assurance activities for machinery (Ozawa, 1998). Later on, theestablishment of a quality assurance system was needed for standardization, whichserves not only to prevent the recurrence of trouble in production but also to permitcomplete control of the process. This process is accomplished by the use of standards.They are a kind of guarantee concerning job performance, control methods andprocedures, materials, quality of parts, technical specifications, production andinspection guidelines (Ozawa, 1998).
To cover that, the ISO 9001 standard checks whether a company has a qualityassurance system in place and, if so, a certificate of compliance may be issued by acertification body.
One of the principal criticisms of the ISO 9001 standard is that certification itselfdoes not assure product quality. In fact, the certification process is an assessment of the“quality of operations”. If operations were well established by effective procedures anddocumentation, the quality of the output (product) would be a consequence. Therefore,certification of the quality management system is a necessary condition to achieveproduct quality, but it is not sufficient. In this sense, the ISO 9000 series underwent anoverall review and a new set of standards was issued. This can be considered as anattempt to increase the effectiveness of the standards and the certification process inorder to assure product quality.
In this context, it would be important to have a quality management system whichconsiders the “quality of the product” and “the quality of operations”, as identified byAkao (2001). Such a system considers/has three components: quality assurance items,critical operational functions, and ISO 9000 requirements. It considers the productquality information generated by the application of quality deployment as an input todefine quality assurance items. Further, the critical operational functions can beidentified by using narrowly defined QFD (also called work deployment). Finally, ISO9001 requirements are then introduced to yield a framework by using QFD principles,which are then applied to integrate these components by creating interrelated matrices.This framework establishes a quality management system capable of assuring notonly the quality of the output (product) but also the operations. The main objective ofthis article is to demonstrate this proposal. It considers a quality management systemthat combines ISO 9001 requirements and QFD. The theoretical framework for thisresearch comes from the literature (Akao and Hattori, 1998; Akao, 2001). The presentproposal may be regarded as an alternative proposal to Akao’s. One of the mainoutputs of this framework is to focus on those ISO 9001 requirements that really affectcustomer requirements. In addition, to illustrate the application of the framework, anempirical application was carried out at a company that produces electronics.
2. Theoretical frameworkThis section highlights the theory behind the development of the presentproposal. It starts with QFD concepts followed by an overview of ISO 9000.
TQM21,6
590
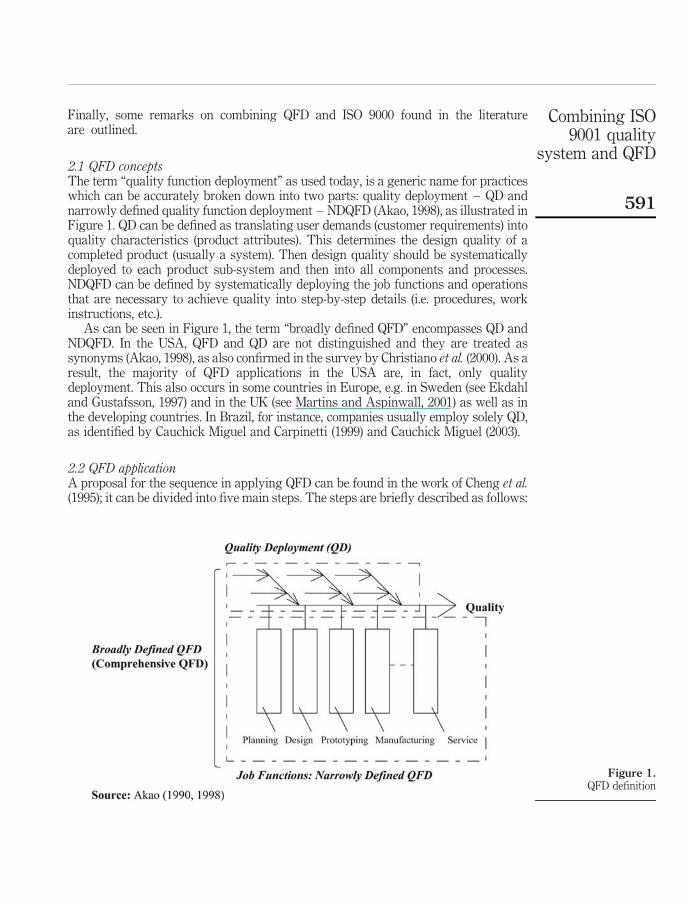
Finally, some remarks on combining QFD and ISO 9000 found in the literatureare outlined.
2.1 QFD conceptsThe term “quality function deployment” as used today, is a generic name for practiceswhich can be accurately broken down into two parts: quality deployment – QD andnarrowly defined quality function deployment – NDQFD (Akao, 1998), as illustrated inFigure 1. QD can be defined as translating user demands (customer requirements) intoquality characteristics (product attributes). This determines the design quality of acompleted product (usually a system). Then design quality should be systematicallydeployed to each product sub-system and then into all components and processes.NDQFD can be defined by systematically deploying the job functions and operationsthat are necessary to achieve quality into step-by-step details (i.e. procedures, workinstructions, etc.).
As can be seen in Figure 1, the term “broadly defined QFD” encompasses QD andNDQFD. In the USA, QFD and QD are not distinguished and they are treated assynonyms (Akao, 1998), as also confirmed in the survey by Christiano et al. (2000). As aresult, the majority of QFD applications in the USA are, in fact, only qualitydeployment. This also occurs in some countries in Europe, e.g. in Sweden (see Ekdahland Gustafsson, 1997) and in the UK (see Martins and Aspinwall, 2001) as well as inthe developing countries. In Brazil, for instance, companies usually employ solely QD,as identified by Cauchick Miguel and Carpinetti (1999) and Cauchick Miguel (2003).
2.2 QFD applicationA proposal for the sequence in applying QFD can be found in the work of Cheng et al.(1995); it can be divided into five main steps. The steps are briefly described as follows:
Figure 1.QFD definition
Combining ISO9001 quality
system and QFD
591
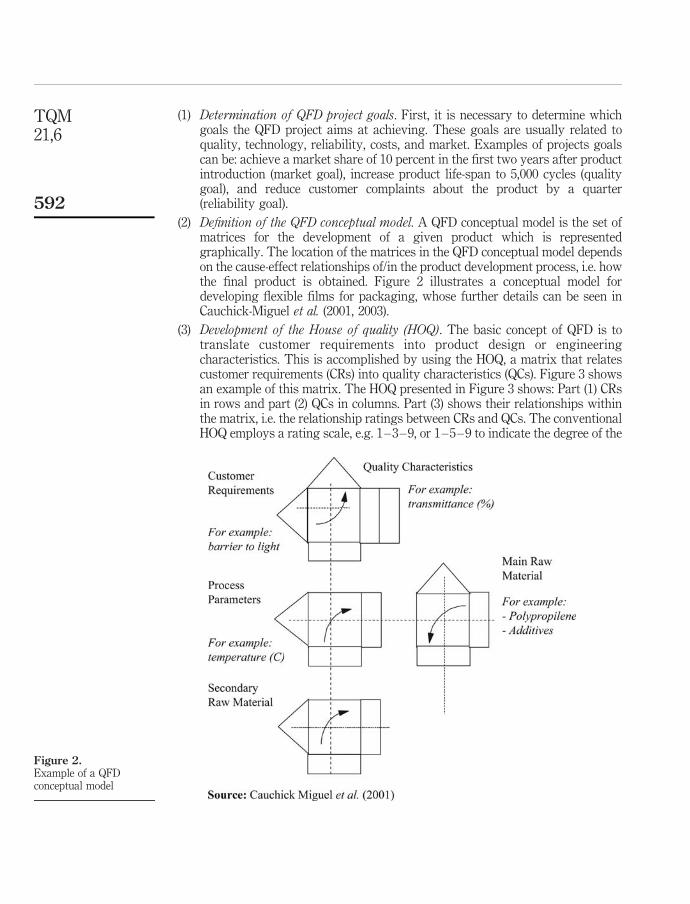
(1) Determination of QFD project goals. First, it is necessary to determine whichgoals the QFD project aims at achieving. These goals are usually related toquality, technology, reliability, costs, and market. Examples of projects goalscan be: achieve a market share of 10 percent in the first two years after productintroduction (market goal), increase product life-span to 5,000 cycles (qualitygoal), and reduce customer complaints about the product by a quarter(reliability goal).
(2) Definition of the QFD conceptual model. A QFD conceptual model is the set ofmatrices for the development of a given product which is representedgraphically. The location of the matrices in the QFD conceptual model dependson the cause-effect relationships of/in the product development process, i.e. howthe final product is obtained. Figure 2 illustrates a conceptual model fordeveloping flexible films for packaging, whose further details can be seen inCauchick-Miguel et al. (2001, 2003).
(3) Development of the House of quality (HOQ). The basic concept of QFD is totranslate customer requirements into product design or engineeringcharacteristics. This is accomplished by using the HOQ, a matrix that relatescustomer requirements (CRs) into quality characteristics (QCs). Figure 3 showsan example of this matrix. The HOQ presented in Figure 3 shows: Part (1) CRsin rows and part (2) QCs in columns. Part (3) shows their relationships withinthe matrix, i.e. the relationship ratings between CRs and QCs. The conventionalHOQ employs a rating scale, e.g. 1–3–9, or 1–5–9 to indicate the degree of the
Figure 2.Example of a QFDconceptual model
TQM21,6
592
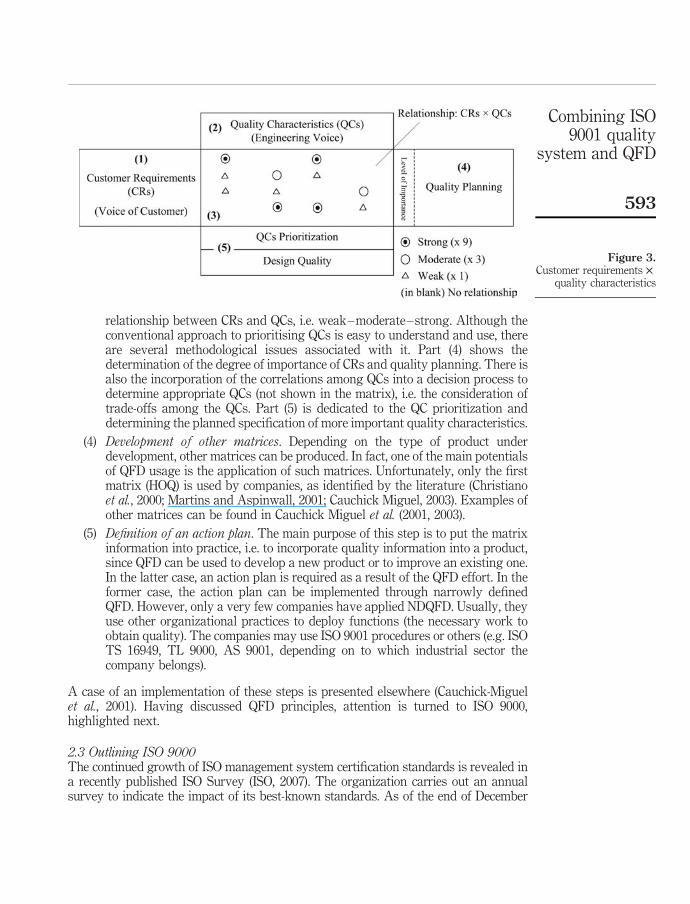
relationship between CRs and QCs, i.e. weak–moderate–strong. Although theconventional approach to prioritising QCs is easy to understand and use, thereare several methodological issues associated with it. Part (4) shows thedetermination of the degree of importance of CRs and quality planning. There isalso the incorporation of the correlations among QCs into a decision process todetermine appropriate QCs (not shown in the matrix), i.e. the consideration oftrade-offs among the QCs. Part (5) is dedicated to the QC prioritization anddetermining the planned specification of more important quality characteristics.
(4) Development of other matrices. Depending on the type of product underdevelopment, other matrices can be produced. In fact, one of the main potentialsof QFD usage is the application of such matrices. Unfortunately, only the firstmatrix (HOQ) is used by companies, as identified by the literature (Christianoet al., 2000; Martins and Aspinwall, 2001; Cauchick Miguel, 2003). Examples ofother matrices can be found in Cauchick Miguel et al. (2001, 2003).
(5) Definition of an action plan. The main purpose of this step is to put the matrixinformation into practice, i.e. to incorporate quality information into a product,since QFD can be used to develop a new product or to improve an existing one.In the latter case, an action plan is required as a result of the QFD effort. In theformer case, the action plan can be implemented through narrowly definedQFD. However, only a very few companies have applied NDQFD. Usually, theyuse other organizational practices to deploy functions (the necessary work toobtain quality). The companies may use ISO 9001 procedures or others (e.g. ISOTS 16949, TL 9000, AS 9001, depending on to which industrial sector thecompany belongs).
A case of an implementation of these steps is presented elsewhere (Cauchick-Miguelet al., 2001). Having discussed QFD principles, attention is turned to ISO 9000,highlighted next.
2.3 Outlining ISO 9000The continued growth of ISO management system certification standards is revealed ina recently published ISO Survey (ISO, 2007). The organization carries out an annualsurvey to indicate the impact of its best-known standards. As of the end of December
Figure 3.Customer requirements £
quality characteristics
Combining ISO9001 quality
system and QFD
593
2007, 951,486 ISO 9001: 2000 certificates had been issued in 175 countries. ISO 9001establishes a quality system as a quality management structure, within whichresponsibilities, procedures, processes and the necessary resources must be defined.Typical ISO 9001 requirements are those usually expressed by elements such asmanagement responsibility, resource management, product and service realization, andmeasurement, analysis and improvement. These ISO 9001 requirements are usuallyimplemented through a quality manual, procedures, work instructions, records, etc. in adocumented quality management system. The quality system is, in fact, theorganizational structure related to quality through which operational (job) functionsand quality assurance can be obtained by implementing ISO 9001 requirements.
A quality system is also defined as a network of operational procedures andcontrols necessary to obtain a product with the required quality (Feigenbaum, 1961). Inanother definition, QFD is a way to systematically communicate the informationrelated to quality and to make explicit the jobs necessary to obtain it (Cheng et al.,1995). The second definition is, in fact, the concept of narrowly defined QFD by Akao(1990). When comparing these two definitions with ISO 9001 requirements, it can beconcluded that they are almost the same, i.e. the ISO 9001 standard considers narrowlydefined QFD, although it does not use this term. Therefore, if the definitions are almostthe same, it would be important to consider quality deployment linked to narrowlydefined QFD, as argued by Akao (2001). In this sense, a combination of QFD and theISO 9001 seems appropriate to obtain a more effective quality management system.
2.4 Combining ISO 9000 and QFDA review of the literature (Dias and Cauchick Miguel, 2001), identified 462 QFD articlespublished in 71 international journals. Articles were divided into three groups:
(1) QFD applications (140);
(2) conceptual (159); and
(3) discussion papers (163).
Not a single article referring to QFD and ISO 9000 was identified. More recently,another literature review was offered by Chan and Wu (2002). In that, 647 referenceswere listed and an analysis done by authors (Chan and Wu, 2002) showed ninefunctional fields of QFD, seven applied industries, and an additional section about QFDmethodological development. Within the “quality management” session only onecitation relating QFD and ISO 9000 was found (Kanji, 1998), demonstrating that thiskind of study is not common. Even the work of Kanji (1998) was superficial and, in fact,did not present a strong relationship (or combination) between ISO 9001 and QFD. Oneof the first publications that attempted to relate QFD to a quality management systemmore effectively was provided by Akao and Hattori (1998). These initiatives areoutlined in the next section.
3. Research backgroundAkao and Hattori (1998) first proposed a framework that combined QFD with a qualitysystem. This was later improved further and presented by Akao (2001). Figure 4 showsAkao’s proposal for establishing a quality system based on ISO 9001 and QFD. Theright-hand side of Figure 4 shows a series of matrices, which consist of therelationships among operational functions, quality elements, demanded quality, and
TQM21,6
594
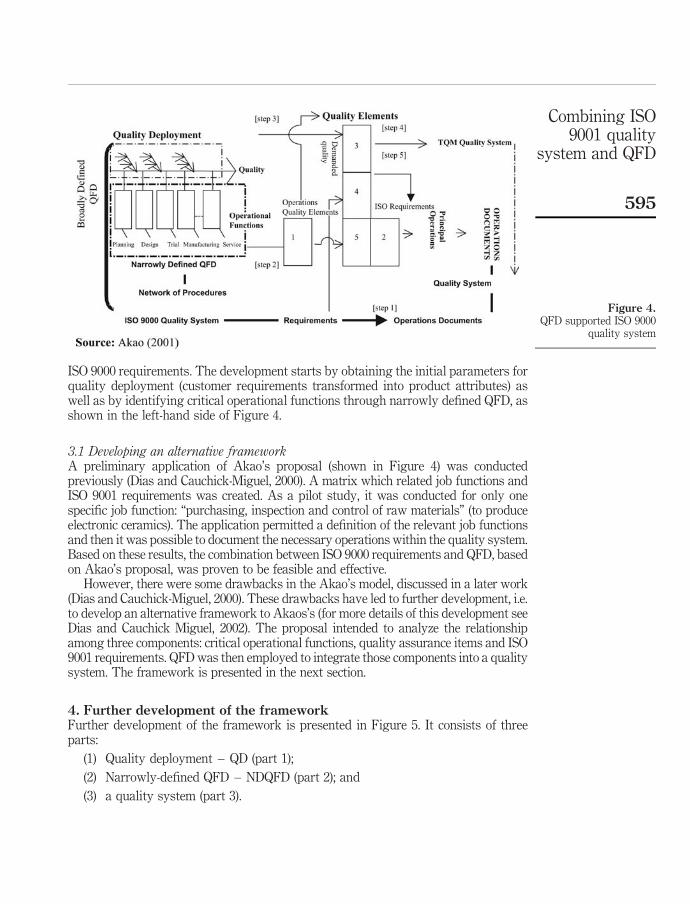
ISO 9000 requirements. The development starts by obtaining the initial parameters forquality deployment (customer requirements transformed into product attributes) aswell as by identifying critical operational functions through narrowly defined QFD, asshown in the left-hand side of Figure 4.
3.1 Developing an alternative frameworkA preliminary application of Akao’s proposal (shown in Figure 4) was conductedpreviously (Dias and Cauchick-Miguel, 2000). A matrix which related job functions andISO 9001 requirements was created. As a pilot study, it was conducted for only onespecific job function: “purchasing, inspection and control of raw materials” (to produceelectronic ceramics). The application permitted a definition of the relevant job functionsand then it was possible to document the necessary operations within the quality system.Based on these results, the combination between ISO 9000 requirements and QFD, basedon Akao’s proposal, was proven to be feasible and effective.
However, there were some drawbacks in the Akao’s model, discussed in a later work(Dias and Cauchick-Miguel, 2000). These drawbacks have led to further development, i.e.to develop an alternative framework to Akaos’s (for more details of this development seeDias and Cauchick Miguel, 2002). The proposal intended to analyze the relationshipamong three components: critical operational functions, quality assurance items and ISO9001 requirements. QFD was then employed to integrate those components into a qualitysystem. The framework is presented in the next section.
4. Further development of the frameworkFurther development of the framework is presented in Figure 5. It consists of threeparts:
(1) Quality deployment – QD (part 1);
(2) Narrowly-defined QFD – NDQFD (part 2); and
(3) a quality system (part 3).
Figure 4.QFD supported ISO 9000
quality system
Combining ISO9001 quality
system and QFD
595
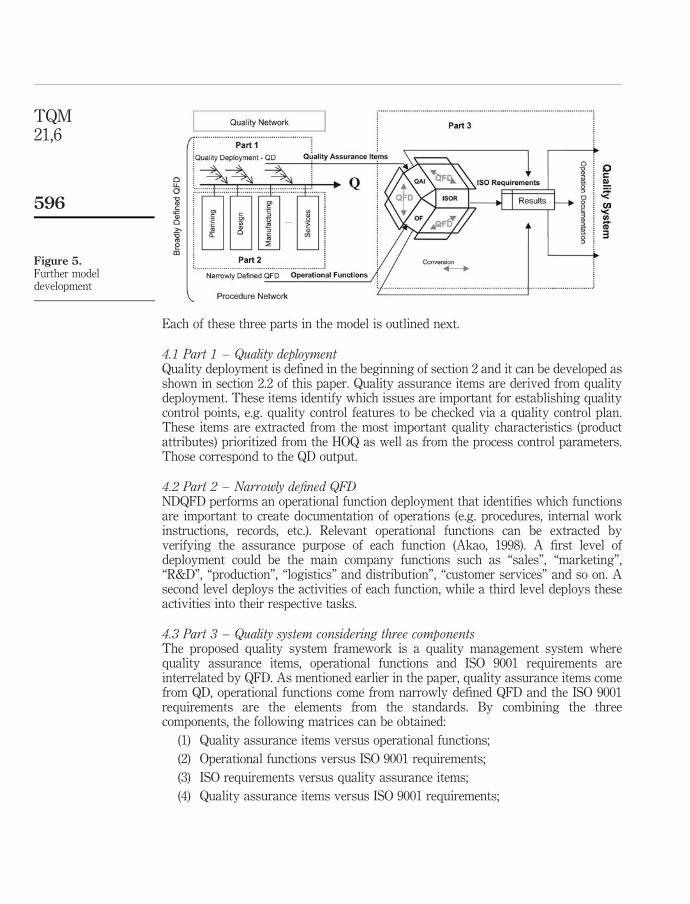
Each of these three parts in the model is outlined next.
4.1 Part 1 – Quality deploymentQuality deployment is defined in the beginning of section 2 and it can be developed asshown in section 2.2 of this paper. Quality assurance items are derived from qualitydeployment. These items identify which issues are important for establishing qualitycontrol points, e.g. quality control features to be checked via a quality control plan.These items are extracted from the most important quality characteristics (productattributes) prioritized from the HOQ as well as from the process control parameters.Those correspond to the QD output.
4.2 Part 2 – Narrowly defined QFDNDQFD performs an operational function deployment that identifies which functionsare important to create documentation of operations (e.g. procedures, internal workinstructions, records, etc.). Relevant operational functions can be extracted byverifying the assurance purpose of each function (Akao, 1998). A first level ofdeployment could be the main company functions such as “sales”, “marketing”,“R&D”, “production”, “logistics” and distribution”, “customer services” and so on. Asecond level deploys the activities of each function, while a third level deploys theseactivities into their respective tasks.
4.3 Part 3 – Quality system considering three componentsThe proposed quality system framework is a quality management system wherequality assurance items, operational functions and ISO 9001 requirements areinterrelated by QFD. As mentioned earlier in the paper, quality assurance items comefrom QD, operational functions come from narrowly defined QFD and the ISO 9001requirements are the elements from the standards. By combining the threecomponents, the following matrices can be obtained:
(1) Quality assurance items versus operational functions;
(2) Operational functions versus ISO 9001 requirements;
(3) ISO requirements versus quality assurance items;
(4) Quality assurance items versus ISO 9001 requirements;
Figure 5.Further modeldevelopment
TQM21,6
596
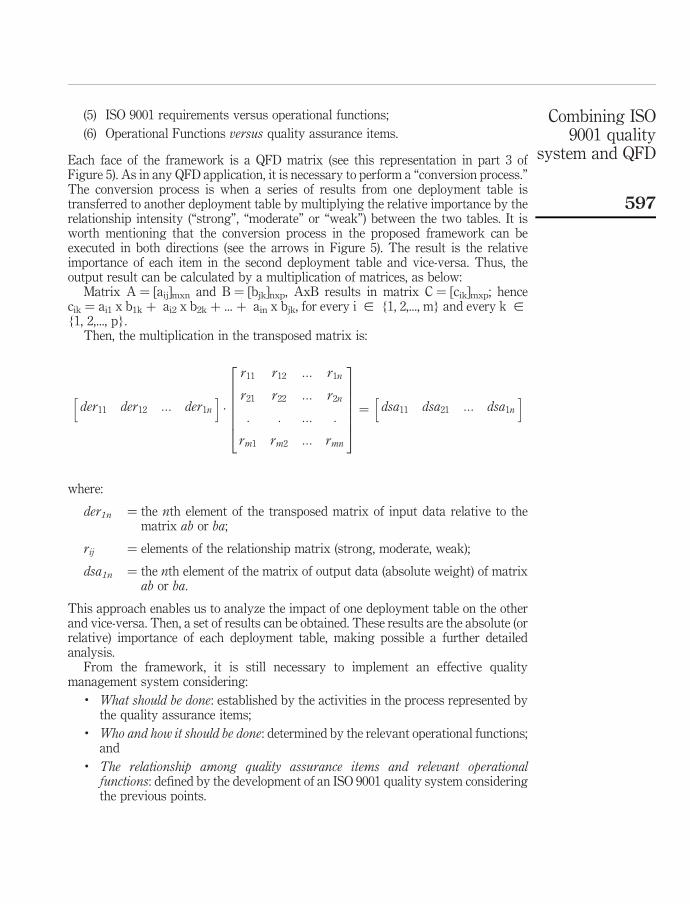
(5) ISO 9001 requirements versus operational functions;
(6) Operational Functions versus quality assurance items.
Each face of the framework is a QFD matrix (see this representation in part 3 ofFigure 5). As in any QFD application, it is necessary to perform a “conversion process.”The conversion process is when a series of results from one deployment table istransferred to another deployment table by multiplying the relative importance by therelationship intensity (“strong”, “moderate” or “weak”) between the two tables. It isworth mentioning that the conversion process in the proposed framework can beexecuted in both directions (see the arrows in Figure 5). The result is the relativeimportance of each item in the second deployment table and vice-versa. Thus, theoutput result can be calculated by a multiplication of matrices, as below:
Matrix A ¼ [aij]mxn and B ¼ [bjk]nxp, AxB results in matrix C ¼ [cik]mxp; hencecik ¼ ai1 x b1k þ ai2 x b2k þ ... þ ain x bjk, for every i [ {1, 2,..., m} and every k [{1, 2,..., p}.
Then, the multiplication in the transposed matrix is:
der11 der12 ::: der1n
h i·
r11 r12 ::: r1n
r21 r22 ::: r2n
: : ::: :
rm1 rm2 ::: rmn
2666664
3777775¼ dsa11 dsa21 ::: dsa1n
h i
where:
der1n ¼ the nth element of the transposed matrix of input data relative to thematrix ab or ba;
rij ¼ elements of the relationship matrix (strong, moderate, weak);
dsa1n ¼ the nth element of the matrix of output data (absolute weight) of matrixab or ba.
This approach enables us to analyze the impact of one deployment table on the otherand vice-versa. Then, a set of results can be obtained. These results are the absolute (orrelative) importance of each deployment table, making possible a further detailedanalysis.
From the framework, it is still necessary to implement an effective qualitymanagement system considering:
. What should be done: established by the activities in the process represented bythe quality assurance items;
. Who and how it should be done: determined by the relevant operational functions;and
. The relationship among quality assurance items and relevant operationalfunctions: defined by the development of an ISO 9001 quality system consideringthe previous points.
Combining ISO9001 quality
system and QFD
597
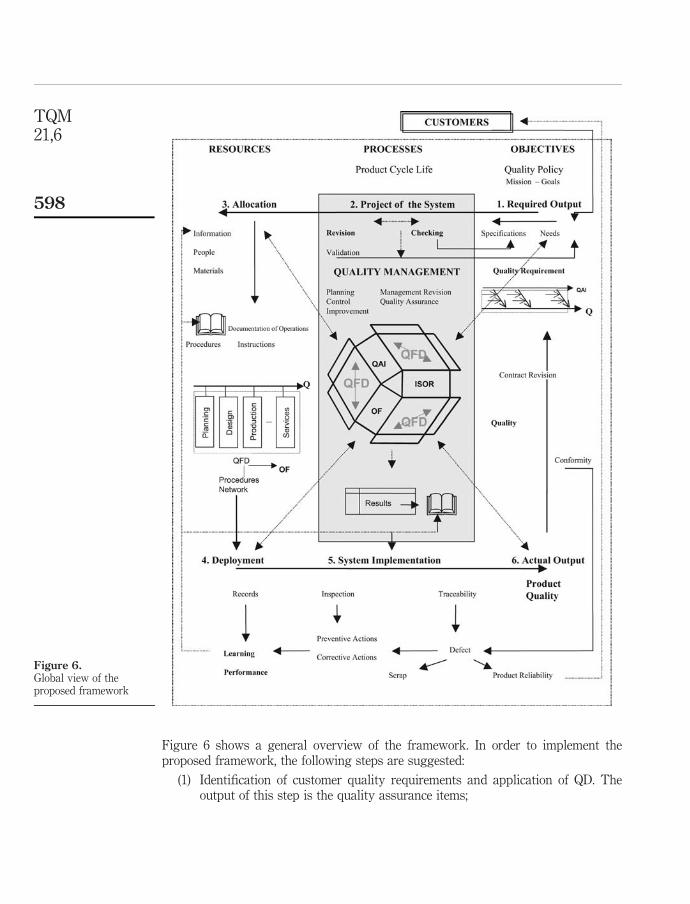
Figure 6 shows a general overview of the framework. In order to implement theproposed framework, the following steps are suggested:
(1) Identification of customer quality requirements and application of QD. Theoutput of this step is the quality assurance items;
Figure 6.Global view of theproposed framework
TQM21,6
598
(2) Design of the quality system considering stakeholder needs. This includes therevisions and validations of the system. The output of this step is thedetermination of procedures, instructions, records, etc., based on ISO 9001requirements;
(3) Allocation of the necessary resources to establish the relevant operationalfunctions, either for the administrative or production processes. The output ofthis step is the operational function deployment (application of narrowlydefined QFD);
(4) Establish the relationship among quality assurance items (output of step (1)),ISO 9001 organizational procedures (output of step (2)), and relevantoperational functions (output of step (3)). The output of step (4) is therelationship among the components aiming at reviewing the procedures and/orestablishing new ones;
(5) Compare product quality with the objectives, to determine whether customerneeds have been met, and assess their satisfaction. Corrective actions are takenas needed. A final process analysis will allow establishing preventive actions toassure product quality and reliability.
Having presented the framework, its application to developing surge arresters ispresented in the following section.
5. Application of the modelThis work was conducted in a small-sized electronic company with annual revenue ofUS$ 1.2 million that employs about 100 people. The technology in electronic ceramics isprovided by a research centre in France. The main component of electronic ceramics isnon-linear resistors (called varistors) used for absorbing atmospheric discharges.Typical products are surge arrestors suitable for overvoltage protection of electricaldistribution networks, substations, catenaries, and vehicles.
The manufacturing processes demands rigid quality control with rather longmanufacturing lead times, usually involving high production costs. Effectiveinspection of materials is vital. For example, the costs involved in scrapping a batchof parts from the sinterization process can reach over US$ 10 thousand. Figure 7 showsa typical processing scheme for electronic ceramics.
5.1 Part 1 – quality deployment (QD)QD is represented in Figure 8. It was developed by a multidisciplinary team, composedof seven members from the following functional areas:
. quality (2);
. sales (1);
. production (2); and
. company top management (2).
The QD model consists of eight matrices that are successively deployed in order toidentify quality assurance items.
First, the HOQ was developed (customer requirements versus product qualitycharacteristics). Customer requirements were deployed from 31 first-level requirements
Combining ISO9001 quality
system and QFD
599
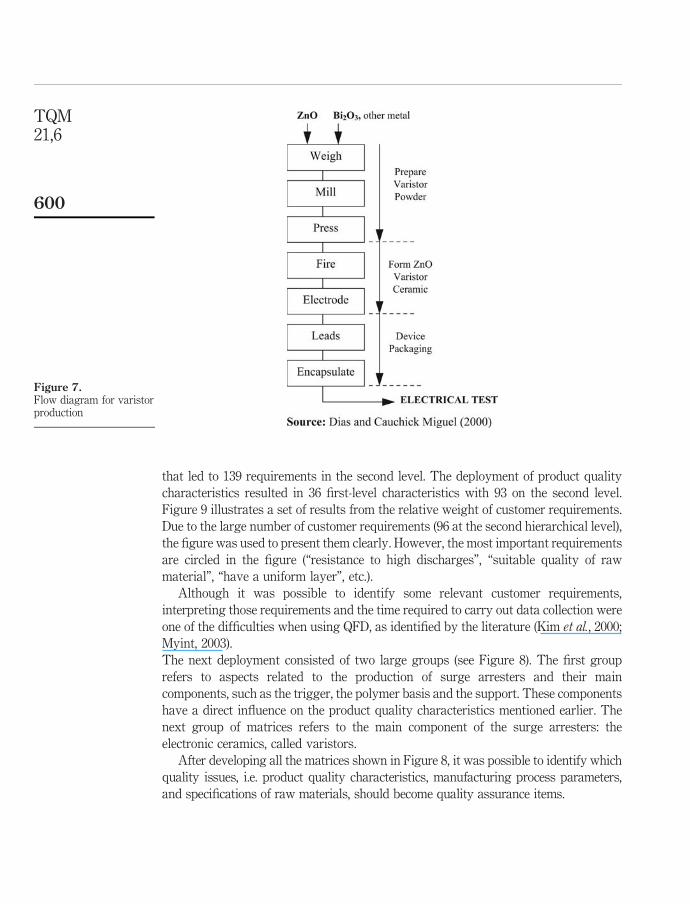
that led to 139 requirements in the second level. The deployment of product quality
characteristics resulted in 36 first-level characteristics with 93 on the second level.
Figure 9 illustrates a set of results from the relative weight of customer requirements.
Due to the large number of customer requirements (96 at the second hierarchical level),
the figure was used to present them clearly. However, the most important requirements
are circled in the figure (“resistance to high discharges”, “suitable quality of raw
material”, “have a uniform layer”, etc.).
Although it was possible to identify some relevant customer requirements,
interpreting those requirements and the time required to carry out data collection were
one of the difficulties when using QFD, as identified by the literature (Kim et al., 2000;
Myint, 2003).
The next deployment consisted of two large groups (see Figure 8). The first group
refers to aspects related to the production of surge arresters and their main
components, such as the trigger, the polymer basis and the support. These components
have a direct influence on the product quality characteristics mentioned earlier. The
next group of matrices refers to the main component of the surge arresters: the
electronic ceramics, called varistors.
After developing all the matrices shown in Figure 8, it was possible to identify which
quality issues, i.e. product quality characteristics, manufacturing process parameters,
and specifications of raw materials, should become quality assurance items.
Figure 7.Flow diagram for varistorproduction
TQM21,6
600
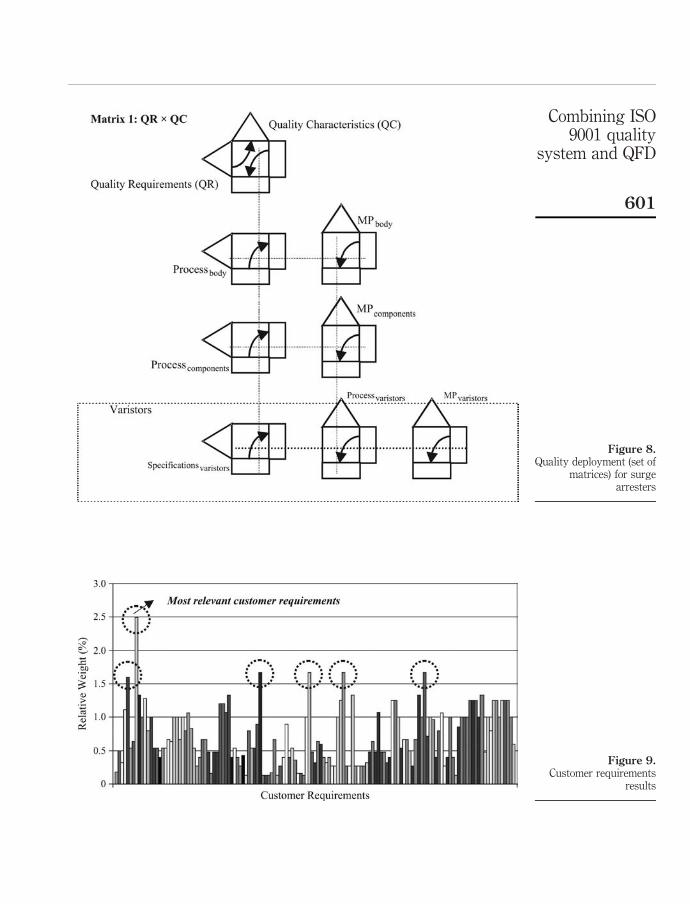
Figure 9.Customer requirements
results
Figure 8.Quality deployment (set of
matrices) for surgearresters
Combining ISO9001 quality
system and QFD
601
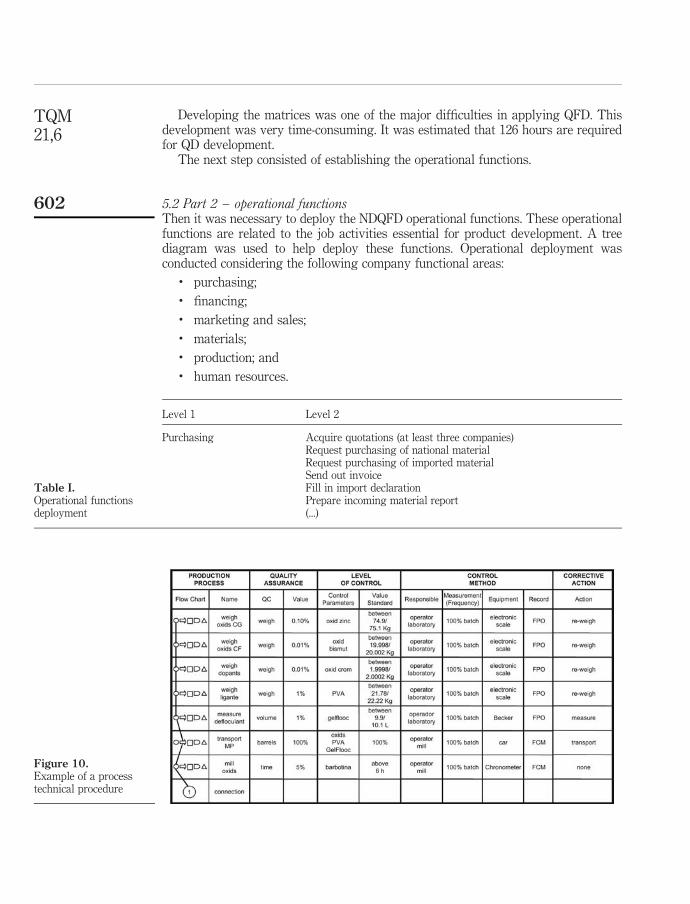
Developing the matrices was one of the major difficulties in applying QFD. Thisdevelopment was very time-consuming. It was estimated that 126 hours are requiredfor QD development.
The next step consisted of establishing the operational functions.
5.2 Part 2 – operational functionsThen it was necessary to deploy the NDQFD operational functions. These operationalfunctions are related to the job activities essential for product development. A treediagram was used to help deploy these functions. Operational deployment wasconducted considering the following company functional areas:
. purchasing;
. financing;
. marketing and sales;
. materials;
. production; and
. human resources.
Level 1 Level 2
Purchasing Acquire quotations (at least three companies)Request purchasing of national materialRequest purchasing of imported materialSend out invoiceFill in import declarationPrepare incoming material report(...)
Table I.Operational functionsdeployment
Figure 10.Example of a processtechnical procedure
TQM21,6
602
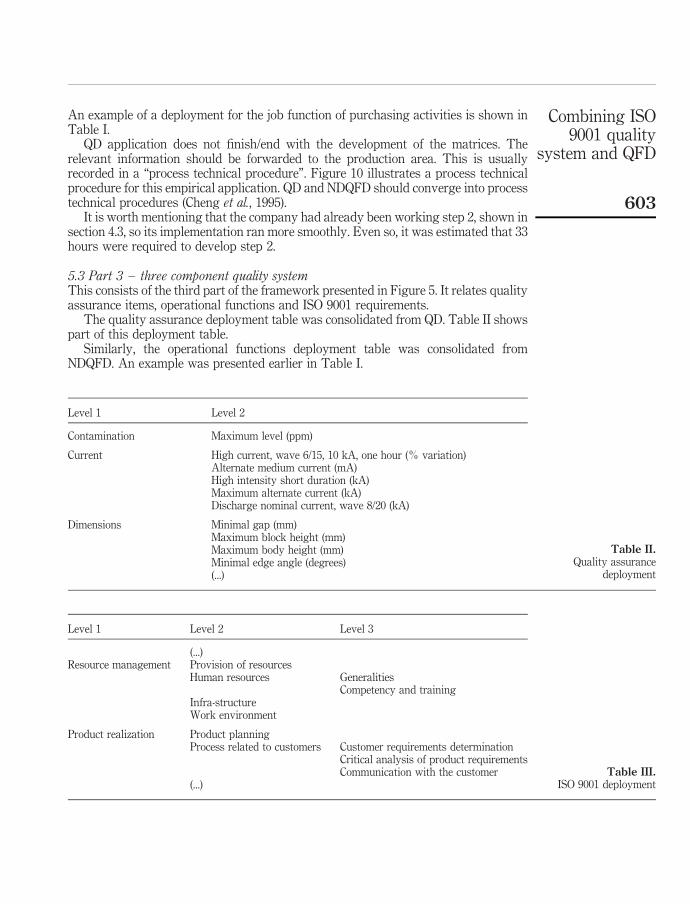
An example of a deployment for the job function of purchasing activities is shown inTable I.
QD application does not finish/end with the development of the matrices. Therelevant information should be forwarded to the production area. This is usuallyrecorded in a “process technical procedure”. Figure 10 illustrates a process technicalprocedure for this empirical application. QD and NDQFD should converge into processtechnical procedures (Cheng et al., 1995).
It is worth mentioning that the company had already been working step 2, shown insection 4.3, so its implementation ran more smoothly. Even so, it was estimated that 33hours were required to develop step 2.
5.3 Part 3 – three component quality systemThis consists of the third part of the framework presented in Figure 5. It relates qualityassurance items, operational functions and ISO 9001 requirements.
The quality assurance deployment table was consolidated from QD. Table II showspart of this deployment table.
Similarly, the operational functions deployment table was consolidated fromNDQFD. An example was presented earlier in Table I.
Level 1 Level 2
Contamination Maximum level (ppm)
Current High current, wave 6/15, 10 kA, one hour (% variation)Alternate medium current (mA)High intensity short duration (kA)Maximum alternate current (kA)Discharge nominal current, wave 8/20 (kA)
Dimensions Minimal gap (mm)Maximum block height (mm)Maximum body height (mm)Minimal edge angle (degrees)(...)
Table II.Quality assurance
deployment
Level 1 Level 2 Level 3
(...)Resource management Provision of resources
Human resources GeneralitiesCompetency and training
Infra-structureWork environment
Product realization Product planningProcess related to customers Customer requirements determination
Critical analysis of product requirementsCommunication with the customer
(...)Table III.
ISO 9001 deployment
Combining ISO9001 quality
system and QFD
603
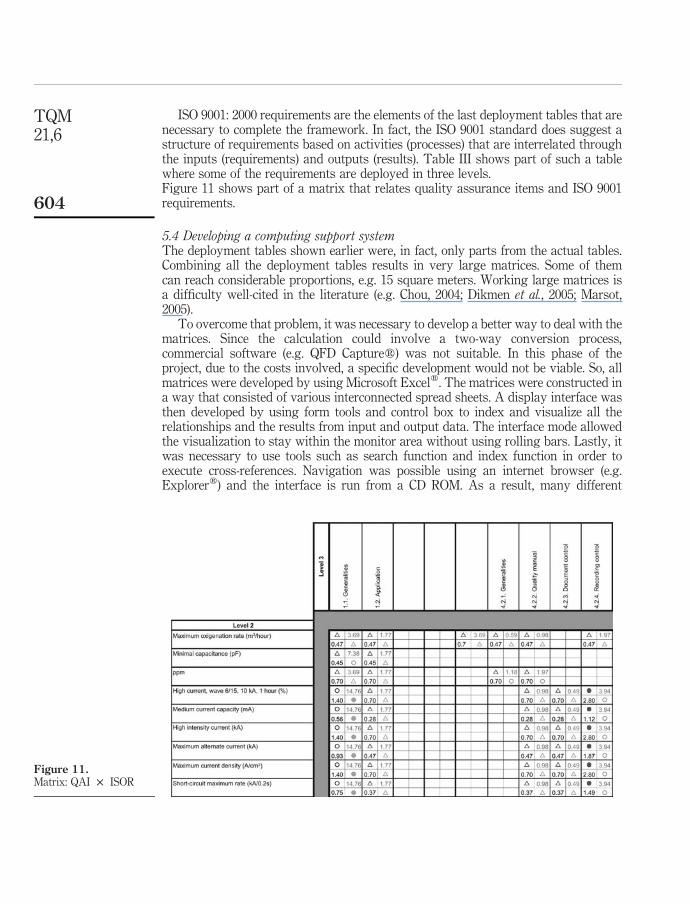
ISO 9001: 2000 requirements are the elements of the last deployment tables that arenecessary to complete the framework. In fact, the ISO 9001 standard does suggest astructure of requirements based on activities (processes) that are interrelated throughthe inputs (requirements) and outputs (results). Table III shows part of such a tablewhere some of the requirements are deployed in three levels.Figure 11 shows part of a matrix that relates quality assurance items and ISO 9001requirements.
5.4 Developing a computing support systemThe deployment tables shown earlier were, in fact, only parts from the actual tables.Combining all the deployment tables results in very large matrices. Some of themcan reach considerable proportions, e.g. 15 square meters. Working large matrices isa difficulty well-cited in the literature (e.g. Chou, 2004; Dikmen et al., 2005; Marsot,2005).
To overcome that problem, it was necessary to develop a better way to deal with thematrices. Since the calculation could involve a two-way conversion process,commercial software (e.g. QFD Capturew) was not suitable. In this phase of theproject, due to the costs involved, a specific development would not be viable. So, allmatrices were developed by using Microsoft Excelw. The matrices were constructed ina way that consisted of various interconnected spread sheets. A display interface wasthen developed by using form tools and control box to index and visualize all therelationships and the results from input and output data. The interface mode allowedthe visualization to stay within the monitor area without using rolling bars. Lastly, itwas necessary to use tools such as search function and index function in order toexecute cross-references. Navigation was possible using an internet browser (e.g.Explorerw) and the interface is run from a CD ROM. As a result, many different
Figure 11.Matrix: QAI £ ISOR
TQM21,6
604
simulations could be performed; a quick result display was possible, including inputand output data, as well as the results of correlation in the matrices. This interface hasproven to be very useful and an effective achievement of the model application. Furtherwork will involve developing a better interface and a possible commercial version.
6. Conclusions and future workCompanies seek to establish an organizational structure that permits output quality tobe obtained. While ISO 9000 certification assures that a company employ a qualitysystem, it does not assure the quality of new products. Besides, companies aiming atachieving quality assurance when developing their product usually apply productdevelopment methods such as QFD. In this sense, this work has demonstrated thedevelopment of a framework by integrating QFD with a quality management system.The model also included a relationship from three components: quality assuranceitems, critical operational functions, and elements of the quality management systembased on ISO 9001: 2000, whose result is a series of interrelated matrices within thistriad. An empirical application of the model was also presented as well as some resultsof its use for developing surge arresters.
Concerning the empirical application, it can be considered as two-fold. On the onehand, it is understood that the application of the framework provided an effective caseof QFD research. On the other hand, it was very useful to the company where theapplication was performed not only with respect to QFD usage but also in terms ofrecording company knowledge that QFD allowed to be explicitly revealed. Of course,the model does suffer from some constraints, but its current version can be consideredsuccessful. It is then understood that other applications are necessary to furtherempirically validate the framework. Future work will concentrate on furtherapplications and enhancement of the framework in addition to the development of aninterface that enables it to display the results in an easier and more user friendly way.
References
Akao, Y. (1990), Quality Function Deployment – QFD – Integrating Customer Requirements intoProduct Design, Productive Press, Portland, OR.
Akao, Y. (1998), Introduction to QFD. Quality Function Deployment Advanced Class, QFDInstitute, Novi, MI.
Akao, Y. (2001), “Quality management system by QFD”, Proceedings of the 7th InternationalSymposium on QFD, Tokyo, pp. 1-6.
Akao, Y. and Hattori, Y. (1998), “Quality system based on ISO 9000 combined with QFD”,Proceedings of the 4th International Symposium on Quality Function Deployment, Sidney,August.
Cauchick Miguel, P.A. (2001), “Pilot project of QFD implementation to develop BOPP flexiblefilms”, CD ROM of the 3rd Brazilian Congress of Product Development Management,Florianopolis, SC, Brazil (in Portuguese).
Cauchick Miguel, P.A. (2003), “The state-of-the-art of the Brazilian QFD applications at the top 500companies”, International Journal of Quality & Reliability Management, Vol. 20 No. 1, pp. 74-89.
Cauchick Miguel, P.A. et al. (2003), “Quality deployment for developing flexible films forpackaging”, Polymers Science and Technology Journal, Vol. 13 No. 2, pp. 87-94.
Combining ISO9001 quality
system and QFD
605
Cauchick Miguel, P.A. and Carpinetti, L.C. (1999), “Some Brazilian experiences on QFDapplication”, Proceedings of the 5th International Symposium on QFD, Belo Horizonte,MG, Brazil, pp. 229-239.
Chan, L.K. and Wu, M.L. (2002), “Quality function deployment: a literature review”, EuropeanJournal of Operational Research, Vol. 143 No. 1, pp. 463-97.
Cheng, L.C. (1995), QFD – Quality Planning, FCO, Belo Horizonte (in Portuguese).
Chou, S.M. (2004), “Evaluating the service quality of undergraduate nursing education in Taiwan– using quality function deployment”, Nurse Education Today, Vol. 24 No. 4, pp. 310-8.
Cristiano, J.J. (2000), “Customer-driven product development through quality functiondeployment in the US and Japan”, Journal of Production Innovation Management,Vol. 17, pp. 286-308.
Dias, J.C.S. (2000), “Inspection and control of raw material applied to electronic ceramics throughthe quality chart”, Transactions of the 6th International Symposium on Quality FunctionDeployment, Novi, MI, pp. 115-128.
Dias, J.C.S. and Cauchick Miguel, P.A. (2001), “QFD: historical profile and applicationchronology”, Product and Production, Vol. 5 No. 2, pp. 25-56 (in Portuguese).
Dias, J.C.S. and Cauchick Miguel, P.A. (2002), “Development of a quality management system byintegrating ISO 9001 and QFD - Part 1: a proposed model”, Proceedings of the 8thInternational QFD Symposium, Munich, September 4-6, pp. 233-244.
Dikmen, I., Birgonul, M.T. and Kiziltas, S. (2005), “Strategic use of quality function deployment(QFD) in the construction industry”, Building and Environment, Vol. 40 No. 2, pp. 245-55.
Ekdahl, F. and Gustafsson, A. (1997), “QFD: the Swedish experience”, Transactions of the 9thSymposium on Quality Function Deployment. Novi, MI, June.
Feigenbaum, A. (1961), Total Quality Control Engineering and Management, McGraw-Hill, NewYork, NY.
ISO (2007), The ISO Survey – 2007, International Organization for Standardization, Geneva.
Kanji, G.K. (1998), “An innovative approach to make ISO 9000 standards more effective”, TotalQuality Management, Vol. 9 No. 1, pp. 67-78.
Kim, S.H., Jang, D.H., Lee, D.H. and Cho, S.H. (2000), “A methodology of constructing a decisionpath for IT investment”, Journal of Strategic Information Systems, Vol. 9 No. 1, pp. 17-38.
Marsot, J. (2005), “QFD: a methodological tool for integration of ergonomics at the design stage”,Applied Ergonomics, Vol. 36 No. 2, pp. 185-92.
Martins, A. and Aspinwall, E. (2001), “Quality function deployment: an empirical study in theUK”, Total Quality Management, Vol. 12 No. 2, pp. 575-88.
Myint, S. (2003), “A framework of an intelligent quality function deployment (IQFD) for discreteassembly environment”, Computers and Industrial Engineering, Vol. 45 No. 2, pp. 269-83.
Ozawa, M. (1998), Total Quality Control and Management – The Japanese Approach, JUSE Press,Tokyo.
Corresponding authorPaulo A. Cauchick Miguel can be contacted at: [email protected]
TQM21,6
606
To purchase reprints of this article please e-mail: [email protected] visit our web site for further details: www.emeraldinsight.com/reprints
Total quality management inIndian industries: relevance,
analysis and directionsRaj Kumar
Mechanical Engineering Department,Shri krishan Institute of Engineering and Technology, Kurukshetra, India, and
Dixit Garg and T.K. GargMechanical Engineering Department, National Institute of Technology,
Kurukshetra, India
Abstract
Purpose – The purpose of this paper is to analyze the various factors important for total qualitymanagement implementation in various manufacturing organizations and to assess their relevance forIndian manufacturing organizations.
Design/methodology/approach – A literature review was conducted for important factors and asurvey approach was used to collect relevant data from industries. Further data were used to establisha model.
Findings – It is shown that customer focus must be the prime objective for various industries toachieve total quality management. All the factors must be used systematically to achieve total qualitymanagement (TQM) and it can be done efficiently by using a model having four phases to implementTQM.
Originality/value – The paper will be useful for manufacturing as well as service industries that arein the starting phase of TQM implementation or have already failed to implement TQM at their works.
Keywords Total quality management, Manufacturing industries, India
Paper type Research paper
1. IntroductionIt is known fact that concept of quality has been around for a very long time, but thestress on the word quality in every aspect of life i.e. in business, service or social lifehas increased in the last few decades. Quality has awakened all the nations, industriesand organizations around the world. The word “quality” means different things todifferent people. The ranges of meanings include that quality is excellence, value,conformance to specifications, conformance to requirements, fitness for use, customersatisfaction, meeting and exceeding customers’ expectations and minimizing the lossimparted to society. Successful companies over the years have not fundamentallyredefined the word quality; they have expanded it to design and service quality.Incorporating the customer’s requirements into the product design and servicesrequires companies to change the way they treat their customers. Companies now needto translate the words and ideas of customers into product and service specifications.
Indian companies are also participating in the quality race, although slowly. Theyare facing a challenge from the multinational companies since the Government of Indiaimplemented the policies of liberalization, privatization and globalization. In the lightof this, the Indian companies are in dire need of new ideas, approaches and techniquesfor attaining a competitive edge
The current issue and full text archive of this journal is available at
www.emeraldinsight.com/1754-2731.htm
TQM in Indianindustries
607
The TQM JournalVol. 21 No. 6, 2009
pp. 607-622q Emerald Group Publishing Limited
1754-2731DOI 10.1108/17542730910995873
Many organizations have started realizing the importance of total qualitymanagement (TQM) and new quality system improvement standards (Dalu, 2000).Meeting the customer requirements is the measurement standard and continuousimprovement of work process is the method of meeting the competition. A focus isneeded on analyzing various techniques and strategies to be adopted by the Indiancompanies. This paper examines the way the Indian Industries understand the totalQuality Management approach. Further, a survey helps to point out the importantfactors for TQM implementation in Indian industries and their relation with customersatisfaction. The paper also reveals the prescriptive model for TQM implementation.
2. Review of literatureTotal quality management is considered by many as an important quality andbusiness performance improvement tool. The popularity of concept has led to anexplosion of TQM-related literature. There is enormous amount of literature relatingto Total Quality Management from innumerable researchers and practitioners. Aninclusive review of this literature helps to differentiate the literature in fourcategories like conceptual articles, survey articles, case studies and empirical ormodelling work.
Over the past few years a number of studies have been reported in literature, whichhave examined and compared quality management practices in different countriesaround the world and use suitable concept in some industries. Some of the widely citedcase studies include Dalu et al. (2000); Kannan et al. (2002); Baisya et al. (2004). All thesestudies belong to industrial sectors like automobile, electronics, textile industries etc.
A number of surveys has been conducted by various authors in the field of qualitymanagement considering various techniques of quality management. Some widelycited surveys include Chaudhry et al. (2000); Murthy and Shrivastav (2000); Robinson(2001); Khond and Dabade (2004); Antony et al. (2004).
Ho et al. (2001); Mehra et al. (2001); Taylor et al. (2003); Lai et al. (2003); Khanna et al.(2002); Heizer et al. (2004); Shrivastava et al. (2004); Mohanty et al. (2006); andDahlgaard and Dahlgaard (2006); and conducted empirical studies with variousobjectives like implementation of TQM in less and more experienced firms of US,various critical factors affecting total quality management at the business unit level,literature available on total quality management and using the literature search, fieldexpert, identifies the future role of TQM in businesses facing global markets. Authorsalso provided various models and checked their validity in the scenario of TQM. Intotal, 30 important factors were founded by researchers, which were further dividedinto ten main factors for detailed study:
(1) Customers’ satisfaction;
(2) Managements’ effective participation;
(3) Employees’ effective participation;
(4) Reward schemes;
(5) Communication system;
(6) Vendors’ power;
(7) Statistical quality control;
(8) Fast result techniques;
TQM21,6
608
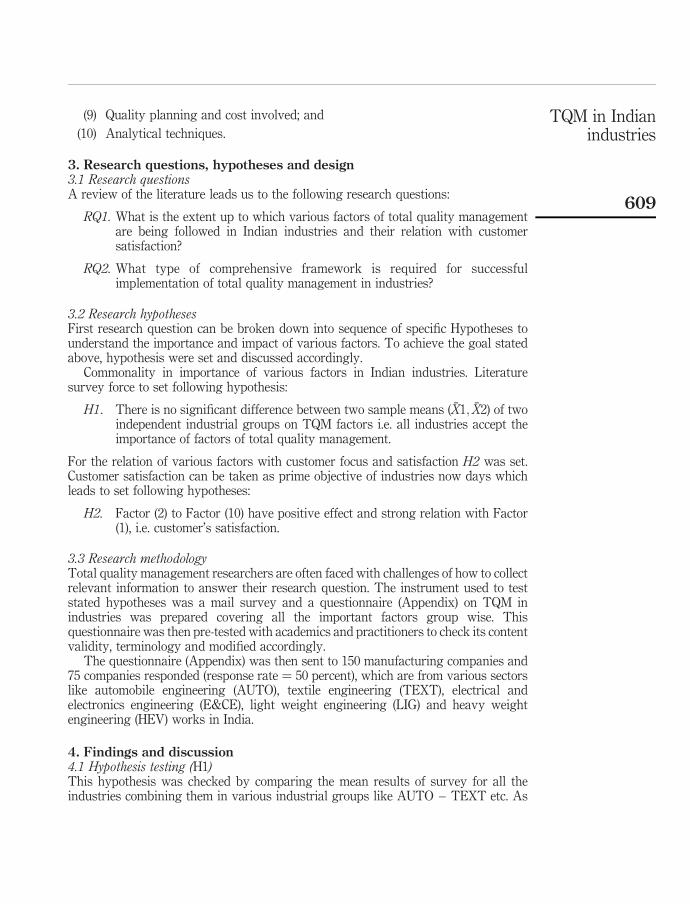
(9) Quality planning and cost involved; and
(10) Analytical techniques.
3. Research questions, hypotheses and design3.1 Research questionsA review of the literature leads us to the following research questions:
RQ1. What is the extent up to which various factors of total quality managementare being followed in Indian industries and their relation with customersatisfaction?
RQ2. What type of comprehensive framework is required for successfulimplementation of total quality management in industries?
3.2 Research hypothesesFirst research question can be broken down into sequence of specific Hypotheses tounderstand the importance and impact of various factors. To achieve the goal statedabove, hypothesis were set and discussed accordingly.
Commonality in importance of various factors in Indian industries. Literaturesurvey force to set following hypothesis:
H1. There is no significant difference between two sample means ( �X1; �X2) of twoindependent industrial groups on TQM factors i.e. all industries accept theimportance of factors of total quality management.
For the relation of various factors with customer focus and satisfaction H2 was set.Customer satisfaction can be taken as prime objective of industries now days whichleads to set following hypotheses:
H2. Factor (2) to Factor (10) have positive effect and strong relation with Factor(1), i.e. customer’s satisfaction.
3.3 Research methodologyTotal quality management researchers are often faced with challenges of how to collectrelevant information to answer their research question. The instrument used to teststated hypotheses was a mail survey and a questionnaire (Appendix) on TQM inindustries was prepared covering all the important factors group wise. Thisquestionnaire was then pre-tested with academics and practitioners to check its contentvalidity, terminology and modified accordingly.
The questionnaire (Appendix) was then sent to 150 manufacturing companies and75 companies responded (response rate ¼ 50 percent), which are from various sectorslike automobile engineering (AUTO), textile engineering (TEXT), electrical andelectronics engineering (E&CE), light weight engineering (LIG) and heavy weightengineering (HEV) works in India.
4. Findings and discussion4.1 Hypothesis testing (H1)This hypothesis was checked by comparing the mean results of survey for all theindustries combining them in various industrial groups like AUTO – TEXT etc. As
TQM in Indianindustries
609
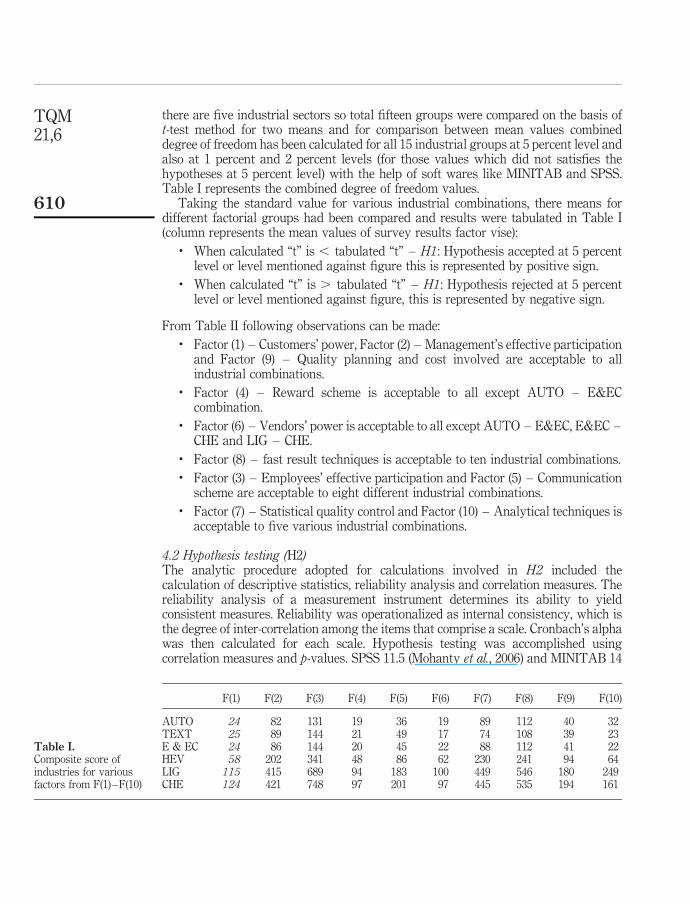
there are five industrial sectors so total fifteen groups were compared on the basis oft-test method for two means and for comparison between mean values combineddegree of freedom has been calculated for all 15 industrial groups at 5 percent level andalso at 1 percent and 2 percent levels (for those values which did not satisfies thehypotheses at 5 percent level) with the help of soft wares like MINITAB and SPSS.Table I represents the combined degree of freedom values.
Taking the standard value for various industrial combinations, there means fordifferent factorial groups had been compared and results were tabulated in Table I(column represents the mean values of survey results factor vise):
. When calculated “t” is , tabulated “t” – H1: Hypothesis accepted at 5 percentlevel or level mentioned against figure this is represented by positive sign.
. When calculated “t” is . tabulated “t” – H1: Hypothesis rejected at 5 percentlevel or level mentioned against figure, this is represented by negative sign.
From Table II following observations can be made:. Factor (1) – Customers’ power, Factor (2) – Management’s effective participation
and Factor (9) – Quality planning and cost involved are acceptable to allindustrial combinations.
. Factor (4) – Reward scheme is acceptable to all except AUTO – E&ECcombination.
. Factor (6) – Vendors’ power is acceptable to all except AUTO – E&EC, E&EC –CHE and LIG – CHE.
. Factor (8) – fast result techniques is acceptable to ten industrial combinations.
. Factor (3) – Employees’ effective participation and Factor (5) – Communicationscheme are acceptable to eight different industrial combinations.
. Factor (7) – Statistical quality control and Factor (10) – Analytical techniques isacceptable to five various industrial combinations.
4.2 Hypothesis testing (H2)The analytic procedure adopted for calculations involved in H2 included thecalculation of descriptive statistics, reliability analysis and correlation measures. Thereliability analysis of a measurement instrument determines its ability to yieldconsistent measures. Reliability was operationalized as internal consistency, which isthe degree of inter-correlation among the items that comprise a scale. Cronbach’s alphawas then calculated for each scale. Hypothesis testing was accomplished usingcorrelation measures and p-values. SPSS 11.5 (Mohanty et al., 2006) and MINITAB 14
F(1) F(2) F(3) F(4) F(5) F(6) F(7) F(8) F(9) F(10)
AUTO 24 82 131 19 36 19 89 112 40 32TEXT 25 89 144 21 49 17 74 108 39 23E & EC 24 86 144 20 45 22 88 112 41 22HEV 58 202 341 48 86 62 230 241 94 64LIG 115 415 689 94 183 100 449 546 180 249CHE 124 421 748 97 201 97 445 535 194 161
Table I.Composite score ofindustries for variousfactors from F(1)–F(10)
TQM21,6
610
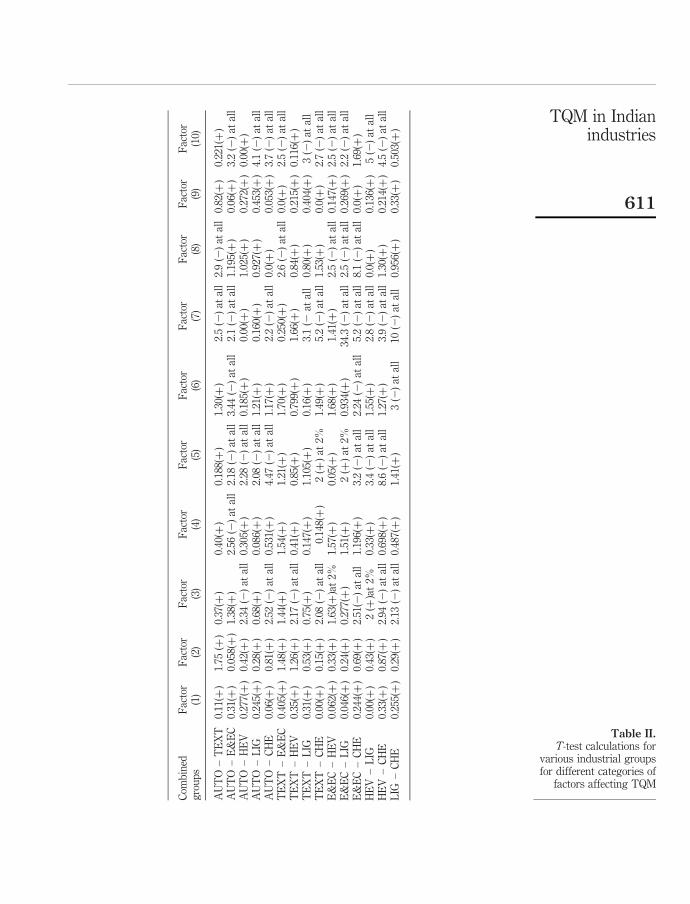
Com
bin
edg
rou
ps
Fac
tor
(1)
Fac
tor
(2)
Fac
tor
(3)
Fac
tor
(4)
Fac
tor
(5)
Fac
tor
(6)
Fac
tor
(7)
Fac
tor
(8)
Fac
tor
(9)
Fac
tor
(10)
AU
TO
–T
EX
T0.
11(þ
)1.
75(þ
)0.
37(þ
)0.
40(þ
)0.
188(þ
)1.
30(þ
)2.
5(2
)at
all
2.9
(2)
atal
l0.
82(þ
)0.
221(þ
)A
UT
O–
E&
EC
0.31
(þ)
0.05
8(þ
)1.
38(þ
)2.
56(2
)at
all
2.18
(2)
atal
l3.
44(2
)at
all
2.1
(2)
atal
l1.
195(þ
)0.
06(þ
)3.
2(2
)at
all
AU
TO
–H
EV
0.27
7(þ
)0.
42(þ
)2.
34(2
)at
all
0.30
5(þ
)2.
28(2
)at
all
0.18
5(þ
)0.
00(þ
)1.
025(þ
)0.
272(þ
)0.
00(þ
)A
UT
O–
LIG
0.24
5(þ
)0.
28(þ
)0.
68(þ
)0.
086(þ
)2.
08(2
)at
all
1.21
(þ)
0.16
0(þ
)0.
927(þ
)0.
453(þ
)4.
1(2
)at
all
AU
TO
–C
HE
0.06
(þ)
0.81
(þ)
2.52
(2)
atal
l0.
531(þ
)4.
47(2
)at
all
1.17
(þ)
2.2
(2)
atal
l0.
0(þ
)0.
053(þ
)3.
7(2
)at
all
TE
XT
–E
&E
C0.
405(þ
)1.
48(þ
)1.
44(þ
)1.
54(þ
)1.
21(þ
)1.
70(þ
)0.
250(þ
)2.
6(2
)at
all
0.0(þ
)2.
5(2
)at
all
TE
XT
–H
EV
0.35
(þ)
1.26
(þ)
2.17
(2)
atal
l0.
41(þ
)0.
85(þ
)0.
799(þ
)1.
66(þ
)0.
84(þ
)0.
215(þ
)0.
116(þ
)T
EX
T–
LIG
0.31
(þ)
0.53
(þ)
0.75
(þ)
0.14
7(þ
)1.
105(þ
)0.
16(þ
)3.
1(2
atal
l0.
80(þ
)0.
404(þ
)3
(2)
atal
lT
EX
T–
CH
E0.
00(þ
)0.
15(þ
)2.
08(2
)at
all
0.14
8(þ
)2
(þ)
at2%
1.49
(þ)
5.2
(2)
atal
l1.
53(þ
)0.
0(þ
)2.
7(2
)at
all
E&
EC
–H
EV
0.06
2(þ
)0.
33(þ
)1.
63(þ
)at
2%1.
57(þ
)0.
05(þ
)1.
68(þ
)1.
41(þ
)2.
5(2
)at
all
0.14
7(þ
)2.
5(2
)at
all
E&
EC
–L
IG0.
046(þ
)0.
24(þ
)0.
277(þ
)1.
51(þ
)2
(þ)
at2%
0.93
4(þ
)34
.3(2
)at
all
2.5
(2)
atal
l0.
269(þ
)2.
2(2
)at
all
E&
EC
–C
HE
0.24
4(þ
)0.
69(þ
)2.
51(2
)at
all
1.19
6(þ
)3.
2(2
)at
all
2.24
(2)
atal
l5.
2(2
)at
all
8.1
(2)
atal
l0.
0(þ
)1.
69(þ
)H
EV
–L
IG0.
00(þ
)0.
43(þ
)2
(þ)a
t2%
0.33
(þ)
3.4
(2)
atal
l1.
55(þ
)2.
8(2
)at
all
0.0(þ
)0.
136(þ
)5
(2)
atal
lH
EV
–C
HE
0.33
(þ)
0.87
(þ)
2.94
(2)
atal
l0.
698(þ
)8.
6(2
)at
all
1.27
(þ)
3.9
(2)
atal
l1.
30(þ
)0.
214(þ
)4.
5(2
)at
all
LIG
–C
HE
0.25
5(þ
)0.
29(þ
)2.
13(2
)at
all
0.48
7(þ
)1.
41(þ
)3
(2)
atal
l10
(2)
atal
l0.
956(þ
)0.
33(þ
)0.
503(þ
)
Table II.T-test calculations for
various industrial groupsfor different categories of
factors affecting TQM
TQM in Indianindustries
611
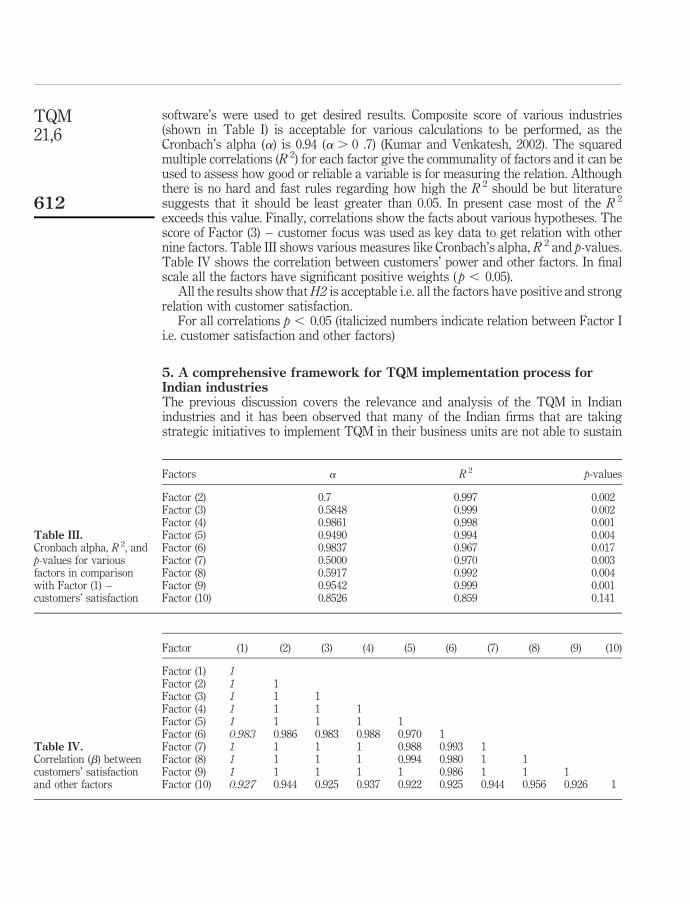
software’s were used to get desired results. Composite score of various industries(shown in Table I) is acceptable for various calculations to be performed, as theCronbach’s alpha (a) is 0.94 (a . 0 .7) (Kumar and Venkatesh, 2002). The squaredmultiple correlations (R 2) for each factor give the communality of factors and it can beused to assess how good or reliable a variable is for measuring the relation. Althoughthere is no hard and fast rules regarding how high the R 2 should be but literaturesuggests that it should be least greater than 0.05. In present case most of the R 2
exceeds this value. Finally, correlations show the facts about various hypotheses. Thescore of Factor (3) – customer focus was used as key data to get relation with othernine factors. Table III shows various measures like Cronbach’s alpha, R 2 and p-values.Table IV shows the correlation between customers’ power and other factors. In finalscale all the factors have significant positive weights ( p , 0.05).
All the results show that H2 is acceptable i.e. all the factors have positive and strongrelation with customer satisfaction.
For all correlations p , 0.05 (italicized numbers indicate relation between Factor Ii.e. customer satisfaction and other factors)
5. A comprehensive framework for TQM implementation process forIndian industriesThe previous discussion covers the relevance and analysis of the TQM in Indianindustries and it has been observed that many of the Indian firms that are takingstrategic initiatives to implement TQM in their business units are not able to sustain
Factor (1) (2) (3) (4) (5) (6) (7) (8) (9) (10)
Factor (1) 1Factor (2) 1 1Factor (3) 1 1 1Factor (4) 1 1 1 1Factor (5) 1 1 1 1 1Factor (6) 0.983 0.986 0.983 0.988 0.970 1Factor (7) 1 1 1 1 0.988 0.993 1Factor (8) 1 1 1 1 0.994 0.980 1 1Factor (9) 1 1 1 1 1 0.986 1 1 1Factor (10) 0.927 0.944 0.925 0.937 0.922 0.925 0.944 0.956 0.926 1
Table IV.Correlation (b) betweencustomers’ satisfactionand other factors
Factors a R 2 p-values
Factor (2) 0.7 0.997 0.002Factor (3) 0.5848 0.999 0.002Factor (4) 0.9861 0.998 0.001Factor (5) 0.9490 0.994 0.004Factor (6) 0.9837 0.967 0.017Factor (7) 0.5000 0.970 0.003Factor (8) 0.5917 0.992 0.004Factor (9) 0.9542 0.999 0.001Factor (10) 0.8526 0.859 0.141
Table III.Cronbach alpha, R 2, andp-values for variousfactors in comparisonwith Factor (1) –customers’ satisfaction
TQM21,6
612
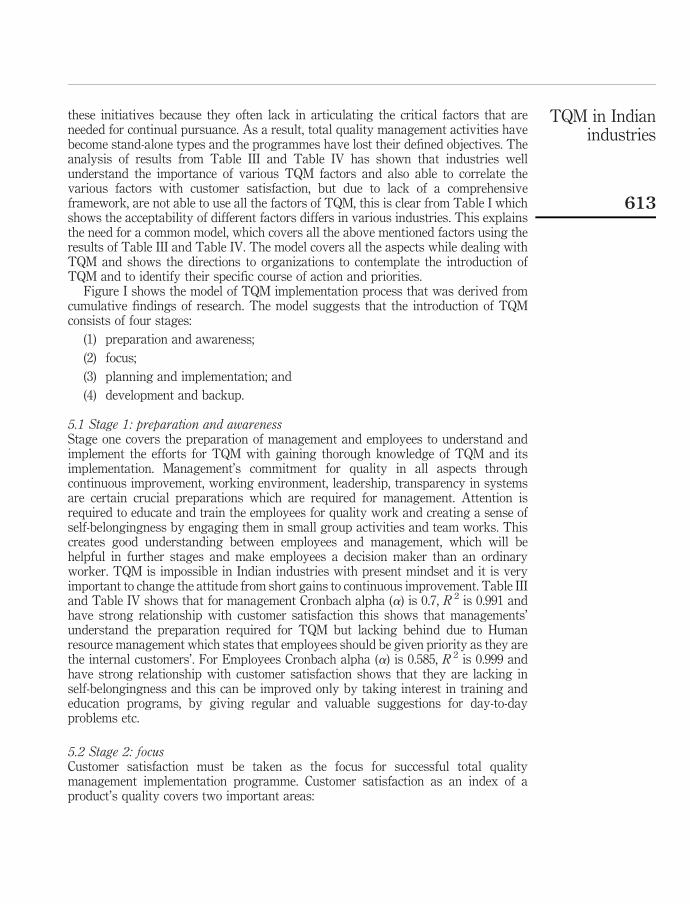
these initiatives because they often lack in articulating the critical factors that areneeded for continual pursuance. As a result, total quality management activities havebecome stand-alone types and the programmes have lost their defined objectives. Theanalysis of results from Table III and Table IV has shown that industries wellunderstand the importance of various TQM factors and also able to correlate thevarious factors with customer satisfaction, but due to lack of a comprehensiveframework, are not able to use all the factors of TQM, this is clear from Table I whichshows the acceptability of different factors differs in various industries. This explainsthe need for a common model, which covers all the above mentioned factors using theresults of Table III and Table IV. The model covers all the aspects while dealing withTQM and shows the directions to organizations to contemplate the introduction ofTQM and to identify their specific course of action and priorities.
Figure I shows the model of TQM implementation process that was derived fromcumulative findings of research. The model suggests that the introduction of TQMconsists of four stages:
(1) preparation and awareness;
(2) focus;
(3) planning and implementation; and
(4) development and backup.
5.1 Stage 1: preparation and awarenessStage one covers the preparation of management and employees to understand andimplement the efforts for TQM with gaining thorough knowledge of TQM and itsimplementation. Management’s commitment for quality in all aspects throughcontinuous improvement, working environment, leadership, transparency in systemsare certain crucial preparations which are required for management. Attention isrequired to educate and train the employees for quality work and creating a sense ofself-belongingness by engaging them in small group activities and team works. Thiscreates good understanding between employees and management, which will behelpful in further stages and make employees a decision maker than an ordinaryworker. TQM is impossible in Indian industries with present mindset and it is veryimportant to change the attitude from short gains to continuous improvement. Table IIIand Table IV shows that for management Cronbach alpha (a) is 0.7, R 2 is 0.991 andhave strong relationship with customer satisfaction this shows that managements’understand the preparation required for TQM but lacking behind due to Humanresource management which states that employees should be given priority as they arethe internal customers’. For Employees Cronbach alpha (a) is 0.585, R 2 is 0.999 andhave strong relationship with customer satisfaction shows that they are lacking inself-belongingness and this can be improved only by taking interest in training andeducation programs, by giving regular and valuable suggestions for day-to-dayproblems etc.
5.2 Stage 2: focusCustomer satisfaction must be taken as the focus for successful total qualitymanagement implementation programme. Customer satisfaction as an index of aproduct’s quality covers two important areas:
TQM in Indianindustries
613
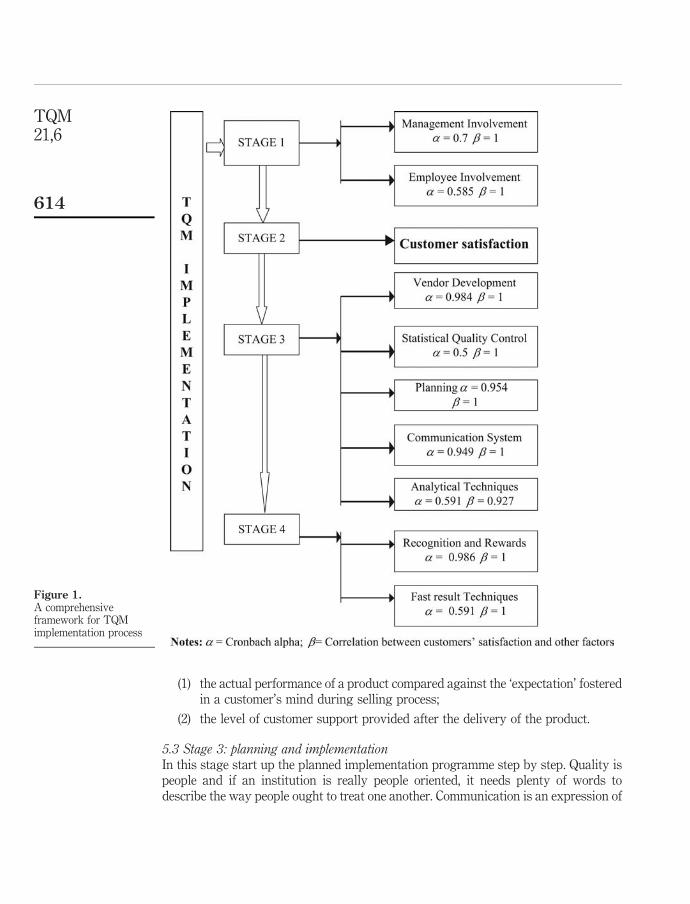
(1) the actual performance of a product compared against the ‘expectation’ fosteredin a customer’s mind during selling process;
(2) the level of customer support provided after the delivery of the product.
5.3 Stage 3: planning and implementationIn this stage start up the planned implementation programme step by step. Quality ispeople and if an institution is really people oriented, it needs plenty of words todescribe the way people ought to treat one another. Communication is an expression of
Figure 1.A comprehensiveframework for TQMimplementation process
TQM21,6
614
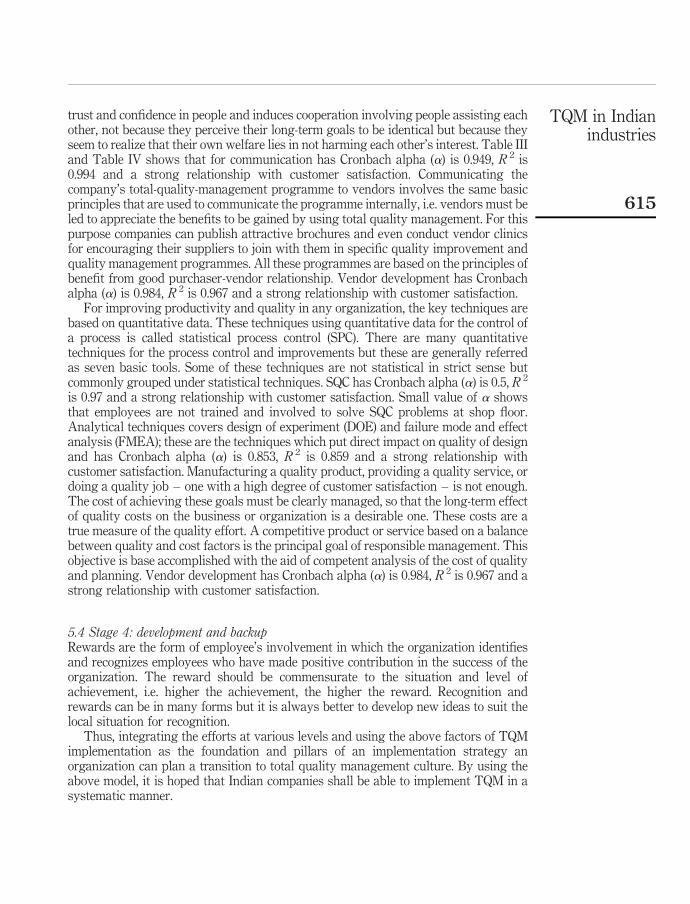
trust and confidence in people and induces cooperation involving people assisting eachother, not because they perceive their long-term goals to be identical but because theyseem to realize that their own welfare lies in not harming each other’s interest. Table IIIand Table IV shows that for communication has Cronbach alpha (a) is 0.949, R 2 is0.994 and a strong relationship with customer satisfaction. Communicating thecompany’s total-quality-management programme to vendors involves the same basicprinciples that are used to communicate the programme internally, i.e. vendors must beled to appreciate the benefits to be gained by using total quality management. For thispurpose companies can publish attractive brochures and even conduct vendor clinicsfor encouraging their suppliers to join with them in specific quality improvement andquality management programmes. All these programmes are based on the principles ofbenefit from good purchaser-vendor relationship. Vendor development has Cronbachalpha (a) is 0.984, R 2 is 0.967 and a strong relationship with customer satisfaction.
For improving productivity and quality in any organization, the key techniques arebased on quantitative data. These techniques using quantitative data for the control ofa process is called statistical process control (SPC). There are many quantitativetechniques for the process control and improvements but these are generally referredas seven basic tools. Some of these techniques are not statistical in strict sense butcommonly grouped under statistical techniques. SQC has Cronbach alpha (a) is 0.5, R 2
is 0.97 and a strong relationship with customer satisfaction. Small value of a showsthat employees are not trained and involved to solve SQC problems at shop floor.Analytical techniques covers design of experiment (DOE) and failure mode and effectanalysis (FMEA); these are the techniques which put direct impact on quality of designand has Cronbach alpha (a) is 0.853, R 2 is 0.859 and a strong relationship withcustomer satisfaction. Manufacturing a quality product, providing a quality service, ordoing a quality job – one with a high degree of customer satisfaction – is not enough.The cost of achieving these goals must be clearly managed, so that the long-term effectof quality costs on the business or organization is a desirable one. These costs are atrue measure of the quality effort. A competitive product or service based on a balancebetween quality and cost factors is the principal goal of responsible management. Thisobjective is base accomplished with the aid of competent analysis of the cost of qualityand planning. Vendor development has Cronbach alpha (a) is 0.984, R 2 is 0.967 and astrong relationship with customer satisfaction.
5.4 Stage 4: development and backupRewards are the form of employee’s involvement in which the organization identifiesand recognizes employees who have made positive contribution in the success of theorganization. The reward should be commensurate to the situation and level ofachievement, i.e. higher the achievement, the higher the reward. Recognition andrewards can be in many forms but it is always better to develop new ideas to suit thelocal situation for recognition.
Thus, integrating the efforts at various levels and using the above factors of TQMimplementation as the foundation and pillars of an implementation strategy anorganization can plan a transition to total quality management culture. By using theabove model, it is hoped that Indian companies shall be able to implement TQM in asystematic manner.
TQM in Indianindustries
615
6. ConclusionQuality is essence of all the business and the manufacturing activities is clear in themindsets of the Indian organizations. It is evident that total quality management likemany other management techniques propounded from time-to-time is based on aserious philosophy of continuous improvement and customer satisfaction. It cannot beapplied hurriedly and results cannot be achieved overnight. It needed complete changein mind set which required enough time to believe on the concepts of TQM.
It is a common observation that managers, in the initial euphoria of discovering yetanother management technique, are impatient to apply it and expect quick results. Insuch cases disillusionment occurs rapidly causing the technique to be termed a fad,that’s what is happening with TQM in Indian industries. For effective implementationof total quality management, sincere efforts with clarity of objectives are being put inby Indian organizations. Sometimes they also employ external consultants also forbringing out the much-needed changes for improving quality of their products andservices.
This paper takes the current and important TQM implementation phenomenon, anddraws extensively from the literature to build model, which can help a lot whileadopting the TQM as whole not as a part, to get life time results. This recommendedpath develops a self-reinforcing cycle of commitment, communication and culturechange.
The model presented here provides a direct approach to top management toimplement TQM programme through customer satisfaction as main focus. The newoperating environment of the future will provide a set of challenges on various levels.A clear focus on defining and managing the customer side, process emphasis, andcreating knowledge through innovation will comprise the new business environment.Under this new environment, TQM systems will shift towards a philosophy of qualitybased strategic management systems. In general, it is strongly recommended that theIndian industry must make all efforts to implement TQM, may be in a phased manner.This will help in making industries competitive on global level.
References
Antony, J., Fergusson, C., Waraood, S. and Tsang, H.Y. (2004), “Comparing total qualitymanagement success factors in UK manufacturing and service industries: some keyfindings from survey”, Journal of Advances in Management Research, Vol. 1 No. 2,pp. 32-45.
Baisya, R.K. and Sarkar, R. (2004), “Customer satisfaction in service sector: a case study of theairline industry”, Journal of Advances in Management Research, Vol. 1 No. 2, pp. 73-9.
Chaudhry, P.E. and Chaudhry, S.S. (2000), “Managerial perceptions of quality control in Japanesebusiness”, Production and Inventory Management Journal, Vol. 4, pp. 34-9.
Dalu, R.S. and Deshmukh, S.G. (2000), “An exploratory study of quality management practices insmall and medium scale industry”, Industrial Engineering Journal, Vol. 29 No. 12, pp. 21-7.
Dahlgaard, J.J. and Dahlgaard, S.M. (2006), “Lean production, six sigma quality, TQM andcompany culture”, The TQM Magazine, Vol. 18 No. 3, pp. 263-81.
Heizer, J. and Nathan, J. (2004), Total Quality Management Manufacturing and Services,Thomson South Western, Perth.
Ho, D.C.K., Duffy, V.G. and Shih, H.M. (2001), “Total quality management: an empirical test formediation effect”, International Journal of Production R & S, Vol. 39 No. 3, pp. 529-48.
TQM21,6
616
Khanna, V.K. and Vrat, P. (2002), “TQM practices in the Indian Automobile Sector”, Productivity,Vol. 43 No. 3, pp. 245-9.
Khond, M.P. and Dabade, B.M. (2004), “TQM: a perspective of Indian manufacturingenvironment study”, Industrial Engineering Journal, Vol. 33 No. 10, pp. 21-7.
Kumar, A. and Venkatesh, Y.D. (2002), “Implementation of Kaizen concept – a case study”,Industrial Engineering Journal, Vol. 31 No. 8, pp. 11-13.
Lai, K.H. and Cheng, T.C.E. (2003), “Initiatives and outcomes of quality managementimplementation across industries”, Omega: The International Journal of ManagementScience, Vol. 141 -154.
Mehra, S., Hoffman, J.M. and Sirias, D. (2001), “TQM as a management strategy for the nextmillennia”, International Journal of Operations & Production Management, Vol. 21 No. 5,pp. 855-76.
Mohanty, R.P., Shrivastava, R.L. and Lakhe, A. (2006), “Linkages between total qualitymanagement and organisational performance: an empirical study for Indian Industry”,Production Planning & Control, Vol. 17 No. 1, pp. 13-20.
Murthy, P.V.R. and Shrivastav, A.K. (2000) in Kohli, U. and Sinha, D.P. (Eds), “Empoweringpeople for TQM through redesigning organisations”, Human Resource Development:Global Changes & Strategies in 2000, Proceedings of 23rd IFTDO World Conference onHuman Resource Development, New Delhi, November, pp. 327-343.
Robinson, P. (2001), “Continuous improvement principles”, Industry, Vol. 2.0, pp. 25-8.
Shrivastava, R.L., Bhagade, S.S. and Lakhe, R.R. (2004), “Thinking performance measures withTQM factors & practices”, Productivity, Vol. 44 No. 4, pp. 586-94.
Taylor, W.A. and Wright, G.H. (2003), “A longitudinal study of TQM implementation: factorsinfluencing success and failure”, Omega: The International Journal of ManagementScience, Vol. 31, pp. 97-111.
Further reading
Nirmala, S. (1998), “Making TQM and work – some critical issues”, Productivity, Vol. 39 No. 2,pp. 280-5.
Ong, K.H., Harvey, G.M., Shehab, R.L., Dechert, J.D. and Darisipudim, A. (2004), “The effects ofthree statistical control charts on task performance”, Production, Planning & Control,Vol. 15 No. 3, pp. 313-23.
(The Appendix follows overleaf.)
TQM in Indianindustries
617
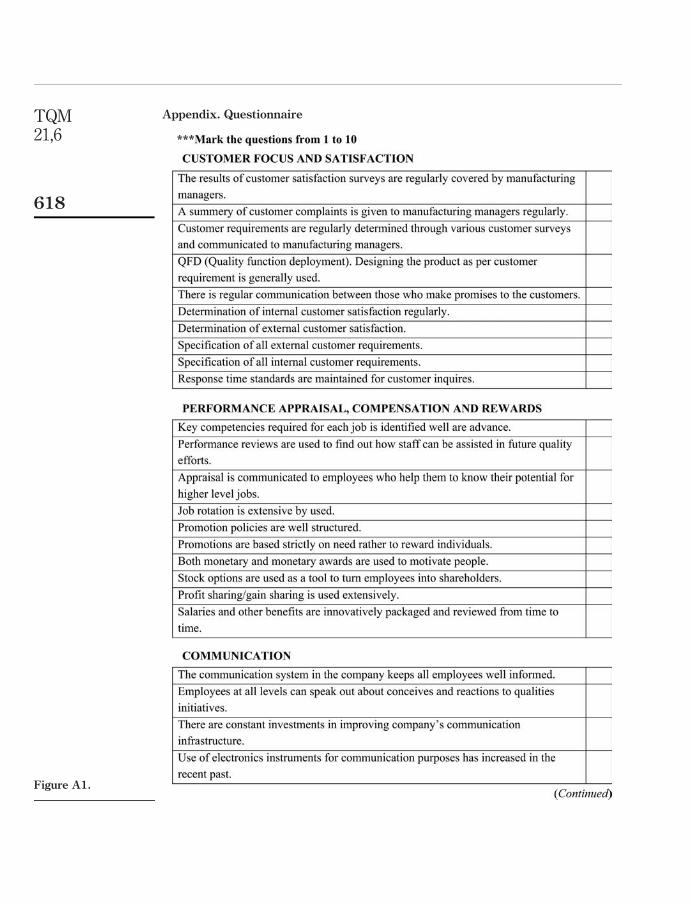
Appendix. Questionnaire
Figure A1.
TQM21,6
618
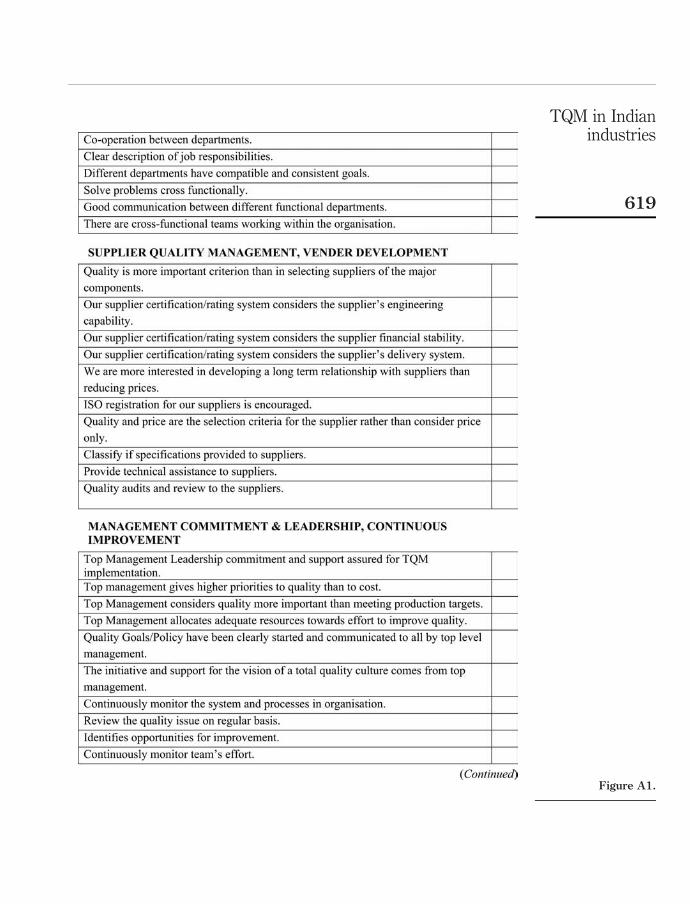
Figure A1.
TQM in Indianindustries
619
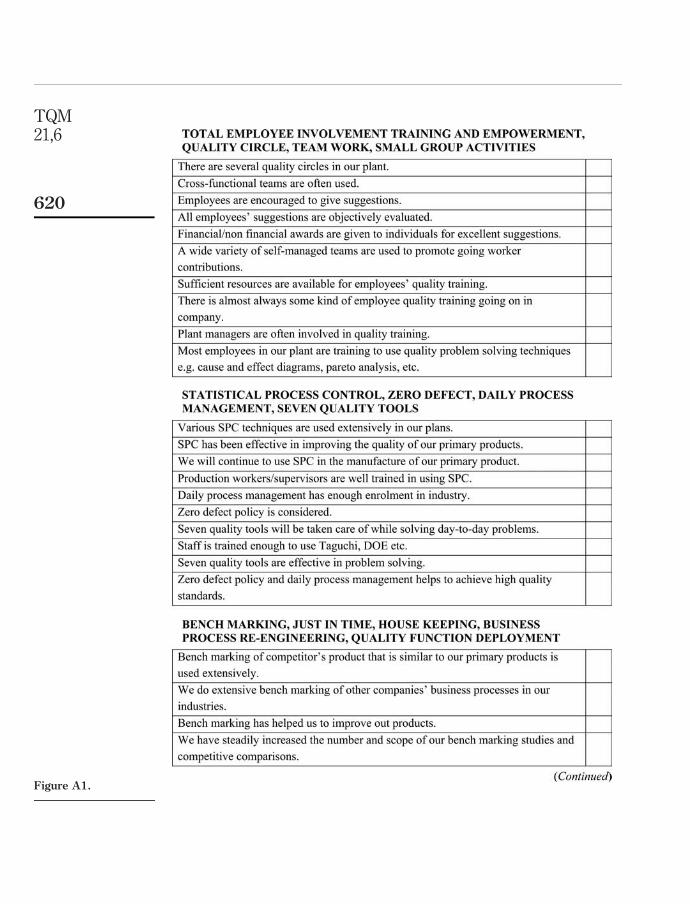
Figure A1.
TQM21,6
620
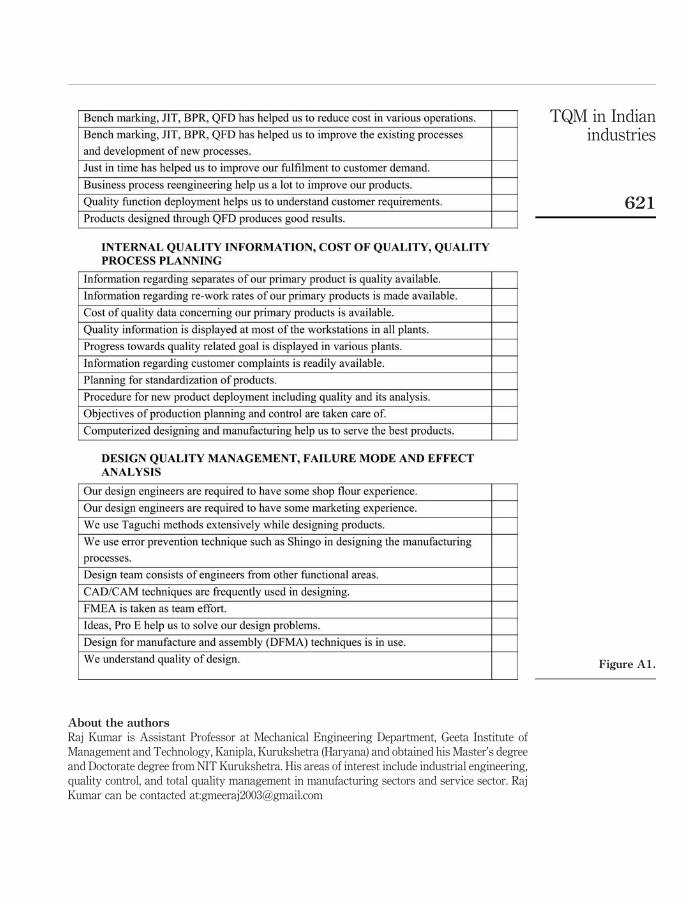
About the authors
Raj Kumar is Assistant Professor at Mechanical Engineering Department, Geeta Institute ofManagement and Technology, Kanipla, Kurukshetra (Haryana) and obtained his Master’s degreeand Doctorate degree from NIT Kurukshetra. His areas of interest include industrial engineering,quality control, and total quality management in manufacturing sectors and service sector. RajKumar can be contacted at:[email protected]
Figure A1.
TQM in Indianindustries
621
Dixit Garg is Assistant Professor at Mechanical Engineering Department, National Instituteof Technology, kurukshetra (Haryana). He is a doctor in industrial engineering area and haspublished more than 60 papers in various journals and conferences of international and nationalrepute.
T.K. Garg is Professor at Mechanical Engineering Department, National Institute ofTechnology, Kurukshetra (Haryana). He has published more than 80 papers in various journalsand conferences of international and national repute.
TQM21,6
622
To purchase reprints of this article please e-mail: [email protected] visit our web site for further details: www.emeraldinsight.com/reprints
Does size matter for Six Sigmaimplementation?
Findings from the survey in UK SMEs
Maneesh Kumar and Jiju AntonyDepartment of Design Manufacture and Engineering Management,
Strathclyde Institute of Operations Management, University of Strathclyde,Glasgow, UK, and
Alex DouglasLiverpool Business School, Liverpool John Moores University, Liverpool, UK
Abstract
Purpose – The purpose of this paper is to identify the quality initiatives implemented in UKmanufacturing small and medium-sized enterprises (SMEs) and to perform a comparative analysis ofquality management practices within Six Sigma firms against the non-Six Sigma manufacturingSMEs.
Design/methodology/approach – To achieve the research objective, a survey-based approach isadopted by designing a short questionnaire addressing the issues of quality practices in SMEs. Thepaper encompasses the survey results from the first phase of Doctoral study to identify Six Sigma andnon-Six Sigma companies.
Findings – The response rate from the survey is 12.7 per cent out of 500 companies identifiedthrough the use of random sampling technique within the FAME and Dun & Bradstreet database ofmanufacturing SMEs. Data analysis was carried out using SPSS and Microsoft Excel. The findingsfrom the study reveal that there is a significant difference in the performance of the Six Sigma/Leanfirms against ISO certified companies. However, it is interesting to reflect on the findings of criticalsuccess factors (CSFs) of the sample firms. There is no significant difference in the perceivedimportance of the identified CSFs’ variables in the Six Sigma and ISO certified SMEs.
Research limitations/implications – The focus of the study is only on UK manufacturing SMEsencompassing 64 firms. The small sample size and focus on manufacturing sector limits itsgeneralisability to the entire SME population. Future study should focus on performing a comparativestudy of manufacturing and service based SMEs in UK or Europe.
Originality/value – The novelty of the paper lies in conducting a comparative study on theperformance of Six Sigma and non-Six Sigma UK SMEs and drawing out valuable lessons foracademics, consultants, researchers and practitioners of continuous improvement initiatives like Leanand Six Sigma.
Keywords Six sigma, Small to medium-sized enterprises, Critical success factors,Performance measures, Continuous improvement, United Kingdom
Paper type Research paper
IntroductionFrom 1980s onward, with the globalisation of the world market, a continuous trendtowards downsizing of large firms and business outsourcing to smaller firms seems tobe the latest trend. With the beginning of the new millennium, the degree ofproductivity demonstrated by small firms will be vital to a continued economic surge(Kuratko et al., 2001). The small and medium-sized enterprises (SMEs) constitute the
The current issue and full text archive of this journal is available at
www.emeraldinsight.com/1754-2731.htm
Six Sigmaimplementation
623
The TQM JournalVol. 21 No. 6, 2009
pp. 623-635q Emerald Group Publishing Limited
1754-2731DOI 10.1108/17542730910995882
bulk of enterprise with the major contribution to private sector output and employmentin all economies of the world (Antony et al., 2005). SMEs contribution to worldeconomy can be adjudged from the following:
. European Union – SMEs are economically important with 98 per cent of anestimated 19.3 million enterprises defined as SMEs, providing around 65 millionjobs (66 per cent) and more than half (52 per cent) of private sector turnover(EUROSTAT, 2003);
. The OECD countries – SMEs represent over 95 per cent of enterprises in each ofthe 30 member countries and generate over half of private sector turnover(OECD, 2000);
. Of all enterprises in China, 99 per cent are SMEs, providing employment to 75per cent of total workforce (China Service SMEs, 2002).
. In UK, SMEs economic significance and contribution in generating income andsustaining employment has been widely recognised by the government andpolicy makers (Jayawarna et al., 2003). According to the recent survey by SmallBusiness Service (SBS), an agency of the Department of Trade and Industry(DTI), out of 4.3 million business enterprise, 99.9 per cent are SMEs (99.3 per centwere small (0-49 employees) with only 0.6 per cent (26,000) of medium sized(50-249 employees)) and 6000 (0.1 per cent) large companies (.250 employees)(DTI, 2005). In terms of employment and annual turnover, SMEs account for 58.5per cent and 51.3 per cent respectively (DTI, 2005).
To adhere to one common definition of SME, this research considers an organisation tobe an SME if it has less than 250 employees as stated by European Commission (2003)and Department of Trade and Industry (DTI) (DTI, 2005). In regards to the “quality”effort in SMEs as compared to large firms, there has not been a great deal of research(Kuratko et al., 2001). A few articles that mention the quality effort in SMEs tend to beconceptual with little empirical findings. “Quality” has emerged as a key managementconcern since the beginning of the 1980 s and has become essential to the success andsurvival of any business, large or small (North et al., 1998). Organisations notdelivering reliable, defect-free products or services have ceased to be seriouscompetitors.
In recent years, thinking about quality issues has spawned a host of qualitymanagement strategies. In the quest for quality, organisations have pursuedformalised change programmes or quality initiatives such as: Total QualityManagement (TQM), continuous improvement methodologies such as Kaizen (Hameland Prahalad, 1994); breakthrough improvement methodologies such as BusinessProcess Re-Engineering (BPR) (Grover et al., 1995); and more recently Six Sigma(Kumar et al., 2006). Six Sigma has evolved significantly and continues to expand sinceits inception at Motorola in the mid-1980s to improve the process performance, enhancebusiness profitability and increase customer satisfaction. Six Sigma is considered oneof the most effective improvement drives among a large number of multinationalorganisations, with its adoption showing an upward trend (Desai, 2006).
Six Sigma is a highly structured process improvement framework that uses bothstatistical and non-statistical tools/techniques to eliminate process variation andthereby improve process performance and capability. The aim of Six Sigma is to keep
TQM21,6
624
the distance between the process average and the nearest tolerance limit to at least sixstandard deviations and thus reduce variability in products and processes in order toprevent defects (Wiklund and Wiklund, 2002). Six Sigma aims at achieving 3.4 defectsper million opportunities (DPMO) with an assumption that the process mean shifts by1.5 standard deviation off the target value. It provides business executives and leaderswith the strategy, methodology, infrastructure, tools and techniques to change the waybusinesses are run.
The adoption of Six Sigma as a business strategy by large multinationalcorporations such as General Electric, Honeywell, Motorola, Seagate Technology,Caterpillar, Raytheon, ABB, Bombardier and Sony, to name a few, has resulted inpublication of reports in the professional magazines and journals about the successachieved by these organisations after the implementation of Six Sigma. In spite of anumber of Six Sigma success stories in large organisations, many SMEs are yet to beconvinced of the benefits from the introduction, development, implementation anddeployment of Six Sigma. The objective of this research is to investigate into thequality practices of SMEs and compare the differences in performance of Six Sigmaand non-Six Sigma firms.
Literature reviewOnce an owner of the business (in small firms) is convinced of the advantagesconferred by Six Sigma and visualises the benefits, it is much easier to implement SixSigma and to realise its benefits (Adams et al., 2003). In small companies, the topmanagement team need to be visibly supportive of every aspect of a Six Sigmainitiative and they must demonstrate by their active participation, involvement and bytheir actions that such support is more than lip service (Adams et al., 2003; Tennant,2001).
Snee and Hoerl (2003) argue that there is nothing inherent in Six Sigma that makesit more suitable for large companies. They also suggest that the greatest barrier toimplementation in small companies to date has been the way major Six Sigma trainingproviders have structured their offerings. More recently, as more and more sets ofdeployment guides and training materials have become available, the pricingstructures have begun to change.
Researchers and practitioners have proposed frameworks or guidelines for SixSigma deployment in SMEs (Spanyi and Wurtzel, 2003; Gupta and Schultz, 2005;Schwinn, 2003; Waxer, 2004; PQA, 2003). The following points may be taken intoaccount for the successful deployment of Six Sigma in SMEs.
. visible management buy-in, commitment and support for Six Sigma deployment(Henderson and Evans, 2000; Antony, 2004);
. linking Six Sigma to business strategy and customers (Henderson and Evans,2000; Antony, 2004; Antony and Fergusson, 2004);
. understanding the customer requirements;
. shared understanding of core business processes and their criticalcharacteristics;
. training, rewarding and recognising the team members (Antony, 2004; Antonyand Fergusson, 2004);
. communicating the success and failure stories (Goldstein, 2001);
Six Sigmaimplementation
625
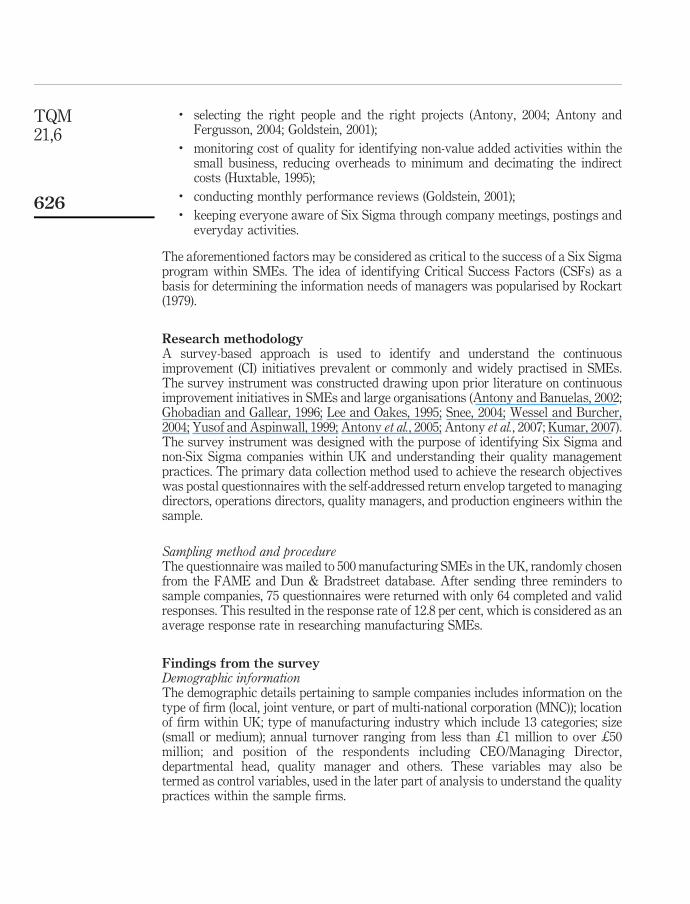
. selecting the right people and the right projects (Antony, 2004; Antony andFergusson, 2004; Goldstein, 2001);
. monitoring cost of quality for identifying non-value added activities within thesmall business, reducing overheads to minimum and decimating the indirectcosts (Huxtable, 1995);
. conducting monthly performance reviews (Goldstein, 2001);
. keeping everyone aware of Six Sigma through company meetings, postings andeveryday activities.
The aforementioned factors may be considered as critical to the success of a Six Sigmaprogram within SMEs. The idea of identifying Critical Success Factors (CSFs) as abasis for determining the information needs of managers was popularised by Rockart(1979).
Research methodologyA survey-based approach is used to identify and understand the continuousimprovement (CI) initiatives prevalent or commonly and widely practised in SMEs.The survey instrument was constructed drawing upon prior literature on continuousimprovement initiatives in SMEs and large organisations (Antony and Banuelas, 2002;Ghobadian and Gallear, 1996; Lee and Oakes, 1995; Snee, 2004; Wessel and Burcher,2004; Yusof and Aspinwall, 1999; Antony et al., 2005; Antony et al., 2007; Kumar, 2007).The survey instrument was designed with the purpose of identifying Six Sigma andnon-Six Sigma companies within UK and understanding their quality managementpractices. The primary data collection method used to achieve the research objectiveswas postal questionnaires with the self-addressed return envelop targeted to managingdirectors, operations directors, quality managers, and production engineers within thesample.
Sampling method and procedureThe questionnaire was mailed to 500 manufacturing SMEs in the UK, randomly chosenfrom the FAME and Dun & Bradstreet database. After sending three reminders tosample companies, 75 questionnaires were returned with only 64 completed and validresponses. This resulted in the response rate of 12.8 per cent, which is considered as anaverage response rate in researching manufacturing SMEs.
Findings from the surveyDemographic informationThe demographic details pertaining to sample companies includes information on thetype of firm (local, joint venture, or part of multi-national corporation (MNC)); locationof firm within UK; type of manufacturing industry which include 13 categories; size(small or medium); annual turnover ranging from less than £1 million to over £50million; and position of the respondents including CEO/Managing Director,departmental head, quality manager and others. These variables may also betermed as control variables, used in the later part of analysis to understand the qualitypractices within the sample firms.
TQM21,6
626
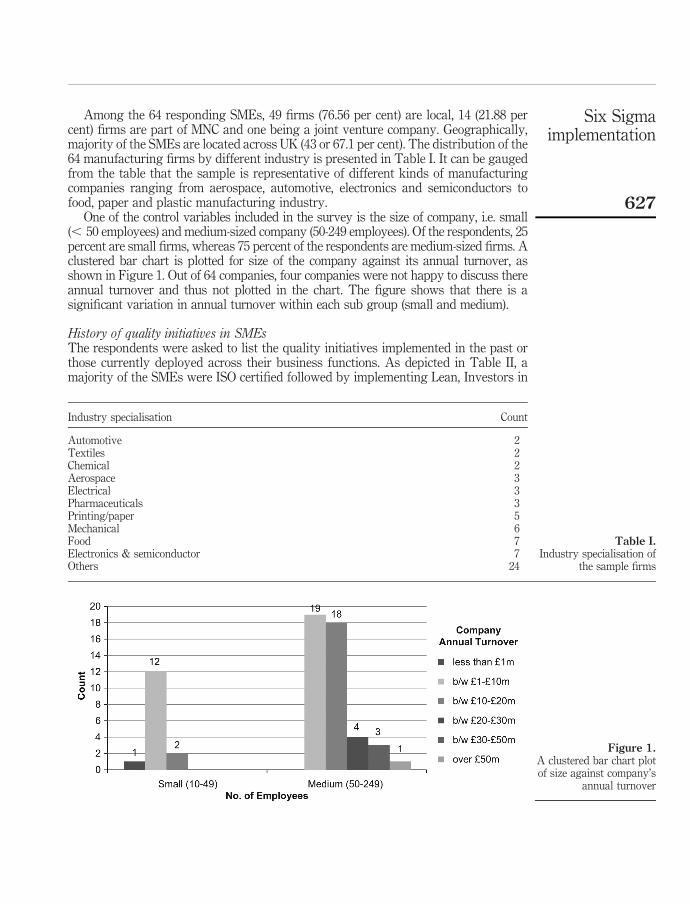
Among the 64 responding SMEs, 49 firms (76.56 per cent) are local, 14 (21.88 percent) firms are part of MNC and one being a joint venture company. Geographically,majority of the SMEs are located across UK (43 or 67.1 per cent). The distribution of the64 manufacturing firms by different industry is presented in Table I. It can be gaugedfrom the table that the sample is representative of different kinds of manufacturingcompanies ranging from aerospace, automotive, electronics and semiconductors tofood, paper and plastic manufacturing industry.
One of the control variables included in the survey is the size of company, i.e. small(, 50 employees) and medium-sized company (50-249 employees). Of the respondents, 25percent are small firms, whereas 75 percent of the respondents are medium-sized firms. Aclustered bar chart is plotted for size of the company against its annual turnover, asshown in Figure 1. Out of 64 companies, four companies were not happy to discuss thereannual turnover and thus not plotted in the chart. The figure shows that there is asignificant variation in annual turnover within each sub group (small and medium).
History of quality initiatives in SMEsThe respondents were asked to list the quality initiatives implemented in the past orthose currently deployed across their business functions. As depicted in Table II, amajority of the SMEs were ISO certified followed by implementing Lean, Investors in
Figure 1.A clustered bar chart plotof size against company’s
annual turnover
Industry specialisation Count
Automotive 2Textiles 2Chemical 2Aerospace 3Electrical 3Pharmaceuticals 3Printing/paper 5Mechanical 6Food 7Electronics & semiconductor 7Others 24
Table I.Industry specialisation of
the sample firms
Six Sigmaimplementation
627
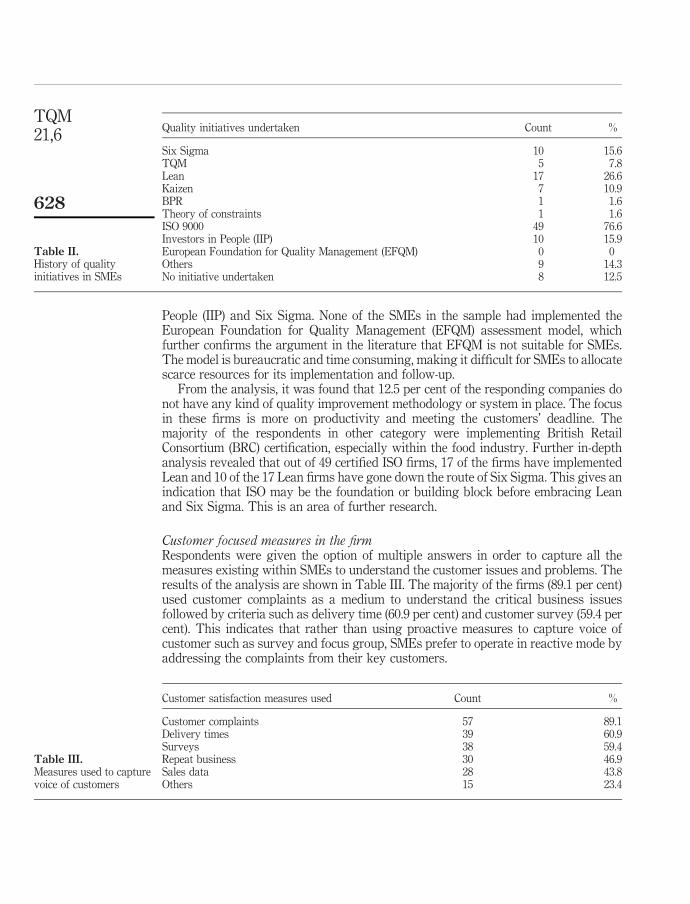
People (IIP) and Six Sigma. None of the SMEs in the sample had implemented theEuropean Foundation for Quality Management (EFQM) assessment model, whichfurther confirms the argument in the literature that EFQM is not suitable for SMEs.The model is bureaucratic and time consuming, making it difficult for SMEs to allocatescarce resources for its implementation and follow-up.
From the analysis, it was found that 12.5 per cent of the responding companies donot have any kind of quality improvement methodology or system in place. The focusin these firms is more on productivity and meeting the customers’ deadline. Themajority of the respondents in other category were implementing British RetailConsortium (BRC) certification, especially within the food industry. Further in-depthanalysis revealed that out of 49 certified ISO firms, 17 of the firms have implementedLean and 10 of the 17 Lean firms have gone down the route of Six Sigma. This gives anindication that ISO may be the foundation or building block before embracing Leanand Six Sigma. This is an area of further research.
Customer focused measures in the firmRespondents were given the option of multiple answers in order to capture all themeasures existing within SMEs to understand the customer issues and problems. Theresults of the analysis are shown in Table III. The majority of the firms (89.1 per cent)used customer complaints as a medium to understand the critical business issuesfollowed by criteria such as delivery time (60.9 per cent) and customer survey (59.4 percent). This indicates that rather than using proactive measures to capture voice ofcustomer such as survey and focus group, SMEs prefer to operate in reactive mode byaddressing the complaints from their key customers.
Quality initiatives undertaken Count %
Six Sigma 10 15.6TQM 5 7.8Lean 17 26.6Kaizen 7 10.9BPR 1 1.6Theory of constraints 1 1.6ISO 9000 49 76.6Investors in People (IIP) 10 15.9European Foundation for Quality Management (EFQM) 0 0Others 9 14.3No initiative undertaken 8 12.5
Table II.History of qualityinitiatives in SMEs
Customer satisfaction measures used Count %
Customer complaints 57 89.1Delivery times 39 60.9Surveys 38 59.4Repeat business 30 46.9Sales data 28 43.8Others 15 23.4
Table III.Measures used to capturevoice of customers
TQM21,6
628
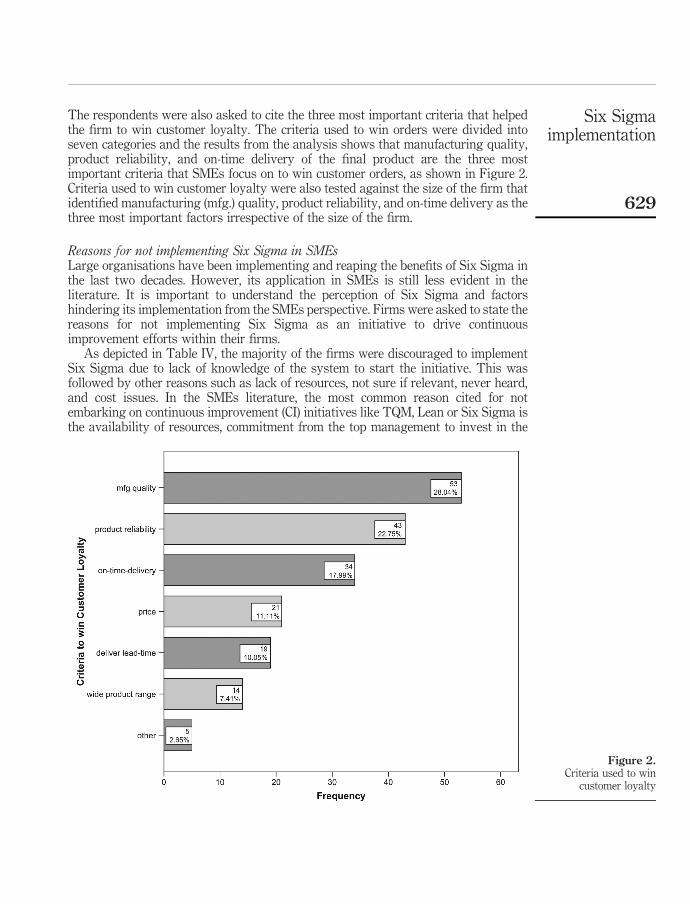
The respondents were also asked to cite the three most important criteria that helpedthe firm to win customer loyalty. The criteria used to win orders were divided intoseven categories and the results from the analysis shows that manufacturing quality,product reliability, and on-time delivery of the final product are the three mostimportant criteria that SMEs focus on to win customer orders, as shown in Figure 2.Criteria used to win customer loyalty were also tested against the size of the firm thatidentified manufacturing (mfg.) quality, product reliability, and on-time delivery as thethree most important factors irrespective of the size of the firm.
Reasons for not implementing Six Sigma in SMEsLarge organisations have been implementing and reaping the benefits of Six Sigma inthe last two decades. However, its application in SMEs is still less evident in theliterature. It is important to understand the perception of Six Sigma and factorshindering its implementation from the SMEs perspective. Firms were asked to state thereasons for not implementing Six Sigma as an initiative to drive continuousimprovement efforts within their firms.
As depicted in Table IV, the majority of the firms were discouraged to implementSix Sigma due to lack of knowledge of the system to start the initiative. This wasfollowed by other reasons such as lack of resources, not sure if relevant, never heard,and cost issues. In the SMEs literature, the most common reason cited for notembarking on continuous improvement (CI) initiatives like TQM, Lean or Six Sigma isthe availability of resources, commitment from the top management to invest in the
Figure 2.Criteria used to win
customer loyalty
Six Sigmaimplementation
629
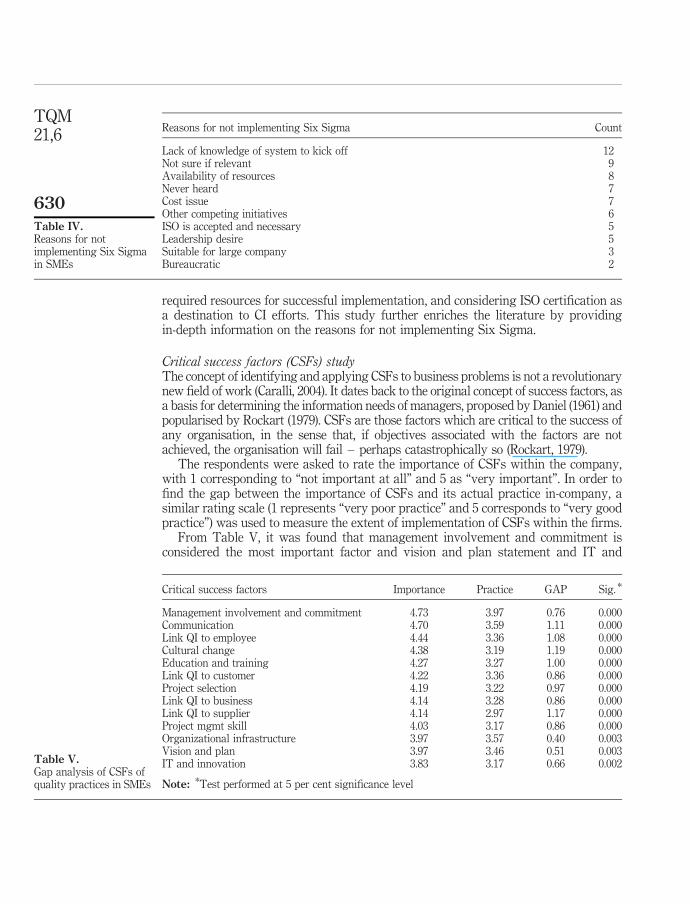
required resources for successful implementation, and considering ISO certification asa destination to CI efforts. This study further enriches the literature by providingin-depth information on the reasons for not implementing Six Sigma.
Critical success factors (CSFs) studyThe concept of identifying and applying CSFs to business problems is not a revolutionarynew field of work (Caralli, 2004). It dates back to the original concept of success factors, asa basis for determining the information needs of managers, proposed by Daniel (1961) andpopularised by Rockart (1979). CSFs are those factors which are critical to the success ofany organisation, in the sense that, if objectives associated with the factors are notachieved, the organisation will fail – perhaps catastrophically so (Rockart, 1979).
The respondents were asked to rate the importance of CSFs within the company,with 1 corresponding to “not important at all” and 5 as “very important”. In order tofind the gap between the importance of CSFs and its actual practice in-company, asimilar rating scale (1 represents “very poor practice” and 5 corresponds to “very goodpractice”) was used to measure the extent of implementation of CSFs within the firms.
From Table V, it was found that management involvement and commitment isconsidered the most important factor and vision and plan statement and IT and
Reasons for not implementing Six Sigma Count
Lack of knowledge of system to kick off 12Not sure if relevant 9Availability of resources 8Never heard 7Cost issue 7Other competing initiatives 6ISO is accepted and necessary 5Leadership desire 5Suitable for large company 3Bureaucratic 2
Table IV.Reasons for notimplementing Six Sigmain SMEs
Critical success factors Importance Practice GAP Sig. *
Management involvement and commitment 4.73 3.97 0.76 0.000Communication 4.70 3.59 1.11 0.000Link QI to employee 4.44 3.36 1.08 0.000Cultural change 4.38 3.19 1.19 0.000Education and training 4.27 3.27 1.00 0.000Link QI to customer 4.22 3.36 0.86 0.000Project selection 4.19 3.22 0.97 0.000Link QI to business 4.14 3.28 0.86 0.000Link QI to supplier 4.14 2.97 1.17 0.000Project mgmt skill 4.03 3.17 0.86 0.000Organizational infrastructure 3.97 3.57 0.40 0.003Vision and plan 3.97 3.46 0.51 0.003IT and innovation 3.83 3.17 0.66 0.002
Note: *Test performed at 5 per cent significance level
Table V.Gap analysis of CSFs ofquality practices in SMEs
TQM21,6
630
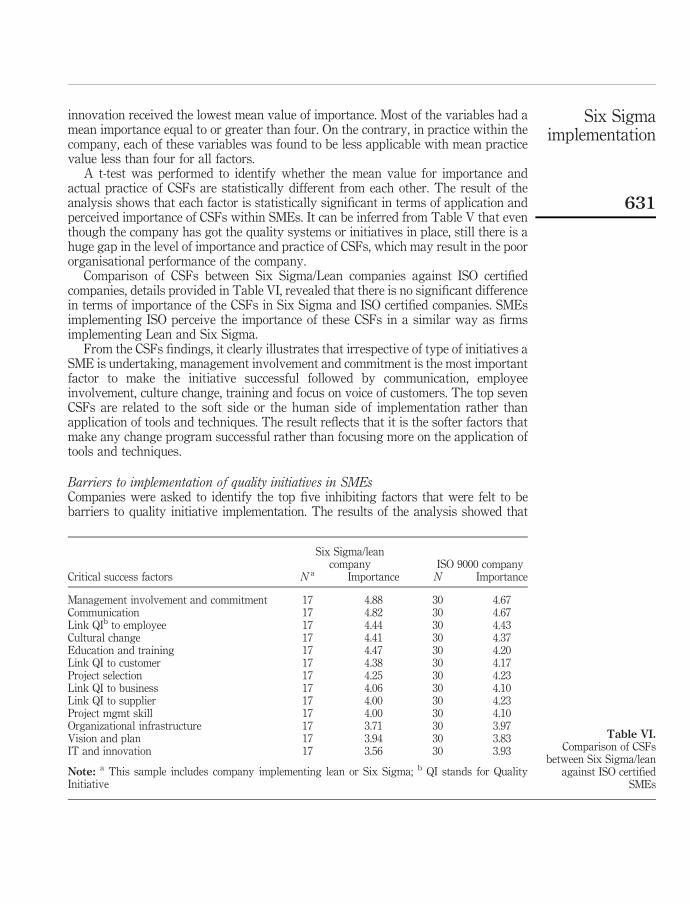
innovation received the lowest mean value of importance. Most of the variables had amean importance equal to or greater than four. On the contrary, in practice within thecompany, each of these variables was found to be less applicable with mean practicevalue less than four for all factors.
A t-test was performed to identify whether the mean value for importance andactual practice of CSFs are statistically different from each other. The result of theanalysis shows that each factor is statistically significant in terms of application andperceived importance of CSFs within SMEs. It can be inferred from Table V that eventhough the company has got the quality systems or initiatives in place, still there is ahuge gap in the level of importance and practice of CSFs, which may result in the poororganisational performance of the company.
Comparison of CSFs between Six Sigma/Lean companies against ISO certifiedcompanies, details provided in Table VI, revealed that there is no significant differencein terms of importance of the CSFs in Six Sigma and ISO certified companies. SMEsimplementing ISO perceive the importance of these CSFs in a similar way as firmsimplementing Lean and Six Sigma.
From the CSFs findings, it clearly illustrates that irrespective of type of initiatives aSME is undertaking, management involvement and commitment is the most importantfactor to make the initiative successful followed by communication, employeeinvolvement, culture change, training and focus on voice of customers. The top sevenCSFs are related to the soft side or the human side of implementation rather thanapplication of tools and techniques. The result reflects that it is the softer factors thatmake any change program successful rather than focusing more on the application oftools and techniques.
Barriers to implementation of quality initiatives in SMEsCompanies were asked to identify the top five inhibiting factors that were felt to bebarriers to quality initiative implementation. The results of the analysis showed that
Six Sigma/leancompany ISO 9000 company
Critical success factors N a Importance N Importance
Management involvement and commitment 17 4.88 30 4.67Communication 17 4.82 30 4.67Link QIb to employee 17 4.44 30 4.43Cultural change 17 4.41 30 4.37Education and training 17 4.47 30 4.20Link QI to customer 17 4.38 30 4.17Project selection 17 4.25 30 4.23Link QI to business 17 4.06 30 4.10Link QI to supplier 17 4.00 30 4.23Project mgmt skill 17 4.00 30 4.10Organizational infrastructure 17 3.71 30 3.97Vision and plan 17 3.94 30 3.83IT and innovation 17 3.56 30 3.93
Note: a This sample includes company implementing lean or Six Sigma; b QI stands for QualityInitiative
Table VI.Comparison of CSFs
between Six Sigma/leanagainst ISO certified
SMEs
Six Sigmaimplementation
631
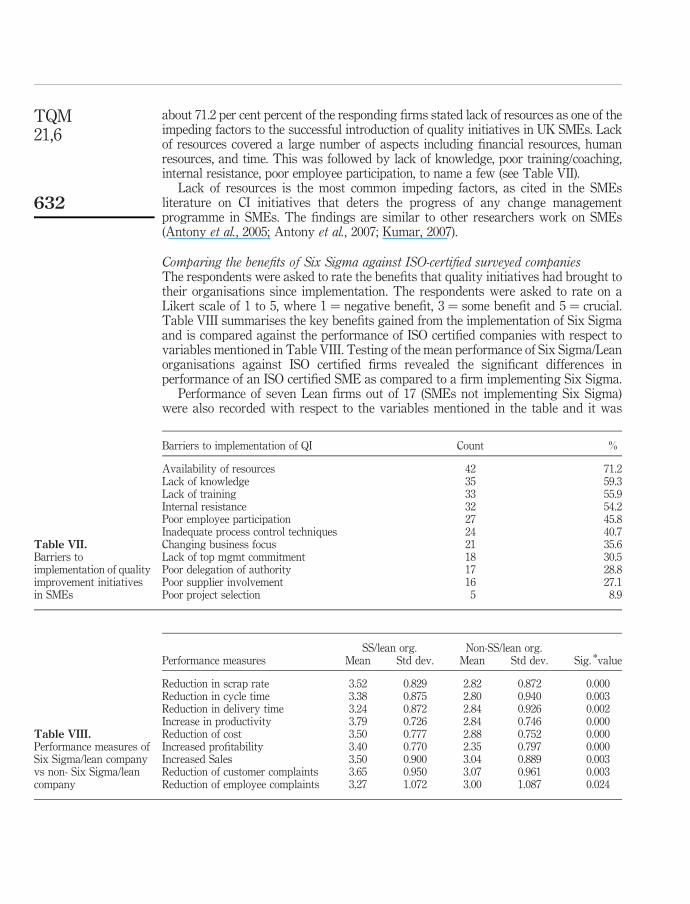
about 71.2 per cent percent of the responding firms stated lack of resources as one of theimpeding factors to the successful introduction of quality initiatives in UK SMEs. Lackof resources covered a large number of aspects including financial resources, humanresources, and time. This was followed by lack of knowledge, poor training/coaching,internal resistance, poor employee participation, to name a few (see Table VII).
Lack of resources is the most common impeding factors, as cited in the SMEsliterature on CI initiatives that deters the progress of any change managementprogramme in SMEs. The findings are similar to other researchers work on SMEs(Antony et al., 2005; Antony et al., 2007; Kumar, 2007).
Comparing the benefits of Six Sigma against ISO-certified surveyed companiesThe respondents were asked to rate the benefits that quality initiatives had brought totheir organisations since implementation. The respondents were asked to rate on aLikert scale of 1 to 5, where 1 ¼ negative benefit, 3 ¼ some benefit and 5 ¼ crucial.Table VIII summarises the key benefits gained from the implementation of Six Sigmaand is compared against the performance of ISO certified companies with respect tovariables mentioned in Table VIII. Testing of the mean performance of Six Sigma/Leanorganisations against ISO certified firms revealed the significant differences inperformance of an ISO certified SME as compared to a firm implementing Six Sigma.
Performance of seven Lean firms out of 17 (SMEs not implementing Six Sigma)were also recorded with respect to the variables mentioned in the table and it was
SS/lean org. Non-SS/lean org.Performance measures Mean Std dev. Mean Std dev. Sig. *value
Reduction in scrap rate 3.52 0.829 2.82 0.872 0.000Reduction in cycle time 3.38 0.875 2.80 0.940 0.003Reduction in delivery time 3.24 0.872 2.84 0.926 0.002Increase in productivity 3.79 0.726 2.84 0.746 0.000Reduction of cost 3.50 0.777 2.88 0.752 0.000Increased profitability 3.40 0.770 2.35 0.797 0.000Increased Sales 3.50 0.900 3.04 0.889 0.003Reduction of customer complaints 3.65 0.950 3.07 0.961 0.003Reduction of employee complaints 3.27 1.072 3.00 1.087 0.024
Table VIII.Performance measures ofSix Sigma/lean companyvs non- Six Sigma/leancompany
Barriers to implementation of QI Count %
Availability of resources 42 71.2Lack of knowledge 35 59.3Lack of training 33 55.9Internal resistance 32 54.2Poor employee participation 27 45.8Inadequate process control techniques 24 40.7Changing business focus 21 35.6Lack of top mgmt commitment 18 30.5Poor delegation of authority 17 28.8Poor supplier involvement 16 27.1Poor project selection 5 8.9
Table VII.Barriers toimplementation of qualityimprovement initiativesin SMEs
TQM21,6
632
revealed that the mean performance of these firms were above ISO certified SMEs butbelow firms implementing Lean and Six Sigma. This analysis gives an indication thatLean firms implementing Six Sigma have realised more benefits as compared to SMEsimplementing Lean on its own.
Six Sigma firms are performing much better on the operational metrics like reductionin scrap rate, cycle time, delivery time and increase in productivity. Even in the strategicmeasures of organisational performance, i.e. reduction in cost, increased profitability andincrease sales, Six Sigma and Lean firms out perform ISO certified SMEs.
ConclusionThis study presents the results of the survey conducted in UK manufacturing SMEs toinvestigate into their quality practices and measure its impact on the organisationalperformance of SMEs. Results of the survey revealed that factors critical to success ofquality initiatives are equal in importance, irrespective of type of initiatives implementedby the firm. Management Commitment and Strong Leadership is required to make anychange initiatives successful in the organisation. It should also be linked to employees interms of training, making resources available and establishing good communicationwith them. However, the operational and strategic performance metrics of SMEsimplementing Six Sigma differs significantly to a ISO certified companies. This gives anindication that Six Sigma is beneficial for all type of firm, irrespective of the size of thefirm. This statement needs to be further validated by conducting in-depth case-studies inSMEs implementing Six Sigma and compare with the performance of non-Six Sigmafirms. The second phase of this research project will address the aforementioned issues.
It is imperative for SMEs to have a strong management commitment and goodleadership skills before embarking on the programme. Research had shown that SixSigma initiative in many organisations have failed either due to lack of understandingof how to get started or due to failure to link the initiative to strategic business goalsand measurable objectives. Management in such organisations are weak and ofteninvolved in fire-fighting, paying inadequate attention to softer issues such asleadership, culture change, employees training and education. If Six Sigma is onlyconsidered as implementation of statistical tools and techniques to solve complexproblems in an organisation, it is doomed to fail due to its very weak linkage tostrategic business objectives.
References
Adams, C., Gupta, P. and Wilson, C. (2003), Six Sigma Deployment, Butterworth-Heinemann,Burlington, MA.
Antony, J. (2004), “Six Sigma in the UK service organisations: results from a pilot survey”,Managerial Auditing Journal, Vol. 19 No. 8, pp. 1006-13.
Antony, J. and Banuelas, R. (2002), “Key ingredients for the effective implementation of SixSigma program”, Measuring Business Excellence, Vol. 6 No. 4, pp. 20-7.
Antony, J. and Fergusson, C. (2004), “Six Sigma in the software industry: results from a pilotstudy”, Managerial Auditing Journal, Vol. 19 No. 8, pp. 1025-32.
Antony, J., Kumar, M. and Labib, A. (2007), “Gearing Six Sigma into UK manufacturing SMEs:an empirical assessment of critical success factors, impediments, and viewpoints of SixSigma implementation in SMEs”, Journal of Operations Research Society, doi:10.1057/palgrave.jors.2602437.
Six Sigmaimplementation
633
Antony, J., Kumar, M. and Madu, C.N. (2005), “Six Sigma in small and medium sized UKmanufacturing enterprises: some empirical observations”, International Journal of Quality& Reliability Management, Vol. 22 No. 8, pp. 860-74.
Caralli, R.A. (2004), “The critical success factor method: establishing a foundation for enterprisesecurity management”, Technical Report, CMU/SEI-2004-TR-010, Carnegie MellonSoftware Engineering Institute, Pittsburgh, PA.
China Service SMEs (2002), “Fact sheet”, available at: www.sitrends.org/facts/figure.asp?FIGURE_ID¼84 (accessed 30 January, 2008).
Daniel, R.H. (1961), “Management data crisis”, Harvard Business Review, September-October,pp. 111-2.
Desai, D.A. (2006), “Improving customer delivery commitments the Six Sigma way: case study ofan Indian small scale industry”, International Journal of Six Sigma and CompetitiveAdvantage, Vol. 2 No. 1, pp. 23-47.
DTI (2005), National Statistics, Statistical Press Release, available at: www.sbs.gov.uk/content/analytical/statistics/combinedsmestats.pdf (accessed 20 January, 2008).
European Commission (2003), “SME definition: Commission Recommendation of 06 May2003”,available at: http://ec.europa.eu/enterprise/enterprise_policy/sme_definition/index_en.htm (accessed 31 January 2008).
EUROSTAT (2003), “Competence development in SMEs”, Observatory of European SMEs,2003/1, Luxembourg.
Ghobadian, A. and Gallear, D.N. (1996), “Total quality management in SMEs”, Omega:International Journal of Management Science, Vol. 24 No. 1, pp. 83-106.
Goldstein, M.D. (2001), “Six Sigma program success factors”, Six Sigma Forum Magazine,November, pp. 36-45.
Grover, V., Jeong, S.R., Kettinger, W.J. and Teng, J.T.C. (1995), “The implementation of businessprocess reengineering”, Journal of Management Information Systems, Vol. 121, pp. 109-44.
Gupta, P. and Schultz, B. (2005), “Six Sigma success in small businesses”, Quality Digest, April 5,p. 2005.
Hamel, G. and Prahalad, C.K. (1994), Competing for the Future: Breakthrough Strategies forSeizing Control of Your Industry and Creating the Markets of Tomorrow, HarvardBusiness School Press, Boston, MA.
Henderson, K. and Evans, J. (2000), “Successful implementation of Six Sigma: benchmarkingGeneral Electric Company”, Benchmarking: An International Journal, Vol. 7, pp. 260-81.
Huxtable, N. (1995), Small Business Total Quality, Chapman & Hall, London.
Jayawarna, D., Wilson, A. and Homan, G. (2003), “The management development needs inmanufacturing SMEs: an empirical assessment”, MMU Working Paper Series, ManchesterMetropolitan University Business School, Manchester, December.
Kumar, M. (2007), “Critical success factors and hurdles to Six Sigma implementation: the case ofa UK manufacturing SME”, International Journal of Six Sigma and CompetitiveAdvantage, Vol. 3 No. 4, pp. 333-51.
Kumar, M., Antony, J., Singh, R.K., Tiwari, M.K. and Perry, D. (2006), “Implementing the LeanSigma Framework in an Indian SME: a case study”, Production Planning and Control,Vol. 17 No. 4, pp. 407-23.
Kuratko, D.F., Goodale, J.C. and Hornsby, J.S. (2001), “Quality practices for a competitiveadvantage in smaller firms”, Journal of Small Business Management, Vol. 39 No. 4,pp. 293-311.
TQM21,6
634
Lee, G.L. and Oakes, I. (1995), “The pros and cons of TQM for smaller forms in manufacturing:some experiences down the supply chain”, Total Quality Management, Vol. 6, pp. 413-26.
North, J., Blackburn, R.A. and Curran, J. (1998), The Quality Business, Routledge, New York, NY.
OECD (2000), Small and Medium-sized Enterprise: Local Strength, Global Reach, Policy Brief,Paris, June.
Process Quality Associates (2003), Six Sigma for SMEs, available at: www.pqa.net/sixsigma/(accessed August 5, 2007).
Rockart, J. (1979), “Chief executives define their own data needs”, Harvard Business Review,Vol. 57 No. 2, pp. 238-41.
Schwinn, D.R. (2003), “Six Sigma simplified for small organisation”, available at: www.qualityadvisor/library/six_sigma/ (accessed December 30, 2007).
Snee, R.D. (2004), “Six Sigma: the evolution of 100 years of business improvement methodology”,International Journal of Six Sigma and Competitive Advantage, Vol. 1 No. 1, pp. 4-20.
Snee, R.D. and Hoerl, R.W. (2003), Leading Six Sigma – A Step by Step Guide Based on Experienceat GE and Other Six Sigma Companies, FT Prentice-Hall, Englewood Cliffs, NJ.
Spanyi, A. and Wurtzel, M. (2003), “Six Sigma for the rest of us, Quality Digest”, available at:www.qualitydigest.com/july03/articles/01_articles.html (accessed 20 December, 2007).
Tennant, G. (2001), Six Sigma: SPC and TQM in Manufacturing and Services, AshgatePublishing, Aldershot.
Waxer, C. (2004), “Is Six Sigma just for large companies? What about small companies?”,Available at: www.isixsigma.com/library/content/ (accessed 22 December, 2007).
Wessel, G. and Burcher, P. (2004), “Six Sigma for small and medium-sized enterprises”, TheTQM Magazine, Vol. 16 No. 4, pp. 264-72.
Wiklund, H. and Wiklund, P.S. (2002), “Widening the Six Sigma concept: an approach to improveorganizational learning”, Total Quality Management, Vol. 132, pp. 233-9.
Yusof, S.M. and Aspinwall, E. (1999), “Critical success factors for total quality managementimplementation in small and medium enterprises”, Total Quality Management, Vol. 10Nos 4/5, pp. S803-9.
Corresponding authorJiju Antony can be contacted at: [email protected]
Six Sigmaimplementation
635
To purchase reprints of this article please e-mail: [email protected] visit our web site for further details: www.emeraldinsight.com/reprints
Book Review : Voice of the Customer: Capture and Analysis
The Reviewers
K. Narasimhan, Regional Advisor (India), The Emerald Group Publications, UK
RR 2009/1
Review Subject: Voice of the Customer: Capture and Analysis K.Yang
Publisher Name: McGraw-Hill
Place of Publication:
Publication Year: 2008
ISBN: 978-0-07-146544-1
Price: £53.99 (hardback)
Article type:Review
Pages: 427 pp.
Keywords:
Emerald Journal: The TQM Journal
Volume: 21
Number: 6
Year: 2009
pp. 636-637
Copyright: © Emerald Group Publishing Limited
ISSN: 1754-2731
Creating products and delivering services which customers consider of superior value (functional, psychological and/or of convenience) has become more important in this knowledge and global age. Capturing and analyzing voice of the customer (VOC) has become the vehicle for organizations irrespective of whether they are pursuing a technology push or market pull strategy. This book shows how to achieve this in practice with the aid of examples.
Kai Yang is the Executive Director of Enterprise Excellence Institute, Michigan, USA. He is also a Professor of Industrial and Manufacturing Engineering at Wayne State University, Detroit. He has wide experience in this field, and has co-authored the book Design for Six Sigma: A Roadmap for Product Development.
The book comprises 11 chapters and is well supported by 165 illustrations (106 figures and 59 tables) and 4 pages of references. Chapter 1 introduces the key concepts of value, innovation and the VOC and their inter-relationships. It also gives an overview of the rest of the chapters.
Chapter 2, the longest chapter (80 pages), deals with the product development process from opportunity identification to manufacturing process preparation in five stages. Concepts introduced include product life cycle cost, theory of inventive problem solving (TRIZ), quality function deployment (QFD), design of experiments, four domains (customer, functional, physical and process) in the design process, information and knowledge mining, value-stream mapping, and lean operation techniques (one-piece flow, work cells, and pull-based production).
Chapter 3 starts with a discussion of customer value and its components, before moving on to discussion on how to collect and analyze customer value data, how customer value changes over time, and how break-through products can be developed by capturing these changes. Finally, discusses how to link VOC information to product design specifics in a clear and precise manner.
The next two chapters respectively deal with quantitative and qualitative methods used for capturing the VOC. Topics covered in the quantitative methods to collect VOC data include types of customer surveys, TEN stages of customer survey, design of survey instruments, sampling methods and internet surveys. The latter chapter deals in some depth with ethnographic methods of answering “What do customers really want?” Useful case studies and examples are included.
Chapter 6 focuses on explaining how to analyze qualitative VOC data by methods such as “Affinity Diagram”, “Arrow diagrams”, to derive “Critical to customer satisfaction” metrics. It also briefly explains how to arrive at “Critical-to-Quality characteristics from the raw VOC data collected. Chapter 7 deals in depth the QFD methodology with clear and concrete examples.
The next three chapters deal respectively with the related topics of brand development, value engineering and TRIZ. The final chapter briefly covers some of the basic descriptive statistical methods, commonly used probability distribution models (normal, Binomial and Poisson), and process capability indices.
The mathematics involved in some chapters may put off readers averse to mathematics. A KJ Method (Affinity) diagram is very complicated and illegible and does not add any value. Overall, the book is a very well though out and a study of that really helps to acquire the skills necessary to develop products and services that will be appreciated and valued by a customer.
Book Review : Lean Six Sigma for Supply Chain Management: The 10-Step Solution Process
The Reviewers K. Narasimhan, Regional Advisor (India), The Emerald Group Publications, UK
RR 2009/2
Review Subject: Lean Six Sigma for Supply Chain Management: The 10-Step Solution Process J.W. Martin
Publisher Name: McGraw-Hill
Place of Publication:
Publication Year: 2007
ISBN: 0-07-147942-2
Price: £21.99 (hardback)
Article type:Review
Pages: 429 pp.
Keywords:
Emerald Journal: The TQM Journal
Volume: 21
Number: 6
Year: 2009
pp. 637-638
Copyright: © Emerald Group Publishing Limited
ISSN: 1754-2731
The book comprises ten chapters, two appendices and a comprehensive glossary. The first appendix contains important supply chain metrics and the second contains key lean six sigma (LSS) concepts, listed by chapters. The introduction explains the reasons for writing the book and its goals, and gives a synopsis of the ten chapters. The chapters commence with key objectives and end with a summary.
James W. Martin, a Master Black Belt and President of Six Sigma Integration, INC, a Lean Six Sigma Consulting firm, is an adjunct instructor at the Providence College Graduate School of Business, Rhode Island, USA. He has worked with diverse organizations including in retail sales, banking and insurance, and manufacturing.
Chapter 1 presents 20 (12 key supply chain operational and eight key financial) metrics that should be identified to ensure business alignment, prior to creating LSS improvement projects. It is emphasized that it is imperative to understand the importance of Voice-of-the-Customer and match that with the Voice-of-the-Business. A 10-step solution process (dealt in detail in the subsequent chapters) is also introduced.
Deploying LSS Projects using Lean Tools is the theme of Chapter 2; it shows how the sales and operating plan (S&OP) team facilitates the communication process. It also shows the importance and role of lead-

time in reducing supply chain costs that can account for 50 to 70 percent of an organization's budget; and briefly touches upon the various ways of reducing the lead-time. Lead-time reduction strategies are discussed in depth in Chapter 4, with the aid of value stream mapping. Chapter 3 deals with the concept of demand management, appropriate tools and methods (aggregating demand, forecasting models and errors) to accurately estimate demand.
Chapters 5 and 6 focus respectively on LSS applications to material requirement planning (MRP II) and how inventory models (fixed-order and make-to-order) are used to identify LSS projects to identify and eliminate excess and obsolete inventory investment. The concepts of “lean supply chain” and third-party logistics are first introduced in Chapter 7, and then the importance of integrating third-party suppliers into the LSS initiative is explained.
Chapter 8 shows how to arrive at the root cause of problems by applying LSS tools such as process flow charts, cause-and-effect diagrams, time series plots, etc. Some of the operations research methods like queuing analysis, linear programming, simulation, etc. are just touched upon. The application of these tools and methods are explained with the aid of an example from a distribution call center.
Chapter 9 explains the importance of conducting pilot studies to test the recommended solutions and reduce the risk of implementation by effectively communicating process changes based on facts.
The concluding chapter uses a simple inventory model (Microsoft Excel based) to show the relationships between key process input variables and key process output variables and their impact on inventory turns ratio and investment. Finally, 25 LSS supply chain applications are briefly discussed.
This book with 190 illustrations is of real use to practitioners and academics teaching supply chain management
Related Documents