Six Months Ended September 30, 2018 (FY2018) Results Briefing GS Yuasa Corporation November 20, 2018

Welcome message from author
This document is posted to help you gain knowledge. Please leave a comment to let me know what you think about it! Share it to your friends and learn new things together.
Transcript
Six Months Ended September 30, 2018 (FY2018)Results Briefing
GS Yuasa Corporation
November 20, 2018
目次
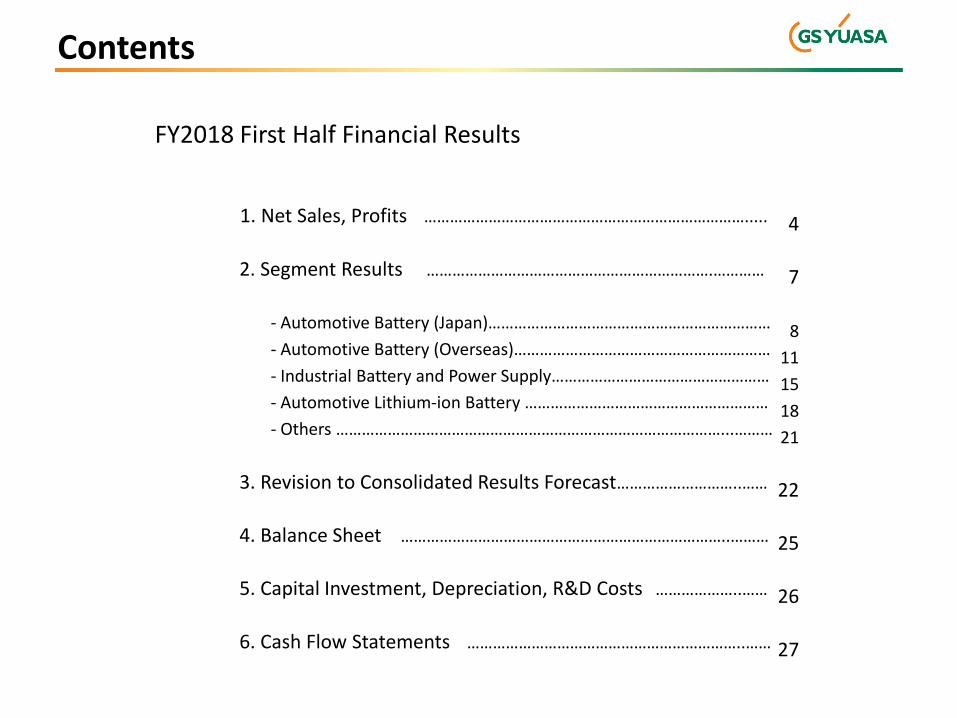
FY2018 First Half Financial Results
1. Net Sales, Profits ………………………………………………………………….....
2. Segment Results ………………………………………………………….…………
- Automotive Battery (Japan)…………………………………………………………
- Automotive Battery (Overseas)……………………………………………………
- Industrial Battery and Power Supply……………………………………………
- Automotive Lithium-ion Battery …………………………………………………
- Others ………………………………………………………………………………...………
3. Revision to Consolidated Results Forecast………………………..……
4. Balance Sheet …………………………………………………………………..………
5. Capital Investment, Depreciation, R&D Costs ………………..……
6. Cash Flow Statements ………………………………………………………..……
4
7
8
11
15
18
21
22
25
26
27
Contents
FY2018 First Half Financial Results

1. Net Sales, Profits
4
FY2017April-Sept
FY2018April-Sept
Change (YoY%)
Net Sales 184.2 195.4 +11.2 (+6.1%)
Operating income 6.0 7.0 +1.0 (+16.2%)
(Operating income ratio) 3.2% 3.6% +0.4P
Operating income before amortization of goodwill 7.1 8.2 +1.1(Operating income ratio before amortization of goodwill) 3.8% 4.2% +0.4P
Ordinary income 6.4 7.5 +1.1 (+16.2%)
Extraordinary income 0.1 0.2 +0.1Extraordinary loss 0.1 0.3 +0.2
Profit before income taxes 6.5 7.5 +1.0Income taxes 2.6 2.7 +0.1Profit attributable to non-controlling interests 1.3 1.3 -0.0Profit attributable to owners of parent 2.5 3.5 +1.0 (+35.5%)(Net profit ratio) 1.4% 1.8% +0.4P
Profit attributable to owners of parent before amortization of goodwill 3.7 4.8 +1.1(Net profit ratio before amortization of goodwill) 2.0% 2.4% +0.4P
Interim dividend (yen/share) 3 yen 3 yen ±0.0
(Billion yen)
Record
1. Net Sales, Profits
5
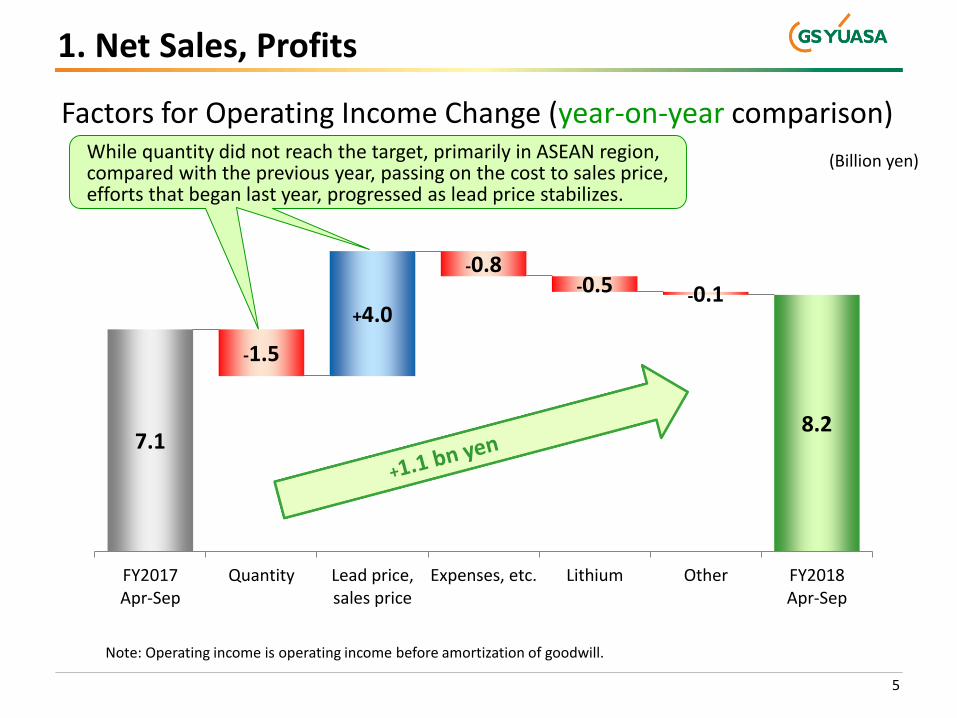
Factors for Operating Income Change (year-on-year comparison)
(Billion yen)
7.1
-1.5
+4.0
-0.8-0.5
-0.1
8.2
FY2017Apr-Sep
Quantity Lead price,sales price
Expenses, etc. Lithium Other FY2018Apr-Sep
Note: Operating income is operating income before amortization of goodwill.
While quantity did not reach the target, primarily in ASEAN region, compared with the previous year, passing on the cost to sales price, efforts that began last year, progressed as lead price stabilizes.

1. Net Sales, Profits
6
Factors for Operating Income Change (comparison w/ plan)
7.3
-4.4+2.6
+3.2
-0.8 +0.3
8.2
FY2018Apr-Sep
Quantity Lead price,sales price
Expenses, etc. Lithium Other FY2018Apr-Sep
Note: Operating income is operating income before amortization of goodwill.
On the other hand, lead price was lower than the assumption in comparison with the plan and did not reach the estimation in which the quantity was set high primarily in China.
(Initial forecast)
(Billion yen)

2. Segment Results
7
FY2017Apr-Sep
FY2018Apr-Sep
Change
Net sales
Operating income
(Op. income ratio: %)
Net sales
Operating income
(Op. income ratio: %)
Net sales
Operating income
(Op. income ratio: P)
Automotive Battery
Japan 39.3 2.0(5.2)
41.4 2.7(6.4)
+2.1 +0.7(+1.2)
Overseas 87.7 3.8(4.3)
92.6 5.0(5.4)
+4.9 +1.2(+1.1)
Industrial Battery and Power Supply
30.5 1.1(3.6)
29.3 0.6(2.1)
-1.2 -0.5(-1.5)
Automotive Lithium-ion Battery
19.6 0.2(1.1)
22.0 -0.3(-1.3)
+2.4 -0.5(-2.4)
Others 7.1 -0.1(-1.3)
10.1 0.3(2.8)
+3.0 +0.4(+4.1)
Total 184.2 7.1(3.8)
195.4 8.2(4.2)
+11.2 +1.1(+0.4)
Note: Operating income is operating income before amortization of goodwill and operating income ratio is operating income ratio before amortization of goodwill.
(Billion yen)
2. Segment Results
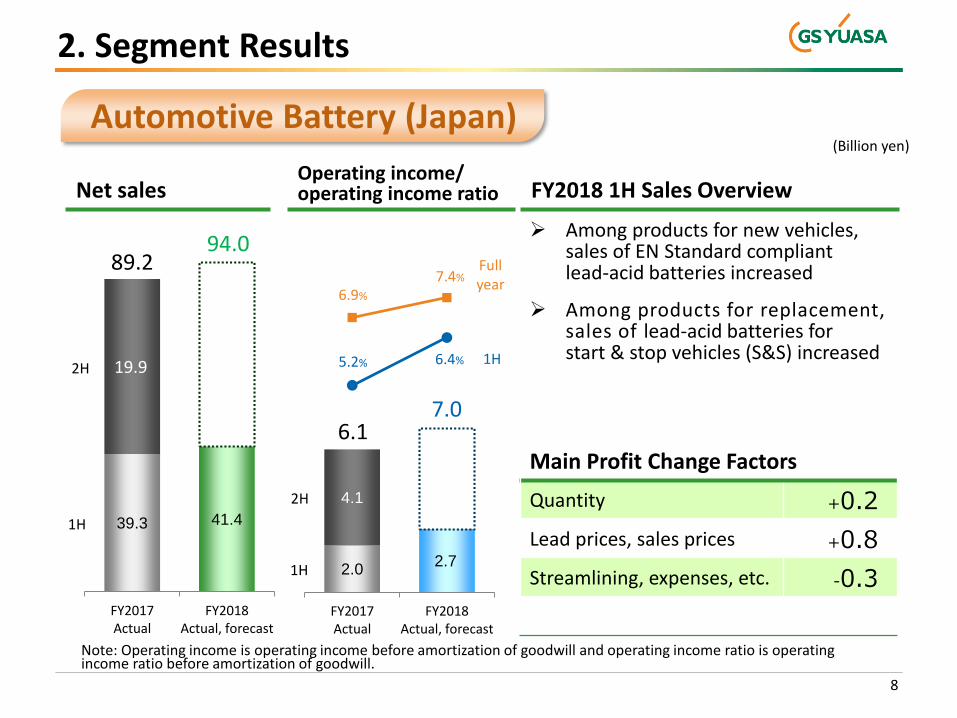
8
39.3 41.4
19.9
FY2017Actual
FY2018Actual, forecast
89.294.0
2.02.7
4.1
FY2017Actual
FY2018Actual, forecast
6.17.0
Main Profit Change Factors
Quantity +0.2
Lead prices, sales prices +0.8
Streamlining, expenses, etc. -0.3
➢ Among products for new vehicles, sales of EN Standard compliantlead-acid batteries increased
➢ Among products for replacement, sales of lead-acid batteries forstart & stop vehicles (S&S) increased
2H
1H
2H
1H
Net salesOperating income/ operating income ratio FY2018 1H Sales Overview
Note: Operating income is operating income before amortization of goodwill and operating income ratio is operating income ratio before amortization of goodwill.
7.4%
6.9%
6.4%5.2%
Full year
1H
Automotive Battery (Japan)(Billion yen)

2. Segment Results
9
Growing demand for lead-acid batteries for S&S vehicles,EN Standard compliant batteries
FY20171H
FY20181H
FY2017Full year
FY2018Full-year(foreast)
➢ Lead-acid batteries for S&S vehicles have been maintaining a high level
➢ Manufacturers and models adoptingEN Standard compliant batteries have been expanding
Expand market share for batteries for new vehicles
FY20171H
FY20181H
FY2017Full year
FY2018Full-year(foreast)
➢ Replacement of lead-acid batteries for S&S vehicles has been steadily expanding
Raise profitability by improving product mix
EN
S&S
General
S&S
General
20%15%
20%15%
20%10%
40%40%
15%10%
40%40%
New vehicleshipment ratio
Replacement shipment ratio
EN
S&S
General
S&S
General
Automotive Battery (Japan)
2. Segment Results
10
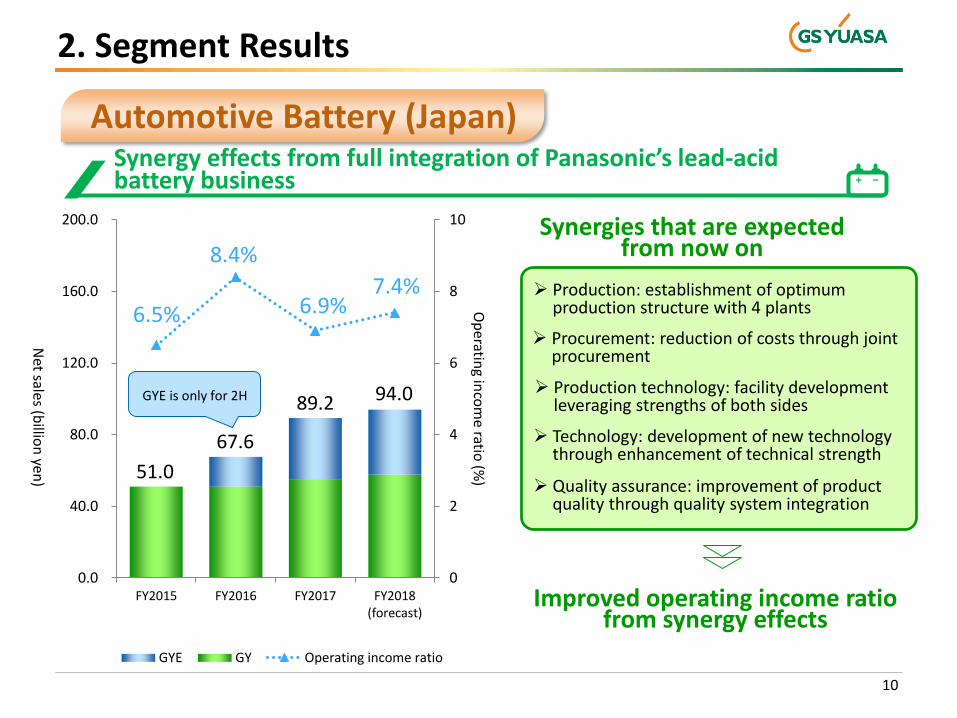
Synergy effects from full integration of Panasonic’s lead-acid battery business
Synergies that are expected from now on
Improved operating income ratio from synergy effects
6.5%
8.4%
6.9%7.4%
0
2
4
6
8
10
0.0
40.0
80.0
120.0
160.0
200.0
FY2015 FY2016 FY2017 FY2018(forecast)
Op
erating in
com
e ratio (%
)
Net sales (b
illion
yen)
GYE GY Operating income ratio
GYE is only for 2H
51.0
67.6
89.2 94.0
➢ Production: establishment of optimum production structure with 4 plants
➢ Procurement: reduction of costs through joint procurement
➢ Production technology: facility development leveraging strengths of both sides
➢ Technology: development of new technology through enhancement of technical strength
➢ Quality assurance: improvement of product quality through quality system integration
Automotive Battery (Japan)
2. Segment Results
11
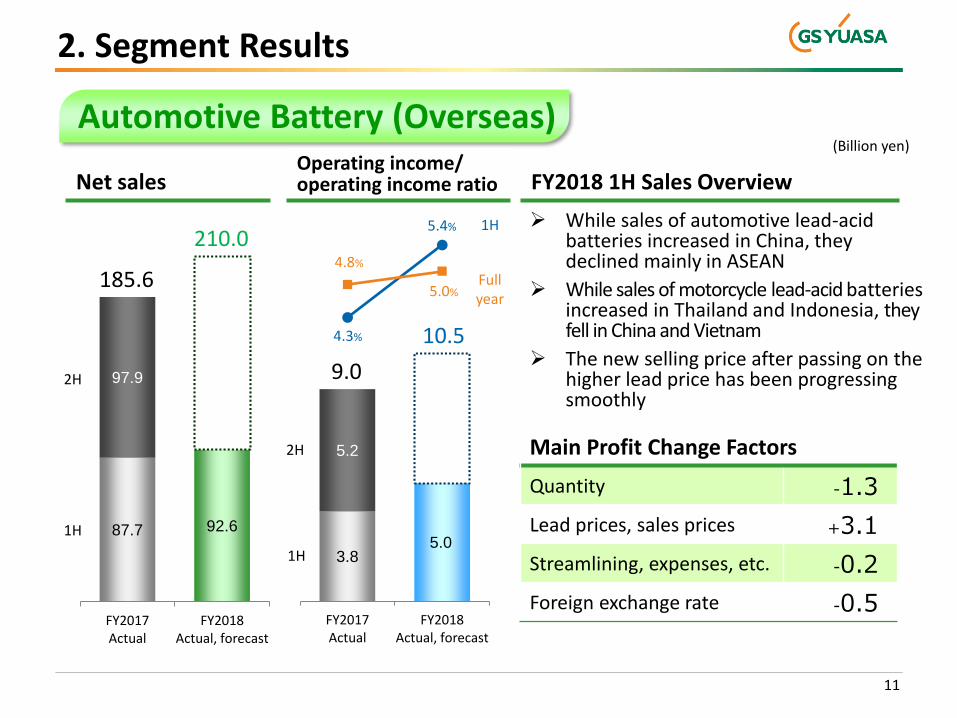
Main Profit Change Factors
Quantity -1.3
Lead prices, sales prices +3.1
Streamlining, expenses, etc. -0.2
Foreign exchange rate -0.5
➢ While sales of automotive lead-acid batteries increased in China, they declined mainly in ASEAN
➢ While sales of motorcycle lead-acid batteries increased in Thailand and Indonesia, they fell in China and Vietnam
➢ The new selling price after passing on the higher lead price has been progressing smoothly
87.7 92.6
97.9
FY2017Actual
FY2018Actual, forecast
185.6
210.0
2H
1H
3.85.0
5.2
FY2017Actual
FY2018Actual, forecast
9.0
10.5
2H
1H
5.0%
4.8%
5.4%
4.3%
Full year
1H
Automotive Battery (Overseas)
FY2018 1H Sales OverviewNet salesOperating income/ operating income ratio
(Billion yen)

2. Segment Results
12
Demand of lead-acid batteries for S&S vehicles (EFB) in China
0%
10%
20%
30%
40%
50%
60%
70%
80%
90%
100%
2013 2014 2015 2016 2017 2018 2019 2020
Other
EFB
*Figures for 2018 onwards are estimates
Sales ratio of batteries for S&S(Chinese new vehicle market)
*1 EFB (enhanced flooded battery): flooded lead-acid batteries for S&S vehicles
➢ Change in needs from AGM*2 to S&S(EFB) in China, the world’s largest market
➢ Increase in demand for S&S (EFB*1)vehicles due to the tightening of exhaust gas regulations
Trend in the Chinese market
*2 AGM (absorbed glass mat) batteries: VRLA (valve regulated lead-acid) battery using glass mat separator
Automotive Battery (Overseas)
To enhance the production capacity of the Tianjin plant and the Shunde plant,
Guangdong Province, and supply batteries for S&S vehicles (EFB) to the whole of China from the Northern and Southern bases
on a priority basis
2. Segment Results
13
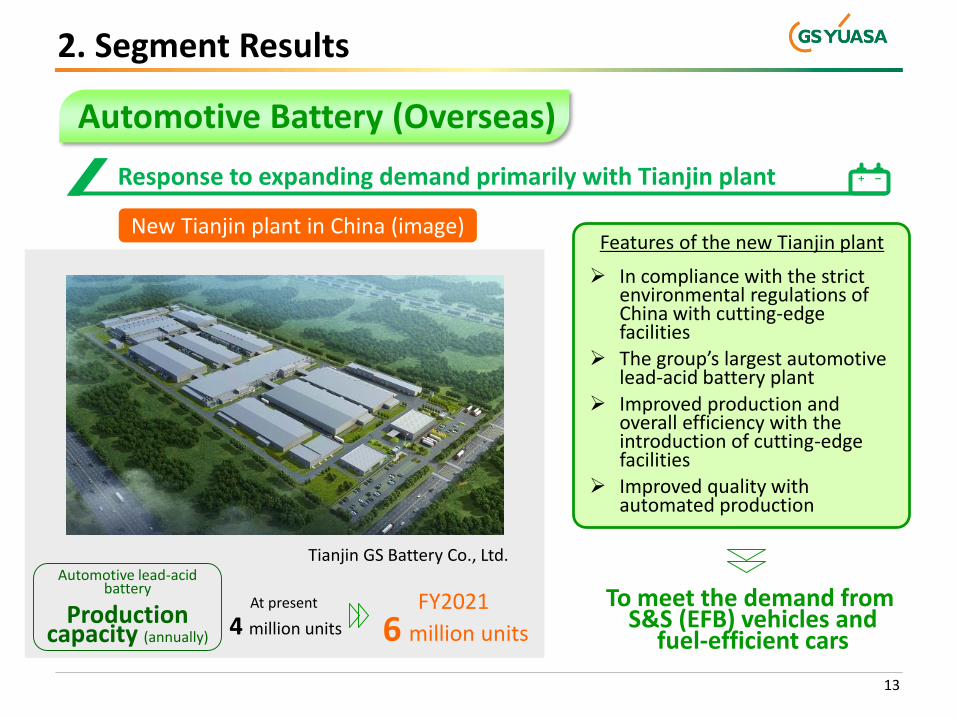
Response to expanding demand primarily with Tianjin plant
FY2021
6 million units
At present
4 million unitsProduction
capacity (annually)
Automotive lead-acid battery
New Tianjin plant in China (image)Features of the new Tianjin plant
To meet the demand fromS&S (EFB) vehicles and
fuel-efficient cars
➢ In compliance with the strict environmental regulations of China with cutting-edge facilities
➢ The group’s largest automotive lead-acid battery plant
➢ Improved production and overall efficiency with the introduction of cutting-edge facilities
➢ Improved quality with automated production
Tianjin GS Battery Co., Ltd.
Automotive Battery (Overseas)
2. Segment Results
14
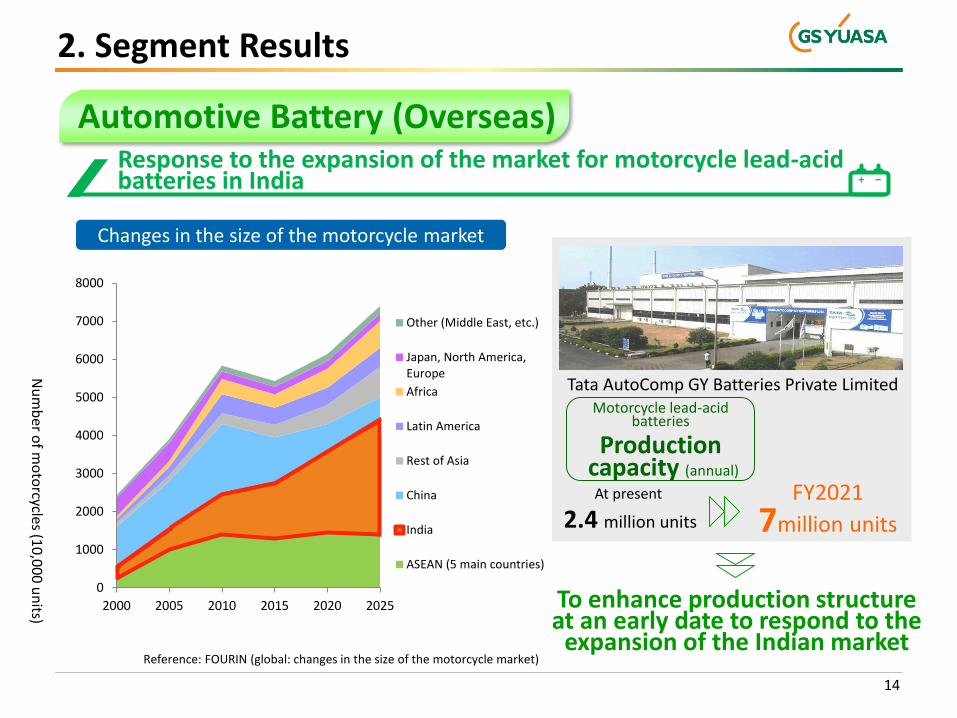
Response to the expansion of the market for motorcycle lead-acid batteries in India
0
1000
2000
3000
4000
5000
6000
7000
8000
2000 2005 2010 2015 2020 2025
Nu
mb
er of m
oto
rcycles (10
,00
0 u
nits)
Other (Middle East, etc.)
Japan, North America,Europe
Africa
Latin America
Rest of Asia
China
India
ASEAN (5 main countries)
Changes in the size of the motorcycle market
Reference: FOURIN (global: changes in the size of the motorcycle market)
FY2021
7million units
At present
2.4 million units
Production capacity (annual)
Motorcycle lead-acid batteries
To enhance production structure at an early date to respond to the
expansion of the Indian market
Tata AutoComp GY Batteries Private Limited
Automotive Battery (Overseas)

2. Segment Results
15
Industrial Battery and Power Supply
➢ Sales of lead-acid batteries for battery-operated forklifts remained strong
➢ Sales of backup lead-acid batteries decreased
➢ Transferred the specialized equipment business
Main Profit Change Factors
Quantity -0.4
Lead prices, sales prices +0.2
Streamlining, expenses, etc. -0.3
30.5 29.3
43.7
FY2017Actual
FY2018Actual, forecast
74.2 75.5
2H
1H
1.1 0.6
6.3
FY2017Actual
FY2018Actual, forecast
7.4 7.5
2H
1H
9.9%9.9%
2.1%
3.6%
Full year
1H
FY2018 1H Sales OverviewNet saleOperating income/ operating income ratio
(Billion yen)

2. Segment Results
16
We won the order for one of the world’s largest storage battery facility to be installed in Hokkaido (Toyotomi-cho)
➢ Expansion of global energy demand
➢ Effective utilization of renewable energy
➢ Need for storage battery system that stabilizes power output fluctuation
Storage battery system in wind power generation
Introduction of the world’s largest storage battery
(output: 240MW, capacity: 720MWh)
=LiB sufficient for 45,000 vehicles
EV
This project contributes to SDGs* through introduction of the storage batterysystem to stabilize output fluctuation to effectively utilize renewable energy.Through such initiatives, GS Yuasa Group will also realize sustainable growth.
*SDGs is abbreviation of Sustainable Development Goals adopted by the United Nations in September 2015.
Wind power generation Power system
Power output Composite output
Ch
arge
Disch
arge
Substation facility
Storage battery system
Lithium-ion battery facility (Capacity: 720MWh)
Remote storage battery
monitoring system
Storage battery control system
Supply scope of GS Yuasa
Industrial Battery and Power Supply
2. Segment Results
17
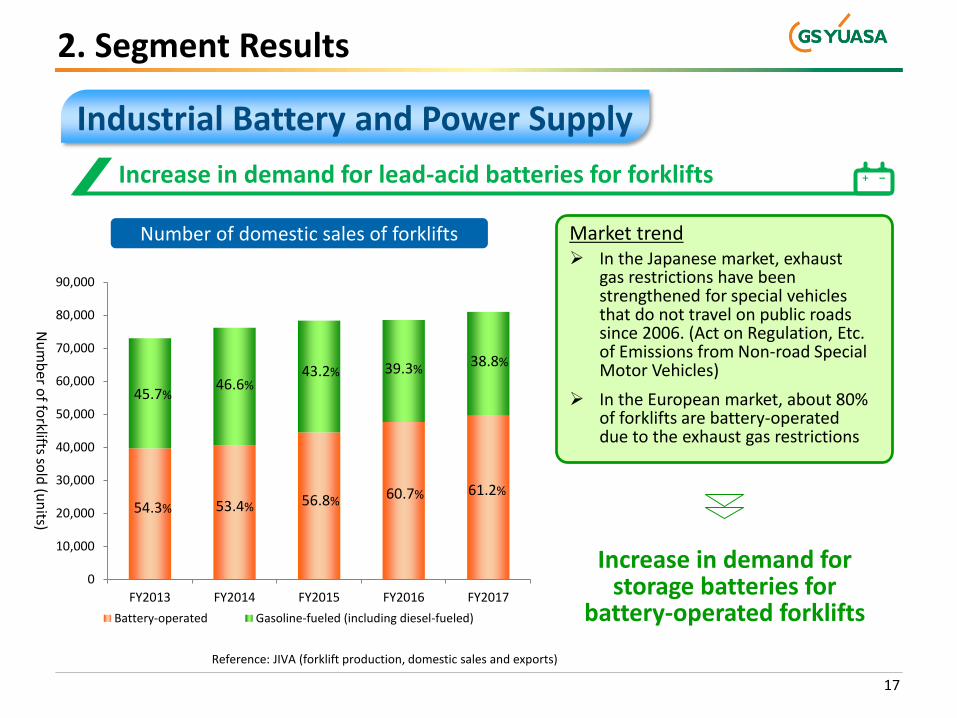
Increase in demand for lead-acid batteries for forklifts
0
10,000
20,000
30,000
40,000
50,000
60,000
70,000
80,000
90,000
FY2013 FY2014 FY2015 FY2016 FY2017
Nu
mb
er of fo
rklifts sold
(un
its)
Battery-operated Gasoline-fueled (including diesel-fueled)
Number of domestic sales of forklifts➢ In the Japanese market, exhaust
gas restrictions have been strengthened for special vehicles that do not travel on public roads since 2006. (Act on Regulation, Etc. of Emissions from Non-road Special Motor Vehicles)
Market trend
Reference: JIVA (forklift production, domestic sales and exports)
Increase in demand for storage batteries for
battery-operated forklifts
➢ In the European market, about 80% of forklifts are battery-operated due to the exhaust gas restrictions
54.3% 53.4% 56.8%60.7% 61.2%
45.7%46.6%
43.2% 39.3%38.8%
Industrial Battery and Power Supply
2. Segment Results
18
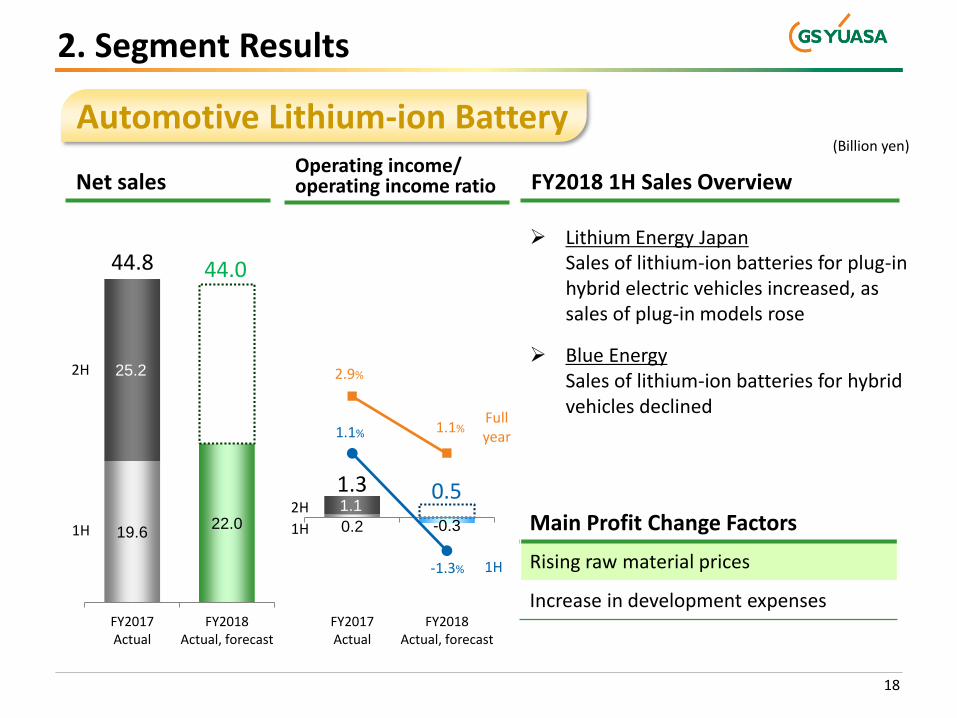
19.622.0
25.2
FY2017Actual
FY2018Actual, forecast
44.8 44.0
0.2 -0.3
1.1
FY2017Actual
FY2018Actual, forecast
1.3 0.5
Main Profit Change Factors
Rising raw material prices
Increase in development expenses
➢ Lithium Energy Japan Sales of lithium-ion batteries for plug-in hybrid electric vehicles increased, as sales of plug-in models rose
➢ Blue EnergySales of lithium-ion batteries for hybrid vehicles declined
2H
1H
2H
1H
-1.3%
1.1% 1.1%
2.9%
Full year
1H
Net sales FY2018 1H Sales Overview
Automotive Lithium-ion Battery(Billion yen)
Operating income/ operating income ratio
2. Segment Results
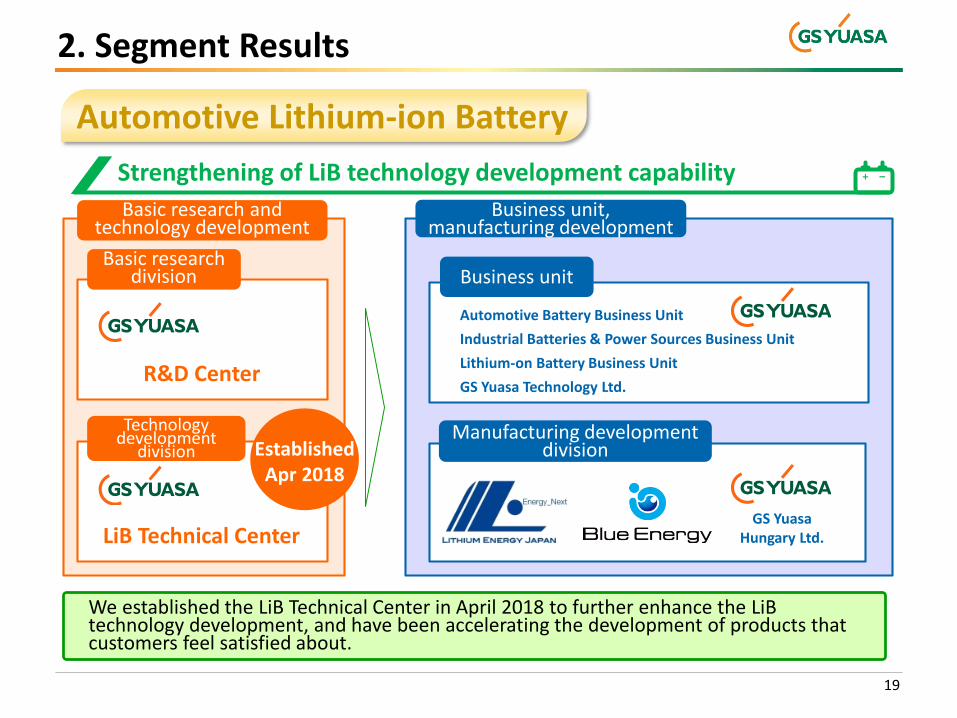
Strengthening of LiB technology development capability
Basic research and technology development
Business unit,manufacturing development
Basic research division
R&D Center
Manufacturing development division
Business unit
Automotive Battery Business Unit
Industrial Batteries & Power Sources Business Unit
Lithium-on Battery Business Unit
GS Yuasa Technology Ltd.
We established the LiB Technical Center in April 2018 to further enhance the LiBtechnology development, and have been accelerating the development of products that customers feel satisfied about.
GS Yuasa Hungary Ltd.
Technology development
division
LiB Technical Center
19
Established Apr 2018
Automotive Lithium-ion Battery
2. Segment Results
20
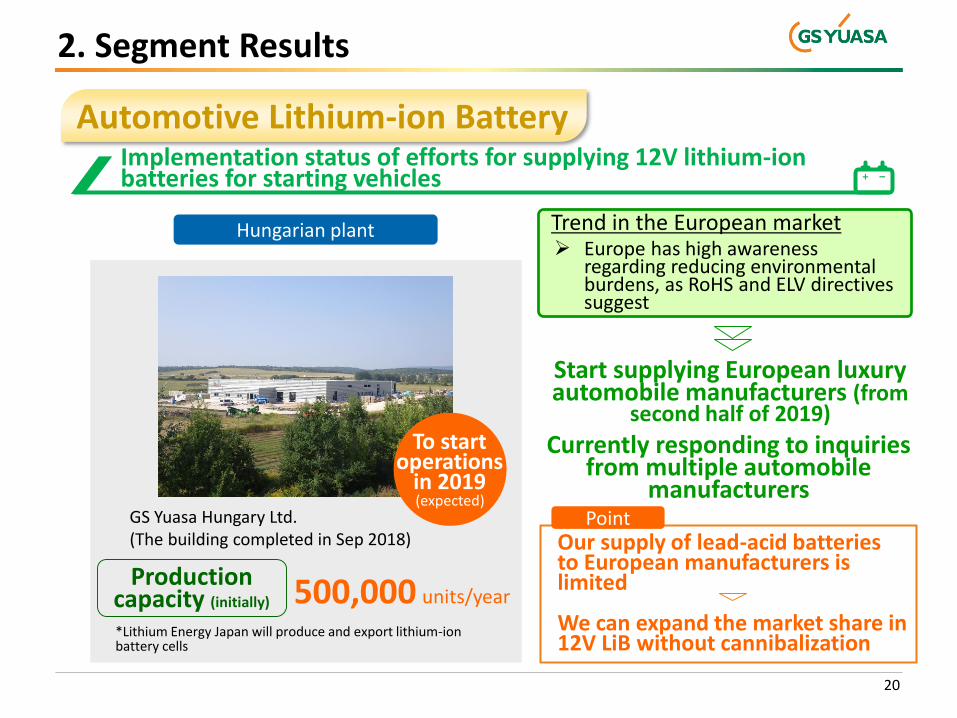
Implementation status of efforts for supplying 12V lithium-ion batteries for starting vehicles
500,000 units/yearProduction
capacity (initially)
Trend in the European market➢ Europe has high awareness
regarding reducing environmental burdens, as RoHS and ELV directives suggest
Our supply of lead-acid batteries to European manufacturers is limited
GS Yuasa Hungary Ltd.(The building completed in Sep 2018)
Start supplying European luxury automobile manufacturers (from
second half of 2019)
Currently responding to inquiries from multiple automobile
manufacturers
*Lithium Energy Japan will produce and export lithium-ion battery cells
Hungarian plant
We can expand the market share in 12V LiB without cannibalization
Point
To start operations
in 2019(expected)
Automotive Lithium-ion Battery
2. Segment Results
21
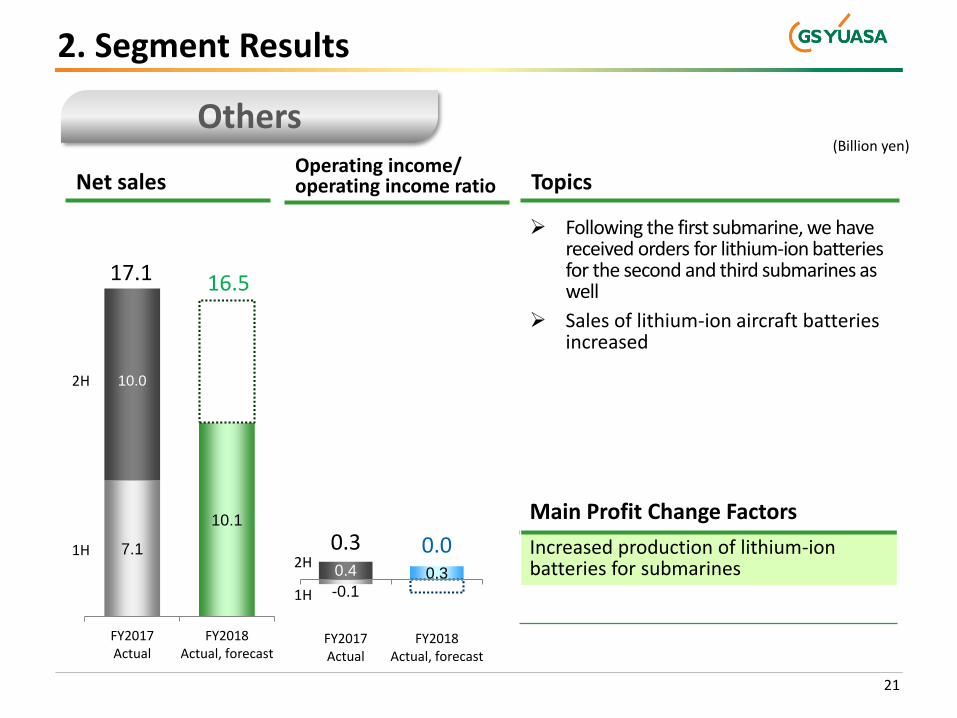
Others
7.1
10.1
10.0
FY2017Actual
FY2018Actual, forecast
17.1 16.5
-0.10.30.4
FY2017Actual
FY2018Actual, forecast
0.0
2H
1H2H
1H
0.3
Main Profit Change Factors
Increased production of lithium-ion batteries for submarines
➢ Following the first submarine, we have received orders for lithium-ion batteries for the second and third submarines as well
➢ Sales of lithium-ion aircraft batteries increased
(Billion yen)
Net sales TopicsOperating income/ operating income ratio

3. Revision to Consolidated Results Forecast
22
FY2017Actual
FY2018Initial
forecast
FY2018Revised forecast
Change(Revised-Initial)
Net sales 411.0 450.0 440.0 -10.0
Operating income 21.9 22.0 23.0 +1.0(Operating income ratio) 5.3% 4.9% 5.2% +0.3P
Operating income before amortization of goodwill 24.1 24.5 25.5 +1.0(Operating income ratio before amortization of goodwill) 5.9% 5.4% 5.8% +0.4P
Ordinary income 21.4 23.0 24.0 +1.0Profit attributable to owners of parent 11.4 13.0 14.0 +1.0(Net profit ratio) 2.8% 2.9% 3.2% +0.3P
Profit attributable to owners of parent before amortization of goodwill
13.9 15.5 16.5 +1.0(Net profit ratio before amortization of goodwill) 3.4% 3.4% 3.8% +0.4P
Conditions
Domestic lead price quote ¥323,500/t ¥340,000/t ¥340,000/t ±0
LME 2,318US$/t 2,500US$/t 2,500US$/t ±0
Exchange rate ¥112.04/US$ ¥110.0/US$ ¥110.0/US$ ±0
Record
Record
Record
3. Revision to Consolidated Results Forecast
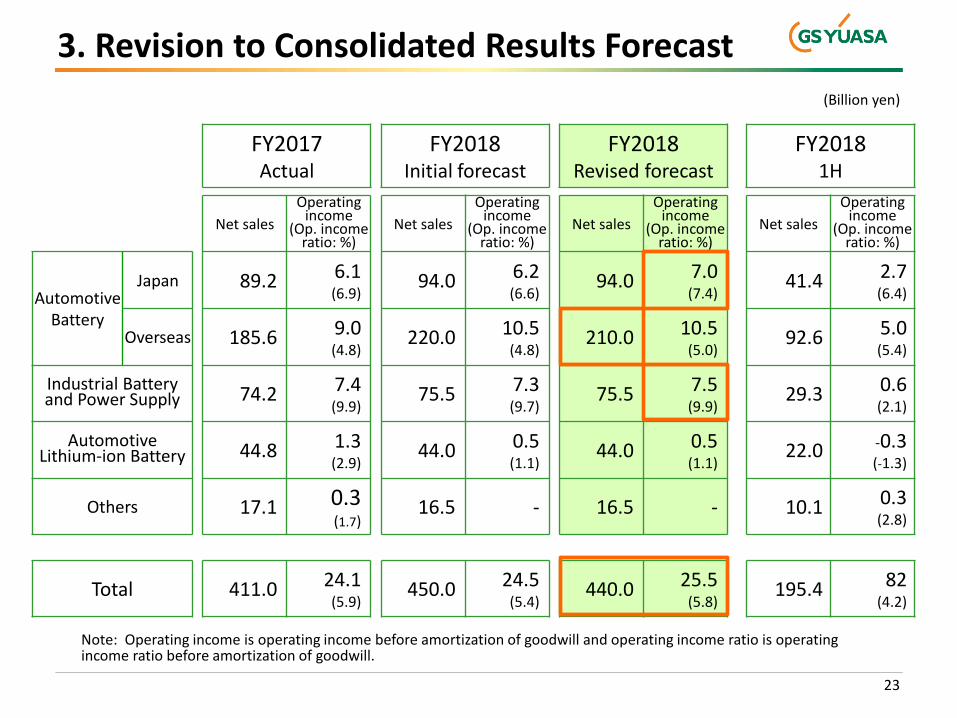
23
FY2017Actual
FY2018Initial forecast
FY2018Revised forecast
FY20181H
Net sales
Operating income
(Op. income ratio: %)
Net sales
Operating income
(Op. income ratio: %)
Net sales
Operating income
(Op. income ratio: %)
Net sales
Operating income
(Op. income ratio: %)
Automotive Battery
Japan 89.2 6.1(6.9)
94.0 6.2(6.6)
94.0 7.0(7.4)
41.4 2.7(6.4)
Overseas 185.6 9.0(4.8)
220.0 10.5(4.8)
210.0 10.5(5.0)
92.6 5.0(5.4)
Industrial Battery and Power Supply 74.2 7.4
(9.9)75.5 7.3
(9.7)75.5 7.5
(9.9)29.3 0.6
(2.1)
Automotive Lithium-ion Battery 44.8 1.3
(2.9)44.0 0.5
(1.1)44.0 0.5
(1.1)22.0 -0.3
(-1.3)
Others 17.1 0.3(1.7)
16.5 - 16.5 - 10.1 0.3(2.8)
Total 411.0 24.1(5.9)
450.0 24.5(5.4)
440.0 25.5(5.8)
195.4 82(4.2)
Note: Operating income is operating income before amortization of goodwill and operating income ratio is operating income ratio before amortization of goodwill.
(Billion yen)
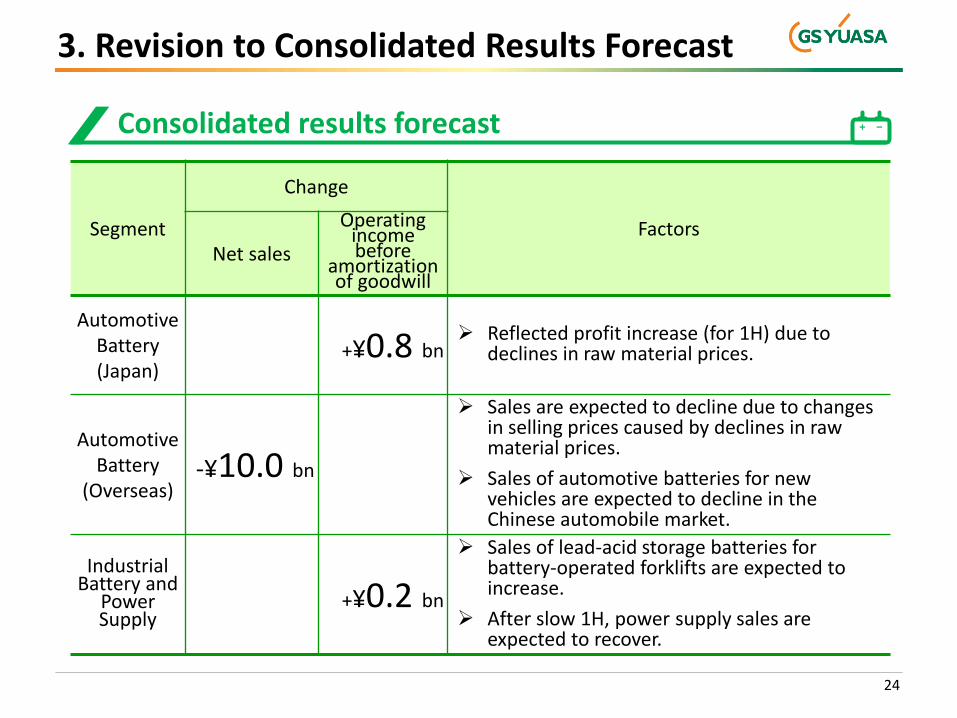
3. Revision to Consolidated Results Forecast
24
Segment
Change
FactorsNet sales
Operating income before
amortization of goodwill
Automotive Battery (Japan)
+¥0.8 bn➢ Reflected profit increase (for 1H) due to
declines in raw material prices.
Automotive Battery
(Overseas)-¥10.0 bn
➢ Sales are expected to decline due to changes in selling prices caused by declines in raw material prices.
➢ Sales of automotive batteries for new vehicles are expected to decline in the Chinese automobile market.
Industrial Battery and
Power Supply
+¥0.2 bn
➢ Sales of lead-acid storage batteries for battery-operated forklifts are expected to increase.
➢ After slow 1H, power supply sales are expected to recover.
Consolidated results forecast
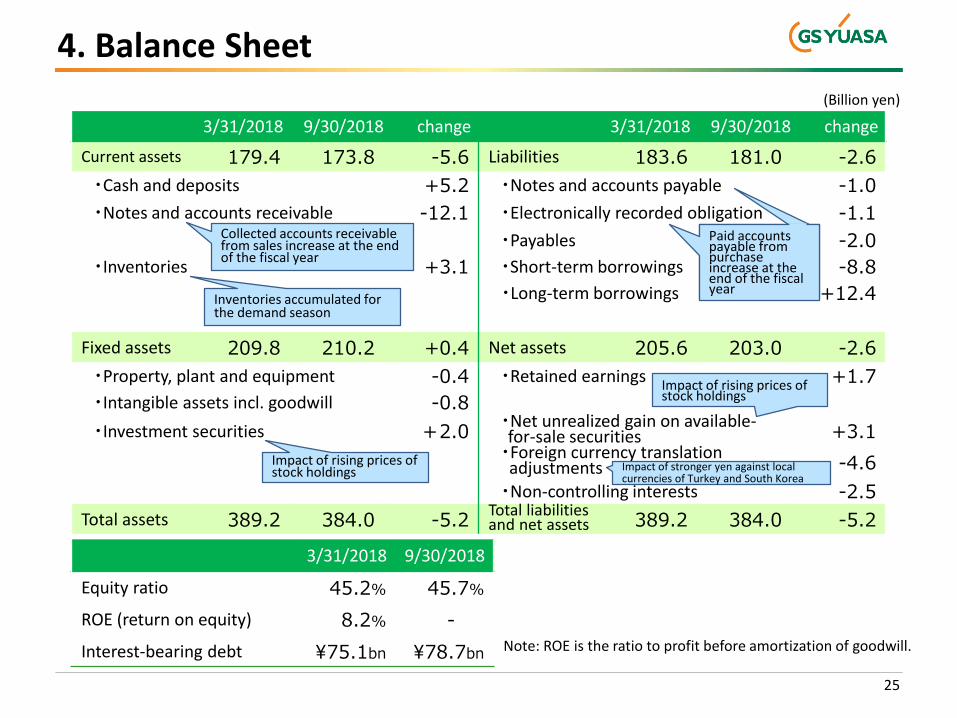
4. Balance Sheet
25
3/31/2018 9/30/2018 change 3/31/2018 9/30/2018 change
Current assets 179.4 173.8 -5.6 Liabilities 183.6 181.0 -2.6
・Cash and deposits +5.2 ・Notes and accounts payable -1.0
・Notes and accounts receivable -12.1 ・Electronically recorded obligation -1.1
・Payables -2.0
・Inventories +3.1 ・Short-term borrowings -8.8
・Long-term borrowings +12.4
Fixed assets 209.8 210.2 +0.4 Net assets 205.6 203.0 -2.6
・Property, plant and equipment -0.4 ・Retained earnings +1.7
・Intangible assets incl. goodwill -0.8
・Investment securities +2.0・Net unrealized gain on available-for-sale securities +3.1・Foreign currency translation
adjustments -4.6
・Non-controlling interests -2.5
Total assets 389.2 384.0 -5.2Total liabilities and net assets 389.2 384.0 -5.2
3/31/2018 9/30/2018
Equity ratio 45.2% 45.7%
ROE (return on equity) 8.2% -
Interest-bearing debt ¥75.1bn ¥78.7bn
Impact of stronger yen against local currencies of Turkey and South Korea
Note: ROE is the ratio to profit before amortization of goodwill.
Collected accounts receivable from sales increase at the end of the fiscal year
Inventories accumulated for the demand season
Impact of rising prices of stock holdings
Impact of rising prices of stock holdings
Paid accounts payable from purchase increase at the end of the fiscal year
(Billion yen)
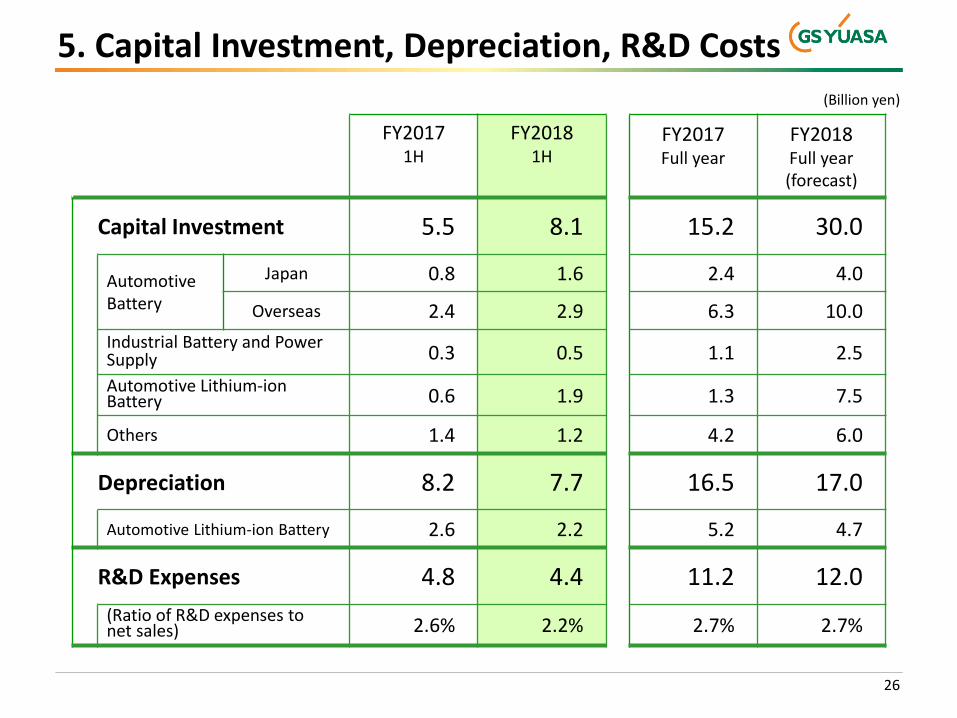
5. Capital Investment, Depreciation, R&D Costs
26
FY20171H
FY20181H
FY2017Full year
FY2018Full year(forecast)
Capital Investment 5.5 8.1 15.2 30.0
Automotive Battery
Japan 0.8 1.6 2.4 4.0
Overseas 2.4 2.9 6.3 10.0
Industrial Battery and Power Supply 0.3 0.5 1.1 2.5
Automotive Lithium-ion Battery 0.6 1.9 1.3 7.5
Others 1.4 1.2 4.2 6.0
Depreciation 8.2 7.7 16.5 17.0
Automotive Lithium-ion Battery 2.6 2.2 5.2 4.7
R&D Expenses 4.8 4.4 11.2 12.0
(Ratio of R&D expenses to net sales) 2.6% 2.2% 2.7% 2.7%
(Billion yen)
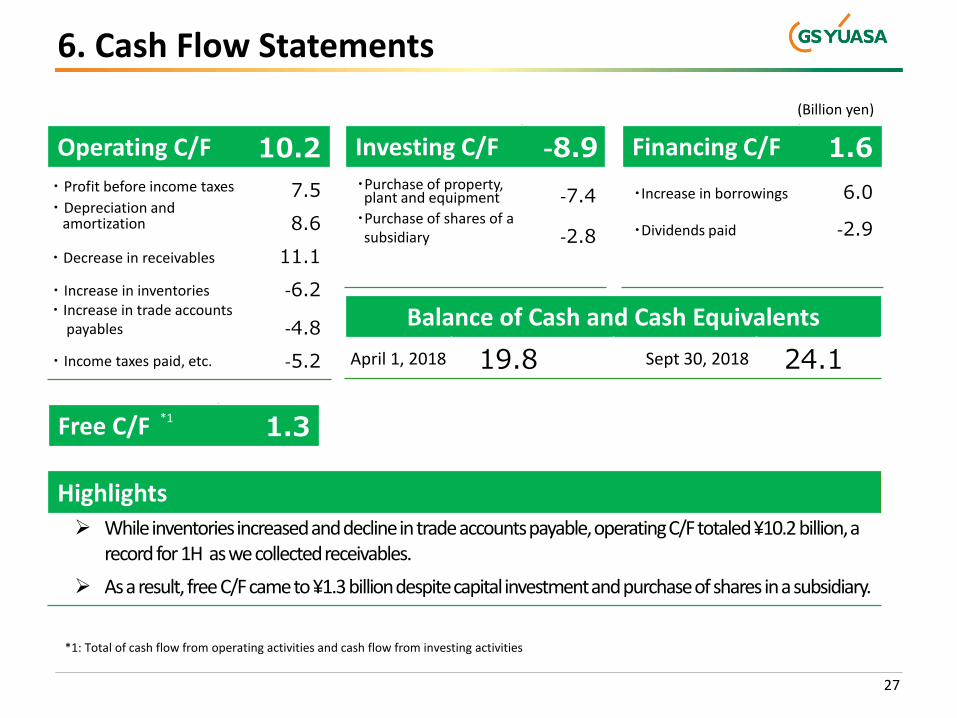
6. Cash Flow Statements
27
*1: Total of cash flow from operating activities and cash flow from investing activities
Operating C/F 10.2
・Profit before income taxes 7.5・Depreciation and
amortization 8.6
・ Decrease in receivables 11.1
・Increase in inventories -6.2・ Increase in trade accounts
payables -4.8
・Income taxes paid, etc. -5.2
Investing C/F -8.9・Purchase of property,
plant and equipment -7.4・Purchase of shares of a
subsidiary -2.8
Financing C/F 1.6
・Increase in borrowings 6.0
・Dividends paid -2.9
Free C/F 1.3*1
Balance of Cash and Cash Equivalents
April 1, 2018 19.8 Sept 30, 2018 24.1
Highlights➢ While inventories increased and decline in trade accounts payable, operating C/F totaled ¥10.2 billion, a
record for 1H as we collected receivables.
➢ As a result, free C/F came to ¥1.3 billion despite capital investment and purchase of shares in a subsidiary.
(Billion yen)

28
Although this document has been prepared with information believed to be correct, GS Yuasa Corporation does not guarantee the accuracy or the completeness of such information. Also, the information herein contains forward-looking statements regarding the Company’s plans, outlooks, strategies and results for the future. All the forward-looking statements are based on judgments derived from information available to the Company at the time of release. Certain risks and uncertainties could cause the Company’s actual results to differ materially from any projections presented herein.

Reference

Reference (ESG-related Efforts)
30
CSR Policy➢ Besides legal compliance, we respect international norms, guidelines, and initiatives
related to social responsibility, work on sustainable development of our business through developing energy storage technologies, and contribute to people, society, and global environment.
1. Developing fair, transparent, and sound business, and anti-corruption
2. Respect for human rights 3. Conservation and improvement of adequate working
environment4. Fulfillment of our responsibilities to provide safe and secure
products and services5. Global environmental conservation6. Building better relationships with local communities7. Ensuring social responsibility within our supply chain
CSR Code of Conduct for all
employees’ code of conduct
Participation in United Nations Global Compact (UNGC)■The Ten Principles of the UN Global Compact<Human Rights>Principle 1 Businesses should support and respect the protection of internationally proclaimed human rights; andPrinciple 2: make sure that they are not complicit in human rights abuses<Labour>Principle 3: Businesses should uphold the freedom of association and the effective recognition of the right to collective bargaining;Principle 4: the elimination of all forms of forced and compulsory labour;Principle 5: the effective abolition of child labour; andPrinciple 6: the elimination of discrimination in respect of employment and occupation.
<Environment>Principle 7: Businesses should support a precautionary approach to environmental challenges;Principle 8: undertake initiatives to promote greater environmental responsibility; andPrinciple 9: encourage the development and diffusion of environmentally friendly technologies.
<Anti-corruption>Principle 10: Businesses should work against corruption in all its forms, including extortion and bribery.

Reference (ESG-related Efforts)
31
External ratings
ESG rating by
MSCI (U.S.)
CSR assessmentby Toyo Keizai Inc.
CSR assessment by
EcoVadis (France)HR utilization
EnvironmentCorporate
governanceSociality
2017 AA AA AA AA AA 50 points (rank: silver)
2016 A C C B C 37 points (rank: bronze)
*1
*2
*3
CSR evaluations
Evaluation, certification and accreditation for GS Yuasa’s CSR-related efforts
➢ Received the highest rank “particularly excellent in terms of initiatives for employees’ health” from DBJ Employees’ Health Management Rating
➢ Selected as a certified company of the Company with Excellent Health Management 2018 –White 500- by the Ministry of Economy, trade and Industry
➢ Received Kurumin Mark, certified as a company that supports child care by the Ministry of Health, Labour and Welfare
2018
*3: EcoVadis (France) Total marks for CSR assessment is 100 points. The average score of the companies surveyed is 43.7 points.
*2: Toyo Keizai Inc.’s CSR assessment is five-grade evaluation of AAA, AA, A, B and C.
*1: ESG rating of MSCI (U.S.) is done by Japan ESG Select Leaders Index and is seven-grade evaluation of AAA, AA, A, BBB, BB, B and CCC.
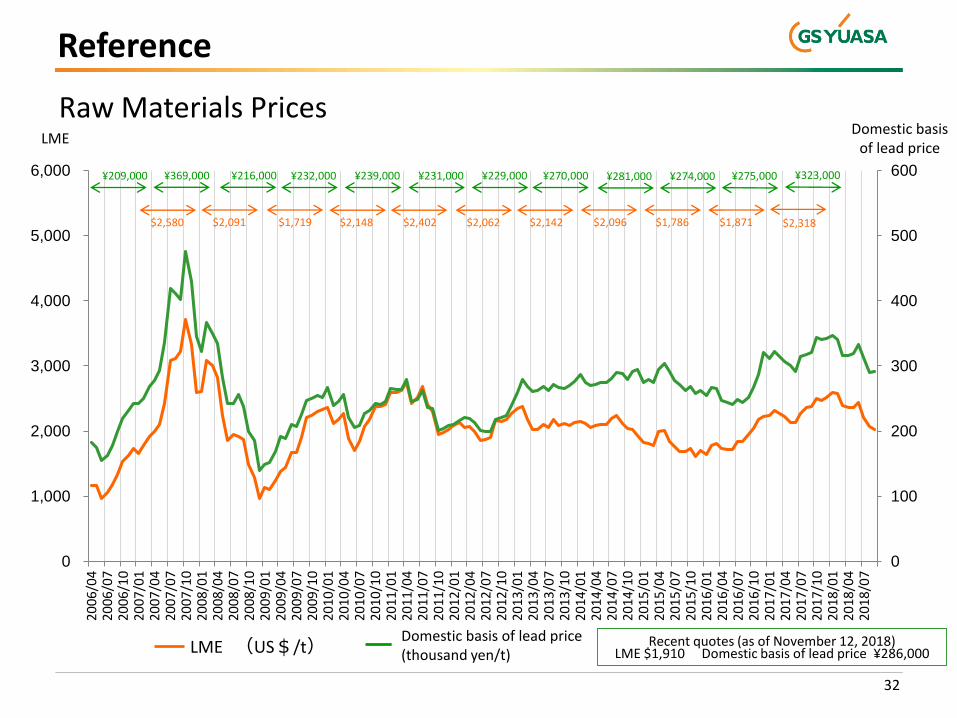
Reference
32
Raw Materials Prices
0
100
200
300
400
500
600
0
1,000
2,000
3,000
4,000
5,000
6,000
200
6/0
420
06
/07
200
6/1
020
07
/01
200
7/0
420
07
/07
200
7/1
020
08
/01
200
8/0
420
08
/07
200
8/1
020
09
/01
200
9/0
420
09
/07
200
9/1
020
10
/01
201
0/0
420
10
/07
201
0/1
020
11
/01
201
1/0
420
11
/07
201
1/1
020
12
/01
201
2/0
420
12
/07
201
2/1
020
13
/01
201
3/0
420
13
/07
201
3/1
020
14
/01
201
4/0
420
14
/07
201
4/1
020
15
/01
201
5/0
420
15
/07
201
5/1
020
16
/01
201
6/0
420
16
/07
201
6/1
020
17
/01
201
7/0
420
17
/07
201
7/1
020
18
/01
201
8/0
420
18
/07
¥209,000
$2,580
¥369,000
$2,091
¥216,000
$1,719
¥232,000
$2,148
¥239,000
$2,402
¥231,000
$2,062
¥229,000
$2,142
¥270,000
LMEDomestic basis
of lead price
¥281,000
$2,096
LME (US$/t) 国内鉛建値 (千円/t)
¥274,000
$1,786 $1,871
¥275,000 ¥323,000
$2,318
Domestic basis of lead price (thousand yen/t)
Recent quotes (as of November 12, 2018) LME $1,910 Domestic basis of lead price ¥286,000
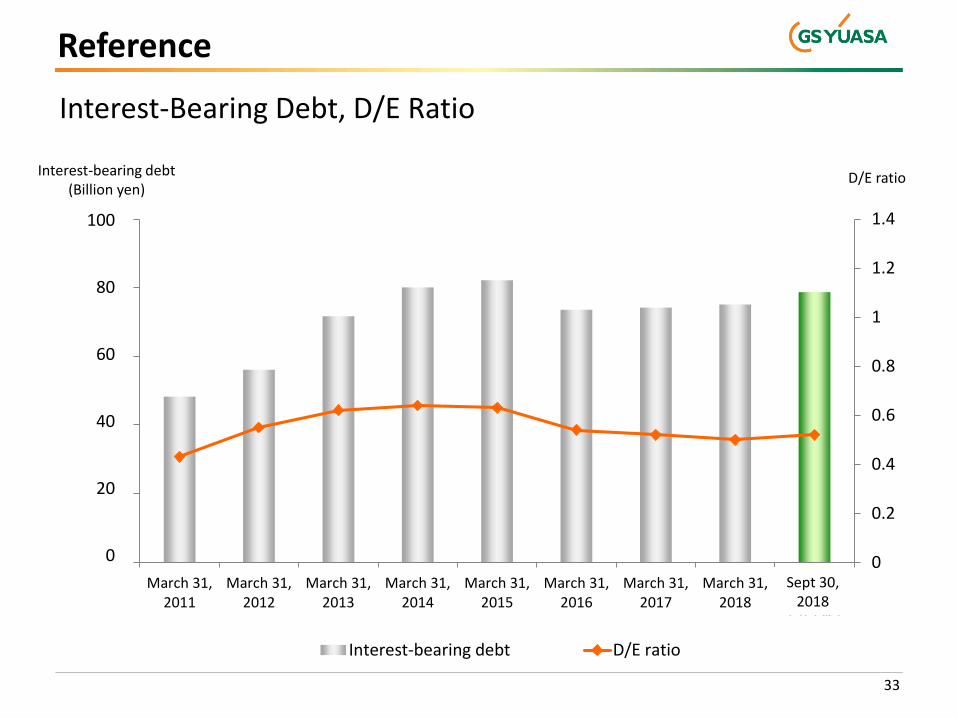
Reference
33
Interest-Bearing Debt, D/E Ratio
D/E ratioInterest-bearing debt(Billion yen)
0
0.2
0.4
0.6
0.8
1
1.2
1.4
0
200
400
600
800
1000
March 31,2011
March 31,2012
March 31,2013
March 31,2014
March 31,2015
March 31,2016
March 31,2017
March 31,2018
2018年
(9月末)
Interest-bearing debt D/E ratio
100
80
60
40
20
0
Sept 30, 2018
Related Documents