The Right to Development in a Climate Constrained World The Greenhouse Development Rights Framework Sivan Kartha Stockholm Environment Institute CASS 25 October 2008, Beijing, China

Sivan Kartha Stockholm Environment Institute CASS 25 October 2008, Beijing, China
Dec 30, 2015
The Right to Development in a Climate Constrained World The Greenhouse Development Rights Framework. Sivan Kartha Stockholm Environment Institute CASS 25 October 2008, Beijing, China. Arctic Sea Ice. 2005. 2007. - PowerPoint PPT Presentation
Welcome message from author
This document is posted to help you gain knowledge. Please leave a comment to let me know what you think about it! Share it to your friends and learn new things together.
Transcript

The Right to Development in a Climate Constrained WorldThe Greenhouse Development Rights Framework
Sivan Kartha Stockholm Environment Institute
CASS25 October 2008, Beijing, China

2
Arctic Sea Ice
“The sea ice cover is in a downward spiral and may have passed the point of no return. The implications for global climate, as well as Arctic animals and people, are disturbing.” Serreze, Oct. 2007.
2005 2007

3
Greenland Ice Sheet
IPCC-AR4: “0.18 – 0.59 m by 2100”
Hansen, 2007: “several meters by 2100”
4
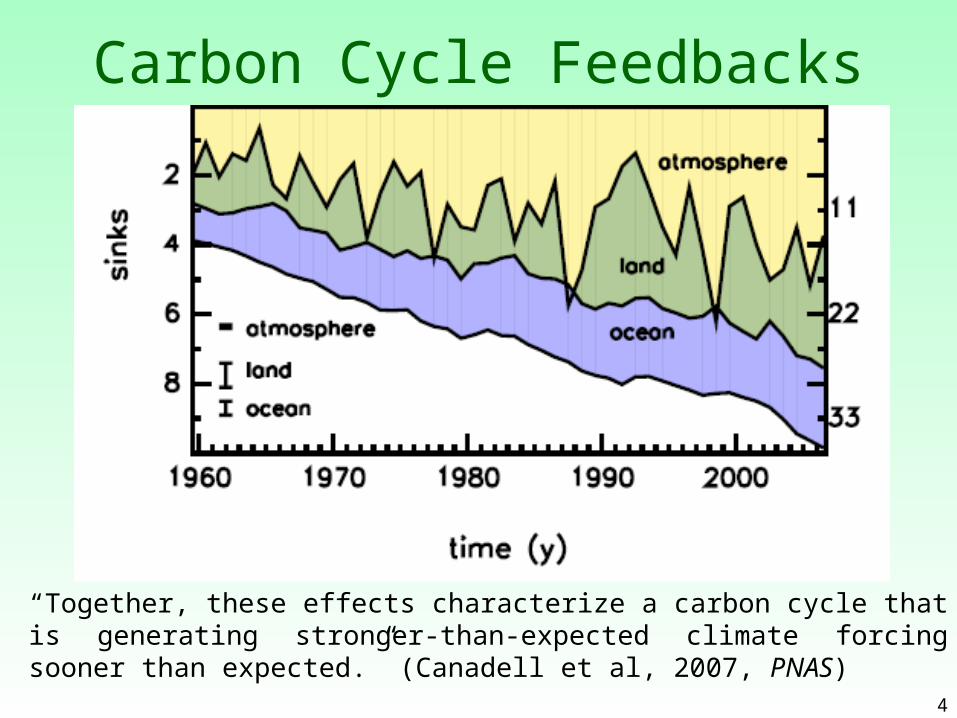
Carbon Cycle Feedbacks
“Together, these effects characterize a carbon cycle that is generating stronger-than-expected climate forcing sooner than expected.” (Canadell et al, 2007, PNAS)

5
Tipping Elements in the Climate System
2ºC is already risking catastrophic, irreversible impacts. This calls for an emergency program.
Lenton et al, 2008
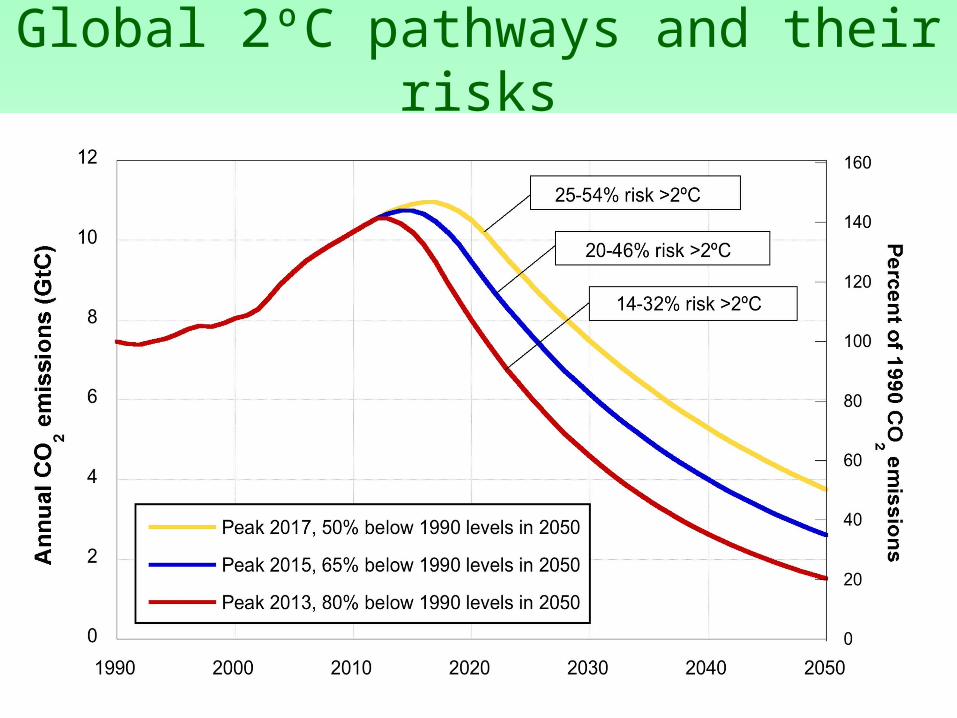
Global 2ºC pathways and their risks

The climate challenge: a thought experiment
What kind of climate regime can enable this to happen…?7

8
… in the midst of a development crisis?
• 2 billion people without access to clean cooking fuels
• More than 1.5 billion people without electricity
• More than 1 billion have poor access to fresh water
• About 800 million people chronically undernourished
• 2 million children die per year from diarrhea
• 30,000 deaths each day from preventable diseases
9
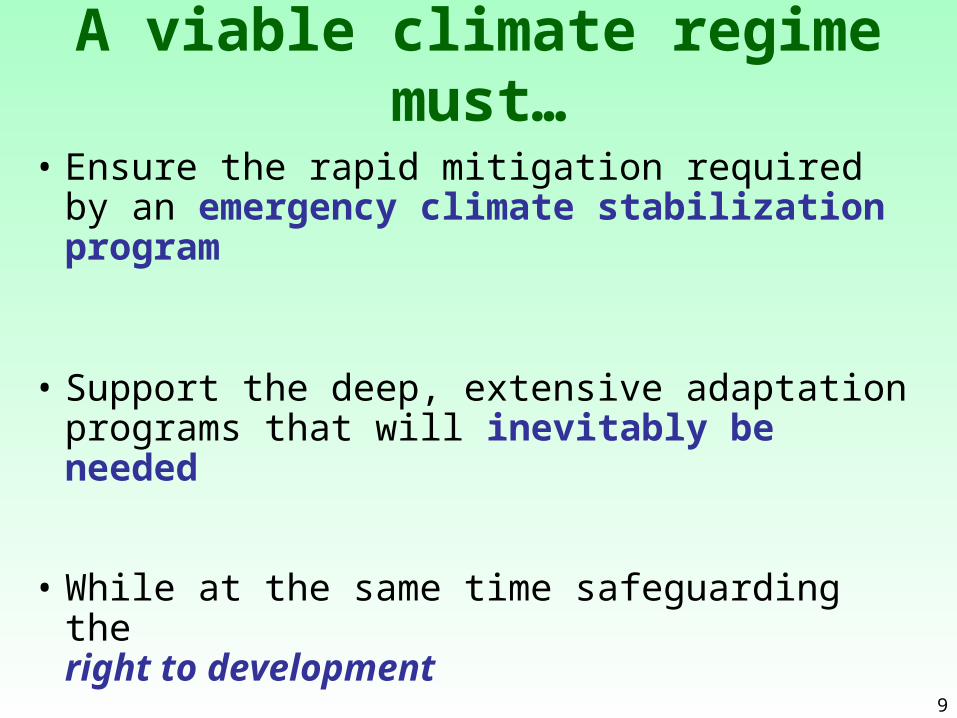
A viable climate regime must…
• Ensure the rapid mitigation required by an emergency climate stabilization program
• Support the deep, extensive adaptation programs that will inevitably be needed
• While at the same time safeguarding the right to development

10
A “Greenhouse Development Rights” approach to a global climate accord…
• Defines and calculates national obligations with respect to a development threshold
• Allows those people with incomes and emissions below the threshold to prioritize development
• Obliges people with incomes and emissions above the threshold (in both the North and South) to pay the global costs of an emergency climate program

11
Development threshold?What should a “Right to Development” safeguard?
Traditional poverty line: $1/day? …$2/day? (“destitution line” and “extreme poverty line” of World Bank, UNDP, etc.)
Empirical analysis: $16/day(“global poverty line,” after Pritchett/WB (2006))
For indicative calculations, consider development threshold 25% above global poverty line
about $20/day ($7,500/yr; PPP-adjusted)

12
Burden-sharing in a global climate regime
Define National Obligation (national share of global mitigation and adaptation costs) based on:
Capacity: resources to pay w/o sacrificing necessities We use income (PPP), excluding income below the $20/day ($7,500/year) development threshold
Responsibility: contribution to the climate problem We use cumulative CO2 emissions, excluding “subsistence” emissions (i.e., emissions corresponding to consumption below the development threshold)

13
UNFCCC: The preamble
“Acknowledging the global nature of climate change calls for the widest possible cooperation by all countries and their participation in an
effective and appropriate international response, in accordance with their common but differentiated responsibilities and respective capabilities”

14
“Countries will be asked to meet different
requirements based upon their historical share
or contribution to the problem and their relative
ability to carry the burden of change. This
precedent is well established in international law,
and there is no other way to do it.”
Al Gore (New York Times Op-Ed, 7/1/2007)

Income and Capacity National income distributions showing portion of income
(in green) considered “capacity”
15

Emissions vs. Responsibility Cumulative fossil CO2 (since 1990) showing portion
considered “responsibility”
16

Population
%
Income ($/capita)
Capacity
%Responsibility
%
RCI (obligations)
%
EU 27 7.3 30,472 28.8 22.6 25.7
EU 15 5.8 33,754 26.1 19.8 22.9
Germany 1.2 34,812 5.6 5.3 5.5
EU +12 1.5 17,708 2.7 2.8 2.7
Poland 0.6 17,222 1.0 1.2 1.1
United States 4.5 45,640 29.7 36.4 33.1
China 19.7 5,899 5.8 5.2 5.5
India 17.2 2,818 0.7 0.3 0.5
South Africa 0.7 10,117 0.6 1.3 1.0
LDCs 11.7 1,274 0.11 0.04 0.07
Annex I 18.7 30,924 75.8 78.0 76.9
Non-Annex I 81.3 5,096 24.2 22.0 23.1
High Income 15.5 36,488 76.9 77.9 77.4
Middle Income 63.3 6,226 22.9 21.9 22.4
Low Income 21.2 1,599 0.2 0.2 0.2
World 100 9,929 100% 100% 100%17
National obligations based on capacity and responsibility in 2010
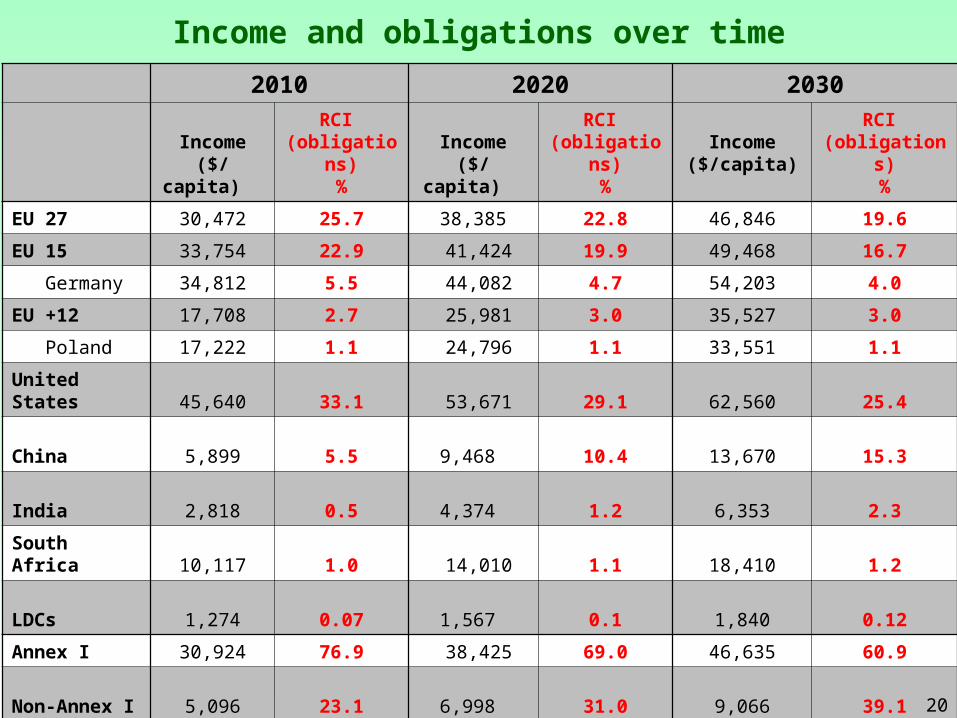
2010 2020 2030
Income
($/capita)
RCI (obligations)
%Income
($/capita)
RCI (obligations)
%Income
($/capita)
RCI (obligations)
%
EU 27 30,472 25.7 38,385 22.8 46,846 19.6
EU 15 33,754 22.9 41,424 19.9 49,468 16.7
Germany 34,812 5.5 44,082 4.7 54,203 4.0
EU +12 17,708 2.7 25,981 3.0 35,527 3.0
Poland 17,222 1.1 24,796 1.1 33,551 1.1
United States 45,640 33.1 53,671 29.1 62,560 25.4
China 5,899 5.5 9,468 10.4 13,670 15.3
India 2,818 0.5 4,374 1.2 6,353 2.3
South Africa 10,117 1.0 14,010 1.1 18,410 1.2
LDCs 1,274 0.07 1,567 0.1 1,840 0.12
Annex I 30,924 76.9 38,425 69.0 46,635 60.9
Non-Annex I 5,096 23.1 6,998 31.0 9,066 39.1
High Income 36,488 77.4 44,365 69.3 52,928 61.1
Middle Income 6,226 22.4 8,797 30.4 11,728 38.5
Low Income 1,599 0.2 2,022 0.3 2,429 0.5
World 9,929 100% 12,415 100.0 15,095 100% 20
Income and obligations over time

What are the costs?Source Annual Cost
(billions) Notes
Adaptation
World Bank (2006) $10-40 Costs to mainstream adaptation in development aid
Oxfam International (2007) > $50 Costs in developing countries
UNFCCC Secretariat (2007a;2007b)
$49-171 Adaptation costs in 2030 (summarized in Table 65, p. 198)
UNDP (2007) $86 Adaptation costs in 2015
Mitigation
UNFCCC Secretariat (2007a;2007b)
$380 Costs in 2030 to return emissions to 2007 levels. (summarized in Table 64, p. 196).
I PCC AR4 (2007)
(SPM Table 7.)
<3% Costs as percentage of Gross World Product in 2030 for stabilizing in 445 -535 ppm CO2eq range.
Stern (2007) 1% (±3%) Costs as percentage of Gross World Product through the 2050 for stabilization in the 500-550 ppm CO2eq
21

Allocating global mitigation obligationsamong countries according to their “RCI”
22

Implications for United States
US mitigation obligation amounts to a reduction target exceeding 100% in the post-2025 period (“negative emission allocation”).
25

Implications for United States
Here, physical domestic reductions (~25% below 1990 by 2020) are only part of the total US obligation. The rest would be met internationally.
26

In comparison to the more ambitious of US bills...
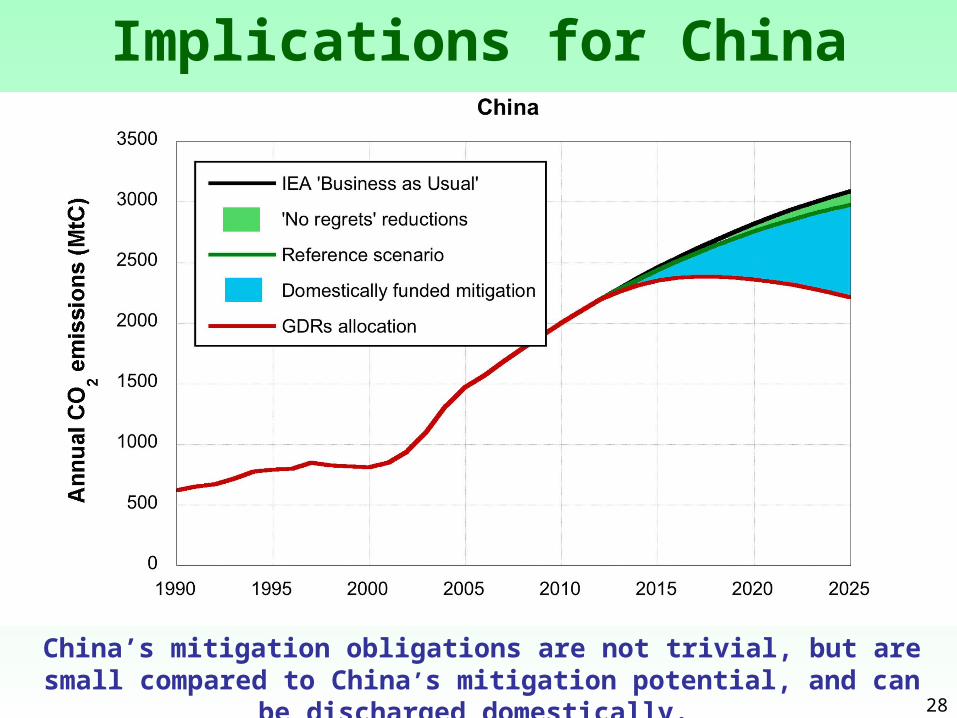
Implications for China
China’s mitigation obligations are not trivial, but are small compared to China’s mitigation potential, and can be discharged domestically.
28
29
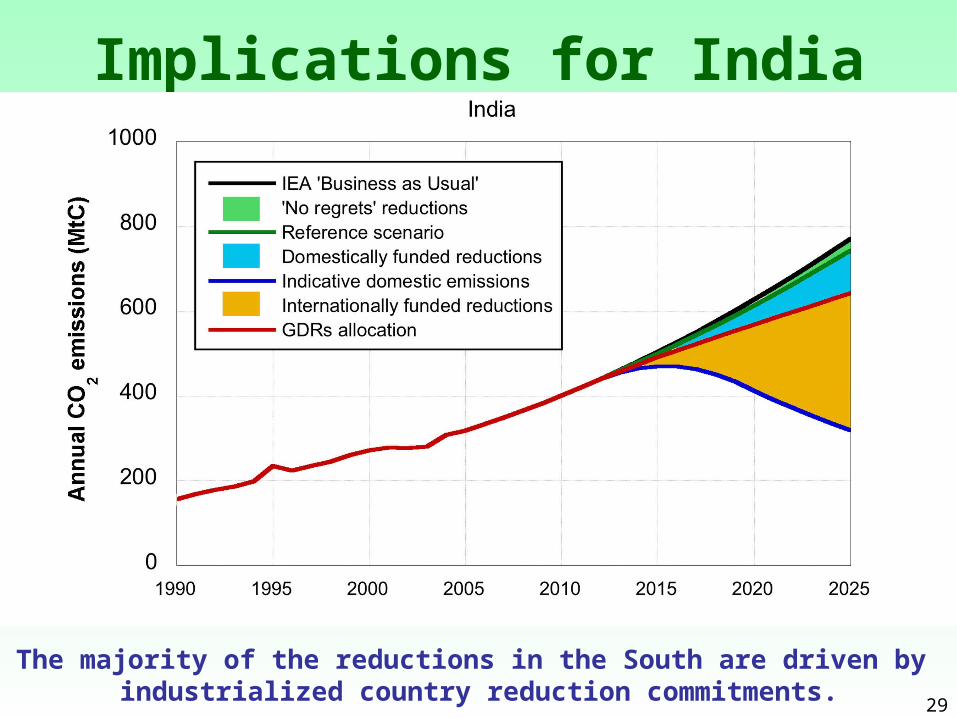
Implications for India
The majority of the reductions in the South are driven by industrialized country reduction commitments.

31
Implications for European Union

32
Domestic reductions (~40% below 1990 by 2020) are only part of total EU
obligation. The rest would have to be met internationally.
Implications for European Union

33
Implications for European Union
-20%
-30%

34
Implications for European Union

39
Final Comments• The scientific evidence is a wake-up call. Carbon-based growth
is no longer an option in the North, nor in the South.
• A rigorous, binding commitment to North-to-South flows of technology and financial assistance is critical. Domestic reductions in the North are only half of the North’s obligation.
• In principle, a corresponding commitment from the consuming class in the South is also necessary.
• In practice, there will need to be a period of trust-building.
• The alternative to something like this is a weak regime with little chance of preventing catastrophic climate change
• This is about politics, not only about equity and justice.
4040
The Right to Development in a Climate Constrained World: The Greenhouse Development Rights Framework
AuthorsSivan Kartha (Stockholm Environment Institute)Tom Athansiou (EcoEquity)Paul Baer (EcoEquity)
Key CollaboratorsEric Kemp-Benedict (SEI)
Jörg Haas (European Climate Foundation)Andrew Pendleton (IPPR)
SupportersChristian Aid (UK)Oxfam (International)MISTRA / CLIPORE (Sweden)The Heinrich Böll Foundation (Germany)Stockholm Environment Institute core funds Town Creek Foundation (US)


additional slides

Alternative development thresholds (not up to date)
Low income Middle income High income World
Global income 2005 ($trillion PPP) 6 22 33 61
Share of global income (percent) 10 36 54 100
Share of population 2005 (percent) 37 48 16 100
Per capita income 2005 ($ thousands PPP ) 2.5 7.3 33.0 9.5
CAPACITY THRESHOLD 6000 9000 12000 6000 9000 12000 6000 9000 12000 6000 9000 12000
Capacity ($ billion PPP) 0.5 0.2 0.1 9 6 4 27 24 21 37 31 26
Share of global capacity(percent) 1.3 0.6 0.3 25 20 17 74 79 83 100 100 100
Percentage of population over capacity threshold 7.1 2.2 0.8 41 24 16 97 93 86 37 27 21

Sensitivity (not up to date)
Percent of global RCI Bill at 1% of GWP ($ billion PPP adjusted)
Average individual bill at 1% of GWP ($)
Capacity threshold 6000 9000 12000 6000 9000 12000 6000 9000 12000
United States 31.7 35.0 38.0 193 214 232 678 796 933
EU (27) 26.5 27.2 27.3 162 166 167 317 357 399
United Kingdom 4.1 4.4 4.5 25 27 28 416 461 512
Germany 5.2 5.5 5.6 32 34 34 388 420 456
Russia 3.1 2.3 1.7 19 14 10 168 190 221
Brazil 1.7 1.6 1.5 10 10 9 139 191 255
China 9.0 6.9 5.4 55 42 33 107 144 188
India 0.9 0.4 0.2 5 2 1 39 53 71
South Africa 1.0 1.0 1.0 6 6 6 282 383 499
LDCs 0.1 0.0 0.0 0 0 0 19 34 65
All high income 73 78 82 446 479 503 459 517 584
All middle income 26 21 18 159 129 107 128 172 224
All low income 1.1 0.5 0.2 6 2.9 1 39 56 79
World 100.0 100.0 100.0 611 611 611 257 353 450
Related Documents