SITUATIONAL CRIME PREVENTION IN SCHOOLS: IMPLICATIONS FOR VICTIMIZATION, DELINQUENCY, AND AVOIDANCE BEHAVIORS by Nicole Watkins A Thesis Submitted to the Graduate Faculty of George Mason University in Partial Fulfillment of The Requirements for the Degree of Master of Arts Criminology, Law and Society Committee: Director Department Chairperson Dean, College of Humanities and Social Sciences Date: Spring Semester 2015 George Mason University Fairfax, VA

Welcome message from author
This document is posted to help you gain knowledge. Please leave a comment to let me know what you think about it! Share it to your friends and learn new things together.
Transcript

SITUATIONAL CRIME PREVENTION IN SCHOOLS: IMPLICATIONS FOR
VICTIMIZATION, DELINQUENCY, AND AVOIDANCE BEHAVIORS
by
Nicole Watkins
A Thesis
Submitted to the
Graduate Faculty
of
George Mason University
in Partial Fulfillment of
The Requirements for the Degree
of
Master of Arts
Criminology, Law and Society
Committee:
Director
Department Chairperson
Dean, College of Humanities and Social
Sciences
Date: Spring Semester 2015
George Mason University
Fairfax, VA

Situational Crime Prevention in Schools: Implications for Victimization, Delinquency,
and Avoidance Behaviors
A Thesis submitted in partial fulfillment of the requirements for the degree of Master of
Arts at George Mason University
by
Nicole Watkins
Bachelor of Arts
North Carolina State University. 2012
Director: Charlotte Gill, Assistant Professor
Department of Criminology, Law and Society
Spring Semester 2015
George Mason University
Fairfax, VA

ii
This work is licensed under a creative commons
attribution-noderivs 3.0 unported license.

iii
DEDICATION
This is dedicated to Andrew, for his inspiration and encouragement.
.

iv
ACKNOWLEDGEMENTS
The completion of this thesis would not have been possible without the support of my
committee, the Criminology, Law and Society department at George Mason, and my
friends and family. A special note of thanks goes to Dr. Gill, who demonstrated
remarkable patience and knowledge during the course of my writing. Her attention to
detail and encouragement were very much appreciated. I would like to thank Dr. Lum for
inspiring the subject of this thesis through her teaching, and sparking my interest in
situational crime prevention. I also thank Dr. Wilson for challenging me to think
critically and for helping me see the fun in statistics. Special thanks go out to the faculty
and staff in the Criminology, Law and Society department for their excellent teaching and
organization that consistently kept me on track. I would like to thank my fiancé, Andrew
Johnson, for his unflinching support and for always encouraging me to think outside of
the box. Finally, I would like to thank my parents, Chip and Rose, for their love and
support while I pursued my degree.

v
TABLE OF CONTENTS
Page
List of Tables .................................................................................................................... vii
List of Figures .................................................................................................................. viii
List of Abbreviations ......................................................................................................... ix
Abstract ............................................................................................................................... x
Chapter One ........................................................................................................................ 1
Introduction ..................................................................................................................... 1
Chapter Two........................................................................................................................ 4
Situational Crime Prevention .......................................................................................... 6
Opportunity Reducing Techniques ............................................................................ 12
SCP in school: victimization, delinquency, avoidance ................................................. 14
The Current Study ......................................................................................................... 20
Chapter Three.................................................................................................................... 22
Data ............................................................................................................................... 22
Sampling Methodology .............................................................................................. 23
Sample ....................................................................................................................... 23
Independent Variables ................................................................................................... 24
Situational Crime Prevention .................................................................................... 24
Other explanations: School characteristics .............................................................. 26
Other explanations: Attachment to school ................................................................ 27
Other explanations: Attitudes toward school authority ............................................ 28
Other explanations: Demographics........................................................................... 29
Dependent Variables ..................................................................................................... 30
Victimization .............................................................................................................. 30
Delinquent Behaviors ................................................................................................ 31
Avoidance .................................................................................................................. 32
Analytic Strategy ........................................................................................................... 32
Chapter Four ..................................................................................................................... 35
Victimization Results .................................................................................................... 35
Any victimization ....................................................................................................... 35

vi
Property victimization ............................................................................................... 37
Violent victimization .................................................................................................. 39
Delinquent Behavior Results ......................................................................................... 41
Avoidance Results ......................................................................................................... 43
Chapter Five ...................................................................................................................... 46
Discussion ..................................................................................................................... 46
Policy implications .................................................................................................... 52
Limitations and future research ................................................................................. 54
Chapter Six........................................................................................................................ 58
Conclusion ..................................................................................................................... 58
Appendix A ....................................................................................................................... 61
References ......................................................................................................................... 77

vii
LIST OF TABLES
Table 1: Crime in the United States 1990-2012................................................................ 61 Table 2: 25 opportunity reducing techniques .................................................................... 62 Table 3: SCP measure by technique ................................................................................. 63
Table 4: Descriptive statistics for SCP ............................................................................. 64 Table 5: Descriptive statistics for school and youth characteristics ................................. 65 Table 6: Descriptive statistics for outcome variables ....................................................... 66 Table 7: Logistic Regression of SCP on any victimization .............................................. 67 Table 8: Logistic Regression of SCP on property victimization ...................................... 69
Table 9: Logistic Regression of SCP on violent victimization ......................................... 71 Table 10: Logistic Regression of SCP on delinquency .................................................... 73
Table 11: Logistic Regression of SCP on avoidance ........................................................ 75

viii
LIST OF FIGURES
Page
Figure 1: Opportunity Structure for Crime ......................................................................... 9

ix
LIST OF ABBREVIATIONS
Situational Crime Prevention ......................................................................................... SCP
National Crime Victimization Survey School Crime Supplement ..................... NCVS SCS
National Institute of Justice ............................................................................................. NIJ
Closed Caption Television .......................................................................................... CCTV
School Survey of Crime and Safety .......................................................................... SSOCS
School Resource Officer ................................................................................................ SRO

x
ABSTRACT
SITUATIONAL CRIME PREVENTION IN SCHOOLS: IMPLICATIONS FOR
VICTIMIZATION, DELINQUENCY, AND AVOIDANCE BEHAVIORS
Nicole Watkins, M.A.
George Mason University, 2015
Thesis Director: Dr. Charlotte Gill
This thesis examines the relationship between situational crime prevention (SCP)
practices often used in schools on students’ experienced victimization, engagement in
certain delinquent activities, and avoidance of areas in school due to fear of victimization.
SCP is an approach to prevention that embodies a range of techniques designed to reduce
the opportunity for individuals to engage in criminal behaviors. Using the 2011 National
Crime Victimization Survey’s School Crime Supplement, this thesis uses student self-
report data to make inferences on the efficacy of such practices on the stated outcomes
amongst middle and high school aged students. Results from logistic regression analyses
find that possessing metal detectors and having adults present in hallways reduce the
likelihood of victimization, while security cameras increase this risk. Locking school
doors during the day is shown to reduce the odds of delinquency, while policies requiring
the wearing of ID badges increase avoidance behaviors due to fear.

1
CHAPTER ONE
Introduction
By many accounts, juvenile crime in the United States has enjoyed a downward
trajectory following a substantial peak in the early 1990s (DeVoe et al., 2004). Despite
this fact, the amount of juvenile crime that does take place is still a concern for many,
especially when it takes place at school (Noonan and Vavra, 2007). Indeed, Gottfredson
(2001) notes that:
We have seen that more than 18% of the crimes experienced by teens occurred in
school…Among crimes experienced by teens ages 12 through 15, 37% of violent
crimes and 81% of thefts occurred on school property…the amount of crime
victimization experienced and delinquent behavior committed by youths in and
around schools is disproportionately high (pp. 21-22).
Because the amount of time youth spend at school in a given day can be quite lengthy,
this concern for safe school environments is well-justified, and often spurs major
investment into school security measures. Just recently, the National Institute of Justice
(NIJ) appropriated a massive $75 million budget to conduct research to support school
safety (Modzeleski, Petrosino, Guckenburg, and Fronius, 2014). Most schools across the
nation employ at least one form of security measure aimed at enhancing the overall safety
of the school. While there are numerous measures that schools can take to combat

2
delinquency within their walls (e.g. anti-bullying or gang prevention programs), some of
the most ubiquitous are those that fall under the umbrella of situational crime prevention
(Clarke, 1983), an approach to prevention that focuses largely on crime opportunity
reduction. The purpose of this paper will be to shed light on the efficacy of this particular
approach on school related delinquency, victimization, and avoidance behaviors.
In the simplest terms, the underlying logic of situational crime prevention is that
crime may be controlled if the opportunity to engage in that crime is reduced. There is a
diversity of crime types, and associated with them, a diversity of crime opportunity
structures. Situational crime prevention therefore embodies a variety of techniques that
aim to alter the opportunity structure of crime through implementing prevention measures
that are targeted towards making it riskier or more difficult to engage in specific crimes
(Clarke, 1983). This approach to prevention is predicated on the idea that, even if one
possesses the motivation and means to commit a crime, a change in the opportunity
structure might lead individuals to recalculate their decision to do so. Unlike
interventions aimed at preventing delinquency through targeting root causes (e.g.
addressing risk or protective factors), situational prevention brings the contextual
elements of the criminal event forward into focus, and places offender motivations as just
a single part of the equation for crime (Clarke, 1983; Clarke, 1995). This type of
prevention assumes that offenders will react and respond to the contextual cues
surrounding a potential criminal opportunity, according to what holds the most benefit for
them relative to the associated cost or risk. The context surrounding a criminal

3
opportunity can be shaped or altered by the choice of situational crime prevention
technique.
Many traditional environmental security measures one might readily think of fall
under situational crime prevention—for example, security cameras (which affect the
perceived risk of being caught) or locked gates (which increase the effort it takes to get to
a house to burgle) are considered situational crime prevention measures. Situational
crime prevention measures can also be people, such as security guards who increase the
risks of being apprehended, or general practices, such as increasing the effort required for
an individual to be robbed by only traveling with a group at night (Cornish and Clarke,
2003). Some examples of the implementation of situational crime prevention in schools
include the increased amount of metal detectors that were added to schools after the
Columbine massacre in 1999, or the addition of up to 1,000 School Resource Officers
(SRO) to schools following the Newtown shooting. Due to the substantial quantity and
variation of situational prevention measures used in schools today, I am interested in the
impact of this method of prevention on students’ experienced victimization, delinquent
behaviors, and avoidance behaviors in school.
In the following chapters, I will provide the groundwork for this study and will
focus in on the questions of interest, eventually positing four hypotheses seeking to
address main and side effects of situational crime prevention measures. These hypotheses
will be assessed using data from the 2011 National Crime Victimization Survey’s School
Crime Supplement.

4
CHAPTER TWO
Most reports on recent school crime rates paint a picture that suggests the
numbers are declining from where they were in the early 1990s, the period when many
new school security policies were adapted and implemented. In general, violent and
property crimes, drug availability, and other types of crime decreased in the period
between the early 1990s and more recently (DeVoe et al., 2004). The FBI’s annual
compiled Uniform Crime Report indicates that between 1990 and 2012, there was an
estimated 47% decrease in violent crime and 44% decrease in property crimes in the
United States (UCR; see Table 1). Indeed, it is widely acknowledged that crime was on a
major decline in the United States during this period and may include crime occurring in
schools (see Blumstein and Wallman, 2000; Zimring, 2006). However, despite the overall
decline in school crime, the fact remains that there is still crime in schools, including
some schools with high crime rates (O’Neill and McGloin, 2007). Some studies even
suggest an increase in school violence during the period between 1993 and 2001 (Noonan
and Vavra, 2007) and an increase in some types of victimization (i.e. bullying
victimization rates (Robers et al., 2014)).
The everyday acts of disorder and delinquency that often occur in schools have
the potential to foster an environment that is not only dangerous, but also unconducive to
learning (Thapa, Cohen, Guffey, and Higgins-D’Alessandro, 2013). Furthermore, there
are a host of negative outcomes that are related to victimization and involvement in
delinquency that are separate from these outcomes themselves.

5
In addition to looking at the general efficacy of situational crime prevention on
school delinquency and victimization, another goal of this study is to determine whether
there is the potential to reduce student avoidance behaviors due to fear of victimization.
According to fear of crime theorists, one’s perception of risk can be as pronounced, if not
more so, as actual risk (LaGrange, Ferraro and Supancic, 1992). Just as we are attempting
to remove actual risks of victimization in schools through employing various crime
preventive strategies, so might we concentrate on lessening the detrimental impact that
negative school climates can have on students’ perceptions of risk, and their fear of
victimization (Bracy, 2011)1. Many studies address fear of crime for adults and their
perceived risk of victimization. Not many studies examine the fear of victimization for
juveniles within the school environment, however, the studies that have looked at this
area show generally negative outcomes resulting from perceptions of risk and fear
amongst students.
Though not always reflective of reality, fear of crime nevertheless has many
negative impacts on youth in school. It can severely handicap one’s lifestyle choices by
forcing adaptations to the way one lives his/her life (i.e. using avoidance behavior, living
defensively). It can also have a negative effect on one’s psychological state and overall
health (Ross, 1993; Hale, 1996). Assessing whether situational security measures in
school can impact this fear of crime, therefore, has implications for impacting the overall
well-being, health, and positive life outcomes of youth. While it is necessary to
1 There is a conceptual distinction between “perceived risk of victimization” and “fear of victimization” as
noted in the “Fear of Crime” literature, where “perceived risk” indicates how much that individual
envisions the likelihood they will be victimized, while “fear of victimization” indicates how concerned the
individual is that they will be victimized (Ferrarro, 1995; LaGrange, Ferraro, and Supancic, 1992).

6
understand whether crime prevention practices are doing what they are intended to do,
understanding potential side-effects to prevention practices provide us with a more
informed picture of the impact of situational crime prevention in schools and their overall
worth.
Situational Crime Prevention
In its broadest definition, school security embodies the steps that schools take to
prevent or reduce delinquent and otherwise harmful behavior in the interest of student,
faculty and staff safety. There are many forms that school security can take, including
environmental security measures, or programs aimed at reducing school-wide
delinquency (see Hahn et al., 2007). Situational crime prevention measures are often
implemented in schools as a form of security measure (O’Neill and McGloin, 2007).
For most of criminological history, the answer to crime prevention design lay in
the distal factors that lead people to commit crime (Clarke, 1980). Those are factors that
might be considered “root causes” to engaging in bad behavior, such as one’s childhood
and upbringing, socioeconomic class, biological or cognitive deficiencies, subcultural
identities, etc. While it is widely acknowledged that these factors are indeed strong
influences on one’s propensity to engage in crime, addressing these “root causes” is not
the only path to effective crime prevention (Clarke, 1980).
Clarke and his colleagues at the British Home Office were instrumental in
thinking about the crime problem in a new light; specifically, in a way that put crime
prevention, as a practicable goal, in the spotlight. Rather than focusing solely on the
distant social forces that may impress on people a desire to engage in crime, their work

7
challenged the traditional paradigm of criminology and redirected it to a new and
practical direction (Weisburd, 1997). What they determined was that opportunity played
an important role in whether or not a crime would come to fruition. That is, an individual
who holds every likelihood of becoming a serious offender will not be able to carry out a
bad deed should there be no opportunity to do so. Situational crime prevention reflects
these ideas in its design. Though composed of many differing techniques of prevention
(e.g. Target Hardening or Access Control), the central thesis of this type of crime
prevention is to reduce the opportunities for that crime occurring, or increasing the
associated risks with engaging in it.
While situational crime prevention is an approach to crime prevention, its
underlying causal logic falls in line with “opportunity theories” for crime. These include
such theoretical perspectives as routine activities (Cohen and Felson, 1979) and
deterrence (Nagin, 2013.) These theories and perspectives are fundamental to thinking
about crime prevention as a practice, as they emphasize the importance of
‘opportunity’—a notion that Felson and Clarke (1998) propose is a root cause of crime.
In their aptly titled essay “Opportunity Makes the Thief”, Felson and Clarke (1998) posit
that while “no single cause of crime is sufficient to guarantee its occurrence…opportunity
above all others is necessary and therefore has as much or more claim to being a ‘root
cause’” (Felson and Clarke, 1998:9). Felson and Clarke believe that crime is generated
more powerfully by the immediate and contextual factors surrounding it. It is because of
the presence of opportunity that many crimes come to be. Opportunity theories of crime,
therefore, are what inform situational crime prevention in both theory and practice.

8
Clarke (1995) believed that crime prevention should be tailored to the specific
crime type in order to be most effective. Crimes tend to vary in their purposes and goals,
and as such are affected by different situational elements. A central part of determining
what crime prevention technique would be most effective in reducing the opportunity for
a crime was the development of a crime event model that illustrates the decision process
related to the commission of a specific crime (Clarke and Cornish, 1985). These crime
prevention techniques, or opportunity-reducing techniques, are crime-specific techniques
that aim to reduce the opportunities of engaging in that particular crime, and are
discussed more thoroughly below.
While offenders may not think too much about eventual punishments or long-term
consequences of committing a criminal offense in their risk calculations, they are not
insensitive to the immediate situation in which they are placed—what immediate risks or
obstacles are present, and how certain they are to be caught (Durlauf and Nagin, 2011;
Nagin, 2013). Clarke attempts to model this offender decision-making process in his
“opportunity structure for crime”, which integrates the salient features of the different
opportunity theories and dispositional theories of crime. The opportunity structure
illustrates each stage of the decision process that potential offenders go through when
considering committing a specific offense, and the corresponding influences on those
decisions. By mapping out these processes, one can determine how situational influences
impact the completion of crime events and where in the process the opportunity can be
blocked. Figure 1 shows this opportunity structure as developed by Clarke (1995).

9
Physical
Environment Urban form;
Housing type
Lifestyle/Routine
Activity Leisure/Work;
Shopping/Residence
Victims
Women alone;
Drunks;
Strangers
Targets
Cars; Banks;
Convenience
stores; etc.
Facilitators
Guns; Cars;
Drugs;
Alcohol
Potential
Offenders Numbers/Motivation
Search/Perception
Information/Modeling
Lack of
supervision;
Freedom of
movement
(“Unhandled
offender”)
Lack of guardianship
Socio-Economic Structure Demography; Geography; Industrialization;
Urbanization; Welfare/Health/Educational/Legal
Institutions
Subcultural
influences;
Social control;
lack of love,
etc.
(Traditional
criminological
theory)
Crime Opportunity Structure
Source: Clarke (1995)
Figure 1: Opportunity Structure
for Crime

10
In the opportunity structure for crime, situational factors are included in addition
to the dispositional factors that may influence one’s propensity for crime. The main
components of the opportunity structure are potential offenders, targets, victims, and
crime facilitators. This echoes part of a routine activities perspective of crime, which
posits that the convergence of a motivated offender with a target and lack of capable
guardian is enough to create a criminal opportunity (see Cohen and Felson, 1979). The
supply of targets in the opportunity structure for crime is influenced both by structural
and environmental factors, such as the general spatial layout, housing types, technology,
and the availability of transportation, and by the routines of the residents of a particular
area—what patterns individuals move in to go to work, school, leisurely activities, home,
etc. The supply of victims is influenced by routine activities and lifestyles, and
facilitators are influenced by the physical environment. The environment and routines of
individuals is broadly influenced by the larger socioeconomic structure of society, that is,
the geography, urbanization, industrialization, political institutions, and other
characteristics. (Clarke, 1995). Criminal opportunities, therefore, are determined by the
nature and scale of these influences.
Potential offenders are represented in the opportunity structure for crime as being
impacted by the same distal structural and social forces (i.e. the socioeconomic structure
and influences identified by traditional criminological and social theories) or as an
“unhandled” offender (being able to move freely without supervision). These influences
that might motivate one to commit crime are tempered by different characteristics in the
situation, such as the ease at which the offender can come in contact with the target or

11
whether there is a guardian present. Potential offenders engage in mental calculus when
assessing the layout of the crime opportunity. If the crime is deemed too risky, or perhaps
if the offender would be likely to be caught, he or she will probably not engage in that
crime because the costs would outweigh the benefits.
The opportunity structure for crime allows us to see not only the different factors
that contribute to the decision-making process for offenders, it can also illustrate how we
can control the supply of targets and facilitators. By modelling offender decision making,
we can see how metal detectors would not only increase the risk that youth would be
caught with a weapon in school, but how it would also control the facilitators (guns and
knives) that would make it possible to commit weapons-related offenses. The opportunity
structure for crime is used as a template for devising opportunity-reducing techniques
specific to the type of crime in question.
Situational prevention measures are predicated on offender rationality for this
reason: it assumes individuals are fully capable of choosing to commit a specific crime,
or not to commit a crime when other variables are introduced. When faced with choices,
this perspective posits that offenders will opt for whatever option is less-risky for them.
In effect, it assumes that offenders engage in cost/benefit calculations—not necessarily of
distant factors such as punishment, but more of immediate risk cues that they are given,
particularly their perception of risk of apprehension (Nagin, 2013). Clarke (1983) argues
that by using a rational choice perspective in furthering situational crime prevention, we
can focus our efforts on targeted preventive approaches that help us to address specific
crimes rather than indiscriminately targeting crime in general. In addition, it provides a

12
“stronger theoretical rationale for increasing the risks to offenders and reducing
opportunities” (Clarke, 1983, 1995).
Opportunity Reducing Techniques
From the crime opportunity structure, Clarke systematically developed 12
opportunity reducing techniques in 1992, which he then expanded to contain 16
techniques in 1997. As of 2003, Cornish and Clarke added 9 more techniques to represent
the most recent development of techniques. At their conception, the original 12
opportunity reducing techniques contained techniques aiming to thwart criminal
opportunity by increasing risks and efforts of criminal activity, and by reducing the
rewards of crime. Clarke’s (1997) expansion two years later was marked by an inclusion
of techniques that induce guilt or shame as a means of reducing opportunities for criminal
behavior. The most recent formulation of the opportunity-reducing techniques set forth
by Cornish and Clarke (2003) brings in types of situational precipitators (such as stimuli
that provoke, stress, or frustrate individuals), and ways to reduce the opportunities that
are initiated by them. Table 1 details Cornish and Clarke’s 25 opportunity reducing
techniques and provides several examples of each. The different techniques are distinct in
their design and purpose (e.g. to reduce the rewards vs. to remove excuses) and therefore
embody diverse techniques.
The 25 opportunity reducing techniques that Cornish and Clarke (2003)
developed include techniques that increase the effort in committing a crime, such as
controlling the access to facilities, as in the case of locking the front doors to a school or
requiring card entry. The techniques that attempt to increase the risks associated with a

13
crime include such measures as strengthening formal surveillance, such as employing
school resource officers or monitors to oversee public areas in schools. Measures geared
towards reducing anticipated rewards for criminal offenses include such things as
denying benefits, which could include rapid cleanup of graffiti. Reducing provocations
that lead to criminal opportunities include techniques such as avoiding disputes which
could include such measures as reducing crowding by scattering lunch or start times in
schools. Finally, removing excuses for criminal behavior includes measures such as rule
setting or posting instructions (Cornish and Clarke, 2003).
Each situational crime prevention measure used in this study can be classified as
one of the 25 opportunity reducing techniques from Cornish and Clarke’s (2003) list.
These are indicated in Table 3, and include such techniques as increasing the risks of
apprehension through formal, employee, and natural surveillance, and reducing
anonymity, in addition to techniques that increase the effort through controlling weapons
and access around the school.
There are quite a few critiques leveled against situational crime prevention as
theory and practice. Some of these critiques stem from ethical considerations of
situational crime prevention and its impact on people’s quality of life and citizen rights
(Von Hirsch, 2000). More frequently however, critiques come in the form of the
phenomenon known as “displacement”. Displacement refers to the idea that crime that is
suppressed in one area will inevitably be “displaced” to another area, time, or crime type.
The Brantinghams argue that this is not the case with schools, which they refer to as
being “crime generators”. By this they mean that schools are facilities that “create
14
particular times and places that provide appropriate concentrations of people and other
targets” (Brantingham and Brantingham, 2003). In other words, schools have the ability
to create a lot of opportunity for crime. However, they propose that the criminal activity
committed at these schools is opportunistic by definition, and therefore the displacement
argument does not hold much weight. According to these scholars, crime prevention
measures, such as situational prevention, that are targeted at these activity nodes and
crime generators have major implications for reducing large amounts of low-seriousness
crimes with little to no concern about the displacement of those crimes to other spaces.
Converse to a displacement effect, there is sometimes evidence of a very different
effect from situational crime prevention: that of a diffusion of benefits (Clarke and
Weisburd, 1994; Weisburd, 1997). While displacement refers to crime moving to
different locations, times, or types when suppressed in one area, diffusion refers to a
diffusion of “crime control benefits” to other contexts that are not the primary focus of
the intervention. In line with this idea of supplemental benefits in addition to main
treatment effects, I am hoping to discern any potential added benefits from the
implementation of situational crime prevention in schools. Specifically, I am interested in
whether there are added positive effects to having situational prevention measures
implemented in schools external to decreasing victimization and delinquency, such as
decreasing avoidance behaviors due to fear of victimization.
SCP in school: victimization, delinquency, avoidance
Though many studies of the efficacy of situational crime prevention have been
conducted, not many of these studies take place within the context of schools. As today’s

15
typical school contains at least some measures of situational prevention (whether it be
security cameras or visitor sign in polices), it will be helpful to determine whether these
widely used prevention mechanisms achieve what they set out to do; not only for the sake
of student safety, but also in consideration of the cost of these types of measures.
Furthermore, most studies of situational prevention in schools tend to look at outcome
measures such as bullying or fear perceptions. For instance, Popp (2012) used the 2007
National Crime Victimization Survey’s School Crime Supplement to examine the
relationship between various opportunity theory variables, including school guardianship,
and the likelihood of bullying victimization. What she found was that guardianship did in
fact influence the risk of being bullied, as increased levels of guardianship was related to
a reduced likelihood of being bullied. It should be noted however that guardianship in
this study was composed of three variables: one being an index composed of all school
security features, including ones that may not necessarily constitute guardianship (such as
locked doors and code of conduct). The other two variables were measures of social
support networks and the school rule environment, which similarly do not constitute
guardianship in the traditional Routine Activities and situational crime prevention
context.
Situational crime prevention has been assessed more often in schools as it relates
to the risk perceptions of students and fear of victimization. In their study of the effects of
school security measures on students’ perceived fear at school and traveling to and from
school, Bachman, Randolph, and Brown (2011) addressed these relationships using the
School Crime Supplement of the National Crime Victimization Survey. The authors were

16
interested in whether there was a differential effect of school security measures on the
likelihood of fear of victimization among white and black students. What their study
revealed was that some security measures increased fear, though there were no
differences in levels of fear across gender and race. There were, however, differential
effects of security guards on student fear, as white students were more fearful than black
students when security guards were in place.
Tillyer, Fisher and Wilcox (2011) also aimed to get at this question of how school
crime prevention measures impact risk perception and fear of crime amongst students.
This attempt at clearing up the role that situational measures plays in students’ risk
perception and fear was met with somewhat different results than Bachman, Randolph,
and Brown’s (2011) analysis revealed. Tillyer, Fisher and Wilcox’s (2011) study assessed
self-report data from 2,644 seventh graders nested within 58 schools to measure whether
the security efforts so widely used by schools mitigate or exacerbate risk perceptions and
fears. Additionally, the authors were assessing how the same situational prevention
measures impacted the level of violent victimization within those schools. Interestingly,
the authors did not find evidence that situational prevention practices reduced the
likelihood of students experiencing violent victimization, or perceptions of risk.
However, they did find that only one measure, metal detectors, significantly reduced
student fear.
Some scholars find that fear of crime can lead to avoidance strategies as well as
general lifestyle alterations (May and Dunaway, 2000). In addition, there is some
evidence to suggest that fear of crime could incidentally lead to actual crime and

17
defensive actions, including carrying firearms to school (Hale, 1996; May, 1999). In his
study of approximately 8,000 public high school students, May (1999) found a significant
association between the students’ fear of victimization and firearm possession at school,
net of social control variables and aspects of differential association theory variables
(Sutherland, 1947; Hirschi, 1969). Though his study supported the notion that students
who had more fear of victimization were more likely to carry a firearm to school (8.1%
of students reported ever carrying a firearm to school one or more times), he also
discovered that students whose peers were more delinquent were more likely to carry a
firearm to school. Due to the cross-sectional nature of the data, it is not clear as to
whether the exposure to delinquent peers preceded the fear of victimization that students
reportedly felt.
May’s (1999) inclusion of variables of social theories as potential predictors of
delinquency is something that was replicated in this study. Specifically, I included tenets
of social control and procedural justice as control variables in this analysis because they
have been noted to affect one’s likelihood of engaging in delinquency. Hirschi’s (1969)
social control or “bond theory” asserts that the involvement in prosocial activities,
attachment to prosocial groups or individuals, commitment to prosocial ideas or attitudes,
and belief in prosocial norms may exacerbate or temper one’s likelihood of engaging in
delinquency, depending on the strength of these bonds.
Procedural justice theory also sets forth some elements that are relevant to this
study. This body of literature maintains that if people perceive that they are being treated
fairly, equitably, and therefore in a just manner, they will come to see the authoritative
18
force as legitimate (e.g. police) and will therefore be more compliant with the rules.
Though often applied in the context of the police (Tyler, 1990; Tyler, 2004), this may
also be applicable in the context of schools. Students who perceive that the teachers and
administration do not play favorites and treat them with respect may be more likely to
follow school rules, and therefore not engage in delinquent behaviors.
Though fear of crime in schools may encourage students to take defensive
precautions that may not always be legal (such as carrying a gun for protection), some
effects of fear of crime are perfectly legal, though no less detrimental to the student.
Bowen and Bowen (1999) found that students who perceived their schools as dangerous
exhibited lower attendance, more trouble avoidance, and lower grades than those students
who did not. Barrett, Jennings, and Lynch (2012) echoed these findings in their study of
the National Crime Victimization Survey (NCVS) data in which they found it more likely
that a student would skip class and less likely that a student would want to go to college
or have good grades if they were afraid of victimization in school, even after controlling
for academic achievement. Additionally, students who are afraid in school are also more
likely to have a much lower sense of school cohesiveness and climate (Bowen, Richman,
Brewster, and Bowen, 1998). Though much research has looked at various types of
avoidance behaviors by students, this study is primarily interested in behaviors such as
avoiding areas in and around the school (including cafeterias, hallways, classrooms, etc.)
due to fear of victimization.
Yet another relevant study examining the effect of situational crime prevention in
schools is O’Neill and McGloin’s (2007) examination of the efficacy of situational crime

19
prevention on school-related crime and delinquency behaviors. This study used school-
level measures of situational crime prevention (as measured by principal surveys) to
examine aggregated levels of crime and delinquency in a nationally representative sample
of schools. Using the 2000 School Survey on Crime and Safety (SSOCS), the authors
examined what effects school security measures such as clear book bags, metal detectors,
and security cameras had on property and violent crimes in schools. The authors also
tested aspects of routine activities theory in their models by examining the influence of
the student/teacher ratio and number of classroom changes to assess the effects of
guardianship and routine activities on crime. Their analyses revealed no significant
influence of situational crime prevention measures on school crime, except for closing
the school for lunch and the number of classroom changes in a day. Students who stayed
on campus for lunch were more likely to report property crime, and the more classroom
changes students underwent during the day increased the likelihood of being a victim of
both property and violent crime.
Though the results from this study do not inspire confidence in the efficacy of
situational prevention in schools, it will be helpful to examine this relationship again
using a different level of data. The SSOCS used aggregated crime data as reported by
principals, and as such may not be inclusive of all acts of delinquency and crime
occurring within the school, but merely what is officially reported or documented. Self-
report surveys of students may be a more effective means of capturing the amount of
delinquency that occurs within school settings, so that the relationship between
situational prevention and school crime may be more adequately addressed.

20
Still other studies have looked at various SCP measures out of the context of
schools that may be used in school settings to reduce or deter crime. Such examples
include Welsh and Farrington’s (2003, 2009) reviews of CCTV in public spaces, in
which they found moderate but significant reductions in crime in places where CCTV
was installed, as opposed to areas where it was not. Similarly, research on the efficacy of
metal detectors as a crime preventative indicate that it may provide greater impact on
certain crimes than others. Lum, Kennedy, and Sherley (2006) found in their systematic
review of various counterterrorism policies that metal detector screening at airports
showed statistically significant evidence of deterrence and prevention of certain
activities, such as plane hijacking. Indeed, successful prevention techniques, such as the
success of metal detectors in airports, are ones that are “tailored to the targeted offense or
context” (Lum et al., 2011). As airports may be conceptually similar to schools in that
they are large spaces with specific routine activities, metal detector use in school settings
may provide similar opportunities to reduce or deter weapons carrying by students.
The Current Study
Because of the extensive use of situational crime prevention in schools and the
associated lack of research into its effectiveness in reducing crime, delinquency, and
related behaviors, I aim to fill this void through a school-based analysis of the
relationship between perceptions of situational prevention measures on victimization,
delinquency, and avoidance. While most studies of situational crime prevention in
schools have concentrated on either crime outcomes or fear, my aim here is to address
both: whether and how situational crime prevention affects student self-reported

21
victimization, delinquency, and avoidance behaviors. I will examine how different
prevention measures based on different opportunity-reducing or risk-increasing
techniques perform in reducing the likelihood of students being victimized or engaging in
delinquent acts themselves, or the likelihood of students avoiding places in and out of
school due to fear. Thus, I hope to illustrate the effects of widely used school security
measures on outcomes that severely affect students’ current quality of life and future life
outcomes. In addressing these research questions, I advance 4 hypotheses:
H1: Situational crime prevention measures decrease the likelihood of a student
experiencing violent victimization, net of statistical controls
H2: Situational crime prevention measures decrease the likelihood of a student
experiencing property victimization, net of statistical controls
H3: Situational crime prevention measures decrease the likelihood of a student engaging
in delinquent behavior (bringing weapons to school and/or getting in fights), net of
statistical controls
H4: Situational crime prevention measures decrease the likelihood of a student avoiding
various places in school due to fear of victimization, net of statistical controls

22
CHAPTER THREE
Data
The data used to address these inquiries came from the School Crime Supplement
(SCS) of the 2011 National Crime Victimization Survey (NCVS). The SCS and NCVS
are part of a public use data set containing information on crime and victimization in the
United States, and were obtained through the University of Michigan’s Inter-university
Consortium for Political and Social Research. Funded by the Bureau of Justice Statistics,
the NCVS is conducted each year by the Census Bureau to record information on crime
and victimization in the United States. The School Crime Supplement is a supplemental
survey instrument that is issued to eligible respondents in the NCVS sample every two
years to obtain additional information on school-related crime and victimization. The
2011 SCS is the ninth supplement in the series, and was conducted from January to June
2011. Responses to the SCS supplement are coupled to the NCVS survey, so that more
in-depth information of school related victimization incidents are available.
The Supplement’s questionnaire is composed of eight sections aimed at compiling
information on school crime, avoidance, and prevention measures that are relevant to this
analysis. Aside from the obvious benefits of containing relevant information and valid
measures of school-based crime and safety (Painter and Farrington, 2001:268), these data
also provide an individual-level perceptual account of these measures, which is most
helpful to my research questions, given that many forms of situational crime prevention

23
are only effective if they are perceived by the potential offender (Clarke and Cornish,
1985).
Granted, school security efforts could very well be different in practice than
students may perceive. For instance, the objective security practices of schools may elude
the notice of some students, and may be more precisely documented by principal surveys.
However, as the measures of school security in this study tend to impact the routines of
students in some way as they go about their school day, this is not so concerning. In
effect, there were benefits to using a self-report survey to answer my research questions,
in that it allowed for insight into how the perceptions of school security may or may not
alter the opportunity structure for crime, and affect avoidance behaviors.
Sampling Methodology
The SCS data used here represents a cross-section of data collected via a
stratified, multi-stage cluster sample design. Using this methodology, households were
selected at random to be included in the NCVS sample, and all eligible household
members were subsequently included in the “rotating panel”. The sample of households
is divided into rotations; that is, the respondents in the sample are interviewed once every
six months for a period of three years.
Sample
The sample for this study consists of U.S. students aged 12 to 18 who were
enrolled in school at some point during the six months preceding the interview. From the
10,341 NCVS respondents who were eligible to receive the SCS survey, 6,547 (63.3%)

24
of those completed the interview, while the remainder (36.7%) were non-interviews
(NCVS: SCS, 2011). 409 of the 6,547 SCS interviews conducted were proxy interviews,
where proxy interview refers to an interview of another household member in lieu of the
intended respondent. Proxy interviews were included in the derivation of the final
sample. Of the 6,547 respondents to the SCS, some individuals were dropped from the
sample due to their answers to the various screening questions. If respondents indicated
that they were homeschooled (N=237), enrolled in elementary school or a higher
education institution (N=278), or not enrolled in school at all within the six months
preceding the interview (N=293), they were not included in the final sample.
The resulting sample of N=5,739 respondents represents the national population
of 12 to 18 year olds, and thus can be used to make inferences about that specific
population. This is an especially relevant population for the purposes of this study, as it
will allow me to make inferences about the impacts of situational crime prevention in
primary and secondary schools on students nationwide.
Independent Variables
Situational Crime Prevention
The primary independent variables for this study consisted of the different
situational crime prevention measures most often employed by schools, and reported in
the School Crime Supplement of the NCVS. Measures of these prevention tactics reflect
whether the practice was present in the respondent’s school or not. Specifically, when
asked if their school employed a specific security measure, students were given the
option of answering Yes, No, Don’t know, or to refuse. Consequently, all of the primary

25
independent variables were recoded to be dichotomous in nature, with 0 indicating that
the respondent’s school did not possess that security measure, and 1 indicating that it did.
Answers of “don’t know” were coded to 0 because if the student did not perceive a
security measure, their decision making was likely not affected by it. All refusals were
dropped.
The situational prevention measures that were assessed on the survey and their
related frequencies are detailed in Table 4 in the Appendix, and include the presence of
security guards; whether adults supervised halls; the presence of metal detectors; whether
the school locked its doors during the day; whether locker checks were performed;
whether students were required to wear badges or other forms of identification; and
whether the school used security cameras. These measures fall into at least one category
of Cornish and Clarke’s (2003) 25 opportunity reducing techniques, as illustrated in
Table 3. As evident in Table 4, most students in the sample reported that their school
employed many types of situational prevention techniques. The majority of the students
in the sample indicated that their school contained security guards (70% of the sample),
adults in the hallways (88%), locked doors (64%), locker checks (53%), and security
cameras (76%). Reported less frequently were metal detectors (11% of the sample
indicated that their school used metal detectors), and the use of student ID badges (24%).
Furthermore, schools that only employed security that increased the efforts of engaging
in crime were reported less often (66%) than schools that employed some practices aimed
at increasing the risks of offending (98%). One should note that the frequencies
illustrated in Tables 4, 5, and 6 are based on the data as it was recoded for this study. All

26
refusals in the original data set were set to missing and therefore are not included in the
estimation of frequencies in Tables 4, 5, and 6.
Other explanations: School characteristics
Aspects of the school characteristics as perceived by the respondent were
measured so as to try to control for any extraneous influences, such as perception of the
school environment (e.g. perceived crime and disorder) on the effects of situational
prevention on the three stated outcomes. School characteristics that were measured
include whether the school was public or private; whether the school had perceived high
or low crime; whether the school had high drug availability; whether the school had a
gang presence; and whether the school was in an urban or rural area. Table 5 in the
Appendix highlights the frequencies of student and school characteristics.
Most students in the sample attended public schools (92%) in urban areas (81%).
These variables were dichotomous variables that were asked in the survey as such. The
perceived high or low crime around the school variable was a measure of how much
crime students believed existed in the neighborhood around the school. The survey item
asked respondents if they agreed with the following statement: “There is not a lot of
crime in the neighborhood where I go to school”. Available responses were arranged in a
Likert-type scale of “Strongly agree, agree, don’t know, disagree, and strongly disagree”.
This item was recoded to reflect a low or no crime/high crime outcome. Specifically,
answers of “disagree” and “strongly disagree” were recoded as 1, and answers of
“strongly agree, agree, and don’t know” were recoded as 0. More students characterized
the neighborhood around their school as having high crime (56%), than low crime (44%).

27
The variable measuring drug availability contained information on the availability of
alcohol and various narcotics in the school. Most students (61%) did not perceive the
availability of drugs within their school, while a significant number (38%) did. The
variable measuring gang prevalence consisted of one survey item asking respondents if
there was a gang presence in their school. 20% of students in the sample indicated that
their school had gangs, where 80% indicated that their school did not have gangs.
Other explanations: Attachment to school
Another category of control variables give insight into the levels of attachment a
respondent has to school and people at school. Prior theory and research indicates that an
individual’s bond to conventional society and norms are less likely to engage in criminal
behavior (Hirschi, 1969). According to Hirschi’s (1969) bond theory, the social bond that
lessens the likelihood of people engaging in criminal activity is comprised of four
elements, attachment to others, commitment to future ideals such as getting married or
going to college, involvement in conventional activities, and belief in the dominant
morals of society (Wiatrowski, Griswold, and Roberts, 1981). The individual strengths of
each of these elements strengthen or weaken one’s overall bond to convention. Based on
the potential that individual attachment is a prime predictor of delinquency and avoidance
behaviors, I included measures that captured some dimensions of this. Initially, I
measured attachment by the student’s reported participation in extracurricular activities at
school; academic performance; plans to attend college; whether he or she had a friend at
school; and whether he or she had an adult at school who cared about him/her. However,
low variability in certain variables (plans to attend college, respondent had friend at

28
school, and whether there was an adult at school who cared about him/her), led me to
exclude these measures from the final models. Table 5 details frequencies of the final
measures used to capture student attachment to school.
Extracurricular activities included items asking whether the respondent
participated in sports teams, spirit groups, performing arts, academic clubs, student
government, volunteer clubs, or other. If respondents participated in one or more
extracurricular activity, I recoded the “extracurricular activity” variable as 1. If the
opposite, I recoded the variable as 0. Table 5 indicates that most students (68%) indicated
participating in some sort of extracurricular activity, while a significant number (32%)
said they did not. For the academic performance variable, I separated responses into 4
categories, representing whether students reported receiving mainly As, Bs, Cs, or Ds/Fs.
I aggregated the Ds and Fs due to a low number of cases in those categories. Most
students reported that they received As (40%) or Bs (43%), while a smaller percentage
reported receiving mainly Cs (15%) or Ds/Fs (2%).
Other explanations: Attitudes toward school authority
I also included measures regarding perceptions of the fairness of school rules and
authority based on the procedural justice literature which theorizes that behavioral
compliance comes about when authorities charged with enforcing compliance do so in a
perceptibly fair way (Tyler and Lind, 1992). As some studies examining the relationship
between student perceptions of teacher fairness and delinquency involvement found a
negative relationship, I controlled for student perceptions of school authority in order to
rule out this potential influence on the outcomes (Sanches et al., 2012).

29
To capture this idea of procedural and equitable justice, I constructed a
summative index from three items measuring different dimensions of procedural justice
theory. Respondents were asked the following prompt, “Would you agree that: rules are
fair; punishment is the same for all; and teachers treat students with respect”. Responses
were again received in a Likert-type scale ranging from “strongly agree” to “strongly
disagree”. I recoded responses of “strongly agree and agree” to 2 to indicate an
agreement with the respective question. I recoded answers of “don’t know, disagree and
strongly disagree” to 1, to indicate a disagreement. I summed the scores to create an
index of attachment ranging from 1-4, with a score of 1 reflecting the respondent
disagreed with all of the prompts, and a score of 4 reflecting complete agreement with all
of the prompts. As illustrated in Table 5, most students in the sample have generally
positive attitudes towards school rules and authority. Specifically, 78% of students
received a score of 4, 15.5% received a score of 3, 5% received a score of 2 and 1.5%
received a score of 1 on the attitudes toward authority index.
Other explanations: Demographics
The last category of control variables I included in these analyses include the
demographic characteristics of respondents. These are detailed in Table 5, and include the
respondent’s sex, race, and age. I coded sex as a dichotomous variable indicating whether
the respondent was female or not. The distribution was fairly split, with females
representing 49.5% of the respondents. Race/ethnicity was originally separated into 20
different response categories in the original data, but I recoded this to reflect four main
categories. I coded Whites (non-Hispanic) as 1, blacks (non-Hispanics) as 2, Hispanics as

30
3, and other races as 4. The majority of the sample included whites (58%), followed by
Hispanic (21.6%), Black (12.2%) and other (8%). Age was recorded as a continuous
variable in the survey, where respondents could indicate how old they were in a range of
12-18 years old. The mean age of the respondents was 14.75 years old.
Dependent Variables
Victimization
The dependent variables addressed in this paper consist of three main outcomes,
with subcategories: student victimization (including property and violent victimization),
delinquent behaviors, and student avoidance behaviors. These outcome variables are
detailed in Table 6 in the Appendix.
I measured victimization in this paper as a dichotomous variable indicating
whether or not respondents had ever been victimized. Then to address the hypothesis that
situational crime prevention has differential effects on different kinds of victimization, I
aggregated victimization responses into two distinct categories: violent victimization and
property victimization. The violent victimization outcome consisted of two items
assessing whether the students had been threatened with harm since the start of the school
year and whether the students had been pushed, shoved, tripped, or spit on since the
beginning of the school year. Originally, these items contained response categories of
“yes”, “no”, or a refusal to answer. I recoded violent victimization so that it would equal
0 if the student experienced neither of these types of victimization, and 1 if the student
experienced at least one type of violent victimization.

31
Property victimization similarly contained two items assessing whether anyone
had destroyed students’ property on purpose and whether students were forced to do
something they did not want to do, such as give up money. I recoded property
victimization as 0 to indicate that the student did not experience any property
victimization during the school year, and 1 to indicate that they experienced at least one
of these two measures. As evident in Table 6, about 10.5% of students sampled indicated
that they had experienced some type of violent victimization since the beginning of the
school year, while 5% of the sample indicated that they had experienced some type of
property victimization since the school year began.
Delinquent Behaviors
I included delinquency in the analysis as measures of two dimensions of
delinquent behaviors—that of weapons possession at school and fighting behaviors at
school. Though it would have been preferable to include other measures to more
adequately represent delinquency in the analysis, this was not possible with the current
data. However, these variables do capture delinquent behaviors that are relevant to this
paper. This issue will be expanded upon in Chapter 5.
The initial survey items addressed whether students had ever brought a gun, a
knife, or other type of weapon onto school grounds, in addition to whether respondents
had engaged in one or more fights at school since the beginning of the school year. I
aggregated these measures into a single dichotomous variable assessing whether the
students had never engaged in these delinquent behaviors, or if they engaged in one or

32
more of these behaviors. Table 6 reveals that 7% of students indicated having engaged in
one or more delinquent behaviors since the start of the school year.
Avoidance
The variable for avoidance consisted of 7 dichotomous survey items addressing
whether respondents ever stayed away from specific areas inside or outside of the school
due to fear of attack or harm. I aggregated these measures into a single dichotomous
variable, reflecting whether students ever avoided places at school due to fear of
victimization, or if they had never avoided places in school due to this reason.2 Table 6
indicates that only a small percentage, specifically 5.3%, of students ever reveal avoiding
places in school.
Analytic Strategy
Because of the dichotomous nature of these variables, I used logistic regression
analyses to assess the effects of situational crime prevention on violent and property
victimization, delinquency, and avoidance behaviors. In an attempt to gain a clear
understanding of what specific prevention techniques have what particular effect on
delinquency, victimization, and avoidance behaviors, each security measure was included
separately into the models. This allowed me to see what effect that practice had on the
2 Initially, avoidance was aggregated into two outcomes representing avoidance of places inside schools
and avoidance of places outside of schools to provide more meaningful insights, however these variables
were associated with an extremely low number of cases in some categories. An avoidance scale was also
constructed to reflect the degree to which students’ avoided places due to fear, however, this was also
associated with extremely low cases in some categories. Furthermore, it was decided that the quantity of
places avoided was not really that meaningful to this study, and so a dichotomous variable of whether or
not students’ engaged in avoidance behaviors was used in the analysis.

33
outcome variable, not taking into account any other situational crime prevention practice.
Some control variables are not relevant to some of the questions posed here, therefore I
only included the control variables deemed appropriate for the specific outcome.
For the regression models assessing the impact of situational prevention measures
on victimization, including property and violent victimization, I controlled for school
characteristics as perceived by the students, including the perceived level of crime in the
school and surrounding area, in addition to whether the school is public or private and in
an urban area. Due to the cross-sectional nature of this data, I controlled for crime and
delinquency in the context of the school as an attempt to control for pre-existing crime in
the school. Lastly, I controlled for the student demographics, such as age, race, and sex to
control for the potential effects of individual characteristics on victimization.
For the model assessing the impact of situational crime prevention techniques on
some measures of self-reported delinquency, I controlled for perceived school
characteristics including the perceived level of crime in and around the school, whether
the students go to a school in an urban area versus a rural area, and whether the school is
public or private. In addition, I controlled for students’ involvement in school activities
and academics, as it is often theorized that individuals with stronger bonds to
conventional things and ideas (such as going to college after high school) will be less
likely to engage in delinquent behavior than those with weaker bonds (Hirschi, 1969). I
also controlled for students’ attitudes towards school authority in this model, as students
who perceive that their teachers and school rules are fair will be more compliant and
34
engage in less delinquency than those who perceive unfair treatment, according to tenets
of procedural justice. Finally, I controlled for individual student demographics.
The fifth and last model assesses the relationship between situational crime
prevention techniques and student avoidance behavior. As in previous models, I
controlled for perceived school characteristics such as the perceived crime in school,
urbanicity and whether the school is public or private. I also controlled for demographic
characteristics of students, including their race, sex and age. Finally, I controlled for prior
victimization, as being a victim of violent or property crime may impact one’s avoidance
of certain spaces within and around the school due to fear of further victimization.
The coefficients of the variables in the model are represented as odds ratios.
These are interpreted as a null effect if the presence of a situational crime prevention
measure is associated with a coefficient equal to 1. If the coefficient is greater than or less
than 1, the odds of experiencing the outcome due to the presence of a situational crime
prevention measure are increased or decreased respectively, net of other variables. I
included the situational crime prevention variables separately into the model to determine
whether certain types of prevention measures had more or less of an effect net of all other
prevention measures. Further tests of goodness of model fit, specification and sensitivity
analyses, and multicollinearity diagnostics amongst the predictor variables were
performed, and are included in the logistic regression tables for each outcome, or as
footnotes throughout the discussion.

35
CHAPTER FOUR
Victimization Results
I used logistic regression to estimate whether there was a relationship between the
type of situational crime prevention used on various harmful behaviors; namely,
victimization, delinquency, and avoidance in school. To assess whether situational crime
prevention measures had any bearing on whether students were more or less likely to be
victimized at school, I employed logistic regression analysis on a dichotomous outcome
of victimization, specifically, whether or not a student had ever been victimized.
However, one of the aims of this study is to determine if situational crime prevention
measures based on different opportunity-reducing techniques have differential effects on
certain types of crime or delinquency. According to Clarke (1995), opportunity structures
for crime differ by crime type, and so crime prevention measures should be tailored to
those specific types to be most effective. Therefore, one might expect that certain
prevention techniques have more of an effect on some crimes versus others. For instance,
a metal detector might impact the amount of gun violence that occurs more so than it
affects how often students get in fights. To determine if the situational crime prevention
practices reported in schools have differential effects on different types of victimization, I
performed two logistic regression analyses with violent victimization and property
victimization as respective outcomes.
Any victimization

36
The results from the model assessing the likelihood of students ever being
victimized are presented in Table 7. As reflected in the table, the only situational crime
prevention variables that had a significant effect on the likelihood of victimization were
security cameras, metal detectors, and having adults in hallways3. Net of all other
statistical controls in the model, the use of security cameras was associated with a 55%
increase (OR=1.548; p=0.001) in the likelihood of a juvenile reporting ever being
victimized. This was surprising as one would expect that an increased presence of
guardianship (through security cameras, security guards, or adults in the halls) would
negatively affect the likelihood of one being victimized because it presumably increases
the risk of being caught and should thereby deter. It may be that security cameras are
used more heavily within schools where more victimization occurs. Because of the cross-
sectional nature of this data, one cannot say with certainty that the security cameras led to
more victimization or vice versa. This is a necessary caveat to consider when interpreting
these effects, and a limitation of the data that will be discussed more thoroughly in the
next chapter.
In addition to security cameras, merely having adults in the school hallway was
associated with approximately a 24% decrease in the likelihood of victimization
(OR=0.761, p=0.07) compared to students who did not report this practice, net of other
3 A Link test was performed on the “ever victimized” model to determine model specification. This test is
based on the notion that if a model is correctly specified, there should be no additional predictor variables
that are significant except by chance. A significant link test (_hatsq, p < 0.05) indicates model
misspecification, and may further indicate that some relevant variables were omitted from the model or that
the link function (in this case, logit) was incorrectly specified (UCLA Statistical Consulting Group). The
Link test for this model was not significant, indicating that the model was not misspecified. A classification
table was performed for sensitivity analysis, returning a true positive rate of 16.73% at a cutoff level of .3.

37
situational crime prevention measures and other controls. This is in support of the notion
that having more guardianship in place might decrease the likelihood of students ever
being victimized. Metal detectors were also associated with a decrease in the likelihood
of victimization (OR=0.74, p=0.09).
Table 7 also reveals that older children were less likely to report having been
victimized, which is consistent with what one might expect. Hispanic students and other
race students were associated with a lower likelihood of being victimized as compared to
white students.4 Whether a school was in an urban or rural location did not seem to bear
any weight on likelihood of victimization, however the perceived amount of crime in the
neighborhood of the school and within the school was associated with large increases in
the odds of students reporting victimization. For instance, students who perceived high
crime in the neighborhood surrounding their school were about 45% (OR=1.457,
p=0.002) more likely to report being victimized than those who reported low or no crime.
Furthermore, students who reported a higher drug and gang prevalence in their schools
were more likely to have been victimized. Having more drug availability in school was
associated with a 170% increase (OR=2.71, p=0.000) in the odds of being victimized
than no drug availability. Similarly, students who reported gang presence in their school
were almost 80% more likely (OR=1.78, p=0.000) to be victimized than students who
reported having no gang presence in their school.
Property victimization
4 A Wald test revealed that the “race” categorical variable was significant overall (chi2(3) = 8.61, p=0.03),
and thus we can reject the null hypothesis that there is no difference between categories.
38
Table 8 details the results from the property victimization model.5 Overall, it
appears that there is support for my hypotheses that there are differential effects on
different types of victimization that may be missed from aggregating the outcome into
one measure of “never vs. ever victimized”. The coefficients in Table 8 suggest that there
is some support for certain types of guardianship reducing the likelihood of students
experiencing property victimization, while other forms of guardianship are associated
with increased odds of experiencing property victimization. For instance, having staff or
adults in the hallways was associated with a 44% decrease (OR=0.562; p=0.004) in the
likelihood of a student being the victim of a property crime net of other situational crime
prevention practices, and student and school characteristics. On the other hand, security
cameras, which also constitute a form of guardianship were associated with a 54%
increase (OR=1.539; p=0.033) in the likelihood of being a victim of property crimes net
of other factors.
Having metal detectors was also a significant predictor of decreased property
victimization. Students that reported having metal detectors at their school were 40% less
likely (OR=0.60; p=0.057) of being victims of property victimization compared to those
who did not report having metal detectors. Similar to the model assessing any
victimization, older children and females were less likely to experience property
victimization than younger, male students. The racial characteristics of students did not
affect likelihood of property victimization in this model. Whether students went to a
5 The link test performed for this model was not significant (_hatsq=-.067, p=0.516) indicating model
misspecification is unlikely; the classification table revealed a true positive rate of 6.28%.

39
public school and whether it was located in an urban setting also had little impact on
whether a student experienced property victimization.
Having more crime in school significantly increased the likelihood of students
experiencing property victimization. High crime in the neighborhood surrounding the
school was associated with a 58% increase in the odds of experiencing property
victimization (OR=1.57, p=0.007). Additionally, drug and gang prevalence were the
largest predictors for experiencing property victimization at school, with drug availability
being associated with a 120% increased likelihood (OR=2.22, p=0.000), and gang
presence being associated with a 97% increased likelihood (OR=1.97, p=0.000) in
students experiencing property victimization.
Violent victimization
The results from the logistic regression of the predictor variables on violent
victimization are detailed in Table 9.6 The results from this analysis echoed similar
results to the property victimization outcome. However, upon conducting the Link test for
model specification and Hosmer-Lemeshow goodness of fit test and finding both tests
significant, I included in the model the predictor variable for delinquency, as I theorized
youth who engaged in bad behaviors such as bringing weapons to school and fighting
would be more likely to report being violently victimized.7 With the addition of the
6 The link test for the model including delinquency was significant (_hatsq=-.08, p=0.034) indicating
potential specification issues; a classification table revealed an 88.69% of correctly classified predictions of
the dependent variable, however only 25.46% of these were correctly classified as true positives. 7 A test of multicollinearity among predictor variables, including delinquency, was conducted using Stata
13’s COLLIN command. The mean VIF score was 1.13, and ranged from 1.03 (female) to 1.32 (drugs),
indicating that multicollinearity is likely not an issue among these variables.
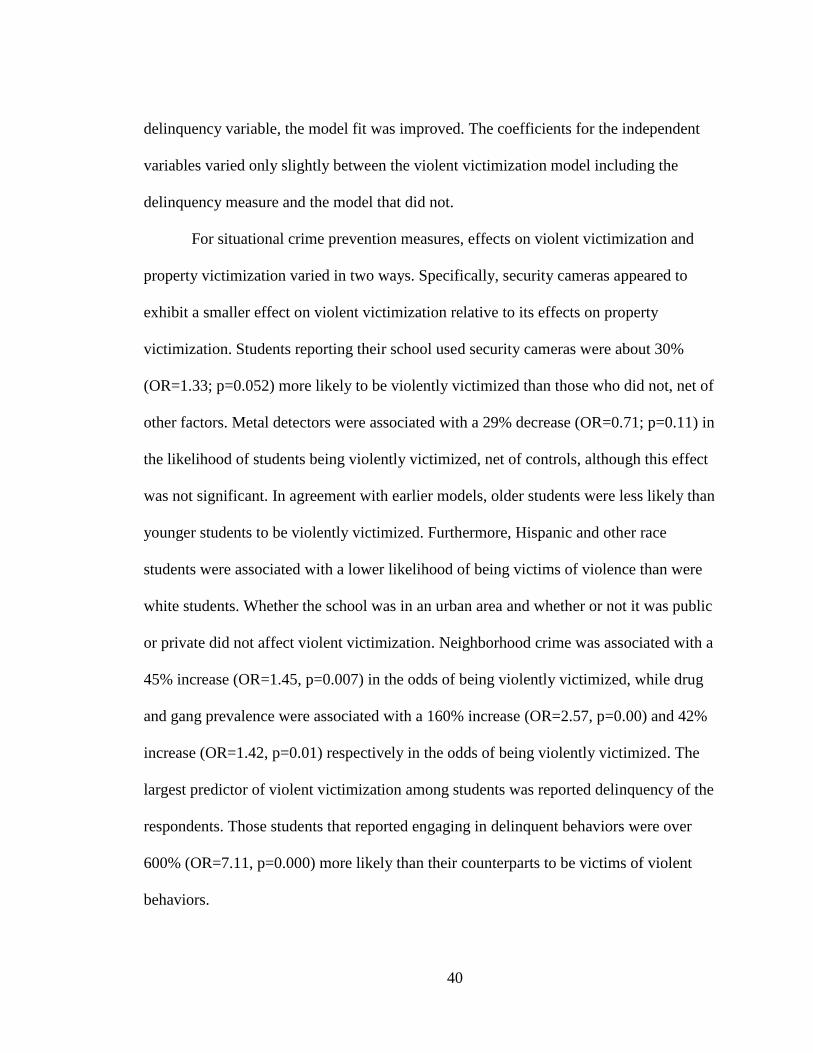
40
delinquency variable, the model fit was improved. The coefficients for the independent
variables varied only slightly between the violent victimization model including the
delinquency measure and the model that did not.
For situational crime prevention measures, effects on violent victimization and
property victimization varied in two ways. Specifically, security cameras appeared to
exhibit a smaller effect on violent victimization relative to its effects on property
victimization. Students reporting their school used security cameras were about 30%
(OR=1.33; p=0.052) more likely to be violently victimized than those who did not, net of
other factors. Metal detectors were associated with a 29% decrease (OR=0.71; p=0.11) in
the likelihood of students being violently victimized, net of controls, although this effect
was not significant. In agreement with earlier models, older students were less likely than
younger students to be violently victimized. Furthermore, Hispanic and other race
students were associated with a lower likelihood of being victims of violence than were
white students. Whether the school was in an urban area and whether or not it was public
or private did not affect violent victimization. Neighborhood crime was associated with a
45% increase (OR=1.45, p=0.007) in the odds of being violently victimized, while drug
and gang prevalence were associated with a 160% increase (OR=2.57, p=0.00) and 42%
increase (OR=1.42, p=0.01) respectively in the odds of being violently victimized. The
largest predictor of violent victimization among students was reported delinquency of the
respondents. Those students that reported engaging in delinquent behaviors were over
600% (OR=7.11, p=0.000) more likely than their counterparts to be victims of violent
behaviors.
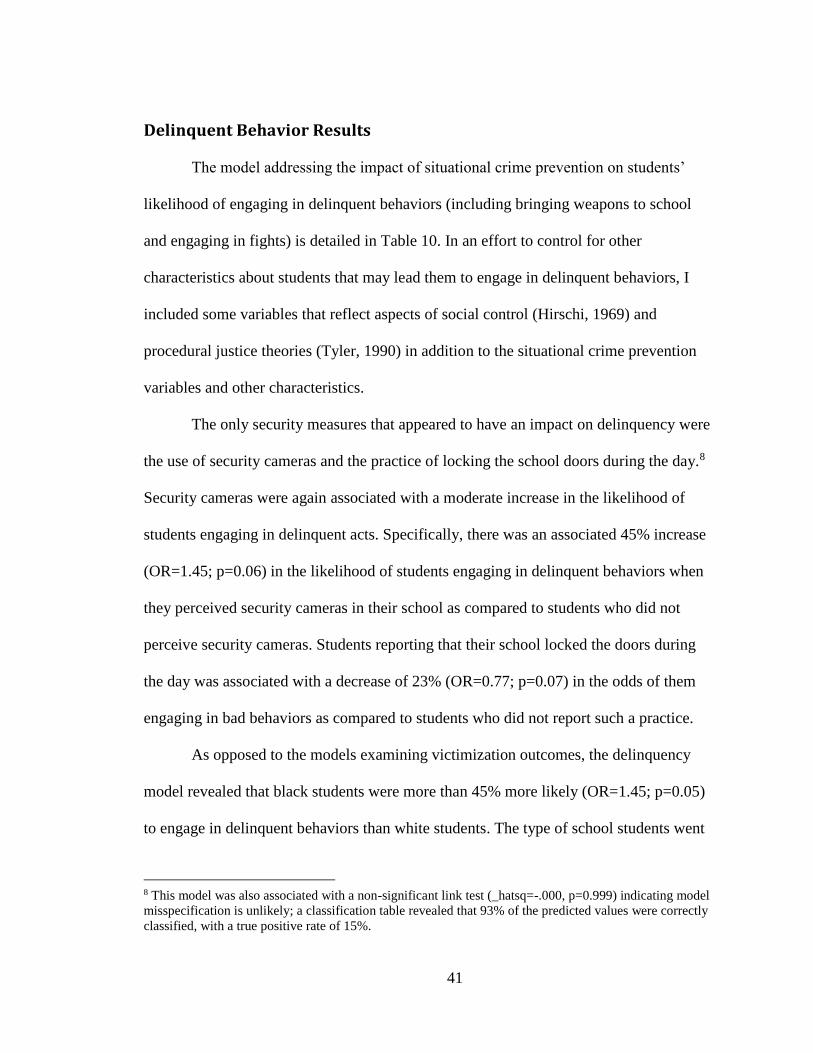
41
Delinquent Behavior Results
The model addressing the impact of situational crime prevention on students’
likelihood of engaging in delinquent behaviors (including bringing weapons to school
and engaging in fights) is detailed in Table 10. In an effort to control for other
characteristics about students that may lead them to engage in delinquent behaviors, I
included some variables that reflect aspects of social control (Hirschi, 1969) and
procedural justice theories (Tyler, 1990) in addition to the situational crime prevention
variables and other characteristics.
The only security measures that appeared to have an impact on delinquency were
the use of security cameras and the practice of locking the school doors during the day.8
Security cameras were again associated with a moderate increase in the likelihood of
students engaging in delinquent acts. Specifically, there was an associated 45% increase
(OR=1.45; p=0.06) in the likelihood of students engaging in delinquent behaviors when
they perceived security cameras in their school as compared to students who did not
perceive security cameras. Students reporting that their school locked the doors during
the day was associated with a decrease of 23% (OR=0.77; p=0.07) in the odds of them
engaging in bad behaviors as compared to students who did not report such a practice.
As opposed to the models examining victimization outcomes, the delinquency
model revealed that black students were more than 45% more likely (OR=1.45; p=0.05)
to engage in delinquent behaviors than white students. The type of school students went
8 This model was also associated with a non-significant link test (_hatsq=-.000, p=0.999) indicating model
misspecification is unlikely; a classification table revealed that 93% of the predicted values were correctly
classified, with a true positive rate of 15%.

42
to and how much crime they perceived at school were associated with quite large effects
on his or her likelihood of engaging in delinquent behaviors, though this effect was not
statistically significant. Those who attended public schools were about 80% more likely
(OR=1.81; p=0.11) to engage in certain delinquent behaviors compared to those who
attended private schools and net of all other factors in the model. Students who reported
having a higher degree of crime in the neighborhood around their school were 36% more
likely (OR=1.36, p=0.06) to engage in delinquent behaviors than those who reported little
to no crime. Students reporting gangs and more drug availability were 72% (OR=1.72,
p=0.001) and 76% (OR=1.76, p=0.000) more likely to have engaged in delinquent
behaviors than those that did not report these issues.
Being involved in more extracurricular activities at school did not have a
substantial effect on student delinquent behaviors, however students who did well
academically were much less likely than their counterparts to engage in delinquency. For
instance, students reporting receiving mainly Bs were 40% more likely than those that
report receiving mainly As to engage in delinquency. Interestingly, students reporting
average academic performance (receiving mainly Cs) were associated with a 230%
increase in the odds of being delinquent as compared to those who reported receiving
mainly As in school. The trend is similar for students who receive mainly Ds or Fs, where
those students are about 250% more likely to report engaging in delinquency. Students
that reported more positive attitudes towards school authority were less likely than those
with negative attitudes to engage in delinquent behaviors.

43
Avoidance Results
The final model, detailed in Table 11, focused on avoidance as an outcome, where
avoidance was operationalized as whether a student had ever avoided a place in or around
school grounds for fear of victimization.9 It would have been preferable if avoidance
could be unpacked into avoidance of conceptually different locations (i.e. avoidance of
hallways versus restrooms, or avoidance of locations inside the school versus on the
school grounds), however some of the categories of the different locations contained so
few cases that it would have likely produced an unstable model.10
In addition to controlling for student and perceived school characteristics, I also
controlled for previous victimization, as that may be a major determinant of avoidance
behavior if a student is avoiding places due to fear of (possible further) victimization.
Indeed, the variable for prior victimization showed the largest effect size. Those students
who reported ever being victimized were more than 540% more likely (OR=6.44;
p=0.000) than those who were not victimized to avoid places in or around the school due
to fear of victimization. Taking this and other factors into account, it appears that there
are several situational crime prevention measures that had a small impact on the
avoidance behaviors of students. The practice of making students wear ID badges was the
9 This model was associated with a non-significant linktest (_hatsq=-.096, p=0.068) indicating good model
specification; additionally, sensitivity analysis revealed a true positive classification rate of 17.17%. 10 In an effort to represent the degree of avoidance as a possible value on a scale, I created a scale of
avoidance based on how many areas within and around the school a student reported avoiding. Therefore,
the more places he or she reported avoiding, the higher the score they received on the avoidance scale.
However, this outcome was transformed into a dichotomous variable due to most cases being concentrated
in the smallest two scores of the avoidance scale. Furthermore, the scale could only give information on
how many places a student avoided. This is not particularly meaningful in the context of this study, as it
does not touch on what areas are more likely to be avoided so that situational crime prevention measures
may be implemented in those areas.
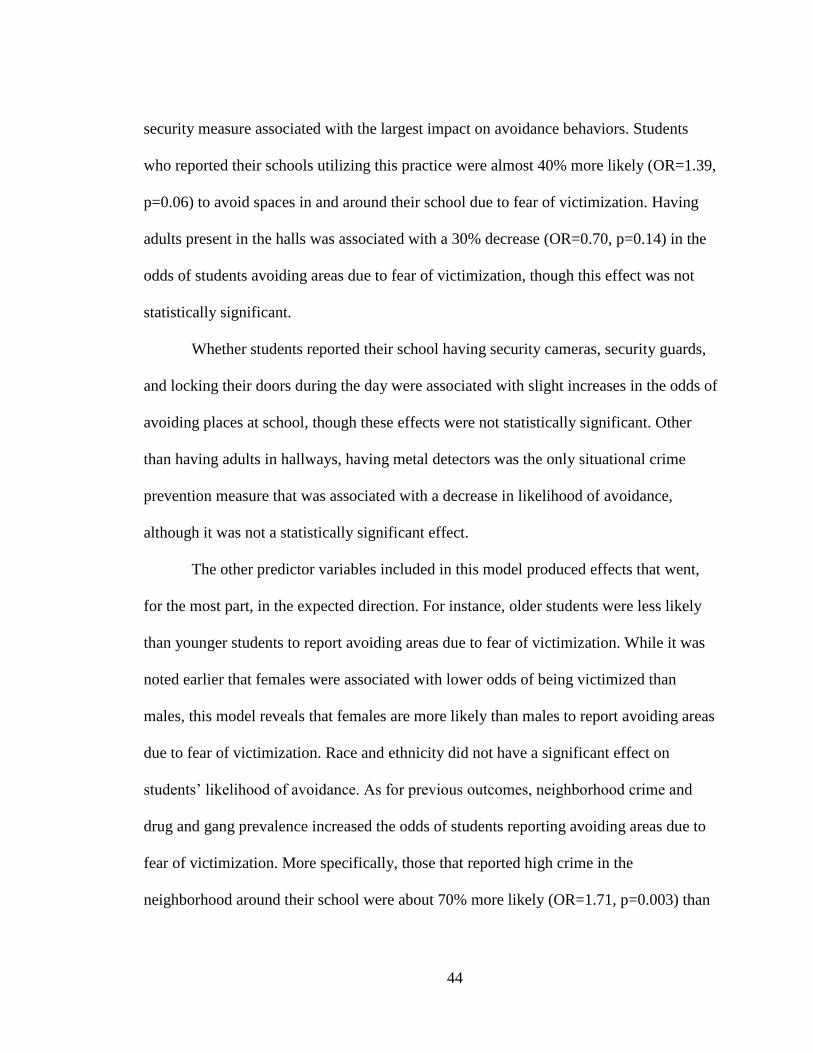
44
security measure associated with the largest impact on avoidance behaviors. Students
who reported their schools utilizing this practice were almost 40% more likely (OR=1.39,
p=0.06) to avoid spaces in and around their school due to fear of victimization. Having
adults present in the halls was associated with a 30% decrease (OR=0.70, p=0.14) in the
odds of students avoiding areas due to fear of victimization, though this effect was not
statistically significant.
Whether students reported their school having security cameras, security guards,
and locking their doors during the day were associated with slight increases in the odds of
avoiding places at school, though these effects were not statistically significant. Other
than having adults in hallways, having metal detectors was the only situational crime
prevention measure that was associated with a decrease in likelihood of avoidance,
although it was not a statistically significant effect.
The other predictor variables included in this model produced effects that went,
for the most part, in the expected direction. For instance, older students were less likely
than younger students to report avoiding areas due to fear of victimization. While it was
noted earlier that females were associated with lower odds of being victimized than
males, this model reveals that females are more likely than males to report avoiding areas
due to fear of victimization. Race and ethnicity did not have a significant effect on
students’ likelihood of avoidance. As for previous outcomes, neighborhood crime and
drug and gang prevalence increased the odds of students reporting avoiding areas due to
fear of victimization. More specifically, those that reported high crime in the
neighborhood around their school were about 70% more likely (OR=1.71, p=0.003) than

45
those who reported low or no crime to practice avoidance. Similarly, students who
reported more drug availability were about 65% more likely (OR=1.65, p=0.006) than
those who did not to avoid places due to fear, and those who reported a gang presence in
school were over 100% more likely (OR=2.02, p=0.000) to avoid places due to fear of
victimization.

46
CHAPTER FIVE
Discussion
According to opportunity theories of crime, potential offenders take into account
environmental and situational variables when deciding to engage in bad behaviors
(Clarke, 1983, 1995; Felson and Clarke, 1998). Predicated on these theories, situational
crime prevention is hypothesized to reduce opportunities for bad behavior by increasing
risks of being caught and increasing the effort it takes to engage in the behavior net of
individual motivation. In this analysis, I hypothesized that situational crime prevention
measures work to reduce property and violent victimization, certain delinquent behaviors,
and avoidance behaviors, in the context of middle and high schools. The results suggest
that there is some mild support for these hypotheses.
Several of the security measures in the analyses hold promise for reducing certain
behaviors, while some were associated with an increased likelihood that students would
engage in or experience these behaviors. For instance, situational crime prevention
measures that fall under the technique of increasing the risks of being caught exhibited
varied effects on both violent and property victimization. Where having adults present in
the halls at school reduced the likelihood of students being victimized, security cameras
produced the opposite effect, and actually increased students’ likelihood of being
victimized by a large degree.
As security cameras are a form of guardianship, one might expect that their
presence would increase students’ perception of risk of being caught engaging in bad

47
behavior, similar to adults in hallways. However, the lack of information on where these
cameras are fixed is problematic in properly assessing their effectiveness, especially as
compared to the practice of having adults in the hall. For instance, if security cameras are
predominantly fixed to points of entry, this would presumably not act as a guardian to
behavior occurring deeper inside the school.
Security cameras are also more distal from potential crime events than other
forms of guardianship, such as adults walking the halls, and therefore may not affect
offender calculus as readily as live guardians. There may be less certainty about the risks
of being caught associated with security cameras, as these are dependent on someone to
monitor the CCTV in order to pose a threat. Should the school not have an active monitor
watching the CCTV, the presumed risk attached to having security cameras would be
null.
As the associated effect of security cameras was an increased likelihood of being
victimized and not a null effect, it may be the case that security cameras are a product of
more crime-ridden schools. As students who reported being victimized were associated
with very large odds of being delinquent themselves, it may also be the case that security
cameras are merely noticed more by students who intend to engage in bad behaviors.
Owing to the cross-sectional nature of the data, it is not possible to rule out that the
positive effect of security cameras is a product of more crime-ridden schools and not the
cameras themselves, as these may be more frequently a feature of high crime schools
than those with little to no crime.

48
Having adults monitor school halls is also a situational crime prevention measure
associated with increasing the risk of being caught. This practice was associated with a
decrease in victimization, while similar guardianship practices such as having security
guards or SROs were associated with null effects. Victimization, as I studied it here,
included such things as having one’s property destroyed, or being hit or pushed. These
types of victimization theoretically would be affected by increased guardianship through
increasing the likelihood that students will be seen and disciplined by school staff when
they attempt to victimize fellow students in this way. Subscribing to the propositions of
the routine activities perspective, requiring adults to stand in hallways leads to more
guardianship opportunities than if a school relies solely on a likely small number of
security guards or SROs to patrol hallways.
For situational crime prevention measures predicated on making it more difficult
to engage in certain behaviors, metal detectors were associated with lower odds of
students falling victim to property crimes. Metal detectors are what Cornish and Clarke
(2003) refer to as a “facilitator control” measure, in that these devices are designed to
control the flow of weapons such as guns and knives that can be used to facilitate
criminal activity. While it would be expected that metal detectors would decrease the
odds of victimization involving weapons, the study revealed that the odds of experiencing
property victimization is decreased with the presence of a metal detector. However, as I
measured property victimization in this study as whether students had ever had their
property destroyed on purpose, or whether someone had ever made them do something
such as give up money, it seems likely that this effect of metal detectors is due to the

49
measure that included giving up money by force, as one way to coerce would be to utilize
a weapon. This point will be further discussed in the limitations.
These results produce partial support for the first two hypotheses of this study,
that situational crime prevention measures decrease the likelihood of students
experiencing violent and property victimization, net of other factors. Where there were
promising effects from merely having adults and staff members in halls at school and
having metal detectors, there were also detrimental effects of security cameras that
contributed to more victimization. The only security measures that did not appear to have
an effect on victimization of any type were locking doors, security guards, schools
requiring students to wear ID badges and conducting locker checks at random.
Likewise, the hypothesis that situational crime prevention measures decrease the
likelihood of students engaging in delinquent behaviors was also partially supported. The
school practice of locking doors during the day was associated with a significant decrease
in delinquent behavior. Locking doors, which is an access control measure, decreases the
opportunity students have to move freely in and out of the school and out of sight of
school faculty and staff. Thus it also decreases the opportunity for engaging in delinquent
behaviors through keeping students inside the school, where there may be more
guardianship as opposed to, for instance, the school grounds. The only other security
measure that produced an effect on delinquent behavior was security cameras, which
produced a moderate increase, though this may potentially be due to schools with more
crime more so than the security cameras themselves.
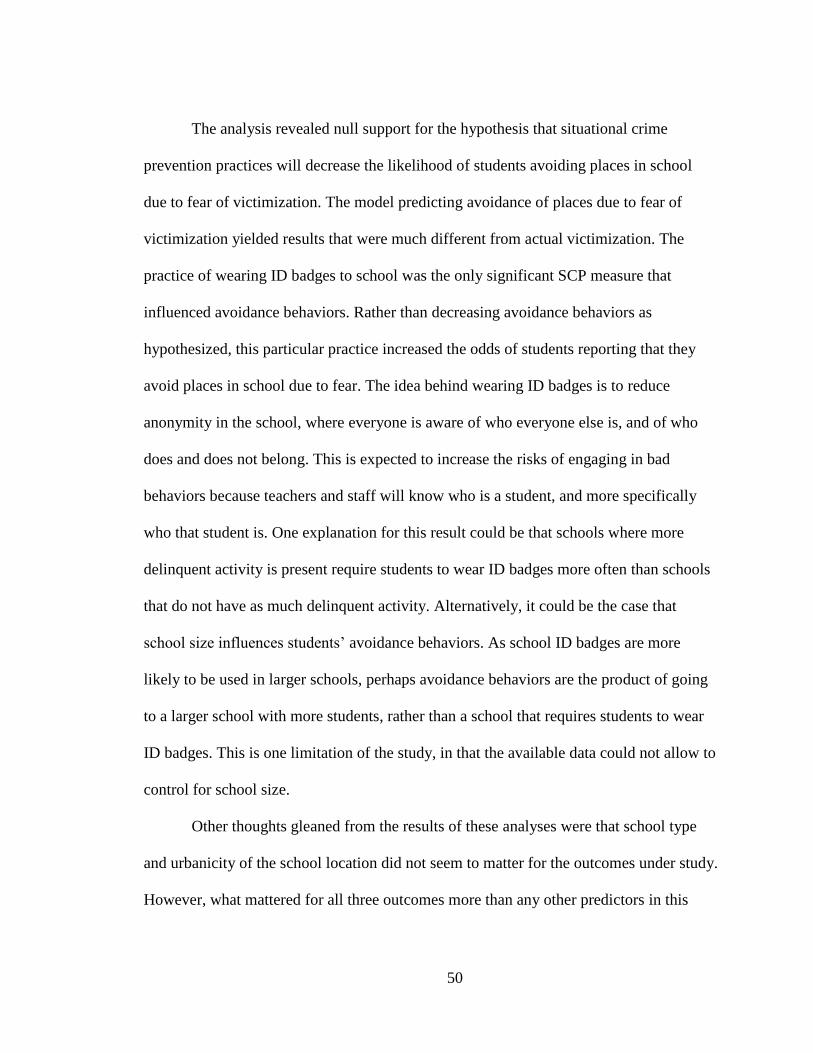
50
The analysis revealed null support for the hypothesis that situational crime
prevention practices will decrease the likelihood of students avoiding places in school
due to fear of victimization. The model predicting avoidance of places due to fear of
victimization yielded results that were much different from actual victimization. The
practice of wearing ID badges to school was the only significant SCP measure that
influenced avoidance behaviors. Rather than decreasing avoidance behaviors as
hypothesized, this particular practice increased the odds of students reporting that they
avoid places in school due to fear. The idea behind wearing ID badges is to reduce
anonymity in the school, where everyone is aware of who everyone else is, and of who
does and does not belong. This is expected to increase the risks of engaging in bad
behaviors because teachers and staff will know who is a student, and more specifically
who that student is. One explanation for this result could be that schools where more
delinquent activity is present require students to wear ID badges more often than schools
that do not have as much delinquent activity. Alternatively, it could be the case that
school size influences students’ avoidance behaviors. As school ID badges are more
likely to be used in larger schools, perhaps avoidance behaviors are the product of going
to a larger school with more students, rather than a school that requires students to wear
ID badges. This is one limitation of the study, in that the available data could not allow to
control for school size.
Other thoughts gleaned from the results of these analyses were that school type
and urbanicity of the school location did not seem to matter for the outcomes under study.
However, what mattered for all three outcomes more than any other predictors in this

51
study were the variables indicating crime prevalence in and around the school. Students
who reported high crime in the neighborhood that their school was located were much
more likely to be victimized, engage in delinquent behaviors, and avoid areas due to fear,
than those who reported little to no crime in the neighborhood. For indicators of crime
inside the school itself, drug prevalence had a larger impact on victimization and
delinquent behaviors than gang presence, however, gang presence had a larger effect on
avoidance behaviors due to fear than the prevalence of drugs and alcohol. The fact that
these measures were associated with much larger effects on the outcomes than any of the
situational crime prevention variables has implications for policy regarding school safety,
and will be discussed in the section below.
Older students also were less likely to be victims of any crime, engage in
delinquent behaviors, and avoid places due to fear, which suggests that middle schools
might benefit more from certain security practices than high schools. Interestingly,
females were at lower risk of being victimized, but were more likely to avoid places due
to fear of being victimized, though it could also be that their avoidance serves as a
protective factor resulting in less actual victimization.
Other variables that produced larger effects on delinquency than situational crime
prevention measures included the social control variable associated with attachment to
school, academic achievement. Students’ academic achievement was a better predictor of
involvement in delinquent activity than any of the situational crime prevention practices
included in this study. What is most interesting about this effect is that students did not
necessarily have to report bad grades for their likelihood of engaging in delinquency to

52
increase. Rather, students with average GPAs fared about the same as students who
reported the worst GPAs in terms of delinquency involvement. This has implications not
just for policy that might be directed towards enhancing academic achievement, but more
generally, it has implications for what theories we might base our policy
recommendations after, if not one of situational crime prevention and opportunity
theories.
Policy implications
These results suggest that students who go to middle schools where they perceive
a significant presence of drugs and gangs, and that are located in more criminogenic
neighborhoods are the most beneficial target for implementation of school security
measures including certain situational crime prevention practices. Interestingly enough,
the results from this study suggest that the most promising situational crime prevention
practices are ones that schools can easily employ. By requiring staff to stand in the halls,
schools may reduce victimization and avoidance by students who are afraid of being
victimized. Such was the case in one Tennessee high school, where the policy of “being
visible” by requiring teachers to stand in the hallways between classes instead of taking a
break at their desks substantially reduced the number of fights that had to be broken up,
according to the Principal (Wall Street Journal, 2009). By locking doors in the school
during the day, schools can significantly reduce the amount of delinquent behavior
committed by students. Implementing metal detectors in schools also reduces
victimization amongst students, however these devices are costly and may not be realistic
for school districts that are already stretched thin on resources. While this research has

53
shown these approaches to be effective, the potential benefits of implementing them in
practice must be weighed against the associated costs. As mentioned previously, some
school districts may not have the monetary resources to allocate towards physical security
measures, especially if this detracts from important educational and extracurricular
programs. Furthermore, implementing practices requiring school staff to stand in
hallways for a large portion of time might infringe on their primary duties or lead to staff
“burnout.” These are considerations that must be made when deciding to implement these
measures in practice, as priorities differ from school to school.
The large effects associated with gang and drug prevalence in schools on all three
types of outcomes also suggests the potential benefit of funding prevention practices that
are not just situational prevention. Perhaps in hopes of reducing victimization,
delinquency, and avoidance due to fear, funds intended for enhancing school safety might
be more efficiently spent on programs or interventions that are geared towards
combatting gang activity and presence within schools, or towards lessening the
availability of drugs. The results presented in this study suggest that targeting these
characteristics will produce a more marked reduction in the negative outcomes studied
here than the situational crime prevention practices included in this study.
Similarly, the large impact neighborhood crime had on victimization,
delinquency, and avoidance, relative to situational crime prevention measures, suggests a
need to look beyond the immediate context of the school. Schools and behaviors
occurring within do not exist in a vacuum, and are rather affected by the community in
which they are situated. This serves as an added incentive for implementing enhanced

54
crime prevention practices in higher crime communities, as this negatively impacts
students in the schools within these communities.
Limitations and future research
There are several limitations of this study that require mention. Perhaps the most
important limitation is the lack of information about some of the situational crime
prevention practices. For some variables, such as the security guard and security camera
variables, more information may be needed on the placement of these mechanisms in the
school itself before making sound conclusions about their efficacy. It would be preferable
to know where the security cameras were located within the school, and where security
guards spend most of their time (i.e. is it in an office or do they walk around the school?).
Because I do not know this information, it makes it difficult to say with certainty that
these security measures are less effective than having staff and other adults present in the
halls. That said, it does seem likely that adults in the hallway would be more effective
than security guards or school resource officers because they occupy more space than one
or two security guards.
Additionally, one might expect that the effect of having adults and staff in the
hallways would be more effective at preventing delinquent behaviors than security
cameras. Although security cameras constitute a form of guardianship, they are more
distal from the situation than human guardianship. Security cameras are not able to react,
respond, or intervene when, for example, two students begin fighting. Security cameras
do not produce an imminent threat for being caught and disciplined, and so may not have
the same effects on offender calculus than live and capable guardians. Additionally,

55
schools that are under-resourced may affect the utility of security cameras to serve as
guardians, as schools that are unable to afford someone to watch camera feeds may
delegate the job to SROs or other staff, thus taking valuable guardians out of visible
space.
However, if this were the case, it seems likely that security cameras would
produce a null effect on victimization and delinquency, rather than a large and positive
effect. It may be that schools that have more problems with crime and delinquency use
security cameras more often than schools that are not faced as strongly with these issues.
Though I attempted to control for this issue in the analyses, the crime variable was not an
objective measure of crime (and was rather several variables assessing student
perceptions of crime indicators in and around their school) and thus could not adequately
capture the actual occurrence of crime in the school. The lack of objective measures also
may have affected measurement of the situational crime prevention practices themselves,
as those who have been victimized (or are simply more aware) may be more aware of
these measures than others.
As mentioned previously, the measurement of these variables may also affect how
one should interpret the results. For instance, I included the item of whether students had
ever been forced to do something against their will, such as give up money, in the
variable measuring property victimization. The analysis revealed a decrease in property
victimization from metal detectors, however this could be due to the fact that forcing
someone to give up money could be considered an act of forceful robbery. A potential
limitation is that this impact of metal detectors could be getting at this notion of robbery,

56
potentially with weapons, rather than property crimes as a whole, as metal detectors may
deter weapons carrying related to robbery.
This analysis was further limited by the cross-sectional nature of the data, which
makes it difficult, if not impossible, to make causal statements with confidence. Because
the data comes from a single point in time, it is hard to infer that any of these situational
crime prevention measures led to the associated effects on the three outcomes, and not
the other way around. However, these limitations are issues that may be addressed
through further research. A more thorough examination of situational crime prevention
measures in school could employ experimental methods to make causal statements more
appropriate. For instance, implementing new school procedures that entail staff standing
in the hallways during breaks in one school and comparing it to a school without this
practice will enhance our ability to make causal statements. Additionally, more
(objective) information about the implementation of situational crime prevention
measures would be helpful in parsing out what tactics hold promise. Information that
would be especially helpful to know are the frequency of use and location (where certain
practices are employed within the school in relation to the outcome measures). Since
many of these measures are contingent on location, it would be helpful to know if this
changes effects on outcome measures.
Future research in this area may also seek additional measures that reflect the
constructs I was trying to test. Although student delinquency, as represented here,
reflected inappropriate behaviors that are undesirable in schools, it also represented
behaviors on the more extreme end of youth behavior. It is important to capture these
57
dimensions of delinquent behavior in schools, but future research would also benefit from
other measures of youth delinquency, such as truancy; substance abuse; selling drugs;
vandalism; and other unruly/disruptive behaviors. For situational crime prevention
measures, it would be beneficial to include additional survey questions that pertain to
other types of situational crime prevention in schools. For example, future surveys might
include questions on the practice of staggering times, such as staggered lunch hours or
staggered school dismissal hours, as these have implications on the routine activities of
youth.
58
CHAPTER SIX
Conclusion
Situational crime prevention measures are often used in schools as a preventive
measure to reduce the occurrence of crime and delinquency. While some mechanisms of
situational prevention are able to be implemented very quickly and with little investment
of resources (e.g. practicing to lock doors during the day), others can be quite expensive
to implement into the daily routine and environment of the school (e.g. metal detectors).
Therefore, one of my major goals in this analysis was to determine if and what situational
crime prevention measures were associated with strong effects on the relative outcomes
so as to determine ‘what works’ in reducing victimization, delinquent behaviors, and
avoidance behaviors in schools. This study reveals some support for my hypotheses that
situational crime prevention is effective in reducing these behaviors. The most support
was garnered for the inclusion of metal detectors in schools, and implementing practices
that require staff and adults in the hallways and locking doors during the day. On the
other hand, security cameras garnered the least support, demonstrating a marked increase
in the three outcomes.
Other findings generated from this study suggest that situational crime prevention
may not be the best way to address the overall issue of school safety. Although the
analyses revealed some support for the use of metal detectors, locking doors, and policies
of adults monitoring hallways, a negative school climate still remained the largest
predictor of students experiencing victimization, or engaging in delinquent behaviors or

59
avoidance. This suggests a need to target these characteristics of schools that are
associated with more negative outcomes, net of the situational crime prevention
measures.
The findings generated here further suggest the salience of certain other theories
of crime that may be useful to base our crime prevention efforts on. The academic
performance variable that was used to partially represent student’s school attachment
showed large effects on students’ likelihood of experiencing or engaging in victimization,
delinquency, or avoidance. This might indicate our need to look at policies that serve to
reduce these behaviors through strengthening students commitment to schooling, and
enhancing the learning environment of schools.
By targeting more comprehensive prevention measures towards schools in
neighborhoods that are particularly high crime, we may dramatically reduce the amount
of victimization, delinquency, and avoidance that occurs within those schools.
Furthermore, tailoring school prevention measures to address the issues of gangs and
drug availability within schools could also reduce these negative outcomes from
occurring.
These suggestions do not intend to preclude the use of situational crime
prevention measures in schools altogether. Rather, it is to draw attention to the fact that
there are other factors at play that may not be adequately mitigated by the use of
situational measures alone. Some of the situational crime prevention measures that were
associated with positive effects in this study, such as having adults monitor hallways or
locking doors during the day, are promising to schools that may not have the adequate

60
resources to implement metal detectors or extensive CCTV monitoring systems. For
schools that face these types of restraints, it is promising to know that through
institutionalizing these low-cost techniques, victimization of students and avoidance due
to fear may be significantly reduced.

61
APPENDIX A
Table 1: Crime in the United States 1990-2012
Year Population Violent Crime rate Property crime rate
1990 249464396 729.6 5073.1
1991 252153092 758.2 5140.2
1992 255029699 757.7 4903.7
1993 257782608 747.1 4740
1994 260327021 713.6 4660.2
1995 262803276 684.5 4590.5
1996 265228572 636.6 4451
1997 267783607 611 4316.3
1998 270248003 567.6 4052.5
1999 272690813 523 3743.6
2000 281421906 506.5 3618.3
2001 285317559 504.5 3658.1
2002 287973924 494.4 3630.6
2003 290788976 475.8 3591.2
2004 293656842 463.2 3514.1
2005 296507061 469 3431.5
2006 299398484 479.3 3346.6
2007 301621157 471.8 3276.4
2008 304059724 458.6 3214.6
2009 307006550 431.9 3041.3
2010 309330219 404.5 2945.9
2011 311587816 387.1 2905.4
2012 313914040 386.9 2859.2
National or state offense totals are based on data from all reporting agencies and estimates for unreported areas.
Rates are the number of reported offenses per 100,000 population
The 168 murder and nonnegligent homicides that occurred as a result of the bombing of the Alfred P.
Murrah Federal Building in Oklahoma City in 1995 are included in the national estimate
The murder and nonnegligent homicides that occurred as a result of the events of September 11, 2001, are
not included.
Sources: FBI, Uniform Crime Reports, prepared by the National Archive of Criminal Justice Data
Date of download: Dec 29 2014

62
Table 2: 25 opportunity reducing techniques
Increase the
Effort
Increase the
Risks
Reduce the
Rewards
Reduce
Provocations
Remove
Excuses
1.Target Harden:
-Tamper-proof
packaging
-Locker
combination
locks
6.Extend
guardianship:
-Neighborhood
watch
-Adults in
school halls
11.Conceal
targets:
-Off-street
parking
16. Reduce
frustrations and
stress:
-Polite service
-Expanded
seating
21. Set rules:
-Harassment
codes
-Code of conduct
2.Control access
to facilities:
-Electronic card
access
-Visitor sign in
7.Assist in
natural
surveillance:
-Defensible
space design
-Support
whistleblowers
12.Remove
targets:
-Removable
car radios
-Women’s
refuges
17. Avoid
disputes:
-Separate
enclosures for
rival sports fans
-Reduce
crowding in pubs
22. Post
instructions:
-“No Parking”
-“Private
Property”
3.Screen exits:
-Electronic
merchandise tags
-Export
documents
8.Reduce
anonymity:
-School
uniforms
-ID badges
13. Identify
property:
-Property
marking
-Vehicle
licensing
18. Reduce
emotional
arousal:
-Prohibit racial
slurs
-Controls on
violent
pornography
23. Alert
conscience:
-“Shoplifting is
stealing”
-Speed display
boards
4.Deflect
offenders:
-Separate
bathrooms
-Disperse pubs
9.Utilize place
managers:
-Reward
vigilance
-Two clerks for
convenience
stores
14. Disrupt
markets:
-Monitor pawn
shops
19. Neutralize
peer pressure:
-“Its OK to say
No”
-Disperse
troublemakers at
school
24. Assist
compliance:
-Public
restrooms
-Public trash bins
5.Control
tools/weapons:
-Restrict spray
paint sales to
juveniles
-Metal detectors
10.Strengthen
formal
surveillance:
-Security guards
-CCTV
15. Deny
benefits:
-Speed bumps
-Graffiti
cleaning
20. Discourage
imitation:
-Rapid repair of
vandalism
25. Control
drugs and
alcohol:
-Server
intervention
-Breathalyzers in
bars Adapted from Cornish, D.B., and Clarke, R.V. (2003) Opportunities, precipitators, and criminal decisions:
a reply to Wortley’s critique of situational crime prevention. Crime Prevention Studies. 16. 41-96

63
Table 3: SCP measure by technique
Increasing
Risks
Increasing Risks Increasing
Risks
Increasing
Effort
Increasing
Effort
Formal Surveillance
Employee Surveillance/utilize
place managers
Reduce Anonymity
Control tools or
weapons
Control access to
facilities
Security
guards and
police;
security
cameras
Adults supervise
halls; locker
checks
ID Badges Metal
detectors
Locked
doors

64
Table 4: Descriptive statistics for SCP
N Freq % Does school have security
guards?
5,710
No 1,777 31.12
Yes 3,933 68.88
Staff/Adults in hallway? 5,710
No 636 11.14
Yes 5,074 88.86
Metal detectors in school? 5,709
No 5,103 89.39
Yes 606 10.61
Does school have locked
doors?
5,710
No 2,036 35.66
Yes 3,674 64.34
Does school do locker
checks?
5,310
No 2,477 46.58
Yes 2,841 53.42
Does school require
students wear id?
5,710
No 4,326 75.76
Yes 1,384 24.24
Does school use security
cameras?
5,711
No 1,346 23.57
Yes 4,365 76.43
SCP-Effort 5,710
No 1,886 33.03
Yes 3,824 66.97
SCP-Risk 5,697
No 86 1.51
Yes 5,611 98.49

65
Table 5: Descriptive statistics for school and youth characteristics
N Freq. % Mean SD Range
Age 5,739 14.763 1.874 12-18
Race 5,738
White 3,338 58.2
Black 700 12.2
Hispanic 1,238 21.6
Other 462 8.1
Sex 5,739
M 2,902 50.6
F 2,837 49.4
Urban 5,739
No 1,069 18.6
Yes 4,670 81.4
Crime around
school
4,812
Low 2,131 44.3
High 2,681 55.7
Drug presence 4,989
No 3,070 61.54
Yes 1,919 38.46
Gang presence 4,820
No 3,855 79.98
Yes 965 20.02
School Type 5,733
Public 5,282 92.1
Private 451 7.9
Extracurricular
Activities
5,770
No 1,816 31.5
Yes 3,954 68.5
Grades 5,608
As 2,234 39.84
Bs 2,409 42.96
Cs 838 14.94
DFs 127 2.26
Attitudes toward
school authority
Index (1-4)
5,656
1 (least
favorable)
72 1.3
2 271 4.8
3 876 15.5
4 (most
favorable)
4,437 78.4

66
Table 6: Descriptive statistics for outcome variables
N Freq. %
Violent Victimization 5,690
No 5,099 89.6
Yes 591 10.4
Property Victimization 5,677
No 5,369 94.6
Yes 308 5.4
Ever Victimized 5,686
No 4,952 87.1
Yes 734 12.9
Delinquency 5,660
No 5,281 93.3
Yes 379 6.7
Avoidance 5,683
No 5,380 94.67
Yes 303 5.33

67
Table 7: Logistic Regression of SCP on any victimization
Odds Ratios P-value SE [ 95% CI ]
Victimized
Security guards 0.953 0.681 0.112 0.756 1.200
Metal detectors 0.743+ 0.096 0.133 0.523 1.054
Security cameras 1.549** 0.001 0.207 1.192 2.013
Locked doors 0.883 0.225 0.090 0.723 1.079
Locker checks 1.019 0.848 0.102 0.837 1.241
Staff/Adults in
hallway
0.761+ 0.070 0.114 0.567 1.023
Students wear ID 1.019 0.874 0.124 0.803 1.295
Age 0.772** 0.000 0.022 0.729 0.817
Female 0.892 0.239 0.086 0.738 1.078
Race
Black 0.913 0.564 0.144 0.669 1.244
Hispanic 0.702** 0.010 0.095 0.537 0.917
Other 0.699+ 0.081 0.143 0.467 1.046
Public School 1.205 0.367 0.249 0.803 1.807
Urban 0.995 0.967 0.126 0.775 1.275
High crime around
school
1.457** 0.002 0.177 1.147 1.851
Drug prevalence 2.718** 0.000 0.301 2.187 3.376
Gang prevalence 1.783** 0.000 0.215 1.406 2.259
Observations = 3,969
LR chi2 (17) = 235.93
Prob > chi2 = 0.000
Hosmer-Lemeshow
chi2(8) =
4.61

68
H-L Prob > chi2 = 0.798
Exponentiated coefficients + p < 0.10, * p < 0.05, ** p < 0.01
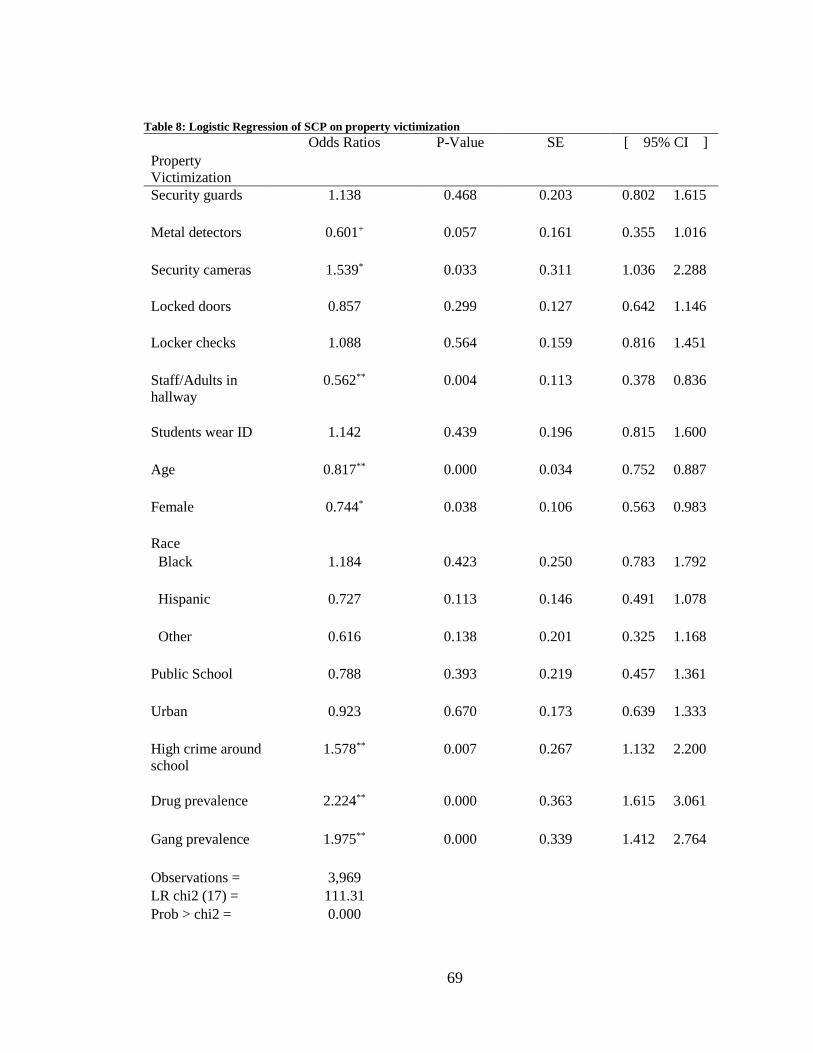
69
Table 8: Logistic Regression of SCP on property victimization
Odds Ratios P-Value SE [ 95% CI ]
Property
Victimization
Security guards 1.138 0.468 0.203 0.802 1.615
Metal detectors 0.601+ 0.057 0.161 0.355 1.016
Security cameras 1.539* 0.033 0.311 1.036 2.288
Locked doors 0.857 0.299 0.127 0.642 1.146
Locker checks 1.088 0.564 0.159 0.816 1.451
Staff/Adults in
hallway
0.562** 0.004 0.113 0.378 0.836
Students wear ID 1.142 0.439 0.196 0.815 1.600
Age 0.817** 0.000 0.034 0.752 0.887
Female 0.744* 0.038 0.106 0.563 0.983
Race
Black 1.184 0.423 0.250 0.783 1.792
Hispanic 0.727 0.113 0.146 0.491 1.078
Other 0.616 0.138 0.201 0.325 1.168
Public School 0.788 0.393 0.219 0.457 1.361
Urban 0.923 0.670 0.173 0.639 1.333
High crime around
school
1.578** 0.007 0.267 1.132 2.200
Drug prevalence 2.224** 0.000 0.363 1.615 3.061
Gang prevalence 1.975** 0.000 0.339 1.412 2.764
Observations = 3,969
LR chi2 (17) = 111.31
Prob > chi2 = 0.000

70
Hosmer-
Lemeshow
chi2(8)=
6.60
H-L Prob > chi2 = 0.581
Exponentiated coefficients + p < 0.1, * p < 0.05, ** p < 0.01
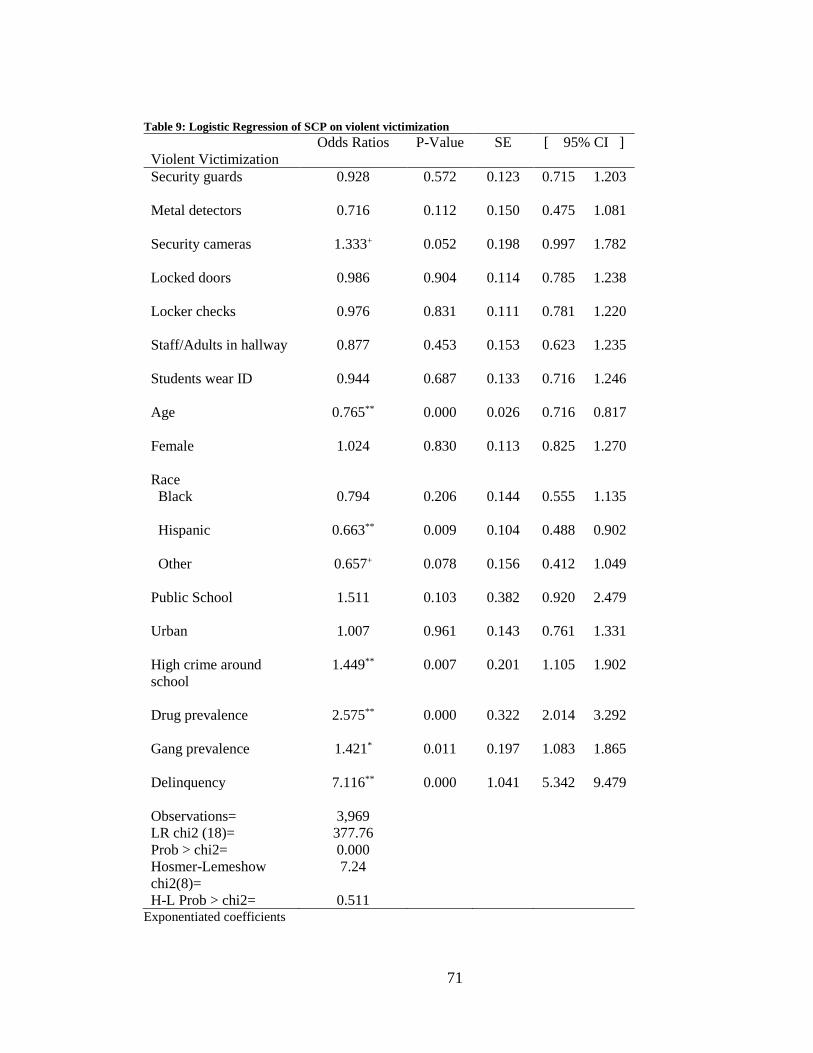
71
Table 9: Logistic Regression of SCP on violent victimization
Odds Ratios P-Value SE [ 95% CI ]
Violent Victimization
Security guards 0.928 0.572 0.123 0.715 1.203
Metal detectors 0.716 0.112 0.150 0.475 1.081
Security cameras 1.333+ 0.052 0.198 0.997 1.782
Locked doors 0.986 0.904 0.114 0.785 1.238
Locker checks 0.976 0.831 0.111 0.781 1.220
Staff/Adults in hallway 0.877 0.453 0.153 0.623 1.235
Students wear ID 0.944 0.687 0.133 0.716 1.246
Age 0.765** 0.000 0.026 0.716 0.817
Female 1.024 0.830 0.113 0.825 1.270
Race
Black 0.794 0.206 0.144 0.555 1.135
Hispanic 0.663** 0.009 0.104 0.488 0.902
Other 0.657+ 0.078 0.156 0.412 1.049
Public School 1.511 0.103 0.382 0.920 2.479
Urban 1.007 0.961 0.143 0.761 1.331
High crime around
school
1.449** 0.007 0.201 1.105 1.902
Drug prevalence 2.575** 0.000 0.322 2.014 3.292
Gang prevalence 1.421* 0.011 0.197 1.083 1.865
Delinquency 7.116** 0.000 1.041 5.342 9.479
Observations= 3,969
LR chi2 (18)= 377.76
Prob > chi2= 0.000
Hosmer-Lemeshow
chi2(8)=
7.24
H-L Prob > chi2= 0.511 Exponentiated coefficients

72
+ p < 0.10, * p < 0.05, * p < 0.01

73
Table 10: Logistic Regression of SCP on delinquency
Odds Ratios P-Value SE [ 95% CI ]
Delinquency
Security guards 0.881 0.464 0.152 0.627 1.237
Metal detectors 0.831 0.419 0.189 0.531 1.301
Security cameras 1.449+ 0.060 0.286 0.983 2.136
Locked doors 0.775+ 0.073 0.109 0.587 1.024
Locker checks 1.146 0.334 0.162 0.868 1.513
Staff/Adults in
hallway
0.991 0.971 0.221 0.640 1.536
Students wear ID 0.989 0.948 0.167 0.711 1.376
Age 0.831** 0.000 0.034 0.767 0.899
Female 0.711* 0.015 0.099 0.540 0.936
Race
Black 1.458+ 0.058 0.290 0.987 2.154
Hispanic 1.066 0.724 0.195 0.745 1.528
Other 0.874 0.653 0.262 0.485 1.572
Public School 1.814* 0.119 0.694 0.857 3.837
Urban 1.011 0.953 0.186 0.704 1.451
School Crime 1.360+ 0.063 0.225 0.984 1.881
Drug prevalence 1.762** 0.000 0.279 1.291 2.403
Gang prevalence 1.729** 0.001 0.281 1.258 2.377
Extracurricular
Act.
1.147 0.369 0.175 0.851 1.546
Grades
B 1.364+ 0.084 0.245 0.958 1.939
C 3.339** 0.000 0.658 2.269 4.914

74
DF 3.542** 0.000 1.202 1.821 6.887
Attitudes toward
school authority
index (1-4)
Attitudes toward
school authority
index =2
0.865 0.704 0.329 0.410 1.825
Attitudes toward
school authority
index =3
0.509+ 0.057 0.181 0.254 1.022
Attitudes toward
school authority
index =4
0.258** 0.000 0.090 0.131 0.512
Observations = 3,929
LR chi2 (24) = 251.84
Prob > chi2 = 0.000
Hosmer-
Lemeshow chi2
(8) =
6.61
H-L Prob > chi2 = 0.579
Exponentiated coefficients + p < 0.10, * p < 0.05, ** p < 0.01

75
Table 11: Logistic Regression of SCP on avoidance
Odds Ratios P-Value SE [ 95% CI ]
Avoid places at
school
Security guards 1.107 0.613 0.224 0.745 1.648
Metal detectors 0.911 0.722 0.238 0.546 1.521
Security cameras 1.277 0.280 0.289 0.819 1.992
Locked doors 1.182 0.323 0.199 0.848 1.645
Locker checks 0.981 0.910 0.159 0.715 1.349
Staff/Adults in
hallway
0.705 0.146 0.169 0.441 1.129
Students wear ID 1.392+ 0.068 0.252 0.975 1.986
Age 0.898* 0.021 0.042 0.819 0.984
Female 1.572** 0.004 0.247 1.155 2.139
Race
Black 0.798 0.379 0.205 0.481 1.321
Hispanic 1.196 0.361 0.235 0.814 1.758
Other 0.702 0.338 0.259 0.341 1.447
Public School 1.946 0.128 0.853 0.825 4.593
Urban 1.015 0.946 0.217 0.667 1.543
High crime around
school
1.718** 0.003 0.308 1.209 2.441
Drug prevalence 1.649** 0.006 0.298 1.157 2.351
Gang Prevalence 2.027** 0.000 0.370 1.416 2.899
Victimized 6.436** 0.000 1.042 4.685 8.839
Observations = 3,969

76
LR chi2 (18) = 268.14
Prob > chi2 = 0.000
Hosmer-Lemeshow
chi2 (8) =
19.42
H-L Prob > chi2 = 0.013
Exponentiated coefficients + p < 0.10, * p < 0.05, ** p < 0.01

77
REFERENCES
Bachman, R., Antonia, R., and Brown, B.L. (2011). Predicting perceptions of fear at
school and going to and from school for African American and white students: the
effects of school security measures. Youth and Society. 43(2) 705-726
Barrett, K.L., Jennings, W.G., Lynch, M.J. (2012). The relationship between youth fear
and avoidance of crime in school and academic experiences. Journal of School
Violence. 11(1), 1-20
Blumstein, A., & Wallman, J. (Eds.). (2000). The crime drop in America. New York, NY:
Cambridge University Press.
Bracy, N.L. (2011). Student perceptions of high-security school environments. Youth and
Society. 43(1), 365-395
Brantingham, P. J. and P. L. Brantingham (2003). "Anticipating the Displacement of
Crime Using the Principles of Environmental Criminology." In M. Smith and D.
Cornish (eds.), Theory for Practice in Situational Crime Prevention. Crime
Prevention Studies, Vol. 16, pp. 119-148. Monsey, N.Y.: Criminal Justice Press.
Clarke, R.V. (1980). Situational crime prevention: theory and practice. British Journal of
Criminology 20:136–147.
Clarke, R.V. (1983). Situational Crime Prevention: Its Theoretical Basis and Practical
Scope. In M. Tonry and N. Morris (eds.), Crime and Justice: An Annual Review
of Research. Vol. 4. Chicago, IL: University of Chicago Press.
Clarke, R. V. (1995). Situational crime prevention: achievements and challenges.
In Building a Safer Society: Strategic Approaches to Crime Prevention, Michael
Tonry & Farrington, David (eds.). Chicago: The University of Chicago Press
Clarke, R.V. (ed.) (1997). Situational crime prevention: successful case studies. 2nd ed.
Guilderland, NY: Harrow and Heston
Clarke, R.V., and Cornish, D.B. (1985). Modeling offenders’ decisions: A framework for
research and policy. In M. Tonry and N. Morris (eds.), Crime and Justice: An
Annual Review of Research. Vol. 6. Chicago, IL: University of Chicago Press.
Clarke, R.V., and D. Weisburd (1994). Diffusion of crime control benefits: observations
on the reverse of displacement. Crime Prevention Studies 2:165–184.

78
Cohen, L.E., and Felson, M. (1979). Social change and crime rate trends: a routine
activity approach. American Sociological Review, 44, 588–605
Cornish, D.B., and R.V. Clarke (eds.) (1986). The Reasoning Criminal: Rational Choice
Perspectives on Offending. New York: Springer-Verlag.
Cornish, D.B., and Clarke, R.V. (2003) Opportunities, precipitators, and criminal
decisions: a reply to Wortley’s critique of situational crime prevention. Crime
Prevention Studies. 16. 41-96
DeVoe, J.F., Peter, K., Kaufman, P., Miller, A., Noonan, M., Snyder, T.D., and Baum, K.
(2004). Indicators of School Crime and Safety: 2004 (NCES 2005–002/NCJ
205290). U.S. Departments of Education and Justice. Washington, DC: U.S.
Government Printing Office.
Durlauf, S.N. and Nagin, D.S. (2011). Imprisonment and crime. Can both be reduced?
Criminology and Public Policy. 10(1). 13-54.
FBI, Uniform Crime Reports as prepared by the National Archive of Criminal Justice
Data. http://www.ucrdatatool.gov/Search/Crime/State/RunCrimeStatebyState.cfm
Felson, M. and Clarke, R.V. (1998) Opportunity makes the thief: practical theory for
crime prevention. Police Research Series. 98. 1-44
Gottfredson, D. C. (2001). Schools and delinquency. New York, NY: Cambridge
Hahn, R., Fuqua-Whitley, D., Wethington, H., Lowy, J., Liberman, A., Crosby, A.,
Fullilove, M., Johnson, R., Moscicki, E., Price, L., Snyder, S.R., Tuma, F., Cory,
S., Stone, G., Mukhopadhaya, K., Chattopadhyay, S., Dahlberg, L. (2007). The
effectiveness of universal school-based programs for the prevention of violent and
aggressive behavior: a report on recommendations of the task force on community
preventive services. Morbidity and Mortality Weekly Report. Department of
Health and Human Services, Centers for Disease Control and Prevention. 1-12
Hale, C. (1996). Fear of crime: a review of the literature. International Review of
Victimology. 4, 79-150.
Hawkins, J. D., Catalano, R. F., Kosterman, R., Abbott, R., & Hill, K. G. (1999).
Preventing adolescent health risk behaviors by strengthening protection during
childhood. Archives of Pediatrics and Adolescent Medicine, 153, 226-234.
Hirschi, T. (1969). The causes of delinquency. Berkeley: The University of California
Press
79
Logistic Regression Diagnostics. UCLA: Statistical Consulting Group. from
http://www.ats.ucla.edu/stat/stata/webbooks/logistic/chapter3/statalog3.htm/
(accessed March 24, 2015)
LaGrange, R.L., Ferraro, F.F., and Supancic, M. (1992). Perceived risk and fear of crime:
role of social and physical incivilities. Journal of Research in Crime and
Delinquency. 29(3), 311-334
Loeber, R. & Farrington, D.P. (eds.) (1998). Serious and violent juvenile offenders: Risk
factors and successful interventions. Sage Publications, Thousand Oaks, CA.
Los Angeles Times http://articles.latimes.com/2000/apr/16/news/mn-20323
May, D.C. (1999). Scared kids, unattached kids, or peer pressure: why do students carry
firearms to school? Youth and Society. 31(1), 100-127
May, D.C. and Dunaway, R.G. (2000). Predictors of fear of criminal victimization at
school among adolescents. Sociological Spectrum: Mid-South Sociological
Association. 20(2), 149-168
Modzeleski, W., Petrosino, A., Guckenburg, S., & Fronius, T. (2014). Practical research
to address school safety: The secret service-u.s. department of education safe
schools initiative. Translational Criminology.
Nagin, D. S. (2013). Deterrence in the twenty-first century. Crime and Justice. 42(1). 199
National Crime Victimization Survey: School Crime Supplement, 2011. United States
Department of Justice. Office of Justice Programs. Bureau of Justice Statistics,
Washington, DC.
Noonan, J., and Vavra, M. (2007). Crime in schools and colleges: A study of offenders
and arrestees reported via national incident-based reporting system data. U.S.
Department of Justice, Federal Bureau of Investigation. Washington, DC.
O’Neill, L. and McGloin, J.M. (2007). Considering the efficacy of situational crime
prevention in schools. Journal of Criminal Justice. 35(5), 511-523
Painter, K.A. and Farrington, D.P. (2001). Evaluating situational crime prevention using
a young people’s survey. The British Journal of Criminology. 41(2), 266-284
Popp, A.M. (2012). The effects of exposure, proximity, and capable guardians on the risk
of bullying victimization. Youth Violence and Juvenile Justice. 10(4), 315-332

80
Robers, S., Kemp, J, Rathbun, A, Morgan, R., Snyder, T. (2014). Indicators of School
Crime and Safety: 2013. NCES
Ross, C.E. (1993). Fear of victimization and health. Journal of Quantitative Criminology.
9(2) 159-175.
Sanches, C., Gouveia-Pereira, M., Carugati, F. (2012). Justice judgments, school failure,
and adolescent delinquent behavior. British Journal of Educational Psychology.
82, 602-621
Simon, S. (2009, April 14). The safety lessons of columbine, re-examined --- ten years
after the high school shooting, funding for campus security fades, but simpler,
low-cost measures gain favor. The Wall Street Journal. Retrieved from
http://search.proquest.com/docview/399091521?accountid=14541
Sutherland, Edwin H. 1947. Principles of Criminology, Fourth Edition. Philadelphia, PA:
Lippincott.
Thapa, A., Cohen, J., Guffey, S., Higgins-D’Alessandro, A. (2013). A Review of school
climate research. Review of Educational Research. 83(3), 357-385
Tillyer, M.S., Fisher, B.S., Wilcox, P. (2011) The effects of school crime prevention on
students’ violent victimization, risk perception, and fear of crime: a multilevel
opportunity perspective. Justice Quarterly. 28(2), 249-277
Tyler, Tom R. 1990. Why people obey the law. New Haven, CT: Yale University Press.
Tyler, T. (2004). Enhancing police legitimacy. Annals of the American Academy of
Political and Social Science. 593, 84-99
Tyler, T. and Lind, E. (1992). A relational model of authority in groups. Advances in
experimental and social psychology. 25, 115-191
Weisburd, D. (1997). Reorienting Crime Prevention Research and Policy: From the
Causes of Criminality to the Context of Crime. U.S. Department of Justice,
National Institute of Justice. Washington, DC.
Weisburd, D. and Green, L. (1994). Defining the Drug Market: The Case of the Jersey
City DMA System. In D.L. MacKenzie and C.D. Uchida (eds.), Drugs and
Crime: Evaluating Public Policy Initiatives. Newbury Park, CA: Sage
Publications, Inc.
Welsh, B.C. and Farrington, D.P. (2003). Effects of closed-circuit television on crime.
The Annals of the American Academy of Political and Social Science. 26, 110-135

81
Welsh, B.C. and Farrington, D.P. (2009). Public area CCTV and crime prevention: an
updated systematic review and meta-analysis. Justice Quarterly. 26(4) 716-745
Why Now is the Time (2013)
http://www.whitehouse.gov/sites/default/files/docs/wh_now_is_the_time_full.pdf
Wiatrowski, M. D., Griswold, D. B., & Roberts, M.K. (1981). Social control theory and
delinquency. American Sociological Review. 46. 525-541.
Zimring, F.E. (2006). The Great American Crime Decline. New York: Oxford University
Press.

82
BIOGRAPHY
Nicole Watkins was homeschooled until beginning her undergraduate studies at North
Carolina State University in 2008. She received her Bachelor of Arts in Criminology with
a minor in Chinese from NC State in 2012. She received her Master of Arts in
Criminology, Law and Society from George Mason University in 2015.
Related Documents