Jaehwa Lee 1 Jaehwa Lee Professor Barry Waite and Bonnie Shrewsbury GIS for Public Policy, Planning and Development 18 April 2017 Site suggestion for new DMV offices in Los Angeles County I. Introduction In spite of the efforts to enhance the accessibility of the public transportation system and improve its quality, it is undeniable that most people in Los Angeles County are heavily dependent on their own vehicles as means of transportation. In this regard, Department of Motor Vehicle (“DMV”), which is responsible for regulation of privately owned vehicles, is very close to our daily lives. People visit DMV branches in their neighborhoods to take a driving test or register vehicles. However, unfortunately, it seems that the degree of satisfaction for the service which DMV provides is not high. While there may be several reasons for that, one of the biggest would be the long wait times (Please see Table 1 1 below). As set forth in the table 1 below, the longest wait time without appointments is as long as almost two hours (103.35 minutes) in Sacramento DMV. Another notable thing is that many DMV branches in Los Angeles County have relatively long wait times compared with those in other counties in California. Among the top five DMV branches with the longest wait times, three of them are located in Los Angeles County: Los 1 Source: Cheap Car Insurance. (2016).

Welcome message from author
This document is posted to help you gain knowledge. Please leave a comment to let me know what you think about it! Share it to your friends and learn new things together.
Transcript

Jaehwa Lee
1
Jaehwa Lee
Professor Barry Waite and Bonnie Shrewsbury
GIS for Public Policy, Planning and Development
18 April 2017
Site suggestion for new DMV offices in Los Angeles County
I. Introduction
In spite of the efforts to enhance the accessibility of the public transportation system and
improve its quality, it is undeniable that most people in Los Angeles County are heavily
dependent on their own vehicles as means of transportation. In this regard, Department of Motor
Vehicle (“DMV”), which is responsible for regulation of privately owned vehicles, is very close
to our daily lives. People visit DMV branches in their neighborhoods to take a driving test or
register vehicles.
However, unfortunately, it seems that the degree of satisfaction for the service which
DMV provides is not high. While there may be several reasons for that, one of the biggest would
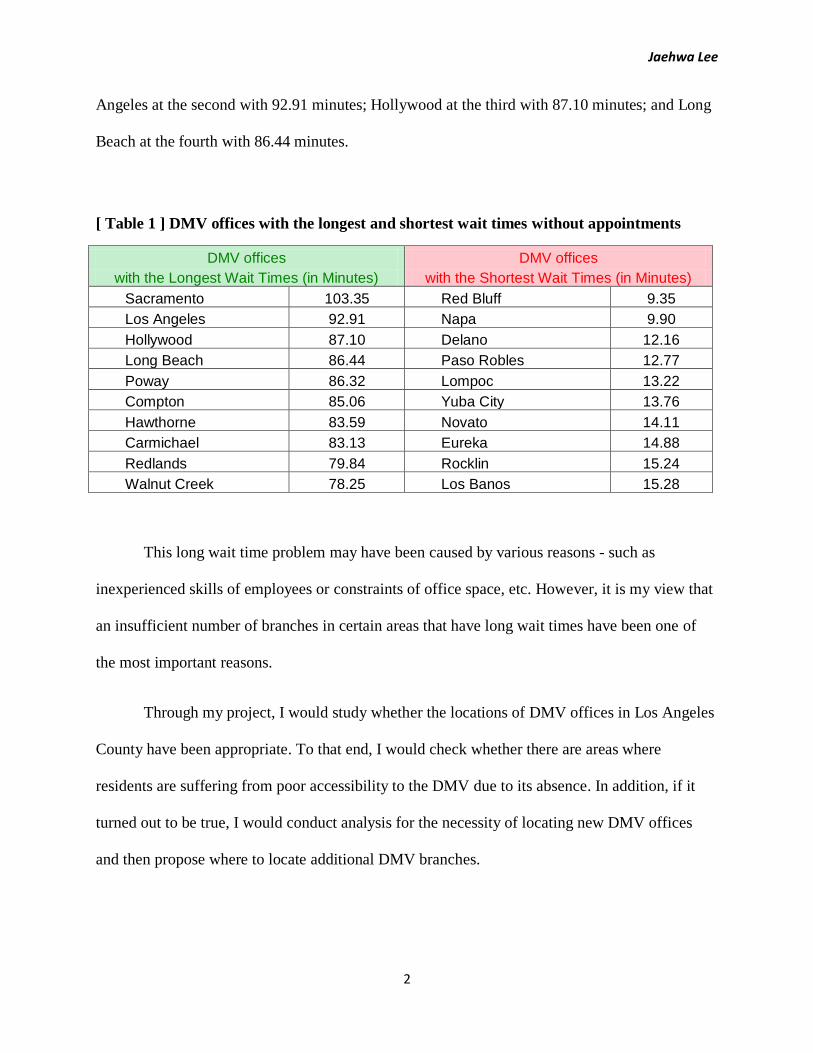
be the long wait times (Please see Table 11 below). As set forth in the table 1 below, the longest
wait time without appointments is as long as almost two hours (103.35 minutes) in Sacramento
DMV. Another notable thing is that many DMV branches in Los Angeles County have relatively
long wait times compared with those in other counties in California. Among the top five DMV
branches with the longest wait times, three of them are located in Los Angeles County: Los
1 Source: Cheap Car Insurance. (2016).
Jaehwa Lee
2
Angeles at the second with 92.91 minutes; Hollywood at the third with 87.10 minutes; and Long
Beach at the fourth with 86.44 minutes.
[ Table 1 ] DMV offices with the longest and shortest wait times without appointments
DMV offices DMV offices
with the Longest Wait Times (in Minutes) with the Shortest Wait Times (in Minutes)
Sacramento 103.35 Red Bluff 9.35
Los Angeles 92.91 Napa 9.90
Hollywood 87.10 Delano 12.16
Long Beach 86.44 Paso Robles 12.77
Poway 86.32 Lompoc 13.22
Compton 85.06 Yuba City 13.76
Hawthorne 83.59 Novato 14.11
Carmichael 83.13 Eureka 14.88
Redlands 79.84 Rocklin 15.24
Walnut Creek 78.25 Los Banos 15.28
This long wait time problem may have been caused by various reasons - such as
inexperienced skills of employees or constraints of office space, etc. However, it is my view that
an insufficient number of branches in certain areas that have long wait times have been one of
the most important reasons.
Through my project, I would study whether the locations of DMV offices in Los Angeles
County have been appropriate. To that end, I would check whether there are areas where
residents are suffering from poor accessibility to the DMV due to its absence. In addition, if it
turned out to be true, I would conduct analysis for the necessity of locating new DMV offices
and then propose where to locate additional DMV branches.

Jaehwa Lee
3
II. Research Outline
Currently, DMV provides a variety of services. Among those, my research will focus on
two of the functions – i.e., driving license test and vehicle registration, since those two are the
most of the reasons why people visit DMV.
Various factors should be taken into consideration when deciding where to place a DMV
office. However, in this research, the following four features are chosen as main factors that
should be considered due to their importance: (ⅰ) geographical accessibility; (ⅱ) demand for
taking driving test; (ⅲ) demand for vehicle registration; and (ⅳ) impact on traffic conditions. To
illustrate, when a DMV branch is located at an area where many residents live close to it, there
should be a high demand for driving test and vehicle registration, and if such DMV location does
not interrupt traffic flow, then such DMV location would be deemed appropriate.
Geographical Accessibility The first factor is closely related to the distance to DMV
branches. This research will assume that more than 4 miles of distance to DMV offices would
substantially damage the geographical accessibility of DMV customers. The 4 miles are
calculated based on the fact that people are willingness to drive for 17 minutes2 to a local
business and the average traffic speed in LA metro areas in rush hour is 15.3 mile3 per hour (15.3
MPH × 0.28 hour = 4.3 miles).
Geographical Accessibility The second factor could be evaluated by calculating the
number of people in need of driving license that lives in the area in question. This research will
use the population between age 15 and 19 as the proxy for calculating such number based on the
2 Source: BrightLocal. (2014).
3 Source: Inrix. (2014).

Jaehwa Lee
4
followings; (ⅰ) in California, residents could obtain driving license from the age of 16 and (ⅱ)
according to a recent study, more than 70 percent of high school senior held driving license in
2010 (Shults & Williams, 2013).
Demand for Vehicle Registration This research will use the number of available
vehicles as a relevant indicator for the third factor based on the assumption that more car
ownerships entail more necessities for registrations.
Impact on Traffic Conditions This fourth factor could be assessed by checking the
traffic flow conditions of surrounding areas of a DMV branch. Locating a new DMV branch in
highly congested areas would worsen the traffic conditions mainly due to driving tests. On the
other hand, the impact on traffic conditions would be none to low in non-congested areas. This
research will use the “Annual Average Daily Traffic (AADT4)” data of highways as the indicator
for the traffic volume.
III. Analysis Method
In regard to the first factor, I would sort out regions with poor geographical accessibility
to DMV branches. This will be done by finding regions where there is no DMV branch within
the distance of 4 miles.
With respect to the second factor, I would check the level of demand for driving test in
the regions selected in the first stage. By comparing the population of people aged between 15
and 19 among such regions, we would be able to notify the regions that are in need of a new
4 ADDT is calculated by dividing the total volume (count) of traffic by 365 days.
Jaehwa Lee
5
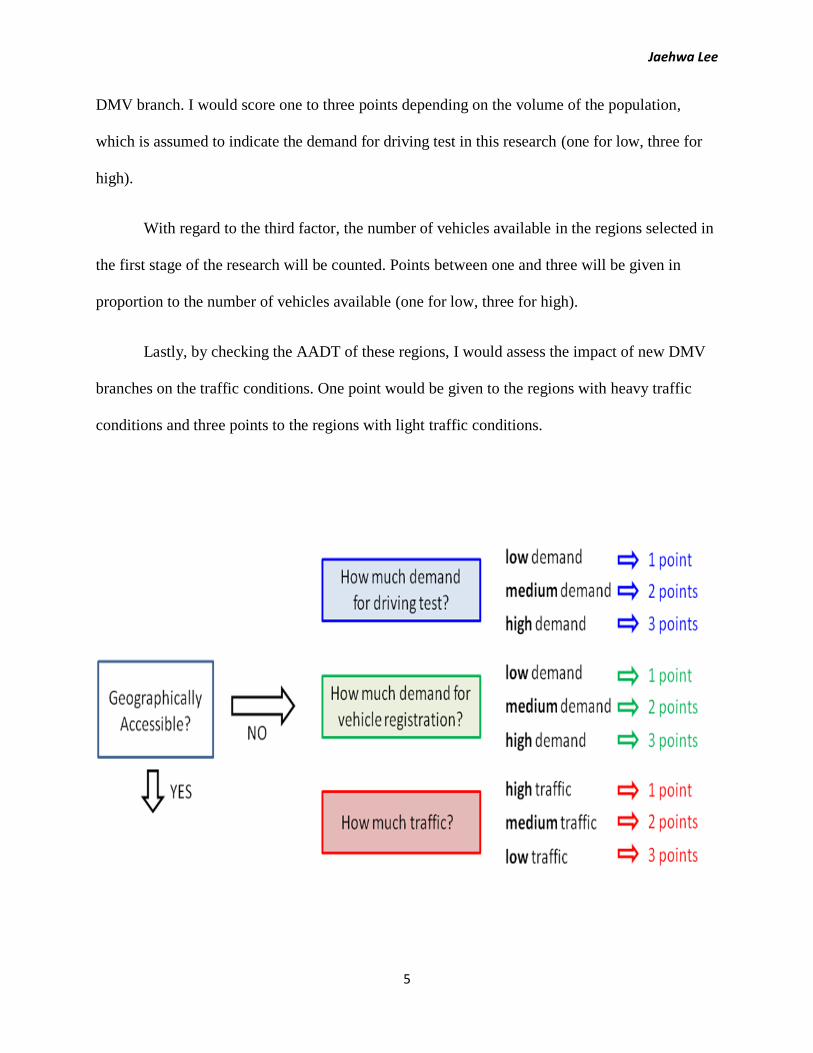
DMV branch. I would score one to three points depending on the volume of the population,
which is assumed to indicate the demand for driving test in this research (one for low, three for
high).
With regard to the third factor, the number of vehicles available in the regions selected in
the first stage of the research will be counted. Points between one and three will be given in
proportion to the number of vehicles available (one for low, three for high).
Lastly, by checking the AADT of these regions, I would assess the impact of new DMV
branches on the traffic conditions. One point would be given to the regions with heavy traffic
conditions and three points to the regions with light traffic conditions.

Jaehwa Lee
6
IV. Results of Analysis
Figure 1 shows the current DMV branch locations in Los Angeles County. There are 26
DMV offices providing driving test and vehicle registration services. For the convenience of the
analysis, I ruled out the northern part of Los Angeles County where the population and density
are much lower than other regions within the county. As shown in the map, DMV branches are
distributed centering on the Los Angeles City.
DATA & SOURCE
DATA SOURCE
address of DMV offices California DMV website (www.dmv.ca.gov)
shapefile of zipcode boundaries of LA County LA County GIS Data Portal (egis.lacounty.gov/dataportal)
GIS software processing
① Creating an address locator for zipcodes
② Geocoding the address of DMV branches by zipcode
Jaehwa Lee
7
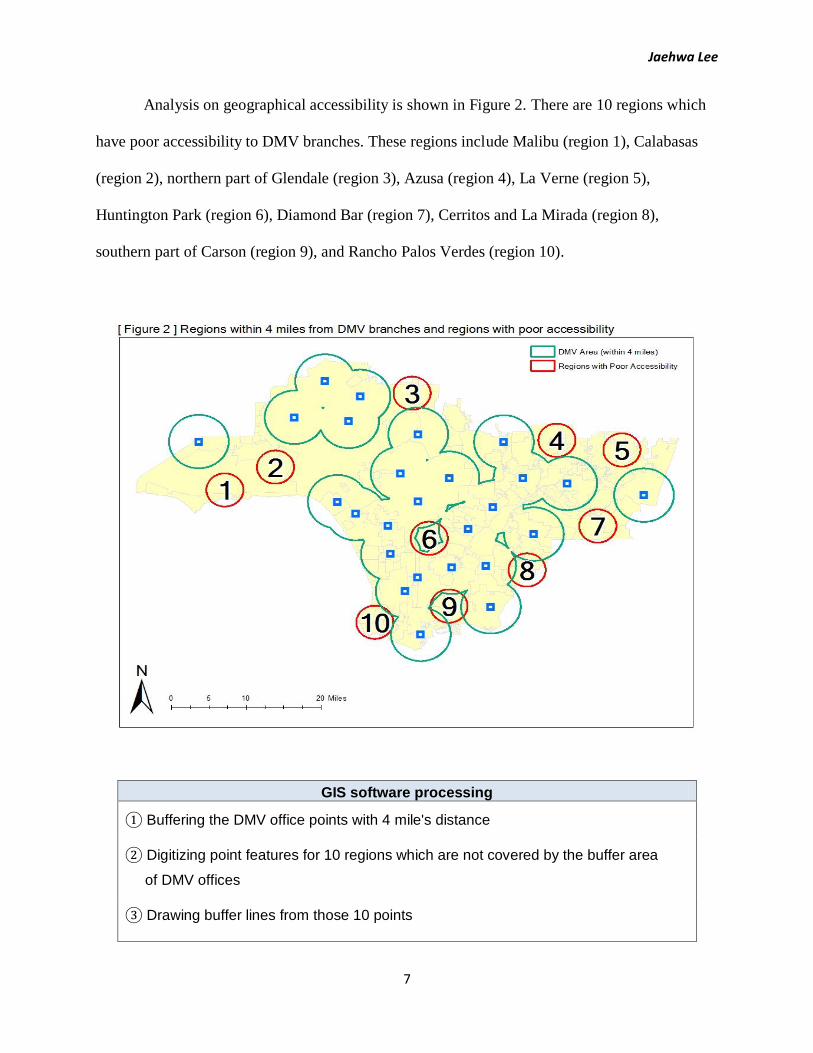
Analysis on geographical accessibility is shown in Figure 2. There are 10 regions which
have poor accessibility to DMV branches. These regions include Malibu (region 1), Calabasas
(region 2), northern part of Glendale (region 3), Azusa (region 4), La Verne (region 5),
Huntington Park (region 6), Diamond Bar (region 7), Cerritos and La Mirada (region 8),
southern part of Carson (region 9), and Rancho Palos Verdes (region 10).
GIS software processing
① Buffering the DMV office points with 4 mile's distance
② Digitizing point features for 10 regions which are not covered by the buffer area
of DMV offices
③ Drawing buffer lines from those 10 points
Jaehwa Lee
8
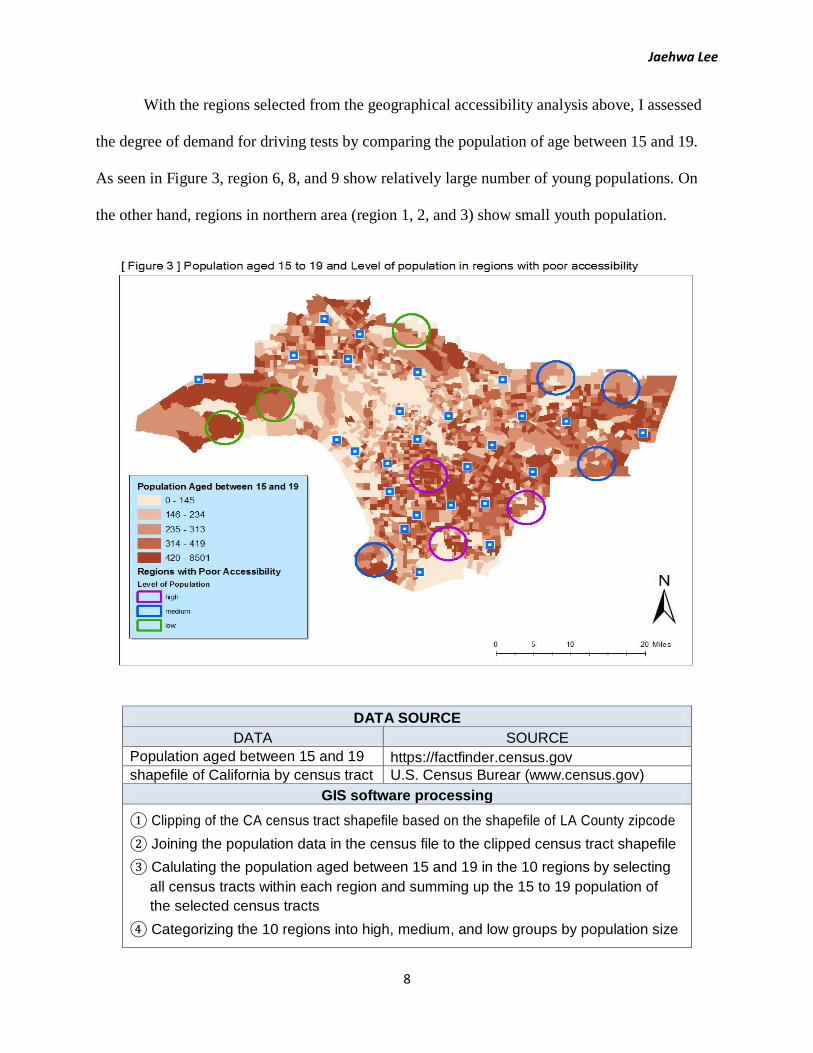
With the regions selected from the geographical accessibility analysis above, I assessed
the degree of demand for driving tests by comparing the population of age between 15 and 19.
As seen in Figure 3, region 6, 8, and 9 show relatively large number of young populations. On
the other hand, regions in northern area (region 1, 2, and 3) show small youth population.
DATA SOURCE
DATA SOURCE
Population aged between 15 and 19 https://factfinder.census.gov
shapefile of California by census tract U.S. Census Burear (www.census.gov)
GIS software processing
① Clipping of the CA census tract shapefile based on the shapefile of LA County zipcode
② Joining the population data in the census file to the clipped census tract shapefile
③ Calulating the population aged between 15 and 19 in the 10 regions by selecting
all census tracts within each region and summing up the 15 to 19 population of
the selected census tracts
④ Categorizing the 10 regions into high, medium, and low groups by population size

Jaehwa Lee
9
Next analysis is to assess the demand for vehicle registration. As the result shows in the
Figure 4, regions in central and southeastern part (region 6, 8, and 9) have high number of
vehicles available. Region 1, 2, and 4 show relatively small number of vehicles.
DATA SOURCE
DATA SOURCE
Number of vehicles available factfinder.census.gov
shapefile of California by census tract U.S. Census Bureau (www.census.gov)
GIS software processing
① Joining the vehicle number data in the census file to the clipped LA county census
tract shapefile
② Calculating the number of vehicles in the 10 regions by selecting all census tracts
within each region and summing up vehicle numbers of the selected census tracts
③ Categorizing the 10 regions into high, medium, and low groups by vehicle number

Jaehwa Lee
10
Lastly, I conducted analysis for the traffic volume of the 10 regions. As can be seen in
Figure 5, the traffic is concentrated in the central parts and southeastern part of the county. To be
specific, there is relatively high traffic volume in the region 4, 6, 8. On the other hand, the
outskirt areas such as region 1, 2, and 10 have small traffic volume.
DATA SOURCE
DATA SOURCE
AADT of California CA Department of Transportation (www.dot.ca.gov)
Primary and Secondary roads file of LA County
U.S. Census Bureau (www.census.gov)
GIS software processing
① Joining the AADT data to the LA county Primary and Secondary roads file
② Calculating the traffic volume in the 10 regions by selecting the AADT points
within each region and averaging the AADT volumes of the selected AADT points
③ Categorizing the 10 regions into high, medium, and low groups by average AADT

Jaehwa Lee
11
V. Conclusion
Figure 6 and Table 2 below shows the total scores of each region, which indicate the
degree of necessity of placing an additional DMV branch. Southern part of Carson (region 9),
which scored 8 points, has been analyzed to be in the greatest need of a new DMV branch. Its
demand for driving test was high, its demand for vehicle registration was high, and medium
impact on the traffic conditions was expected due to placing a new DMV branch. Huntington
Park (region 6), Cerritos and La Mirada (region 8), and Rancho Palos Verdes (region 10) follow
with 7 points. The Azusa (region 4) scoring only 4 points, does not seem to be in an urgent
situation.

Jaehwa Lee
12
[ Table 2 ] Total Score of each region
Region Demand for driving test
Demand for vehicle registration
Impact on traffic
Total
1 (Malibu) 1 1 3 5
2 (Calabasas) 1 1 3 5
3 (Northern part of Glendale) 1 2 2 5
4 (Azusa) 2 1 1 4
5 (La Verne) 2 2 2 6
6 (Huntington Park) 3 3 1 7
7 (Diamond Bar) 2 2 2 6
8 (Cerritos and La Mirada) 3 3 1 7
9 (southern part of Carson) 3 3 2 8
10 (Rancho Palos Verdes) 2 2 3 7
In conclusion, it is my view that Southern part of Carson shall be considered as the first
candidate if Los Angeles County were to place an additional DMV office. By establishing a new
DMV branch in Southern part of Carson, followed by Huntington Park, Cerritos and La Mirada,
and Rancho Palos Verdes, we may look forward to shortened wait times in California DMVs.
VI. Limitation
As can be seen in Figure 4, there are several number of census tracts without the data of
number of vehicles available. Those census tracts are seen with hollow color.
In addition, the fact that each region with poor accessibility to DMV has different number
of census tracts within itself, could lead to misinterpretation of the choropleth map. For example,
in the Figure 3, the areas surrounding the region 1 are dark colored. However, since the region 1
has relatively small number of census tracts within itself (only 5 tracts), it has the second

Jaehwa Lee
13
smallest population among the 10 regions. Therefore, we need to consider the number of census
tracts as well as the color of the regions.
Moreover, in determining regions with the poor geographical accessibility from existing
DMV offices, I used the criteria of the straight distance (4 miles) from DMV offices. However,
the 4 mile distance does not indicate the areas which can be reached within a specific drive time.
The 4 mile was calculated from multiplying the driving time and the traffic speed and then
applied for the buffer area analysis. If the buffer area have been drawn based on the driving time
not straight distance, it would be better for analyzing the geographical accessibility more
accurately.
Lastly, there is limitation on the AADT data. This data is being collected only on
highways. Such being the case, the regions such as Malibu (region 1) or Calabasas (region 2)
seem to have low traffic congestions. If I could have used the traffic data for all major streets, the
analysis would have been more complete.

Jaehwa Lee
14
References
American FactFinder, 2015 Census tracts. www.factfinder.census.gov
BrightLocal. (2014). Consumers will travel 17 minutes to reach a local business.
www.brightlocal.com
California Department of Motor Vehicles Portal, Field Office Information. www.dmv.ca.gov
California Department of Transportation, Caltrans GIS Data. www.dot.ca.gov
Cheap Car Insurance. (2016). California DMV Survival Guide: Analyzing California’s DMV
Wait Times. www.cheapcarinsurance.net
Inrix. (2014). Global Traffic Scorecard. www.inrix.com
Shults, R.A., Williams, A.F. (2013). Trends in driver licensing status and driving among high
school seniors in the United States, 1996-2010. Journal of Safety Research, 46, 167-170.
U.S. Census Bureau, 2016 TIGER/Line® Shapefiles and TIGER/Line® Files.
https://www.census.gov/geo/maps-data/data/tiger-line.html
Related Documents