Site-Specific Weather Data Site-Specific Weather Data for Disease Forecasting: for Disease Forecasting: Reality or Pipe Dream? Reality or Pipe Dream? Bob Seem Cornell University New York State Agricultural Experiment Station Geneva, NY 14456 Midwest Weather Group Meeting 25 July 2008

Site-Specific Weather Data for Disease Forecasting: Reality or Pipe Dream? Bob Seem Cornell University New York State Agricultural Experiment Station Geneva,
Dec 29, 2015
Welcome message from author
This document is posted to help you gain knowledge. Please leave a comment to let me know what you think about it! Share it to your friends and learn new things together.
Transcript

Site-Specific Weather DataSite-Specific Weather Datafor Disease Forecasting:for Disease Forecasting:Reality or Pipe Dream?Reality or Pipe Dream?
Bob SeemCornell University
New York State Agricultural Experiment StationGeneva, NY 14456
Midwest Weather Group Meeting 25 July 2008
What is site-specific weather?
Weather data and associated information determined for a specific location (lon-lat) or grid-based information at a resolution of ~1km2
Why is site-specific weather important?
• Emerging alternative to regional-scale data
• Incorporates local physiographic features
• Economical alternative to automatic weather stations
• Natural link to disease forecasts and graphical representation of disease risk
Examples of site-specific weather implementation
• Application of mesoscale weather models
• Application of NWS numerical forecast models
• Application of statistical/interpolation schemes

Mesoscale Models
• MM5• North Amercian Meso (NAM,
formerly Eta)• MASS (LAWSS)• WRF

Input PreprocessorsSurface Data
Climatic Data
Raw Data
f
ModelsLAWSS
SWEB
DMCast
Elevation, Landuse …
NDVI, SST …
Reanalysis, AWS …
Temp, RH, Wind, Rad …
Leaf wetness …
Downy Mildew Risk …
Output Processing
Data Transformation
Data Analysis
Merging, Concatenation
Mapping, Plotting …
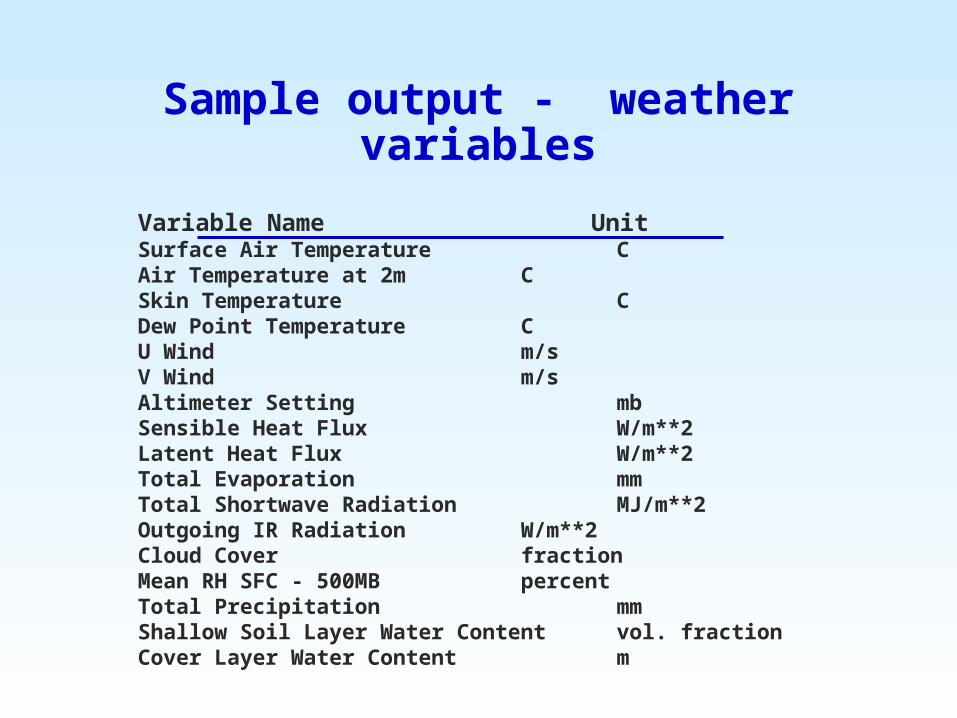
Sample output - weather variables
Variable Name UnitSurface Air Temperature CAir Temperature at 2m CSkin Temperature CDew Point Temperature CU Wind m/sV Wind m/sAltimeter Setting mbSensible Heat Flux W/m**2Latent Heat Flux W/m**2Total Evaporation mmTotal Shortwave Radiation MJ/m**2Outgoing IR Radiation W/m**2Cloud Cover fractionMean RH SFC - 500MB percentTotal Precipitation mmShallow Soil Layer Water Content vol. fractionCover Layer Water Content m
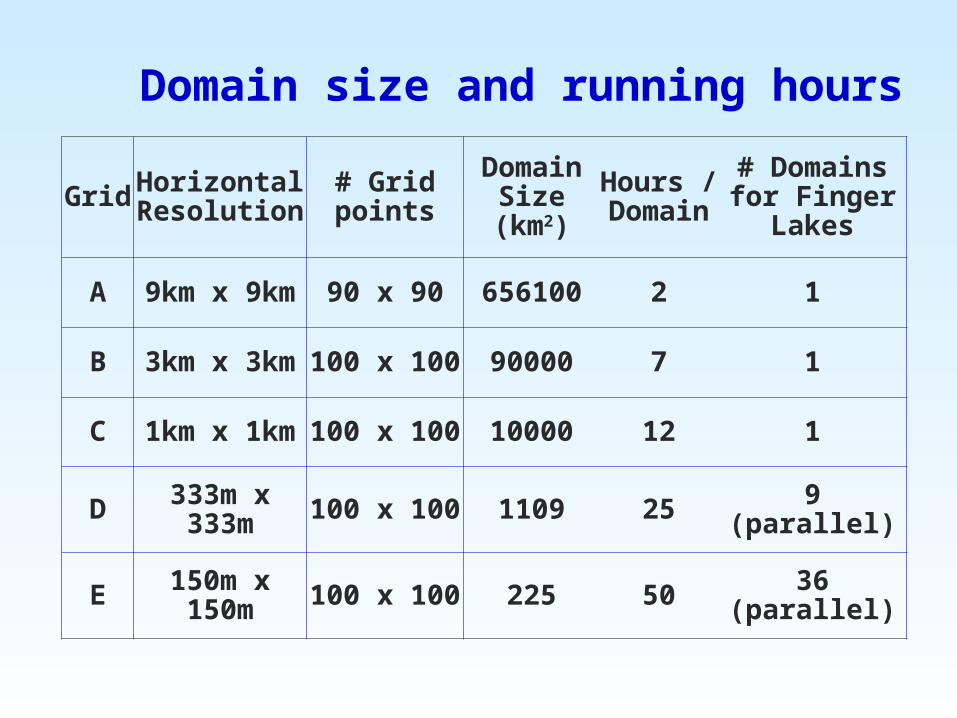
Grid Horizontal Resolution
# Grid points
Domain Size (km2)
Hours / Domain
# Domains for Finger Lakes
A 9km x 9km 90 x 90 656100 2 1
B 3km x 3km 100 x 100 90000 7 1
C 1km x 1km 100 x 100 10000 12 1
D 333m x 333m 100 x 100 1109 25 9 (parallel)
E 150m x 150m 100 x 100 225 50 36 (parallel)
Domain size and running hours
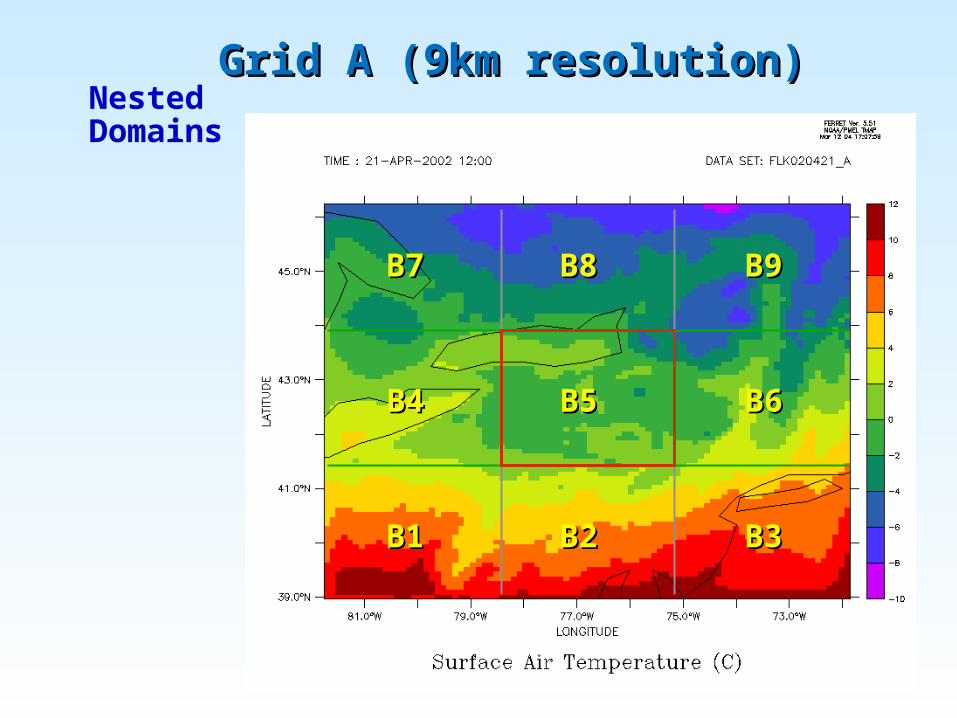
Grid A (9km resolution)Grid A (9km resolution)
B1B1 B2B2 B3B3
B4B4 B5B5 B6B6
B7B7 B8B8 B9B9
NestedDomains
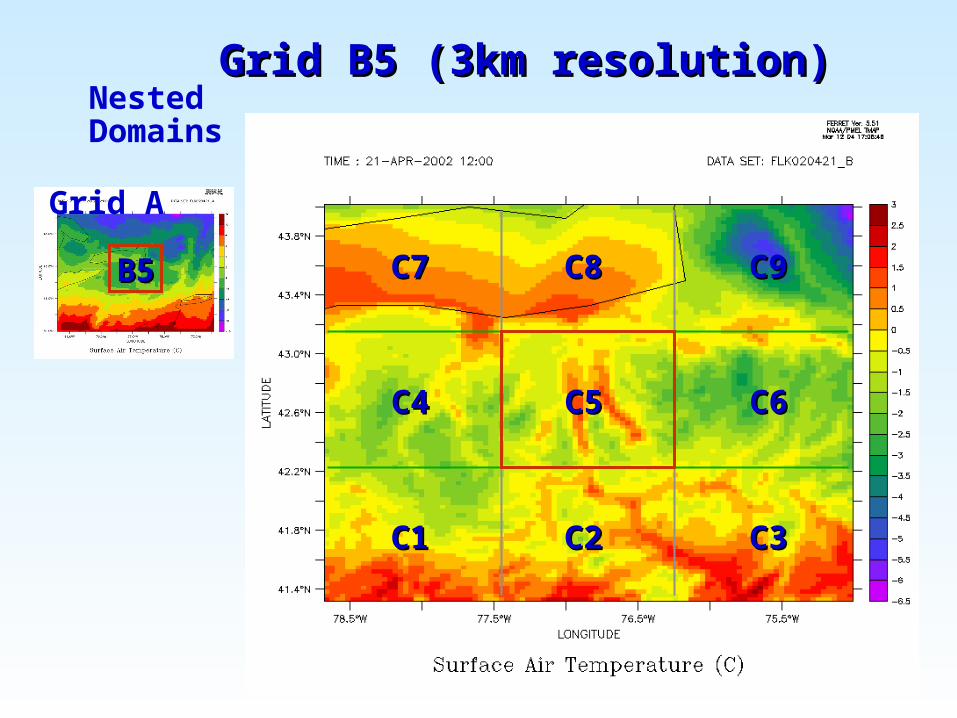
C1C1 C2C2 C3C3
C4C4 C5C5 C6C6
C7C7 C8C8 C9C9
Grid A
B5B5
Grid B5 (3km resolution)Grid B5 (3km resolution)NestedDomains
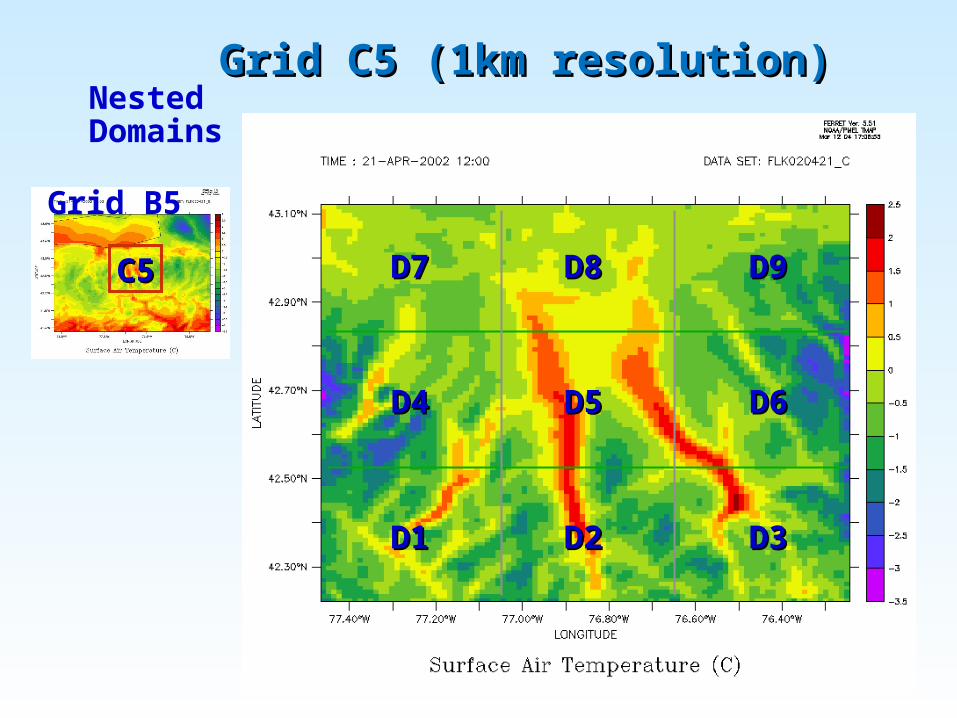
D1D1 D2D2 D3D3
D4D4 D5D5 D6D6
D7D7 D8D8 D9D9
Grid B5
C5C5
Grid C5 (1km resolution)Grid C5 (1km resolution)NestedDomains

Grid C5
D2D2 D3D3
D5D5 D6D6
D1D1
D4D4
D7D7 D8D8 D9D9
NestedDomains
Grid D1-D9 (333m resolution)Grid D1-D9 (333m resolution)

14
16
18
20
22
24
26
28
Tem
per a
t ure
( C)
Jun 14 Jun 29 Jul 14 Jul 29 Aug 13
Date (2003)
Simulated by LAWSS
Observed by AWS
Geneva
40
60
80
100
Re l
a ti v
e H
umi d
ity ( %
)
Jun 14 Jun 29 Jul 14 Jul 29 Aug 13
Date (2003)
Simulated by LAWSS
Observed by AWS
Geneva
12
16
20
24
28
Tem
per a
t ure
( C)
Jun 14 Jun 29 Jul 14 Jul 29 Aug 13
Date (2003)
Simulated by LAWSS
Observed by AWS
Fredonia
40
60
80
100
Re l
a ti v
e H
umi d
ity ( %
)
Jun 14 Jun 29 Jul 14 Jul 29 Aug 13
Date (2003)
Simulated by LAWSS
Observed by AWSFredonia
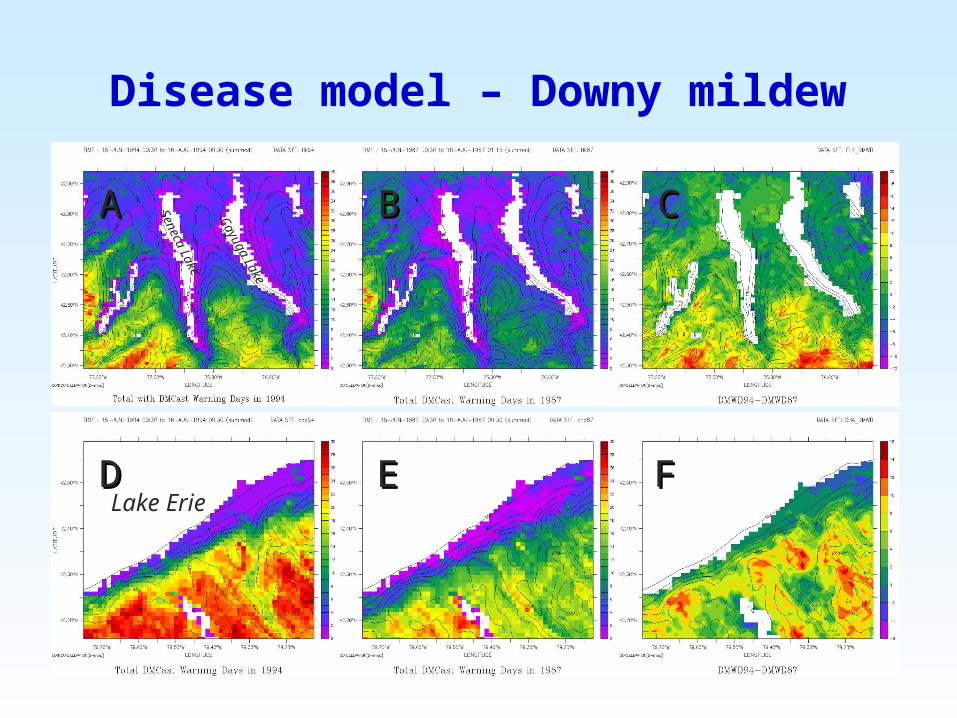
Disease model – Downy mildew
AA BB CC
DD EE FFLake Erie
Seneca Lake
Cayuga Lake

LocationCriteria of daily comparison
Agreement ratio between observed and simulated data during:
the entire simulation non-rainy days
Geneva(42.9N, 77.0W)
Wetness > 0.1 33/62 (53%) 28/32 (88%)
DMrisk > 0 41/62 (66%) 28/32 (88%)
Fredonia(42.7N, 78.9W)
Wetness > 0.1 39/62 (63%) 28/37 (76%)
DMrisk > 0 36/62 (58%) 27/37 (73%)

Weather Research and Forecast (WRF) Model
A next-generation mesocale numerical weather prediction system designed to serve both operational forecasting and atmospheric research needs. It features multiple dynamical cores, a 3-dimensional variational data assimilation system, and a software architecture allowing for computational parallelism and system extensibility. WRF is suitable for a broad spectrum of applications across scales ranging from meters to thousands of kilometers.
www.wrf-model.org
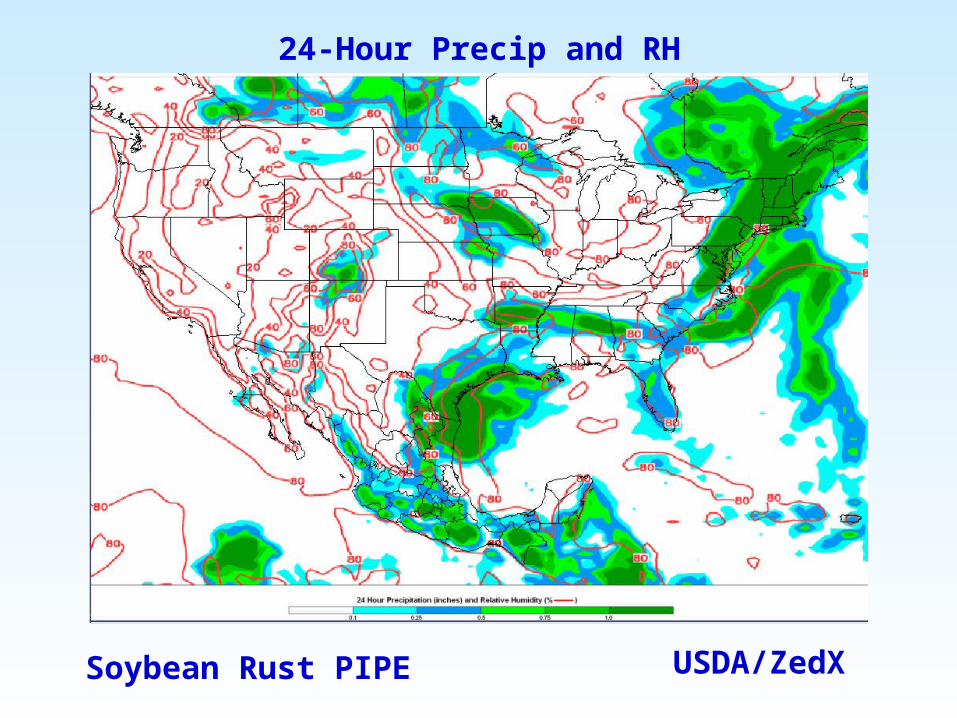
USDA/ZedXSoybean Rust PIPE
24-Hour Precip and RH
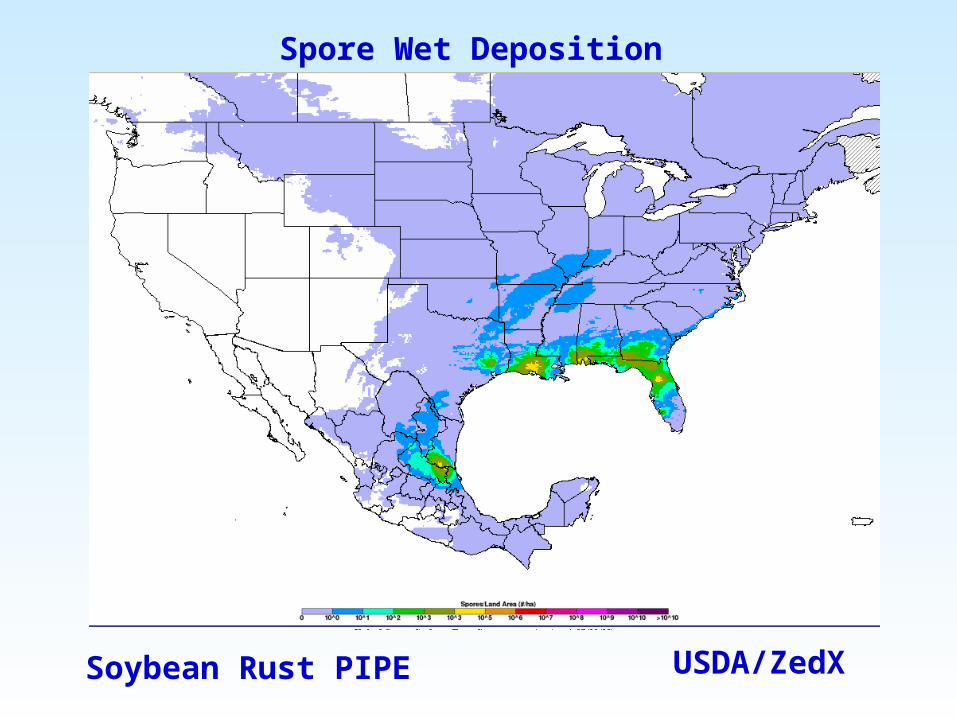
USDA/ZedXSoybean Rust PIPE
Spore Wet Deposition
USDA/ZedXSoybean Rust PIPE
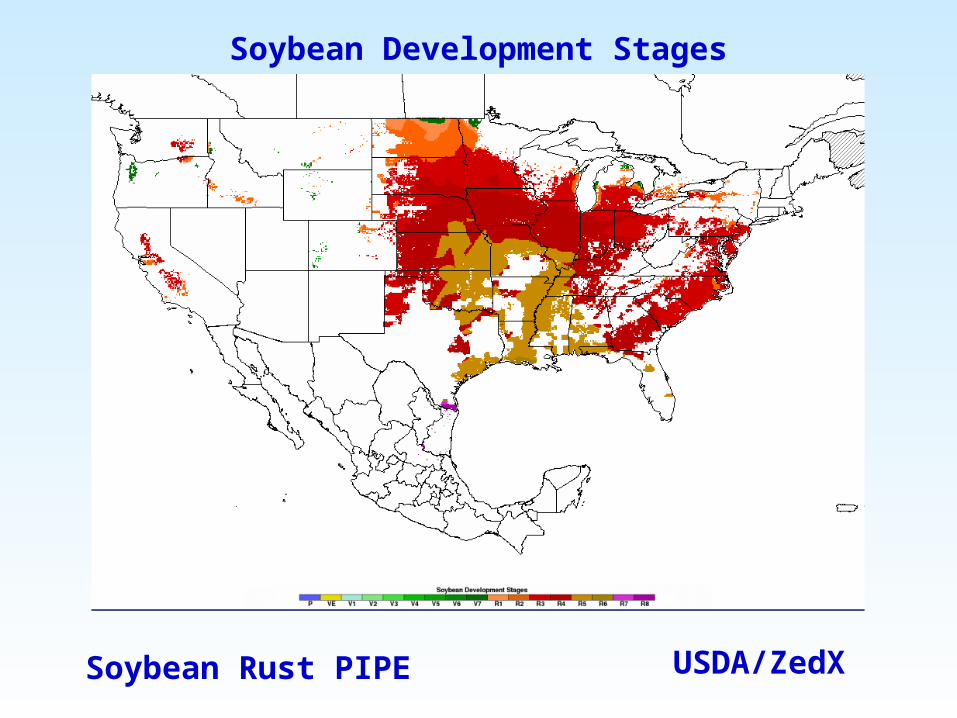
Soybean Development Stages
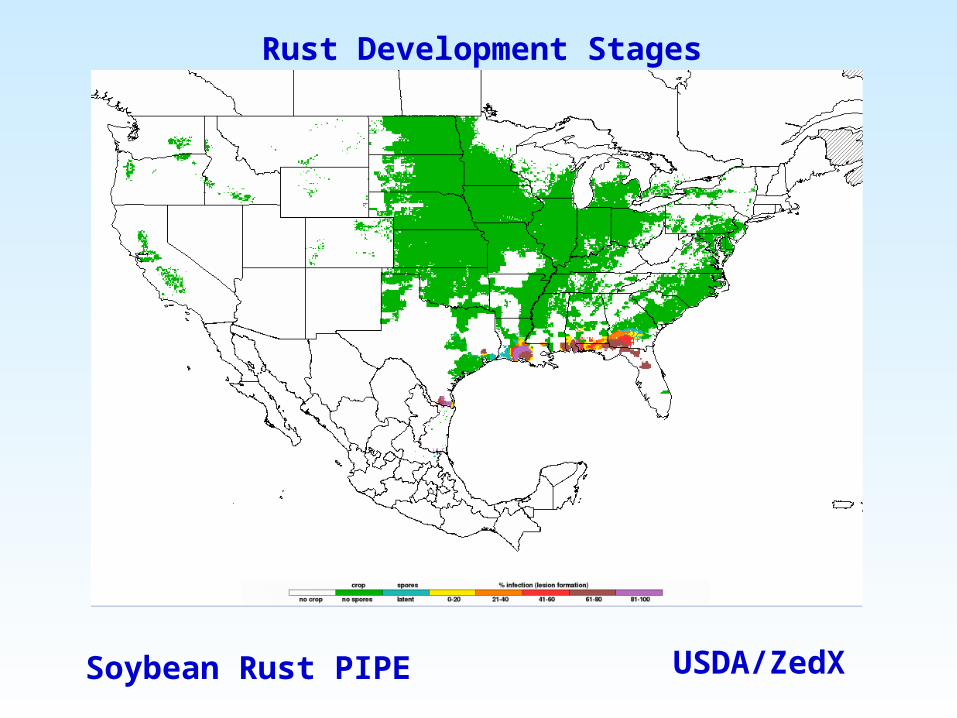
USDA/ZedXSoybean Rust PIPE
Rust Development Stages
NWS numerical forecast models
• Resolution not as high as mesoscale models
• Convergence is occurring• Products greatly increased and
not focused just on aviation weather
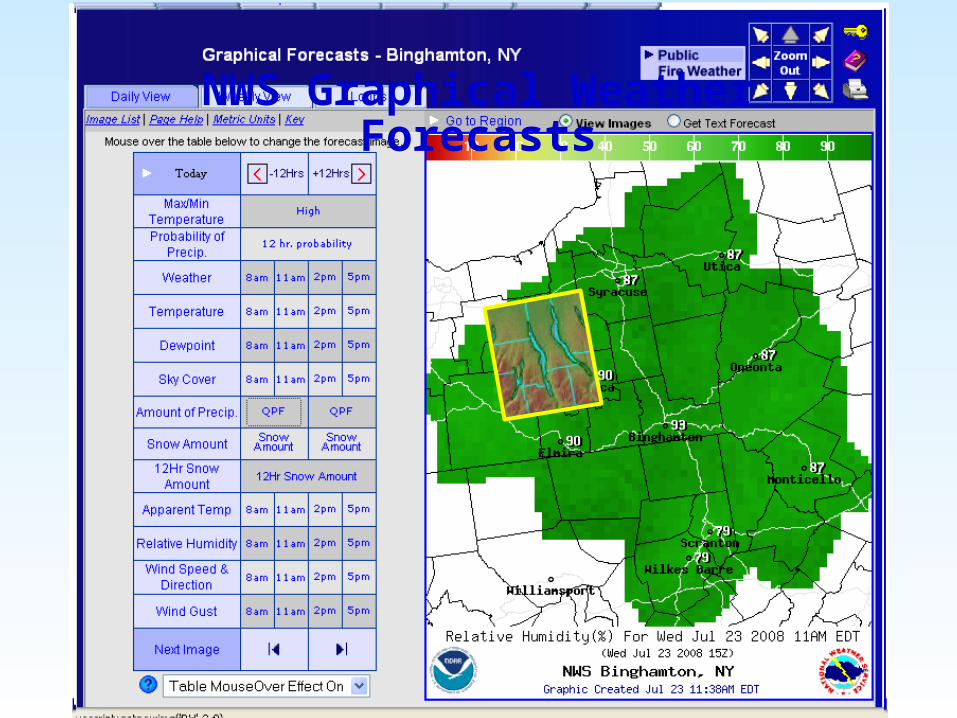
NWS Graphical Weather Forecasts
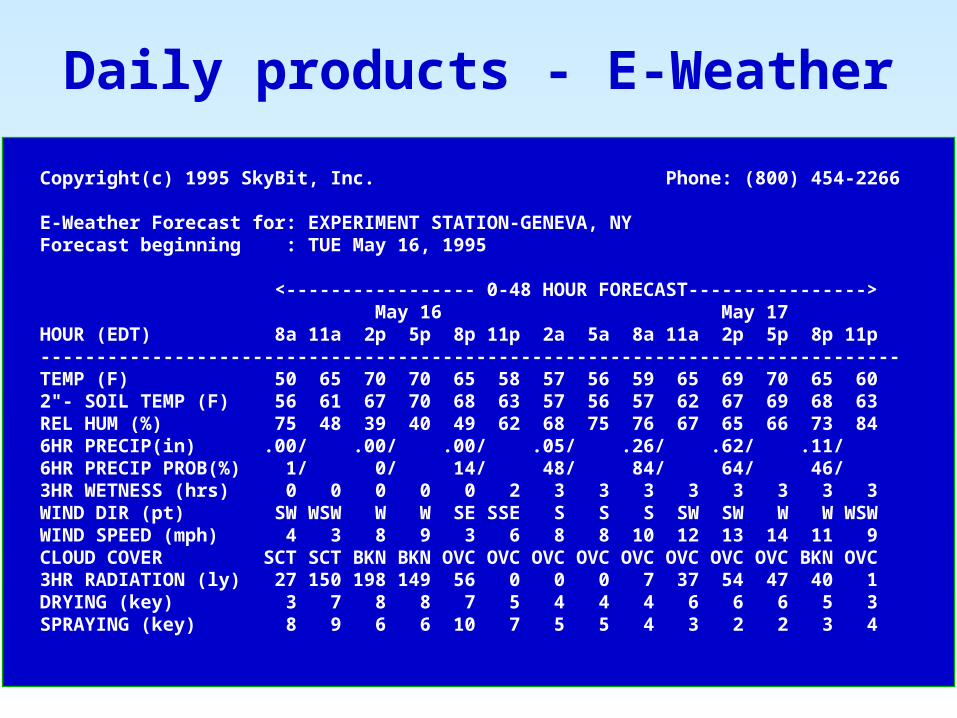
Copyright(c) 1995 SkyBit, Inc. Phone: (800) 454-2266 E-Weather Forecast for: EXPERIMENT STATION-GENEVA, NY Forecast beginning : TUE May 16, 1995 <----------------- 0-48 HOUR FORECAST----------------> May 16 May 17 HOUR (EDT) 8a 11a 2p 5p 8p 11p 2a 5a 8a 11a 2p 5p 8p 11p ----------------------------------------------------------------------------- TEMP (F) 50 65 70 70 65 58 57 56 59 65 69 70 65 60 2"- SOIL TEMP (F) 56 61 67 70 68 63 57 56 57 62 67 69 68 63 REL HUM (%) 75 48 39 40 49 62 68 75 76 67 65 66 73 84 6HR PRECIP(in) .00/ .00/ .00/ .05/ .26/ .62/ .11/ 6HR PRECIP PROB(%) 1/ 0/ 14/ 48/ 84/ 64/ 46/ 3HR WETNESS (hrs) 0 0 0 0 0 2 3 3 3 3 3 3 3 3 WIND DIR (pt) SW WSW W W SE SSE S S S SW SW W W WSW WIND SPEED (mph) 4 3 8 9 3 6 8 8 10 12 13 14 11 9 CLOUD COVER SCT SCT BKN BKN OVC OVC OVC OVC OVC OVC OVC OVC BKN OVC 3HR RADIATION (ly) 27 150 198 149 56 0 0 0 7 37 54 47 40 1 DRYING (key) 3 7 8 8 7 5 4 4 4 6 6 6 5 3 SPRAYING (key) 8 9 6 6 10 7 5 5 4 3 2 2 3 4
Daily products - E-Weather

• Considerable advancements made over recent years (e.g., WRF)
• Computing power is greatly improved
• Flexible links for disease models (and precision ag in general)
• Need better input data (soils, soil moisture, vegetation cover)
• Some variables not reliable…yet
Conclusions I

• Need better biology• How do we validate site-specific
information–Validation sites vs total sites–Do management decisions change
• Don’t let infatuation overtake reality
Conclusions II
Related Documents


![)( CORNELL REPORTS - [email protected] - Cornell University](https://static.cupdf.com/doc/110x72/6206299f8c2f7b17300506a0/-cornell-reports-emailprotected-cornell-university.jpg)