Missouri University of Science and Technology Missouri University of Science and Technology Scholars' Mine Scholars' Mine International Conferences on Recent Advances in Geotechnical Earthquake Engineering and Soil Dynamics 2010 - Fifth International Conference on Recent Advances in Geotechnical Earthquake Engineering and Soil Dynamics 29 May 2010, 8:00 am - 9:30 am Site Response Study of Deep Soil Column in Lucknow, India Site Response Study of Deep Soil Column in Lucknow, India P. Anbazhagan Indian Institute of Science, India Abhishek Kumar Indian Institute of Science, India T. G. Sitharam Indian Institute of Science, India Follow this and additional works at: https://scholarsmine.mst.edu/icrageesd Part of the Geotechnical Engineering Commons Recommended Citation Recommended Citation Anbazhagan, P.; Kumar, Abhishek; and Sitharam, T. G., "Site Response Study of Deep Soil Column in Lucknow, India" (2010). International Conferences on Recent Advances in Geotechnical Earthquake Engineering and Soil Dynamics. 11. https://scholarsmine.mst.edu/icrageesd/05icrageesd/session03b/11 This work is licensed under a Creative Commons Attribution-Noncommercial-No Derivative Works 4.0 License. This Article - Conference proceedings is brought to you for free and open access by Scholars' Mine. It has been accepted for inclusion in International Conferences on Recent Advances in Geotechnical Earthquake Engineering and Soil Dynamics by an authorized administrator of Scholars' Mine. This work is protected by U. S. Copyright Law. Unauthorized use including reproduction for redistribution requires the permission of the copyright holder. For more information, please contact [email protected].

Welcome message from author
This document is posted to help you gain knowledge. Please leave a comment to let me know what you think about it! Share it to your friends and learn new things together.
Transcript
Missouri University of Science and Technology Missouri University of Science and Technology
Scholars' Mine Scholars' Mine
International Conferences on Recent Advances in Geotechnical Earthquake Engineering and Soil Dynamics
2010 - Fifth International Conference on Recent Advances in Geotechnical Earthquake
Engineering and Soil Dynamics
29 May 2010, 8:00 am - 9:30 am
Site Response Study of Deep Soil Column in Lucknow, India Site Response Study of Deep Soil Column in Lucknow, India
P. Anbazhagan Indian Institute of Science, India
Abhishek Kumar Indian Institute of Science, India
T. G. Sitharam Indian Institute of Science, India
Follow this and additional works at: https://scholarsmine.mst.edu/icrageesd
Part of the Geotechnical Engineering Commons
Recommended Citation Recommended Citation Anbazhagan, P.; Kumar, Abhishek; and Sitharam, T. G., "Site Response Study of Deep Soil Column in Lucknow, India" (2010). International Conferences on Recent Advances in Geotechnical Earthquake Engineering and Soil Dynamics. 11. https://scholarsmine.mst.edu/icrageesd/05icrageesd/session03b/11
This work is licensed under a Creative Commons Attribution-Noncommercial-No Derivative Works 4.0 License.
This Article - Conference proceedings is brought to you for free and open access by Scholars' Mine. It has been accepted for inclusion in International Conferences on Recent Advances in Geotechnical Earthquake Engineering and Soil Dynamics by an authorized administrator of Scholars' Mine. This work is protected by U. S. Copyright Law. Unauthorized use including reproduction for redistribution requires the permission of the copyright holder. For more information, please contact [email protected].
Paper No. 3.21b 1
SITE RESPONSE STUDY OF DEEP SOIL COLUMN IN LUCKNOW, INDIA Anbazhagan, P., Abhishek Kumar and Sitharam, T. G Department of Civil Engineering, Indian Institute of Science, Bangalore, India 56001 ABSTRACT Earthquake activities in the many parts of world had shown the importance of local soil condition in the propagated wave motion. In this paper an attempt has been made to estimate site effects of deep soil column in Lucknow, Indo-Gangetic basin for scenario earthquakes at Himalayan plate boundary. Based on previous study, the synthetic ground motion has been generated using Stochastic Finite Fault model (FINSIM) for two scenario earthquakes at seismic gaps. One seismic gap called as western location/seismic gap is located about 307.88km from site and gives the peak ground acceleration of 0.11g at site. Another one is the Central seismic gap/location is located in central seismic gap at 229.77km from the site and gives the Peak Ground Acceleration (PGA) of 0.218g. The local soil layer details with standard penetration test N value have been collected for the main location in Lucknow from literates. The general soil found for this site is silty sand and silty clays having SPT N value up to above 100 up to a depth of 30m. The soil details extrapolated up to 100m by assuming linear variation from 30 m. The site response analysis has been carried out using equivalent linear and non linear approaches by employing SHAKE 2000 and Deep soil program. Input has been assigned at 30m 50, 75 and 100m to find effective depth of input motion. This study shows that the ground motions are being amplified within a depth of 50 to 80 m, but these results need to be further confirmed with large number of data. The input ground motions are amplified 1.06 to 2.5 times due to the soil condition. INTRODUCTION Indian sub-continent is one of the most seismic prone regions in world. Collision of Indian and Eurasian plate causes built –up of strain along the plate boundary and within the boundary. The main seismogenic regions include Kirthar, Sulaiman and Himalayan and Arakanyoma mountain range. During past two centuries many earthquakes of magnitude 8 and above have been reported in the region. These caused devastating damages and casualties to human life and infrastructure as well. Owing to the filled-up soil (Indo-Gangetic basin) in the form of loose sediments further can make this scenario more destructive. The major tectonic features in the Himalayan mountain range (Gansser, 1964; Molnar and Chen, 1982) include, from south to north, the Main Boundary thrust (MBT), the Main Central Thrust (MCT) and Indus-Tsangpo Suture (ITS) all along the entire length of the Himalayas from west to east. All these features have been shown in Figure 1. The collision rate between Indian and Eurasian boundaries has increased from 5mm-21 mm per year (Khattri, 1987, Bilham et al., 2001). In the light of built-up strains and possible seismic gap presence (Seeber and Armbruster, 1981; Khattri, 1999; and Bilham and Gaur, 2000) can cause large earthquake in the region. During
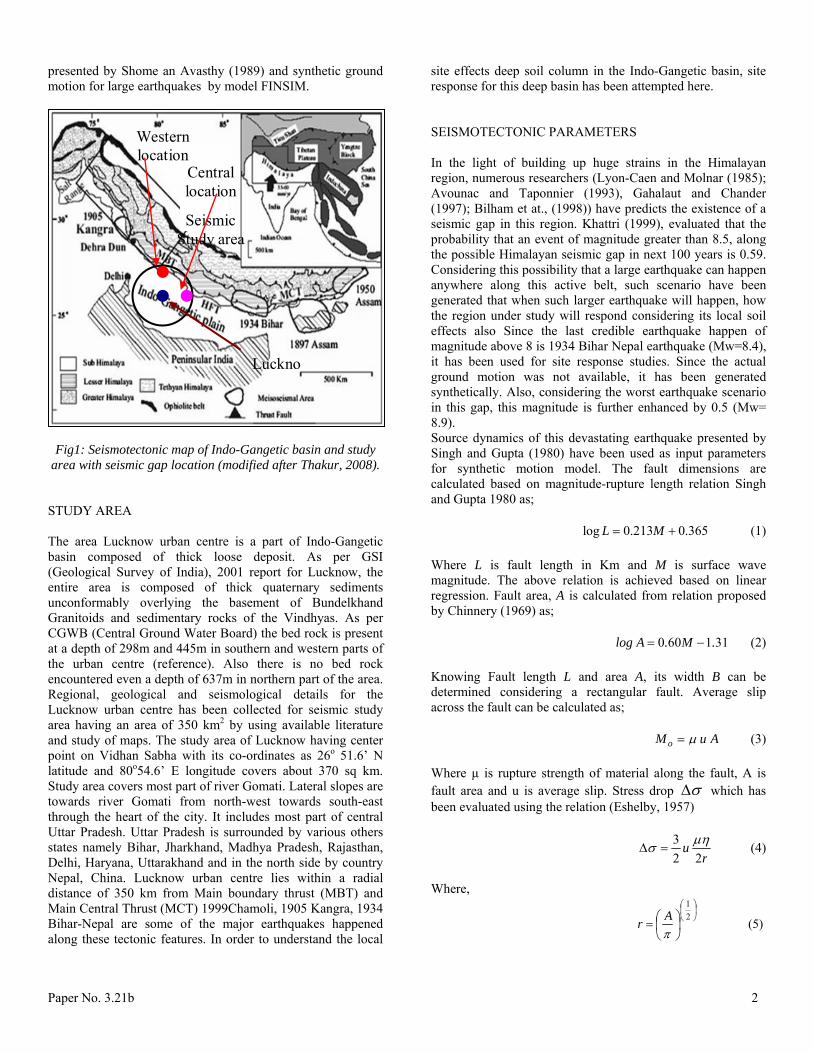
the past earthquakes along the boundary, a 750 km long segment which lie between the eastern edge of the 1905 Kangra rupture zone and the western edge of 1934 Bihar Nepal earthquake remains unbroken. Earthquakes of 1803 and 1833 had caused severe damage but none of it was of larger magnitude so as to fill this seismic gap possibility of future earthquake. In this study it is assumed that the scenario earthquakes at these two seismic gaps. The seismic gaps and site in Indo-Gangetic basin is shown in Fig 1. Figure 1 also shows the seismotectonic of area close Indo-Gangetic basin. In the absence of actual ground motion to be used for site response analysis, an attempt has been made to generate 1934 Bihar-Nepal earthquake using FINSIM (Atkinson and Beresnev, 1997) and use this motion at bed rock level to study the site effects using equivalent linear and non linear approaches. Any great earthquakes anywhere in the seismic gap can cause sever loss of lives and property in nearby locations as the population density is quite high. In this study the site effects of local soil was assessed considering geotechnical properties
Paper No. 3.21b 2
presented by Shome an Avasthy (1989) and synthetic ground motion for large earthquakes by model FINSIM.
Fig1: Seismotectonic map of Indo-Gangetic basin and study
area with seismic gap location (modified after Thakur, 2008). STUDY AREA The area Lucknow urban centre is a part of Indo-Gangetic basin composed of thick loose deposit. As per GSI (Geological Survey of India), 2001 report for Lucknow, the entire area is composed of thick quaternary sediments unconformably overlying the basement of Bundelkhand Granitoids and sedimentary rocks of the Vindhyas. As per CGWB (Central Ground Water Board) the bed rock is present at a depth of 298m and 445m in southern and western parts of the urban centre (reference). Also there is no bed rock encountered even a depth of 637m in northern part of the area. Regional, geological and seismological details for the Lucknow urban centre has been collected for seismic study area having an area of 350 km2 by using available literature and study of maps. The study area of Lucknow having center point on Vidhan Sabha with its co-ordinates as 26o 51.6’ N latitude and 80o54.6’ E longitude covers about 370 sq km. Study area covers most part of river Gomati. Lateral slopes are towards river Gomati from north-west towards south-east through the heart of the city. It includes most part of central Uttar Pradesh. Uttar Pradesh is surrounded by various others states namely Bihar, Jharkhand, Madhya Pradesh, Rajasthan, Delhi, Haryana, Uttarakhand and in the north side by country Nepal, China. Lucknow urban centre lies within a radial distance of 350 km from Main boundary thrust (MBT) and Main Central Thrust (MCT) 1999Chamoli, 1905 Kangra, 1934 Bihar-Nepal are some of the major earthquakes happened along these tectonic features. In order to understand the local
site effects deep soil column in the Indo-Gangetic basin, site response for this deep basin has been attempted here. SEISMOTECTONIC PARAMETERS In the light of building up huge strains in the Himalayan region, numerous researchers (Lyon-Caen and Molnar (1985); Avounac and Taponnier (1993), Gahalaut and Chander (1997); Bilham et at., (1998)) have predicts the existence of a seismic gap in this region. Khattri (1999), evaluated that the probability that an event of magnitude greater than 8.5, along the possible Himalayan seismic gap in next 100 years is 0.59. Considering this possibility that a large earthquake can happen anywhere along this active belt, such scenario have been generated that when such larger earthquake will happen, how the region under study will respond considering its local soil effects also Since the last credible earthquake happen of magnitude above 8 is 1934 Bihar Nepal earthquake (Mw=8.4), it has been used for site response studies. Since the actual ground motion was not available, it has been generated synthetically. Also, considering the worst earthquake scenario in this gap, this magnitude is further enhanced by 0.5 (Mw= 8.9). Source dynamics of this devastating earthquake presented by Singh and Gupta (1980) have been used as input parameters for synthetic motion model. The fault dimensions are calculated based on magnitude-rupture length relation Singh and Gupta 1980 as;
log 0.213 0.365L M (1)
Where L is fault length in Km and M is surface wave magnitude. The above relation is achieved based on linear regression. Fault area, A is calculated from relation proposed by Chinnery (1969) as;
0 60 1 31log A . M . (2)
Knowing Fault length L and area A, its width B can be determined considering a rectangular fault. Average slip across the fault can be calculated as;
A u Mo (3)
Where µ is rupture strength of material along the fault, A is fault area and u is average slip. Stress drop which has been evaluated using the relation (Eshelby, 1957)
r
u22
3 (4)
Where,
(5) 2
1
A
r
Luckno
Seismic Study area
Western location
Central location
Paper No. 3.21b 3
(6) 12
7
Here, the stress drop Δσ calculated in units of 105 kPa. Synthetic ground motion has been generated using above parameters by employing Stochastic Finite Fault model presented by Beresnev and Atkinson, (1997). SYNTHETIC GROUND MOTION Stochastic methods for modeling ground motions have been widely used in many studies (Hanks and Mc Guire, 1981; Boore, 1983, 1996; and Boore and Atkinson, 1987; Chin and Aki, 1991; Atkinson and Boore, 1997; Toro et al., 1997; Atkinson and Beresnev, 1998). Due to lack of available information about ground motion of past earthquakes in India, synthetic ground motion models were extensively used to understand the seismic hazard. RaghuKanth and Iyengar (2004) used synthetic ground motion model to develop attenuation relations and Sitharam and Anbazhagan (2007) synthetically generated maximum credible earthquake acceleration time history to understand local site effects. In our study, Stochastic Finite Fault model (FINSIM) proposed by Beresnev and Atkinson (1997), has been used. In this model, high frequency ground motion can be represented as band-limited Gaussian noise using ω2 spectrum. It uses a traditional Finite-source model (Hartzell, 1978) with rupture at hypocenter at radiate through the other parts. The rupture velocity is taken as 0.8 times the shear velocity for that medium. A rectangular fault is used for it. The whole fault is divided into subfaults such that each subfault ruptures when as rupture mechanism reaches its centre. Ground motion at the observation point is evaluated with the mean of geometric attenuation (Q) models (Boore and Atkinson, 1987; Beresnev and Atkinson, 1997). The corner frequency fo and the corresponding subfault moment (mo) is derived from the subfault size. The relation is expressed as;
l
yzf o
(7)
3
o l m (8)
Where is stress drop (Kanamori-Anderson, 1975), β is shear wave velocity in Km/s, y is the ratios of rupture velocity to shear velocity Taken as 0.8, z is parameter representing high frequency radiation. Here, total number of subfault is such as to conserve total seismic moment of the event to be synthetically generated (Beresnev and Atkinson, 1997). The authors have highlighted that subfault size is an internal parameter for this type of fault models and can’t be chosen random value. Total radiation is a square root function of subfault size and hence the determination of subfault size l is essential in order to conserve total seismic energy released
in form of radiations and can taken in the range of 5-15 km. This model simulates only maximum observed component. PARAMETRIC STUDY In this study, the geometric spreading factor Q, has been used from Singh et. al. (2004) for Lg attenuation in India as
48.0508 fQ . Also geometric spreading function used as 1r
decay from 0-50 km and 0 50.r decay beyond 50 km (Sing et
al., 2004). Parameter factS known as Strength factor controls
high frequency radiation (Beresnev and Atkinson, 2001) and
its value varies between 1.0 and 2.4. Since, the value of factS
for this region was not available; it has been obtained after parametric study, by comparing the simulated ground motion with actual observed ground motion during a past earthquake.
Based on this value of factS has been arrived for the probable
larger earthquake in this region. Actual ground motion for 1999 Chamoli earthquake (Mw=6.6) have been taken from Atlas of Indian Strong Motion Records (Shrikhande, 2001) for recording stations at Barkot, Ghansiali and Almora. Parameters needed for synthetic ground motion model for this earthquake have been collected from Singh and Mittal (2005) and are listed in Table 1.
Table 1: Source parameters for Chamoli earthquakes (Singh and Mittal, 2005)
Parameters Chamoli
Earthquake
Fault length (Km) 36
Fault Width (Km) 20 Focal depth (Km) 15 Dip of Fault (deg) 8
Strike (deg) 274 Rupture Velocity (Km/s) 2.50
Maximum Slip (cm) 160 Seismic Moment (dyne-cm) 1.8X1026
The ground motion for Chamoli earthquake corresponding to three stations (Barkot, Ghansiali and Almora) has been
simulated with known above parameters and varying factS in
the entire range. It has been observed that for factS of 1.2,
both the observed and simulated ground motions match well. Comparisons of actual and synthetically generated ground motion for above stations are shown in Fig 3-5 (a-c). All these recorded acceleration time histories are corresponding to bed rock motion. The maximum value of actual PGA recorded at
Paper No. 3.21b 4
PGA=0.025g
-0.03
-0.02
-0.01
0
0.01
0.02
0.03
0 2 4 6 8 10 12 14Time (s)
Acc
eler
atio
n (g
)
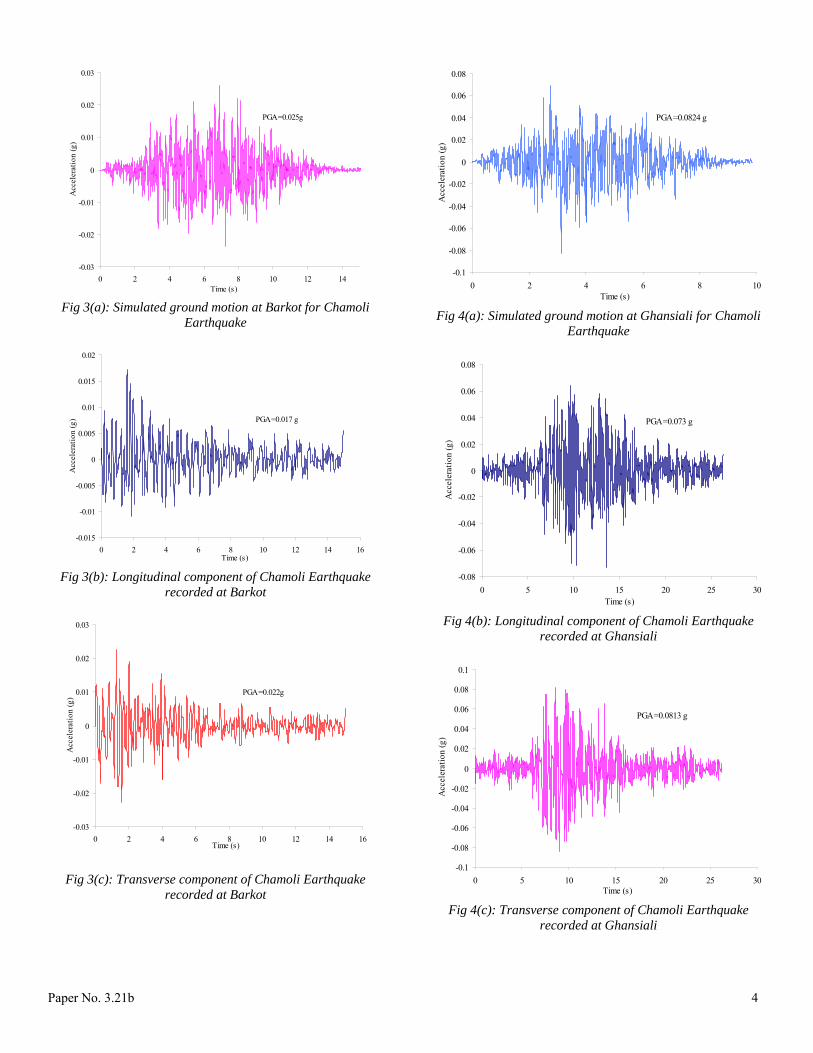
Fig 3(a): Simulated ground motion at Barkot for Chamoli
Earthquake
PGA=0.017 g
-0.015
-0.01
-0.005
0
0.005
0.01
0.015
0.02
0 2 4 6 8 10 12 14 16Time (s)
Acc
eler
atio
n (g
)
Fig 3(b): Longitudinal component of Chamoli Earthquake
recorded at Barkot
PGA=0.022g
-0.03
-0.02
-0.01
0
0.01
0.02
0.03
0 2 4 6 8 10 12 14 16Time (s)
Acc
eler
atio
n (g
)
Fig 3(c): Transverse component of Chamoli Earthquake recorded at Barkot
PGA=0.0824 g
-0.1
-0.08
-0.06
-0.04
-0.02
0
0.02
0.04
0.06
0.08
0 2 4 6 8 10Time (s)
Acc
eler
atio
n (g
)
Fig 4(a): Simulated ground motion at Ghansiali for Chamoli
Earthquake
PGA=0.073 g
-0.08
-0.06
-0.04
-0.02
0
0.02
0.04
0.06
0.08
0 5 10 15 20 25 30Time (s)
Acc
eler
atio
n (g
)
Fig 4(b): Longitudinal component of Chamoli Earthquake
recorded at Ghansiali
PGA=0.0813 g
-0.1
-0.08
-0.06
-0.04
-0.02
0
0.02
0.04
0.06
0.08
0.1
0 5 10 15 20 25 30Time (s)
Acc
eler
atio
n (g
)
Fig 4(c): Transverse component of Chamoli Earthquake
recorded at Ghansiali
Paper No. 3.21b 5
-0.04
-0.03
-0.02
-0.01
0
0.01
0.02
0.03
0 5 10 15 20 25Time(s)
Acc
eler
atio
n(g)
PGA=0.029 g
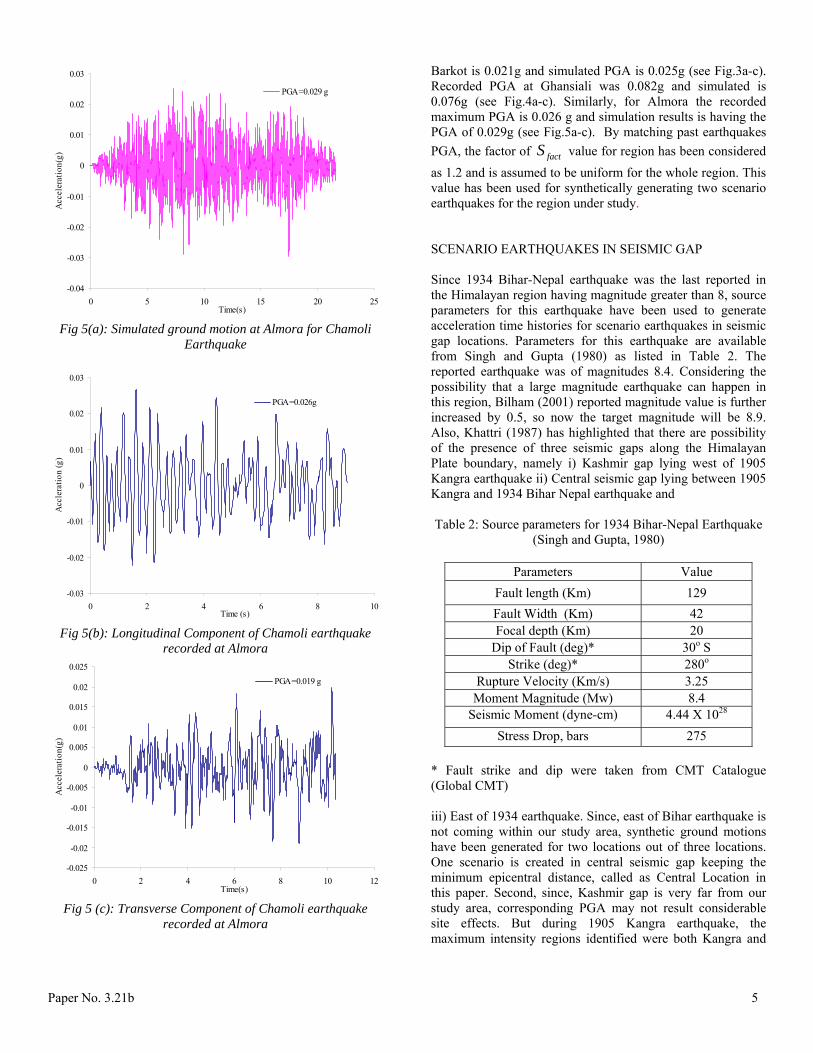
Fig 5(a): Simulated ground motion at Almora for Chamoli
Earthquake
-0.03
-0.02
-0.01
0
0.01
0.02
0.03
0 2 4 6 8 10Time (s)
Acc
lera
tion
(g)
PGA=0.026g
Fig 5(b): Longitudinal Component of Chamoli earthquake
recorded at Almora
-0.025
-0.02
-0.015
-0.01
-0.005
0
0.005
0.01
0.015
0.02
0.025
0 2 4 6 8 10 12Time(s)
Acc
eler
atio
n(g)
PGA=0.019 g
Fig 5 (c): Transverse Component of Chamoli earthquake
recorded at Almora
Barkot is 0.021g and simulated PGA is 0.025g (see Fig.3a-c). Recorded PGA at Ghansiali was 0.082g and simulated is 0.076g (see Fig.4a-c). Similarly, for Almora the recorded maximum PGA is 0.026 g and simulation results is having the PGA of 0.029g (see Fig.5a-c). By matching past earthquakes
PGA, the factor of factS value for region has been considered
as 1.2 and is assumed to be uniform for the whole region. This value has been used for synthetically generating two scenario earthquakes for the region under study. SCENARIO EARTHQUAKES IN SEISMIC GAP Since 1934 Bihar-Nepal earthquake was the last reported in the Himalayan region having magnitude greater than 8, source parameters for this earthquake have been used to generate acceleration time histories for scenario earthquakes in seismic gap locations. Parameters for this earthquake are available from Singh and Gupta (1980) as listed in Table 2. The reported earthquake was of magnitudes 8.4. Considering the possibility that a large magnitude earthquake can happen in this region, Bilham (2001) reported magnitude value is further increased by 0.5, so now the target magnitude will be 8.9. Also, Khattri (1987) has highlighted that there are possibility of the presence of three seismic gaps along the Himalayan Plate boundary, namely i) Kashmir gap lying west of 1905 Kangra earthquake ii) Central seismic gap lying between 1905 Kangra and 1934 Bihar Nepal earthquake and Table 2: Source parameters for 1934 Bihar-Nepal Earthquake
(Singh and Gupta, 1980)
Parameters Value
Fault length (Km) 129
Fault Width (Km) 42 Focal depth (Km) 20
Dip of Fault (deg)* 30o S Strike (deg)* 280o
Rupture Velocity (Km/s) 3.25 Moment Magnitude (Mw) 8.4
Seismic Moment (dyne-cm) 4.44 X 1028
Stress Drop, bars 275
* Fault strike and dip were taken from CMT Catalogue (Global CMT) iii) East of 1934 earthquake. Since, east of Bihar earthquake is not coming within our study area, synthetic ground motions have been generated for two locations out of three locations. One scenario is created in central seismic gap keeping the minimum epicentral distance, called as Central Location in this paper. Second, since, Kashmir gap is very far from our study area, corresponding PGA may not result considerable site effects. But during 1905 Kangra earthquake, the maximum intensity regions identified were both Kangra and
Paper No. 3.21b 6
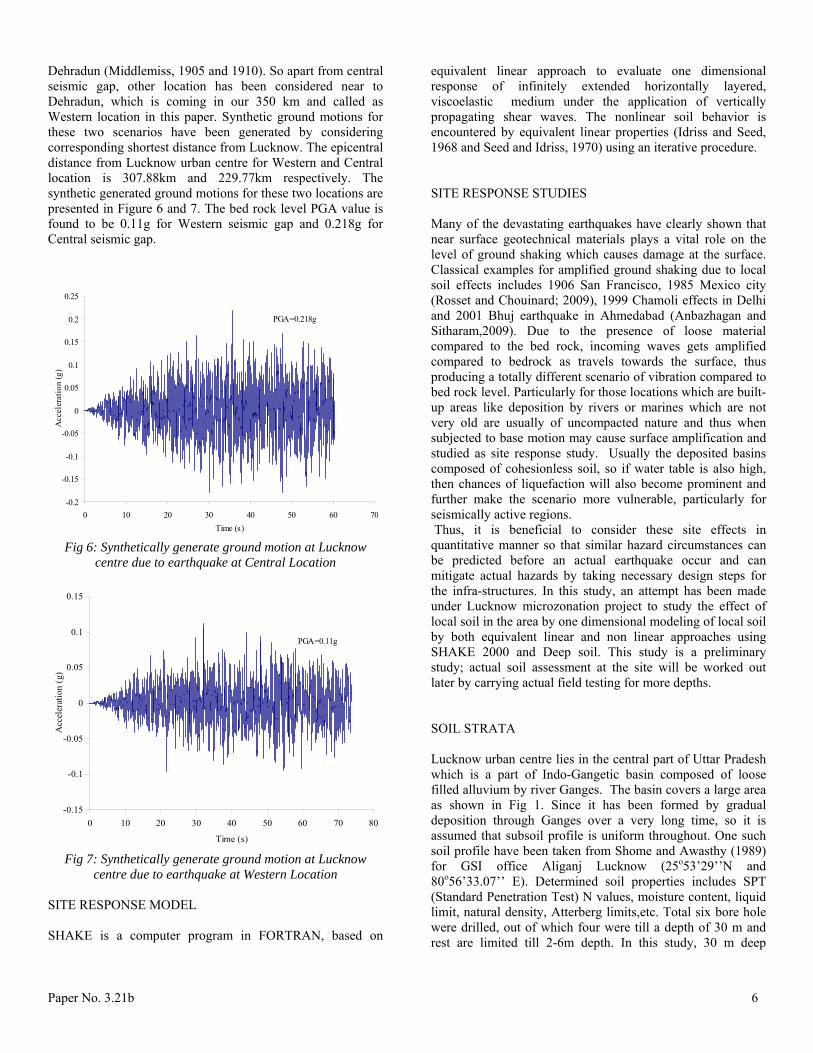
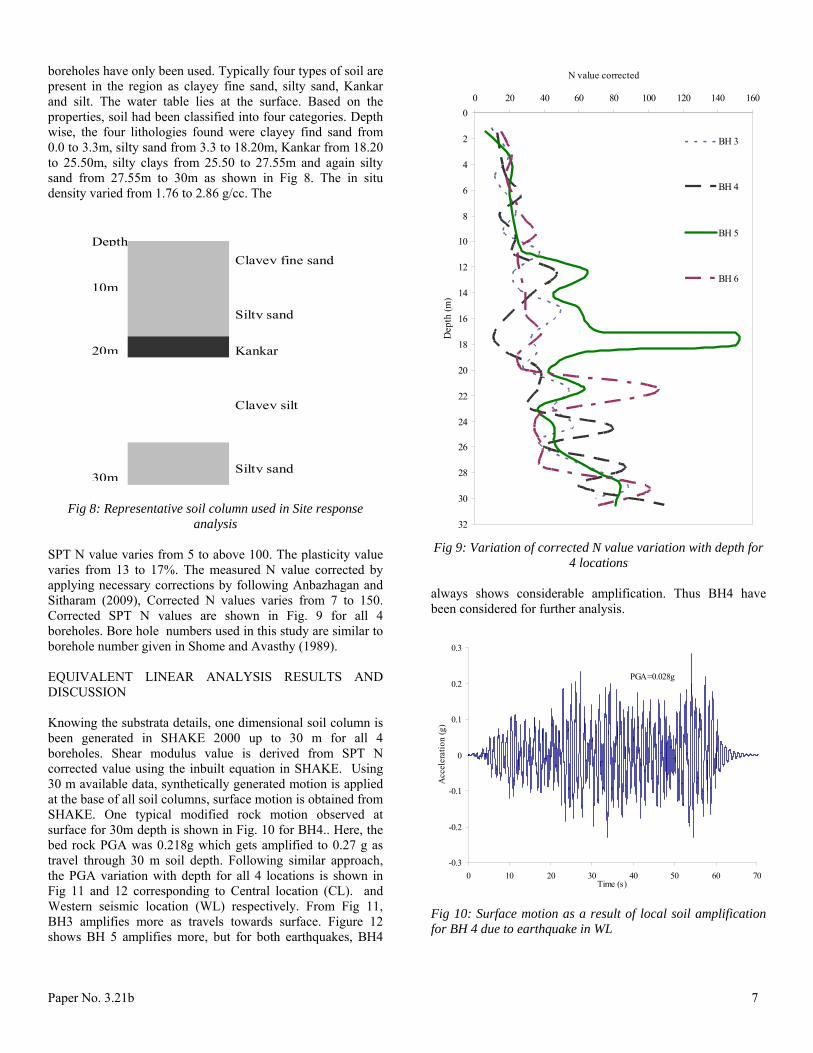
Dehradun (Middlemiss, 1905 and 1910). So apart from central seismic gap, other location has been considered near to Dehradun, which is coming in our 350 km and called as Western location in this paper. Synthetic ground motions for these two scenarios have been generated by considering corresponding shortest distance from Lucknow. The epicentral distance from Lucknow urban centre for Western and Central location is 307.88km and 229.77km respectively. The synthetic generated ground motions for these two locations are presented in Figure 6 and 7. The bed rock level PGA value is found to be 0.11g for Western seismic gap and 0.218g for Central seismic gap.
PGA=0.218g
-0.2
-0.15
-0.1
-0.05
0
0.05
0.1
0.15
0.2
0.25
0 10 20 30 40 50 60 70
Time (s)
Acc
eler
atio
n (g
)
Fig 6: Synthetically generate ground motion at Lucknow
centre due to earthquake at Central Location
PGA=0.11g
-0.15
-0.1
-0.05
0
0.05
0.1
0.15
0 10 20 30 40 50 60 70 80
Time (s)
Acc
eler
atio
n (g
)
Fig 7: Synthetically generate ground motion at Lucknow
centre due to earthquake at Western Location
SITE RESPONSE MODEL SHAKE is a computer program in FORTRAN, based on
equivalent linear approach to evaluate one dimensional response of infinitely extended horizontally layered, viscoelastic medium under the application of vertically propagating shear waves. The nonlinear soil behavior is encountered by equivalent linear properties (Idriss and Seed, 1968 and Seed and Idriss, 1970) using an iterative procedure. SITE RESPONSE STUDIES Many of the devastating earthquakes have clearly shown that near surface geotechnical materials plays a vital role on the level of ground shaking which causes damage at the surface. Classical examples for amplified ground shaking due to local soil effects includes 1906 San Francisco, 1985 Mexico city (Rosset and Chouinard; 2009), 1999 Chamoli effects in Delhi and 2001 Bhuj earthquake in Ahmedabad (Anbazhagan and Sitharam,2009). Due to the presence of loose material compared to the bed rock, incoming waves gets amplified compared to bedrock as travels towards the surface, thus producing a totally different scenario of vibration compared to bed rock level. Particularly for those locations which are built-up areas like deposition by rivers or marines which are not very old are usually of uncompacted nature and thus when subjected to base motion may cause surface amplification and studied as site response study. Usually the deposited basins composed of cohesionless soil, so if water table is also high, then chances of liquefaction will also become prominent and further make the scenario more vulnerable, particularly for seismically active regions. Thus, it is beneficial to consider these site effects in quantitative manner so that similar hazard circumstances can be predicted before an actual earthquake occur and can mitigate actual hazards by taking necessary design steps for the infra-structures. In this study, an attempt has been made under Lucknow microzonation project to study the effect of local soil in the area by one dimensional modeling of local soil by both equivalent linear and non linear approaches using SHAKE 2000 and Deep soil. This study is a preliminary study; actual soil assessment at the site will be worked out later by carrying actual field testing for more depths. SOIL STRATA Lucknow urban centre lies in the central part of Uttar Pradesh which is a part of Indo-Gangetic basin composed of loose filled alluvium by river Ganges. The basin covers a large area as shown in Fig 1. Since it has been formed by gradual deposition through Ganges over a very long time, so it is assumed that subsoil profile is uniform throughout. One such soil profile have been taken from Shome and Awasthy (1989) for GSI office Aliganj Lucknow (25o53’29’’N and 80o56’33.07’’ E). Determined soil properties includes SPT (Standard Penetration Test) N values, moisture content, liquid limit, natural density, Atterberg limits,etc. Total six bore hole were drilled, out of which four were till a depth of 30 m and rest are limited till 2-6m depth. In this study, 30 m deep
Paper No. 3.21b 7
boreholes have only been used. Typically four types of soil are present in the region as clayey fine sand, silty sand, Kankar and silt. The water table lies at the surface. Based on the properties, soil had been classified into four categories. Depth wise, the four lithologies found were clayey find sand from 0.0 to 3.3m, silty sand from 3.3 to 18.20m, Kankar from 18.20 to 25.50m, silty clays from 25.50 to 27.55m and again silty sand from 27.55m to 30m as shown in Fig 8. The in situ density varied from 1.76 to 2.86 g/cc. The
Depth
10m
20m
30m
Clayey fine sand
Silty sand
Kankar
Clayey silt
Silty sand
Fig 8: Representative soil column used in Site response
analysis SPT N value varies from 5 to above 100. The plasticity value varies from 13 to 17%. The measured N value corrected by applying necessary corrections by following Anbazhagan and Sitharam (2009), Corrected N values varies from 7 to 150. Corrected SPT N values are shown in Fig. 9 for all 4 boreholes. Bore hole numbers used in this study are similar to borehole number given in Shome and Avasthy (1989). EQUIVALENT LINEAR ANALYSIS RESULTS AND DISCUSSION Knowing the substrata details, one dimensional soil column is been generated in SHAKE 2000 up to 30 m for all 4 boreholes. Shear modulus value is derived from SPT N corrected value using the inbuilt equation in SHAKE. Using 30 m available data, synthetically generated motion is applied at the base of all soil columns, surface motion is obtained from SHAKE. One typical modified rock motion observed at surface for 30m depth is shown in Fig. 10 for BH4.. Here, the bed rock PGA was 0.218g which gets amplified to 0.27 g as travel through 30 m soil depth. Following similar approach, the PGA variation with depth for all 4 locations is shown in Fig 11 and 12 corresponding to Central location (CL). and Western seismic location (WL) respectively. From Fig 11, BH3 amplifies more as travels towards surface. Figure 12 shows BH 5 amplifies more, but for both earthquakes, BH4
0
2
4
6
8
10
12
14
16
18
20
22
24
26
28
30
32
0 20 40 60 80 100 120 140 160
N value corrected
Dep
th (m
)
BH 3
BH 4
BH 5
BH 6
Fig 9: Variation of corrected N value variation with depth for
4 locations always shows considerable amplification. Thus BH4 have been considered for further analysis.
PGA=0.028g
-0.3
-0.2
-0.1
0
0.1
0.2
0.3
0 10 20 30 40 50 60 70Time (s)
Acc
eler
atio
n (g
)
Fig 10: Surface motion as a result of local soil amplification for BH 4 due to earthquake in WL
Paper No. 3.21b 8
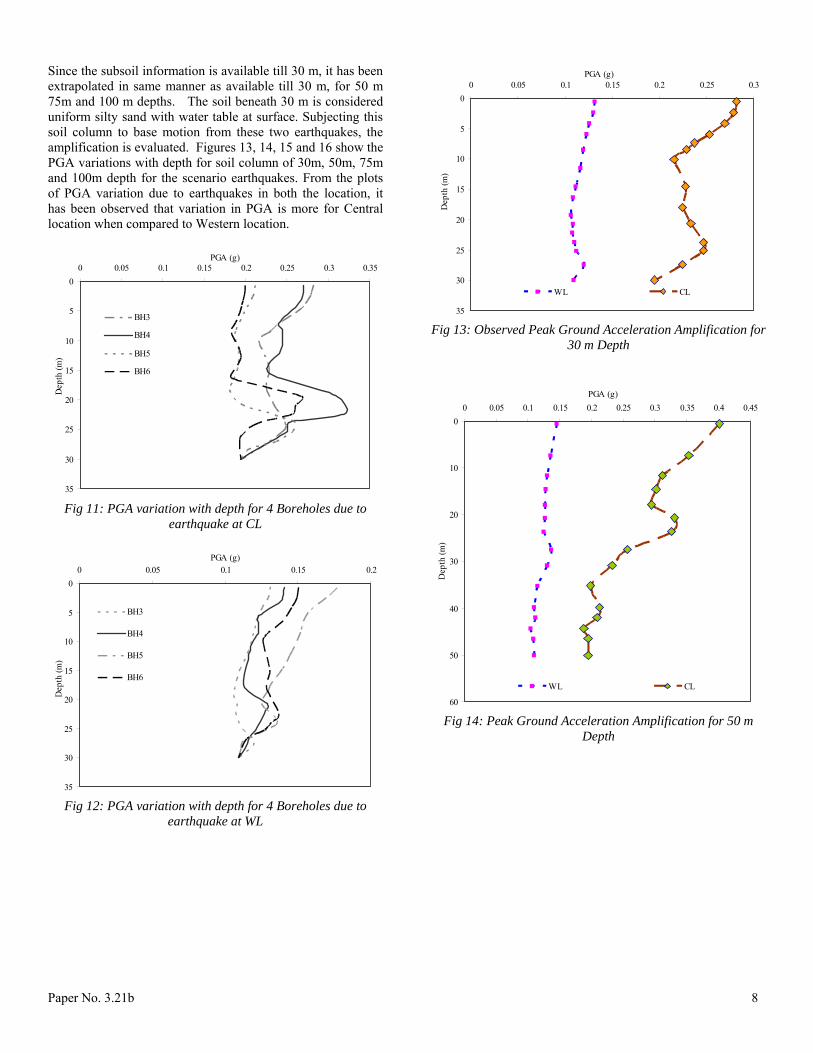
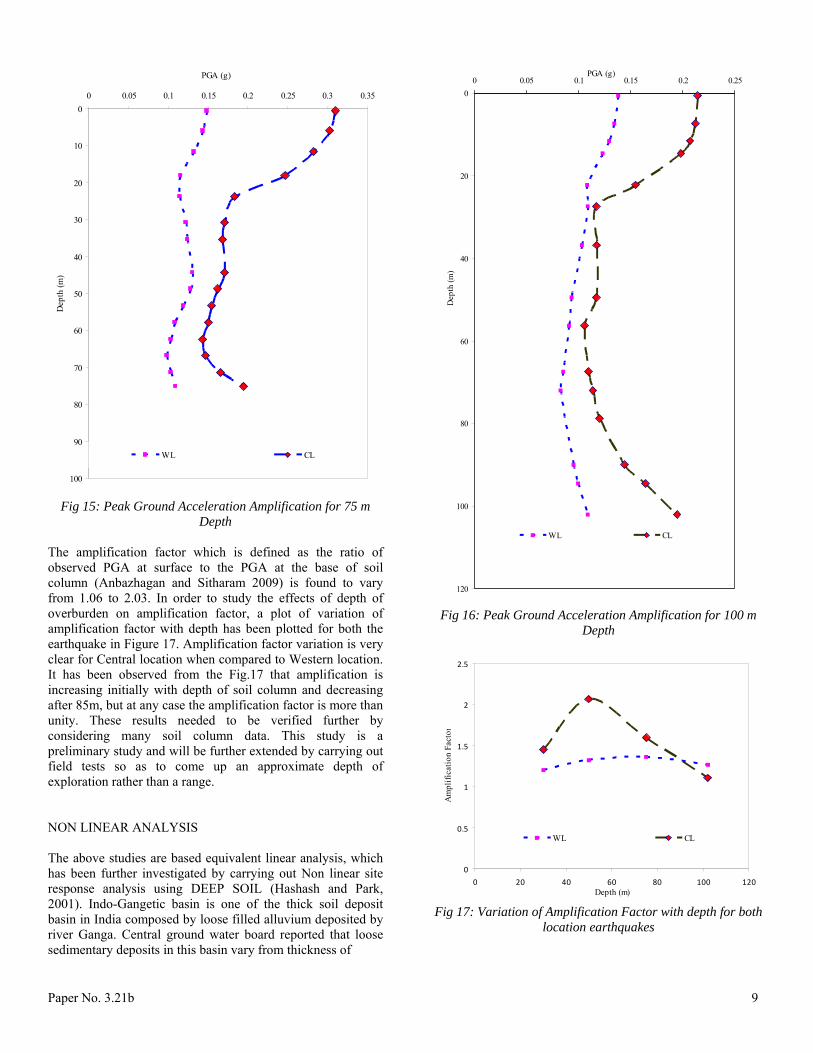
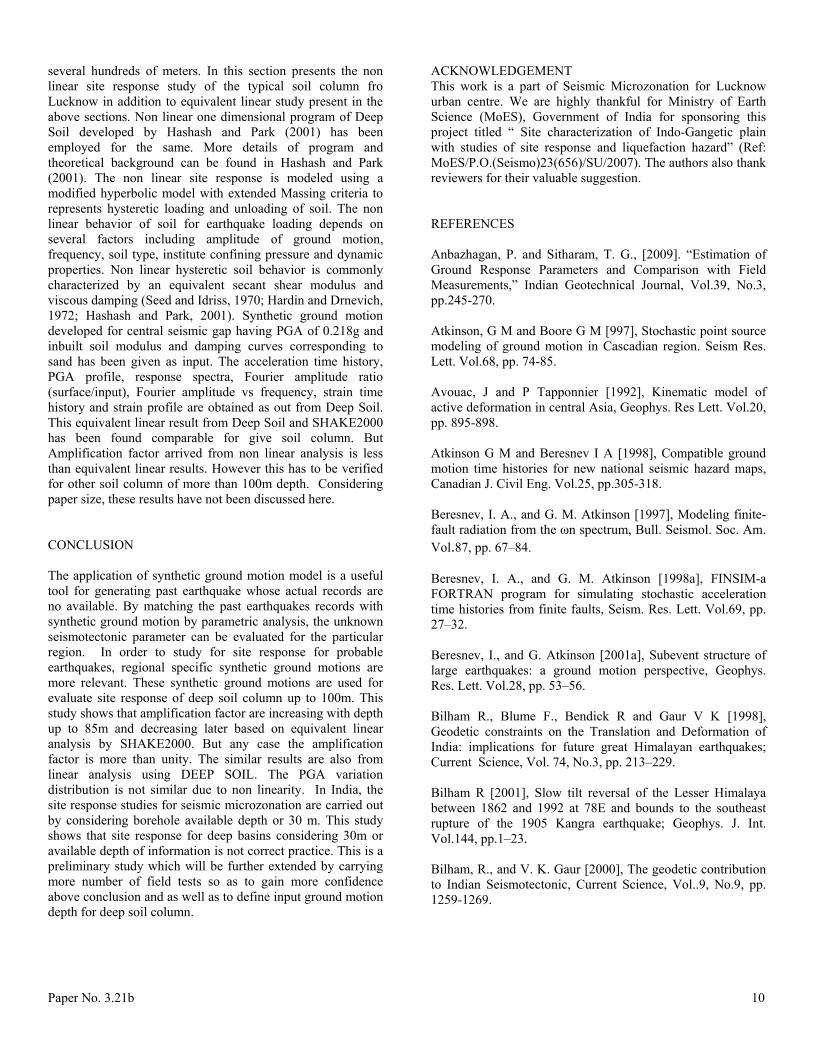
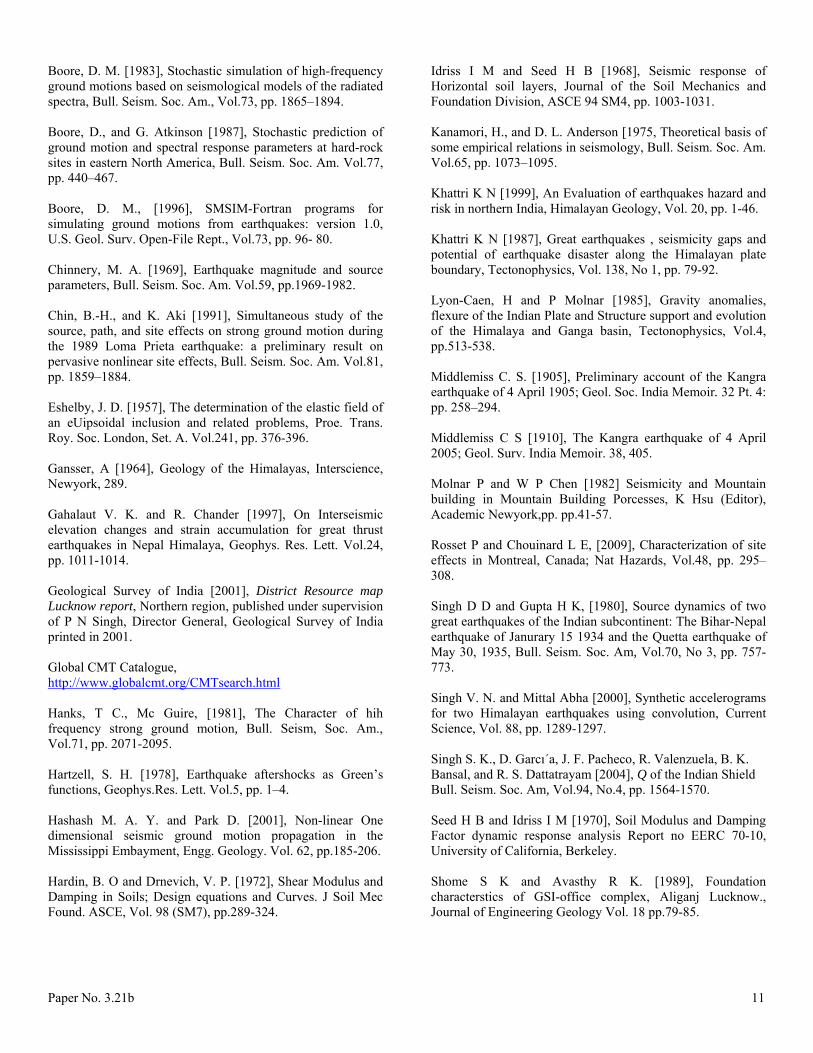
Since the subsoil information is available till 30 m, it has been extrapolated in same manner as available till 30 m, for 50 m 75m and 100 m depths. The soil beneath 30 m is considered uniform silty sand with water table at surface. Subjecting this soil column to base motion from these two earthquakes, the amplification is evaluated. Figures 13, 14, 15 and 16 show the PGA variations with depth for soil column of 30m, 50m, 75m and 100m depth for the scenario earthquakes. From the plots of PGA variation due to earthquakes in both the location, it has been observed that variation in PGA is more for Central location when compared to Western location.
0
5
10
15
20
25
30
35
0 0.05 0.1 0.15 0.2 0.25 0.3 0.35PGA (g)
Dep
th (m
)
BH3
BH4
BH5
BH6
Fig 11: PGA variation with depth for 4 Boreholes due to
earthquake at CL
0
5
10
15
20
25
30
35
0 0.05 0.1 0.15 0.2PGA (g)
Dep
th (m
)
BH3
BH4
BH5
BH6
Fig 12: PGA variation with depth for 4 Boreholes due to
earthquake at WL
0
5
10
15
20
25
30
35
0 0.05 0.1 0.15 0.2 0.25 0.3PGA (g)
Dep
th (m
)
WL CL
Fig 13: Observed Peak Ground Acceleration Amplification for
30 m Depth
0
10
20
30
40
50
60
0 0.05 0.1 0.15 0.2 0.25 0.3 0.35 0.4 0.45
PGA (g)
Dep
th (m
)
WL CL
Fig 14: Peak Ground Acceleration Amplification for 50 m
Depth
Paper No. 3.21b 9
0
10
20
30
40
50
60
70
80
90
100
0 0.05 0.1 0.15 0.2 0.25 0.3 0.35
PGA (g)
Dep
th (m
)
WL CL
Fig 15: Peak Ground Acceleration Amplification for 75 m
Depth The amplification factor which is defined as the ratio of observed PGA at surface to the PGA at the base of soil column (Anbazhagan and Sitharam 2009) is found to vary from 1.06 to 2.03. In order to study the effects of depth of overburden on amplification factor, a plot of variation of amplification factor with depth has been plotted for both the earthquake in Figure 17. Amplification factor variation is very clear for Central location when compared to Western location. It has been observed from the Fig.17 that amplification is increasing initially with depth of soil column and decreasing after 85m, but at any case the amplification factor is more than unity. These results needed to be verified further by considering many soil column data. This study is a preliminary study and will be further extended by carrying out field tests so as to come up an approximate depth of exploration rather than a range. NON LINEAR ANALYSIS The above studies are based equivalent linear analysis, which has been further investigated by carrying out Non linear site response analysis using DEEP SOIL (Hashash and Park, 2001). Indo-Gangetic basin is one of the thick soil deposit basin in India composed by loose filled alluvium deposited by river Ganga. Central ground water board reported that loose sedimentary deposits in this basin vary from thickness of
0
20
40
60
80
100
120
0 0.05 0.1 0.15 0.2 0.25PGA (g)
Dep
th (m
)
WL CL
Fig 16: Peak Ground Acceleration Amplification for 100 m
Depth
0
0.5
1
1.5
2
2.5
0 20 40 60 80 100 120Depth (m)
Am
plif
icat
ion
Fact
or
WL CL
Fig 17: Variation of Amplification Factor with depth for both
location earthquakes
Paper No. 3.21b 10
several hundreds of meters. In this section presents the non linear site response study of the typical soil column fro Lucknow in addition to equivalent linear study present in the above sections. Non linear one dimensional program of Deep Soil developed by Hashash and Park (2001) has been employed for the same. More details of program and theoretical background can be found in Hashash and Park (2001). The non linear site response is modeled using a modified hyperbolic model with extended Massing criteria to represents hysteretic loading and unloading of soil. The non linear behavior of soil for earthquake loading depends on several factors including amplitude of ground motion, frequency, soil type, institute confining pressure and dynamic properties. Non linear hysteretic soil behavior is commonly characterized by an equivalent secant shear modulus and viscous damping (Seed and Idriss, 1970; Hardin and Drnevich, 1972; Hashash and Park, 2001). Synthetic ground motion developed for central seismic gap having PGA of 0.218g and inbuilt soil modulus and damping curves corresponding to sand has been given as input. The acceleration time history, PGA profile, response spectra, Fourier amplitude ratio (surface/input), Fourier amplitude vs frequency, strain time history and strain profile are obtained as out from Deep Soil. This equivalent linear result from Deep Soil and SHAKE2000 has been found comparable for give soil column. But Amplification factor arrived from non linear analysis is less than equivalent linear results. However this has to be verified for other soil column of more than 100m depth. Considering paper size, these results have not been discussed here. CONCLUSION The application of synthetic ground motion model is a useful tool for generating past earthquake whose actual records are no available. By matching the past earthquakes records with synthetic ground motion by parametric analysis, the unknown seismotectonic parameter can be evaluated for the particular region. In order to study for site response for probable earthquakes, regional specific synthetic ground motions are more relevant. These synthetic ground motions are used for evaluate site response of deep soil column up to 100m. This study shows that amplification factor are increasing with depth up to 85m and decreasing later based on equivalent linear analysis by SHAKE2000. But any case the amplification factor is more than unity. The similar results are also from linear analysis using DEEP SOIL. The PGA variation distribution is not similar due to non linearity. In India, the site response studies for seismic microzonation are carried out by considering borehole available depth or 30 m. This study shows that site response for deep basins considering 30m or available depth of information is not correct practice. This is a preliminary study which will be further extended by carrying more number of field tests so as to gain more confidence above conclusion and as well as to define input ground motion depth for deep soil column.
ACKNOWLEDGEMENT This work is a part of Seismic Microzonation for Lucknow urban centre. We are highly thankful for Ministry of Earth Science (MoES), Government of India for sponsoring this project titled “ Site characterization of Indo-Gangetic plain with studies of site response and liquefaction hazard” (Ref: MoES/P.O.(Seismo)23(656)/SU/2007). The authors also thank reviewers for their valuable suggestion. REFERENCES Anbazhagan, P. and Sitharam, T. G., [2009]. “Estimation of Ground Response Parameters and Comparison with Field Measurements,” Indian Geotechnical Journal, Vol.39, No.3, pp.245-270. Atkinson, G M and Boore G M [997], Stochastic point source modeling of ground motion in Cascadian region. Seism Res. Lett. Vol.68, pp. 74-85. Avouac, J and P Tapponnier [1992], Kinematic model of active deformation in central Asia, Geophys. Res Lett. Vol.20, pp. 895-898. Atkinson G M and Beresnev I A [1998], Compatible ground motion time histories for new national seismic hazard maps, Canadian J. Civil Eng. Vol.25, pp.305-318. Beresnev, I. A., and G. M. Atkinson [1997], Modeling finite-fault radiation from the ωn spectrum, Bull. Seismol. Soc. Am. Vol.87, pp. 67–84. Beresnev, I. A., and G. M. Atkinson [1998a], FINSIM-a FORTRAN program for simulating stochastic acceleration time histories from finite faults, Seism. Res. Lett. Vol.69, pp. 27–32. Beresnev, I., and G. Atkinson [2001a], Subevent structure of large earthquakes: a ground motion perspective, Geophys. Res. Lett. Vol.28, pp. 53–56. Bilham R., Blume F., Bendick R and Gaur V K [1998], Geodetic constraints on the Translation and Deformation of India: implications for future great Himalayan earthquakes; Current Science, Vol. 74, No.3, pp. 213–229. Bilham R [2001], Slow tilt reversal of the Lesser Himalaya between 1862 and 1992 at 78E and bounds to the southeast rupture of the 1905 Kangra earthquake; Geophys. J. Int. Vol.144, pp.1–23. Bilham, R., and V. K. Gaur [2000], The geodetic contribution to Indian Seismotectonic, Current Science, Vol..9, No.9, pp. 1259-1269.
Paper No. 3.21b 11
Boore, D. M. [1983], Stochastic simulation of high-frequency ground motions based on seismological models of the radiated spectra, Bull. Seism. Soc. Am., Vol.73, pp. 1865–1894. Boore, D., and G. Atkinson [1987], Stochastic prediction of ground motion and spectral response parameters at hard-rock sites in eastern North America, Bull. Seism. Soc. Am. Vol.77, pp. 440–467. Boore, D. M., [1996], SMSIM-Fortran programs for simulating ground motions from earthquakes: version 1.0, U.S. Geol. Surv. Open-File Rept., Vol.73, pp. 96- 80. Chinnery, M. A. [1969], Earthquake magnitude and source parameters, Bull. Seism. Soc. Am. Vol.59, pp.1969-1982. Chin, B.-H., and K. Aki [1991], Simultaneous study of the source, path, and site effects on strong ground motion during the 1989 Loma Prieta earthquake: a preliminary result on pervasive nonlinear site effects, Bull. Seism. Soc. Am. Vol.81, pp. 1859–1884. Eshelby, J. D. [1957], The determination of the elastic field of an eUipsoidal inclusion and related problems, Proe. Trans. Roy. Soc. London, Set. A. Vol.241, pp. 376-396. Gansser, A [1964], Geology of the Himalayas, Interscience, Newyork, 289. Gahalaut V. K. and R. Chander [1997], On Interseismic elevation changes and strain accumulation for great thrust earthquakes in Nepal Himalaya, Geophys. Res. Lett. Vol.24, pp. 1011-1014. Geological Survey of India [2001], District Resource map Lucknow report, Northern region, published under supervision of P N Singh, Director General, Geological Survey of India printed in 2001. Global CMT Catalogue, http://www.globalcmt.org/CMTsearch.html Hanks, T C., Mc Guire, [1981], The Character of hih frequency strong ground motion, Bull. Seism, Soc. Am., Vol.71, pp. 2071-2095. Hartzell, S. H. [1978], Earthquake aftershocks as Green’s functions, Geophys.Res. Lett. Vol.5, pp. 1–4. Hashash M. A. Y. and Park D. [2001], Non-linear One dimensional seismic ground motion propagation in the Mississippi Embayment, Engg. Geology. Vol. 62, pp.185-206. Hardin, B. O and Drnevich, V. P. [1972], Shear Modulus and Damping in Soils; Design equations and Curves. J Soil Mec Found. ASCE, Vol. 98 (SM7), pp.289-324.
Idriss I M and Seed H B [1968], Seismic response of Horizontal soil layers, Journal of the Soil Mechanics and Foundation Division, ASCE 94 SM4, pp. 1003-1031. Kanamori, H., and D. L. Anderson [1975, Theoretical basis of some empirical relations in seismology, Bull. Seism. Soc. Am. Vol.65, pp. 1073–1095. Khattri K N [1999], An Evaluation of earthquakes hazard and risk in northern India, Himalayan Geology, Vol. 20, pp. 1-46. Khattri K N [1987], Great earthquakes , seismicity gaps and potential of earthquake disaster along the Himalayan plate boundary, Tectonophysics, Vol. 138, No 1, pp. 79-92. Lyon-Caen, H and P Molnar [1985], Gravity anomalies, flexure of the Indian Plate and Structure support and evolution of the Himalaya and Ganga basin, Tectonophysics, Vol.4, pp.513-538. Middlemiss C. S. [1905], Preliminary account of the Kangra earthquake of 4 April 1905; Geol. Soc. India Memoir. 32 Pt. 4: pp. 258–294. Middlemiss C S [1910], The Kangra earthquake of 4 April 2005; Geol. Surv. India Memoir. 38, 405. Molnar P and W P Chen [1982] Seismicity and Mountain building in Mountain Building Porcesses, K Hsu (Editor), Academic Newyork,pp. pp.41-57. Rosset P and Chouinard L E, [2009], Characterization of site effects in Montreal, Canada; Nat Hazards, Vol.48, pp. 295–308. Singh D D and Gupta H K, [1980], Source dynamics of two great earthquakes of the Indian subcontinent: The Bihar-Nepal earthquake of Janurary 15 1934 and the Quetta earthquake of May 30, 1935, Bull. Seism. Soc. Am, Vol.70, No 3, pp. 757-773. Singh V. N. and Mittal Abha [2000], Synthetic accelerograms for two Himalayan earthquakes using convolution, Current Science, Vol. 88, pp. 1289-1297. Singh S. K., D. Garcı´a, J. F. Pacheco, R. Valenzuela, B. K. Bansal, and R. S. Dattatrayam [2004], Q of the Indian Shield Bull. Seism. Soc. Am, Vol.94, No.4, pp. 1564-1570. Seed H B and Idriss I M [1970], Soil Modulus and Damping Factor dynamic response analysis Report no EERC 70-10, University of California, Berkeley. Shome S K and Avasthy R K. [1989], Foundation characterstics of GSI-office complex, Aliganj Lucknow., Journal of Engineering Geology Vol. 18 pp.79-85.

Paper No. 3.21b 12
Seeber and J. G. Armbruster [1981], Great detachment earthquakes along the Hmalayan arc and long term forecasting, in Earthquake Prediction: An International Review, Maurice Ewing Series 4, American Geophysical Union, Washington D C, pp. 259-277. Sitharam, T. G. and Anbazhagan, P., [2007]; Seismic Hazard Analysis for Bangalore Region, Journal of Natural Hazards, Vol 40, pp.261-278.
Shrikhande M [2001] Atlas of Indian Strong Motion Records, CD publication by IIT Roorkee. Toro, G. R., N. A. Abrahamson, and J. F. Schneider [1997], Model of strong ground motions from earthquakes in central and eastern North America: best estimates and uncertainties, Seism. Res. Lett., Vol.68,pp. 41–57.
Related Documents