Geotechnical and Geophysical Site Characterization – Huang & Mayne (eds) © 2008Taylor & Francis Group, London, ISBN 978-0-415-46936-4 Site characterization studies of Bangalore using a geophysical method P. Anbazhagan & T.G. Sitharam Department Civil Engineering, Indian Institute of Science, Bangalore ABSTRACT: A number of geophysical methods have been proposed for near-surface site characterization and measurement of shear wave velocity by using a great variety of testing configurations, processing tech- niques, and inversion algorithms. In particular, two widely-used techniques are SASW (Spectral Analysis of Surface Waves) and MASW (Multichannel Analysis of Surface Waves). MASW is increasingly being applied to earthquake geotechnical engineering for the local site characterization, microzonation and site response studies. A MASW is a geophysical method, which generates a shear-wave velocity (Vs) profile (i.e., Vs versus depth) by analyzing Raleigh-type surface waves on a multichannel record. MASW system consisting of 24 channels Geode seismograph with 24 geophones of 4.5Hz frequency have been used in this investigation. For the site characterization program, the MASW field experiments consisting of 58 one-dimensional shear wave velocity tests and 20 two-dimensional shear wave tests have been carried out. The survey points have been selected in such a way that the results supposedly represent the whole metropolitan Bangalore having an area of 220km 2 . The average shear wave velocity of Bangalore soils have been evaluated for depths of 5 m, 10 m, 15 m, 20 m, 25 m and 30 m. The subsoil site classification has been made for seismic local site effect evaluation based on average shear wave velocity of 30m depth (Vs 30 ) of sites using National Earthquake Hazards Reduction Pro- gram (NEHRP) and International Building Code (IBC) classification. Soil average shear wave velocity estimated based on overburden thickness from the borehole information is also presented. Mapping clearly indicates that the depth of soil obtained from MASW is closely matching with the soil layers in bore logs. Among total 55 locations of MASW survey carried out, 34 locations were very close to the SPT borehole locations and these are used to generate correlation between Vs and corrected “N” values. The SPT field “N” values are corrected by applying the NEHRP recommended corrections. 1 INTRODUCTION To ascertain the manifestation of earthquake shaking on the ground surface, velocity parameters at a shallow level would be of consequence. Shear wave veloc- ity ( Vs) is an essential parameter for evaluating the dynamic properties of soil in the shallow subsurface. A number of geophysical methods have been proposed for near-surface characterization and measurement of shear wave velocity by using a great variety of test- ing configurations, processing techniques, and inver- sion algorithms. The most widely-used techniques are SASW (Spectral Analysis of Surface Waves) and MASW (Multichannel Analysis of Surface Waves). SASW method uses the spectral analysis of a surface wave generated by an impulsive source and recorded by a pair of receivers. Evaluating and distinguishing signal from noise with only a pair of receivers by this method is difficult. Thus to improve inherent diffi- culties, a new technique incorporating multichannel analysis of surface waves using active sources, named as MASW, was developed (Park et al., 1999; Xia et al., 1999; Xu et al., 2006). The MASW has been found to be a more efficient method for unraveling the shallow subsurface properties (Park et al., 1999; Xia et al., 1999; Zhang et al., 2004). MASW is increasingly being applied to earthquake geotechnical engineering for microzonation and site response studies. In particu- lar, MASW is used in geotechnical engineering for the measurement of shear wave velocity and estimation of dynamic properties, identification of subsurface mate- rial boundaries and spatial variations of shear wave velocity. MASW is non-intrusive and less time con- suming geophysical method. It is a seismic method that can be used for geotechnical characterization of near surface materials (Park et al., 1999; Xia et al., 1999; Miller et al., 1999; Park et al., 2005a; Kanli et al., 2006). MASW identifies each type of seismic waves on a multichannel record based on the normal pattern recognition technique that has been used in oil exploration for several decades. The identification leads to an optimum field configuration that assures the highest signal-to-noise ratio (S/N). Effectiveness in signal analysis is then further enhanced by diversity 793

Welcome message from author
This document is posted to help you gain knowledge. Please leave a comment to let me know what you think about it! Share it to your friends and learn new things together.
Transcript
Geotechnical and Geophysical Site Characterization – Huang & Mayne (eds)© 2008 Taylor & Francis Group, London, ISBN 978-0-415-46936-4
Site characterization studies of Bangalore using a geophysical method
P. Anbazhagan & T.G. SitharamDepartment Civil Engineering, Indian Institute of Science, Bangalore
ABSTRACT: A number of geophysical methods have been proposed for near-surface site characterizationand measurement of shear wave velocity by using a great variety of testing configurations, processing tech-niques, and inversion algorithms. In particular, two widely-used techniques are SASW (Spectral Analysis ofSurface Waves) and MASW (Multichannel Analysis of Surface Waves). MASW is increasingly being applied toearthquake geotechnical engineering for the local site characterization, microzonation and site response studies.A MASW is a geophysical method, which generates a shear-wave velocity (Vs) profile (i.e., Vs versus depth)by analyzing Raleigh-type surface waves on a multichannel record. MASW system consisting of 24 channelsGeode seismograph with 24 geophones of 4.5 Hz frequency have been used in this investigation. For the sitecharacterization program, the MASW field experiments consisting of 58 one-dimensional shear wave velocitytests and 20 two-dimensional shear wave tests have been carried out. The survey points have been selected insuch a way that the results supposedly represent the whole metropolitan Bangalore having an area of 220 km2.The average shear wave velocity of Bangalore soils have been evaluated for depths of 5 m, 10 m, 15 m, 20 m,25 m and 30 m. The subsoil site classification has been made for seismic local site effect evaluation based onaverage shear wave velocity of 30 m depth (Vs30) of sites using National Earthquake Hazards Reduction Pro-gram (NEHRP) and International Building Code (IBC) classification. Soil average shear wave velocity estimatedbased on overburden thickness from the borehole information is also presented. Mapping clearly indicates thatthe depth of soil obtained from MASW is closely matching with the soil layers in bore logs. Among total 55locations of MASW survey carried out, 34 locations were very close to the SPT borehole locations and theseare used to generate correlation between Vs and corrected “N” values. The SPT field “N” values are correctedby applying the NEHRP recommended corrections.
1 INTRODUCTION
To ascertain the manifestation of earthquake shakingon the ground surface, velocity parameters at a shallowlevel would be of consequence. Shear wave veloc-ity (Vs) is an essential parameter for evaluating thedynamic properties of soil in the shallow subsurface.A number of geophysical methods have been proposedfor near-surface characterization and measurement ofshear wave velocity by using a great variety of test-ing configurations, processing techniques, and inver-sion algorithms. The most widely-used techniquesare SASW (Spectral Analysis of Surface Waves) andMASW (Multichannel Analysis of Surface Waves).SASW method uses the spectral analysis of a surfacewave generated by an impulsive source and recordedby a pair of receivers. Evaluating and distinguishingsignal from noise with only a pair of receivers by thismethod is difficult. Thus to improve inherent diffi-culties, a new technique incorporating multichannelanalysis of surface waves using active sources, namedas MASW, was developed (Park et al., 1999; Xia et al.,
1999; Xu et al., 2006). The MASW has been found tobe a more efficient method for unraveling the shallowsubsurface properties (Park et al., 1999; Xia et al.,1999; Zhang et al., 2004). MASW is increasinglybeing applied to earthquake geotechnical engineeringfor microzonation and site response studies. In particu-lar, MASW is used in geotechnical engineering for themeasurement of shear wave velocity and estimation ofdynamic properties, identification of subsurface mate-rial boundaries and spatial variations of shear wavevelocity. MASW is non-intrusive and less time con-suming geophysical method. It is a seismic methodthat can be used for geotechnical characterization ofnear surface materials (Park et al., 1999; Xia et al.,1999; Miller et al., 1999; Park et al., 2005a; Kanliet al., 2006). MASW identifies each type of seismicwaves on a multichannel record based on the normalpattern recognition technique that has been used inoil exploration for several decades. The identificationleads to an optimum field configuration that assuresthe highest signal-to-noise ratio (S/N). Effectivenessin signal analysis is then further enhanced by diversity
793
and flexibility in the data processing phase (Ivanovet al., 2005). MASW is also used to generate 2-D shearwave velocity profiles. In this paper the average shearwave velocity for 5 m, 10 m, 15 m, 20 m, 25 m and 30 m(Vs30) has been evaluated and mapped for Bangalorecovering an area of 220 km2 in Bangalore Municipalcorporation limits. The study has been carried out forassigning soil classification for seismic local site effectevaluation.
2 STUDY AREA AND MASW
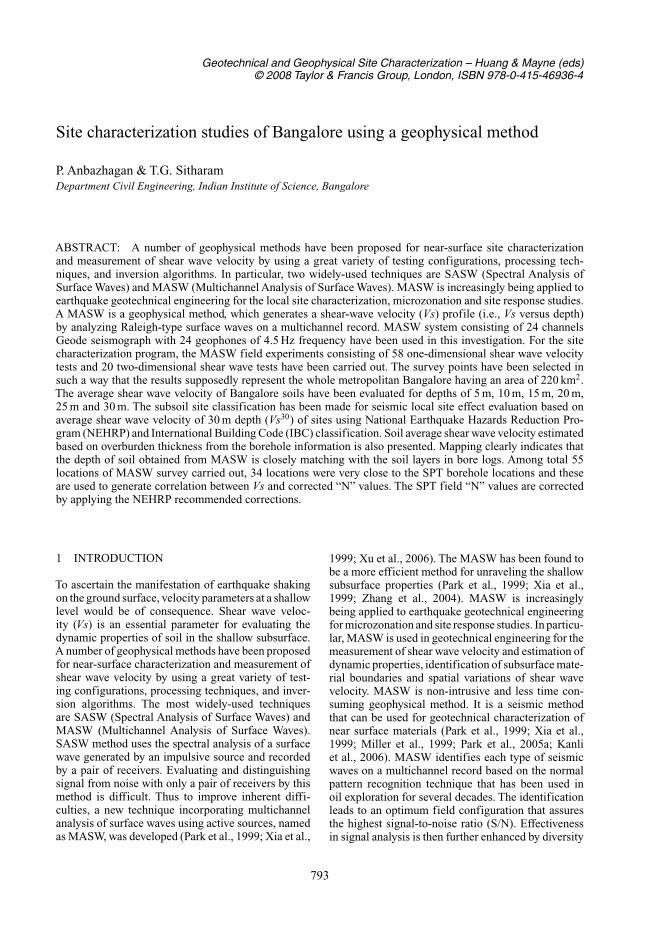
Bangalore city covers an area of over 220 km2 and isat an average altitude of around 910 m above meansea level (MSL). It is situated on a latitude of 12◦ 58′North and longitude of 77◦ 37′ East. It is the princi-pal administrative, industrial, commercial, educationaland cultural capital of Karnataka state, in the South-Western part of India (Figure 1). There were over 150lakes, though most of them are dried up due to erosionand encroachments leaving only 64 at present in anarea of 220 sq km. These tanks were once distributedthroughout the city for better water supply facilitiesand are presently in a dried up condition, the residualsilt and silty sand forming thick deposits over whichbuildings/structures have been erected.These soil con-ditions may be susceptible for site amplification duringexcitation of seismic waves. Because of density ofpopulation, mushrooming of buildings of all kindsfrom mud buildings to reinforced cement concrete(RCC) framed structures and steel construction and,improper and low quality construction practice, Ban-galore is vulnerable even against average earthquakes(Sitharam et al., 2006).
Figure 1. Study area with Marked MASW TestingLocations.
The recent studies by Ganesha Raj and Nijagunappa(2004), Sitharam et al. (2006) and Sitharam andAnbazhagan (2007) have suggested that Bangalore beupgraded from the present seismic zone II (BIS, 2002)to zone III based on the regional seismotectonic detailsand hazard analysis. Hence subsoil classification forthe Bangalore region is important to evaluate seismiclocal site effects for an earthquake. From the 3-D sub-surface model of geotechnical bore log data developedby Sitharam et al., (2007), authors have identified thatthe overburden thickness of study area varies from 1 mto about 40 m.
MASW is a geophysical method, which generates ashear wave velocity (Vs) profile (i.e., Vs versus depth)by analyzing Raleigh-type surface waves on a multi-channel record. A MASW system consisting of a 24channels Geode seismograph with 24 geophones of4.5 Hz frequency were used in this investigation. Theseismic waves are created by the impulsive source of 15pound (sledge hammer) with 300 mm × 300 mm sizehammer plate using ten shots. The recorded Rayleighwave is further analyzed using SurfSeis software. Surf-Seis is designed to generate Vs data (either in 1-Dor 2-D format) using a simple three-step procedure:i) preparation of a multichannel record (some timescalled a shot gather or a field file), ii) dispersion-curveanalysis, and iii) inversion. MASW has been effec-tively used with highest signal-to-noise ratio (S/N) ofsurface waves. MASW method has been successfullyapplied to various types of geotechnical and geophysi-cal projects such as mapping 2-D bedrock surface andshear modulus of overburden materials (Miller et al.,1999), generation of shear-wave velocity (Vs) profiles(Xia et al., 2000), seismic evaluation of pavements(Ryden et al., 2004), and seismic characterization ofsea-bottom sediments (Park et al., 2005b).
The test locations are selected in such a way thatthese supposedly represent the entire city subsurfaceinformation (Figure 1). In total 58 one-dimensional(1-D) surveys and 20 two-dimensional (2-D) surveyshave been carried out. In about 38 locations MASWsurvey point are very close to the SPT borehole loca-tions. Most of the survey locations are selected in flatground and also in important places like parks, hospi-tals, schools and temple yards etc. The optimum fieldparameters such as source to first and last receiver,receiver spacing and spread length of survey lines areselected in such a way that required depth of infor-mation can be obtained. All tests have been carriedout with a geophone interval of 1 m, source has beenkept on both sides of the spread and distance fromsource to the first and last receiver were also variedfrom 5 m, 10 m and 15 m to avoid the effects of near-field and far-field. These source distances were helpedto record good signals in very soft, soft and hard soils.The exploration services section at the Kansas Geo-logical Survey (KGS) has suggested an offset distance
794
for very soft, soft and hard soil as 1 m to 5 m, 5 m to10 m and 10 m to 15 m respectively (Xu et al., 2006).
3 DATA ANALYSIS AND RESULTS
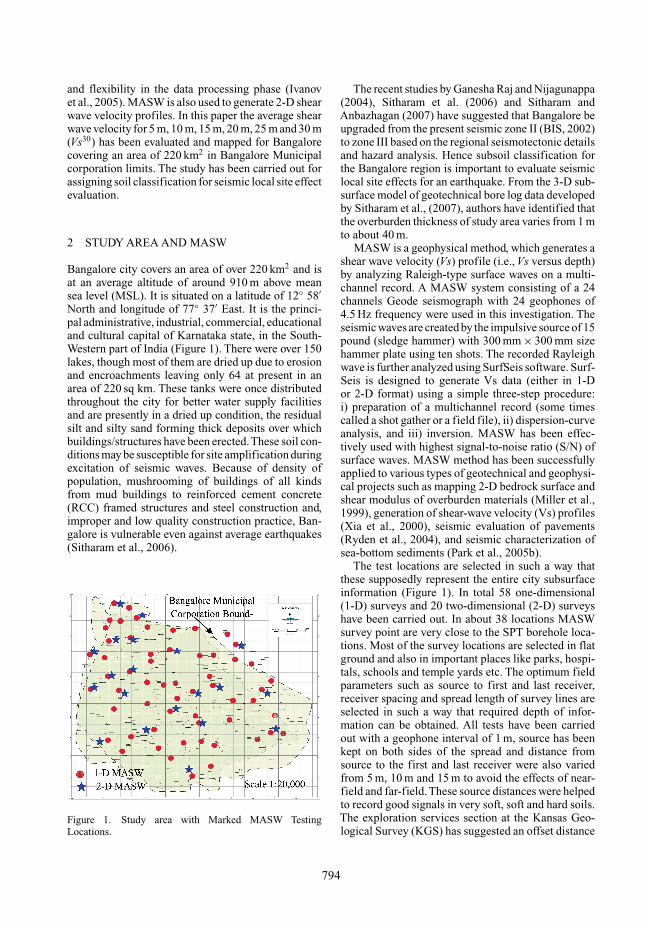
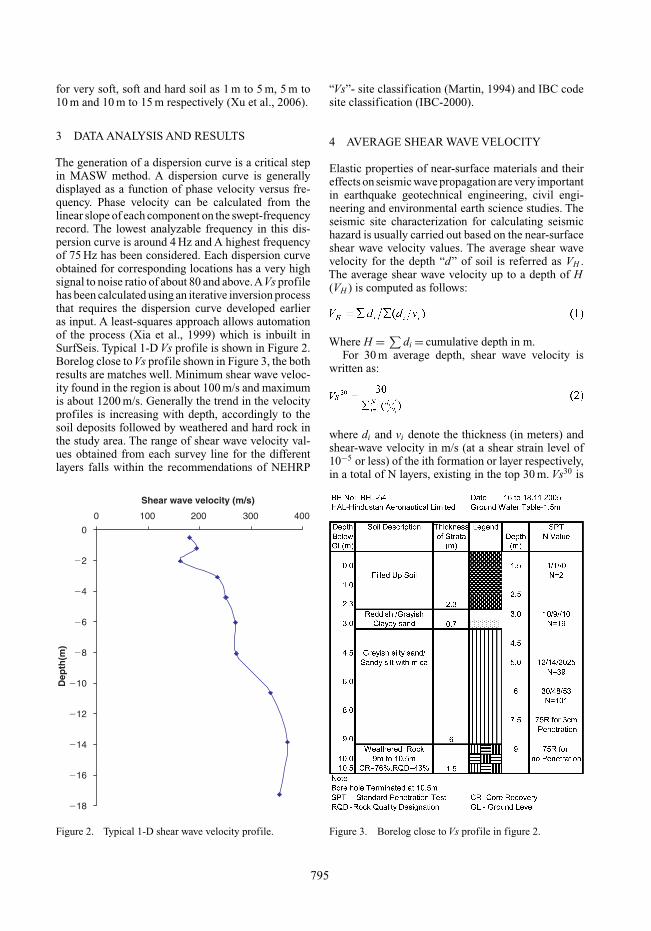
The generation of a dispersion curve is a critical stepin MASW method. A dispersion curve is generallydisplayed as a function of phase velocity versus fre-quency. Phase velocity can be calculated from thelinear slope of each component on the swept-frequencyrecord. The lowest analyzable frequency in this dis-persion curve is around 4 Hz and A highest frequencyof 75 Hz has been considered. Each dispersion curveobtained for corresponding locations has a very highsignal to noise ratio of about 80 and above.AVs profilehas been calculated using an iterative inversion processthat requires the dispersion curve developed earlieras input. A least-squares approach allows automationof the process (Xia et al., 1999) which is inbuilt inSurfSeis. Typical 1-D Vs profile is shown in Figure 2.Borelog close toVs profile shown in Figure 3, the bothresults are matches well. Minimum shear wave veloc-ity found in the region is about 100 m/s and maximumis about 1200 m/s. Generally the trend in the velocityprofiles is increasing with depth, accordingly to thesoil deposits followed by weathered and hard rock inthe study area. The range of shear wave velocity val-ues obtained from each survey line for the differentlayers falls within the recommendations of NEHRP
�18
�16
�14
�12
�10
�8
�6
�4
�2
0
0 100 200 300 400
Shear wave velocity (m/s)
Dep
th(m
)
Figure 2. Typical 1-D shear wave velocity profile.
“Vs”- site classification (Martin, 1994) and IBC codesite classification (IBC-2000).
4 AVERAGE SHEAR WAVE VELOCITY
Elastic properties of near-surface materials and theireffects on seismic wave propagation are very importantin earthquake geotechnical engineering, civil engi-neering and environmental earth science studies. Theseismic site characterization for calculating seismichazard is usually carried out based on the near-surfaceshear wave velocity values. The average shear wavevelocity for the depth “d” of soil is referred as VH .The average shear wave velocity up to a depth of H(VH ) is computed as follows:
Where H = ∑di = cumulative depth in m.
For 30 m average depth, shear wave velocity iswritten as:
where di and vi denote the thickness (in meters) andshear-wave velocity in m/s (at a shear strain level of10−5 or less) of the ith formation or layer respectively,in a total of N layers, existing in the top 30 m. Vs30 is
Figure 3. Borelog close to Vs profile in figure 2.
795
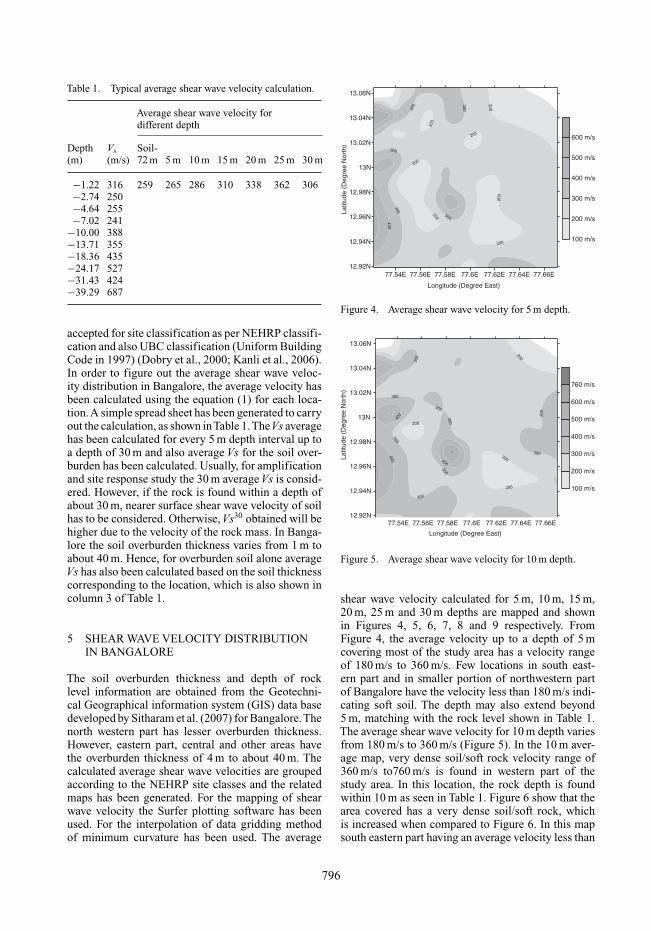
Table 1. Typical average shear wave velocity calculation.
Average shear wave velocity fordifferent depth
Depth Vs Soil-(m) (m/s) 72 m 5 m 10 m 15 m 20 m 25 m 30 m
−1.22 316 259 265 286 310 338 362 306−2.74 250−4.64 255−7.02 241
−10.00 388−13.71 355−18.36 435−24.17 527−31.43 424−39.29 687
accepted for site classification as per NEHRP classifi-cation and also UBC classification (Uniform BuildingCode in 1997) (Dobry et al., 2000; Kanli et al., 2006).In order to figure out the average shear wave veloc-ity distribution in Bangalore, the average velocity hasbeen calculated using the equation (1) for each loca-tion.A simple spread sheet has been generated to carryout the calculation, as shown inTable 1.TheVs averagehas been calculated for every 5 m depth interval up toa depth of 30 m and also average Vs for the soil over-burden has been calculated. Usually, for amplificationand site response study the 30 m average Vs is consid-ered. However, if the rock is found within a depth ofabout 30 m, nearer surface shear wave velocity of soilhas to be considered. Otherwise, Vs30 obtained will behigher due to the velocity of the rock mass. In Banga-lore the soil overburden thickness varies from 1 m toabout 40 m. Hence, for overburden soil alone averageVs has also been calculated based on the soil thicknesscorresponding to the location, which is also shown incolumn 3 of Table 1.
5 SHEAR WAVE VELOCITY DISTRIBUTIONIN BANGALORE
The soil overburden thickness and depth of rocklevel information are obtained from the Geotechni-cal Geographical information system (GIS) data basedeveloped by Sitharam et al. (2007) for Bangalore.Thenorth western part has lesser overburden thickness.However, eastern part, central and other areas havethe overburden thickness of 4 m to about 40 m. Thecalculated average shear wave velocities are groupedaccording to the NEHRP site classes and the relatedmaps has been generated. For the mapping of shearwave velocity the Surfer plotting software has beenused. For the interpolation of data gridding methodof minimum curvature has been used. The average
77.54E 77.56E 77.58E 77.6E 77.62E 77.64E 77.66E
Longitude (Degree East)
12.92N
12.94N
12.96N
12.98N
13N
13.02N
13.04N
13.06N
Latit
ude
(Deg
ree
Nor
th)
100 m/s
200 m/s
300 m/s
400 m/s
500 m/s
600 m/s
Figure 4. Average shear wave velocity for 5 m depth.
77.54E 77.56E 77.58E 77.6E 77.62E 77.64E 77.66E12.92N
12.94N
12.96N
12.98N
13N
13.02N
13.04N
13.06NLa
titud
e (D
egre
e N
orth
)
100 m/s
200 m/s
300 m/s
400 m/s
500 m/s
600 m/s
760 m/s
Longitude (Degree East)
Figure 5. Average shear wave velocity for 10 m depth.
shear wave velocity calculated for 5 m, 10 m, 15 m,20 m, 25 m and 30 m depths are mapped and shownin Figures 4, 5, 6, 7, 8 and 9 respectively. FromFigure 4, the average velocity up to a depth of 5 mcovering most of the study area has a velocity rangeof 180 m/s to 360 m/s. Few locations in south east-ern part and in smaller portion of northwestern partof Bangalore have the velocity less than 180 m/s indi-cating soft soil. The depth may also extend beyond5 m, matching with the rock level shown in Table 1.The average shear wave velocity for 10 m depth variesfrom 180 m/s to 360 m/s (Figure 5). In the 10 m aver-age map, very dense soil/soft rock velocity range of360 m/s to760 m/s is found in western part of thestudy area. In this location, the rock depth is foundwithin 10 m as seen in Table 1. Figure 6 show that thearea covered has a very dense soil/soft rock, whichis increased when compared to Figure 6. In this mapsouth eastern part having an average velocity less than
796
77.54E 77.56E 77.58E 77.6E 77.62E 77.64E 77.66E
Longitude (Degree East)
12.92N
12.94N
12.96N
12.98N
13N
13.02N
13.04N
13.06N
Latit
ude
(Deg
ree
Nor
th)
100 m/s
200 m/s
300 m/s
400 m/s
500 m/s
600 m/s
760 m/s
Figure 6. Average shear wave velocity for 15 m depth.
77.54E 77.56E 77.58E 77.6E 77.62E 77.64E 77.66E
Longitude (Degree East)
12.92N
12.94N
12.96N
12.98N
13N
13.02N
13.04N
13.06N
Latit
ude
(Deg
ree
Nor
th)
100 m/s
200 m/s
300 m/s
400 m/s
500 m/s
600 m/s
760 m/s
880 m/s
Figure 7. Average shear wave velocity for 20 m depth.
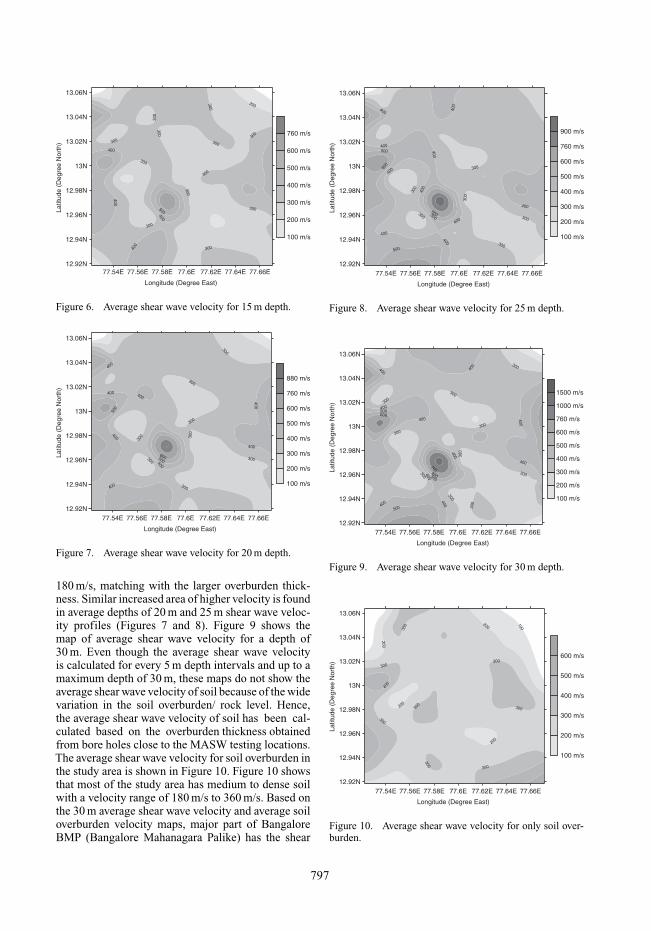
180 m/s, matching with the larger overburden thick-ness. Similar increased area of higher velocity is foundin average depths of 20 m and 25 m shear wave veloc-ity profiles (Figures 7 and 8). Figure 9 shows themap of average shear wave velocity for a depth of30 m. Even though the average shear wave velocityis calculated for every 5 m depth intervals and up to amaximum depth of 30 m, these maps do not show theaverage shear wave velocity of soil because of the widevariation in the soil overburden/ rock level. Hence,the average shear wave velocity of soil has been cal-culated based on the overburden thickness obtainedfrom bore holes close to the MASW testing locations.The average shear wave velocity for soil overburden inthe study area is shown in Figure 10. Figure 10 showsthat most of the study area has medium to dense soilwith a velocity range of 180 m/s to 360 m/s. Based onthe 30 m average shear wave velocity and average soiloverburden velocity maps, major part of BangaloreBMP (Bangalore Mahanagara Palike) has the shear
77.54E 77.56E 77.58E 77.6E 77.62E 77.64E 77.66E
Longitude (Degree East)
12.92N
12.94N
12.96N
12.98N
13N
13.02N
13.04N
13.06N
Latit
ude
(Deg
ree
Nor
th)
100 m/s
200 m/s
300 m/s
400 m/s
500 m/s
600 m/s
760 m/s
900 m/s
Figure 8. Average shear wave velocity for 25 m depth.
77.54E 77.56E 77.58E 77.6E 77.62E 77.64E 77.66E
Longitude (Degree East)
12.92N
12.94N
12.96N
12.98N
13N
13.02N
13.04N
13.06N
Latit
ude
(Deg
ree
Nor
th)
100 m/s
200 m/s
300 m/s
400 m/s
500 m/s
600 m/s
760 m/s
1000 m/s
1500 m/s
Figure 9. Average shear wave velocity for 30 m depth.
77.54E 77.56E 77.58E 77.6E 77.62E 77.64E 77.66E
Longitude (Degree East)
12.92N
12.94N
12.96N
12.98N
13N
13.02N
13.04N
13.06N
Latit
ude
(Deg
ree
Nor
th)
100 m/s
200 m/s
300 m/s
400 m/s
500 m/s
600 m/s
Figure 10. Average shear wave velocity for only soil over-burden.
797

wave velocity of 180 m/s to 360 m/s. Hence BMP areacan be classified as “Site class D” as per NEHRP andIBC recommendation.
6 CONCLUSIONS
In this study MASW one-dimensional survey at 58locations and two-dimensional surveys at 20 locationshave been carried out in an area of 220 km2 in Banga-lore city. The shear wave velocity profiles (Vs versusdepth), spatial variability of shear wave velocity (Vsversus depth and length) and ground layer anomalieshave been presented. The average shear wave veloc-ity of study area has been estimated for 5 m, 10 m,15 m, 20 m, 25 m and 30 m depth and presented inthis paper. Also average shear wave velocity for thesoil depth, which is estimated based on overburdenthickness, is presented. Site soil classification has beencarried out by considering the NEHRP and IBC clas-sification. Based on the estimated V 30
s , BMP area canbe classified as “site class D” as per NEHRP and IBCclassification chart.
ACKNOWLEDGEMENT
This work is carried out as part of the project titled“Seismic Microzonation of Grater Bangalore region”.Authors thank Seismology division, Department ofScience and Technology, Government of India forfunding the project. (Ref no. DST/23(315)/SU/2002dated October 2003).
REFERENCES
BIS: 2002. IS 1893-2002. Indian Standard Criteria for Earth-quake Resistant Design of Structures. Part 1- GeneralProvisions and Buildings, Bureau of Indian Standards,New Delhi.
Dobry, R., Borcherdt, R.D., Crouse, C.B., Idriss, I.M.,Joyner, W.B., Martin, G.R., Power, M.S., Rinne, E.E. &Seed, R.B. 2000. New site coefficients and site clas-sification system used in recent building seismic codeprovisions. Earthquake Spectra 16: 41–67.
Ganesha Raj, K. & Nijagunappa, R. 2004. Major Linea-ments of Karnataka State and their Relation to Seismicity.Remote Sensing Based Analysis, J. Geol. Soc. India. 63:430–439.
Idriss, I.M. & Boulanger, R.W. 2004. Semiempirical proce-dures for evaluating liquefaction potential during earth-quakes. Proc., 11th International Conference on SoilDynamics and Earthquake Engineering, and 3rd Inter-national Conference on Earthquake Geotechnical Engi-neering, D. Doolin et al., eds., Stallion Press 1: 32–56.
Ivanov, J., Park, C.B., Miller, R.D. & Xia, J. 2005. Analyzingand filtering surface-wave energy by muting shot gathers.Journal of Environmental and Engineering Geophysics10(3): 307–321.
Kanli,A.I.,Tildy, P., Pronay, Z., Pinar,A. & Hemann, L. 2006.Vs30 mapping and soil classification for seismic site effectevaluation in Dinar region. Geophysics J. Int. SW Turkey.165: 223–235.
Martin. G.R., (ed.), 1994. Workshop on Site Response dur-ing Earthquakes and Seismic Code Provisions. Proc. ofthe NCEER/SEAOC/BSSC. University of California at LosAngeles.
Miller, R.D., Xia, J., Park, C.B. & Ivanov, J. 1999. Multichan-nel analysis of surface waves to map bedrock.The LeadingEdge 18(12): 1392–1396.
Park, C.B., Miller, R.D. & Xia, J. 1999. Multi-channelanalysis of surface waves. Geophysics 64(3): 800–808.
Park, C.B., Miller, R.D., Xia, J., Ivanov, J., Sonnichsen, G.V.,Hunter, J.A., Good, R.L., Burns, R.A. & Christian, H.2005b. Underwater MASW to evaluate stiffness of water-bottom sediments. Leading Edge 24: 724–728.
Park, C.B., Miller. R.D., Xia. J. & Ivanov. J. 2005a. Multi-channel Seismic Surface-Wave Methods for GeotechnicalApplications:http: / /www.kgs. ku.edu/Geophysics2/Pubs/Pubs PAR-00-03.pdf.
Ryden, N., Park, C.B., Ulriksen, P. & Miller, R.D. 2004. Mul-timodal approach to seismic pavement testing. Journalof Geotechnical and Geoenvironmental Engineering 130:636–645.
Sitharam, T.G., Anbazhagan, P. & Ganesha Raj, K. 2006.Use of remote sensing and seismotectonic parameters forseismic hazard analysis of Bangalore. Nat. Hazards EarthSyst. Sci. 6: 927–939.
Sitharam,T.G.,Anbazhagan, P., Mahesh, G.U., Bharathi, K. &Nischala Reddy, P. 2005. Seismic Hazard Studies usingGeotechnical Borehole Data and GIS. Symposium onSeismic Hazard Analysis and Microzonation September23–24. Roorkee.
Sitharam,T.G. &Anbazhagan, P. 2007. Seismic HazardAnal-ysis for Bangalore Region. Journal of Natural Hazards 40:261–278.
Sitharam, T.G., Anbazhagan, P. & Mahesh, G.U. 2007. 3-DSubsurface modelling and preliminary liquefaction haz-ard Mapping of Bangalore city using SPT data and GIS.Indian Geotechnical Journal (in print).
Xia, J., Miller, R.D. & Park, C.B. 1999. Estimation of near-surface shear-wave velocity by inversion of Rayleighwave. Geophysics 64(3): 691–700.
Xia, J., Miller, R.D., Park, C.B., Hunter, J.A. & Harris, J.B.2000. Comparing shear-wave velocity profiles fromMASW with borehole measurements in unconsolidatedsediments, Fraser River Delta, B.C. Journal of Environ-mental and Engineering Geophysics. Canada. 5(No. 3):1–13.
Xu, Y., Xia, J. & Miller, R.D. 2006. Quantitative estima-tion of minimum offset for multichannel surface-wavesurvey with actively exciting source. Journal of AppliedGeophysics 59(No. 2):117–125.
Zhang, S.X., Chan, L.S. & Xia, J. 2004. The selection of fieldacquisition parameters for dispersion images from multi-channel surface wave data. Pure and Applied Geophysics161:185–201.
798
Related Documents