481 Geotechnical and Geophysical Site Characterization 4 – Coutinho & Mayne (eds) © 2013 Taylor & Francis Group, London, ISBN 978-0-415-62136-6 Site characterization by Seismic Dilatometer (SDMT) in the area of L’Aquila following the April 6, 2009 earthquake S. Amoroso, P. Monaco, F. Totani & G. Totani University of L’Aquila, Italy D. Marchetti Marchetti, Roma, Italy ABSTRACT: This paper comments on the results obtained by a large number of Seismic Dilatometer Tests (SDMT) executed in the area of L’Aquila (Italy) following the April 6, 2009 earthquake. SDMT soundings were executed by the normal penetration procedure only in a limited number of sites, mostly in silt. At the majority of the sites, in coarse-grained non-penetrable soils, V S measurements by SDMT— but not the other DMT parameters—were obtained in backfilled boreholes, using the technique briefly described in the paper. The test results illustrated in the paper include: (a) SDMT results obtained by the normal penetration procedure, (b) V S -only profiles obtained by the backfilling procedure, (c) comparisons of V S profiles obtained by SDMT and by other techniques (Down-Hole, Cross-Hole, surface waves tests), and (d) comparisons of profiles of V S measured by SDMT and estimated from mechanical DMT data. 1 INTRODUCTION The April 6, 2009 L’Aquila (Italy) earthquake (M W = 6.3) caused 309 victims, about 1,600 injured, 40,000 homeless and huge economic losses. The earthquake caused heavy damages in the city of L’Aquila (MCS Intensity I = VIII-IX) and in several nearby villages (maximum MCS Intensity I = IX-X at Onna and Castelnuovo). Subsequently the area of L’Aquila was exten- sively investigated by a variety of geotechnical and geophysical testing techniques, involving several working groups (see e.g. Monaco et al. 2012). This paper presents a review of results obtained by seismic dilatometer tests executed in the area of L’Aquila in the period 2009–2011. Some of these tests were carried out in the first months following the April 6, 2009 earthquake, as part of investiga- tions planned for the geotechnical characterization of sites selected for the construction of new tem- porary houses for the homeless people (C.A.S.E. Project). SDMT results were also used, among other soil data, in the seismic microzonation project of the area of L’Aquila promoted by the Italian Department of Civil Protection (MS–AQ Working Group 2010). In addition, several seismic dilatometer tests were executed, both in the historic city center and in the suburban area of L’Aquila, as part of investigations planned to obtain input data for site seismic response analyses for design of restoration / retrofitting of important public build- ings, severely damaged by the earthquake. 2 SEISMIC DILATOMETER TEST (SDMT) 2.1 SDMT by the standard penetration procedure The seismic dilatometer (SDMT) is the combination of the mechanical flat dilatometer (DMT), intro- duced by Marchetti (1980), with an add-on seismic module for measuring the shear wave velocity V S . First introduced by Hepton (1988), the SDMT was subsequently improved at Georgia Tech, Atlanta, USA (Martin & Mayne 1997, 1998; Mayne et al. 1999). A new SDMT system (Fig. 1) has been recently developed in Italy (Marchetti et al. 2008). The seismic module (Fig. 1a) is a cylindrical element placed above the DMT blade, equipped with two receivers spaced 0.50 m. The shear wave source, located at ground surface, is a pendulum hammer (≈ 10 kg) which hits horizontally a steel rectangular plate pressed vertically against the soil (by the weight of the truck) and oriented with its long axis parallel to the axis of the receivers, so that they can offer the highest sensitivity to the generated shear wave. When a shear wave is generated at the surface (Fig. 1b) it reaches first the upper receiver, then, after a delay, the lower receiver. The seismograms acquired by the two receivers, amplified and digitized at depth, are transmitted to a PC at the surface, which deter- mines the delay. V S is obtained as the ratio between the difference in distance between the source and the two receivers (S 2 − S 1 ) and the delay of the arrival of the impulse from the first to the second receiver (Δt).

Welcome message from author
This document is posted to help you gain knowledge. Please leave a comment to let me know what you think about it! Share it to your friends and learn new things together.
Transcript
481
Geotechnical and Geophysical Site Characterization 4 – Coutinho & Mayne (eds)© 2013 Taylor & Francis Group, London, ISBN 978-0-415-62136-6
Site characterization by Seismic Dilatometer (SDMT) in the area of L’Aquila following the April 6, 2009 earthquake
S. Amoroso, P. Monaco, F. Totani & G. TotaniUniversity of L’Aquila, Italy
D. MarchettiMarchetti, Roma, Italy
ABSTRACT: This paper comments on the results obtained by a large number of Seismic Dilatometer Tests (SDMT) executed in the area of L’Aquila (Italy) following the April 6, 2009 earthquake. SDMT soundings were executed by the normal penetration procedure only in a limited number of sites, mostly in silt. At the majority of the sites, in coarse-grained non-penetrable soils, VS measurements by SDMT—but not the other DMT parameters—were obtained in backfilled boreholes, using the technique briefly described in the paper. The test results illustrated in the paper include: (a) SDMT results obtained by the normal penetration procedure, (b) VS -only profiles obtained by the backfilling procedure, (c) comparisons of VS profiles obtained by SDMT and by other techniques (Down-Hole, Cross-Hole, surface waves tests), and (d) comparisons of profiles of VS measured by SDMT and estimated from mechanical DMT data.
1 INTRODUCTION
The April 6, 2009 L’Aquila (Italy) earthquake (MW = 6.3) caused 309 victims, about 1,600 injured, 40,000 homeless and huge economic losses. The earthquake caused heavy damages in the city of L’Aquila (MCS Intensity I = VIII-IX) and in several nearby villages (maximum MCS Intensity I = IX-X at Onna and Castelnuovo).
Subsequently the area of L’Aquila was exten-sively investigated by a variety of geotechnical and geophysical testing techniques, involving several working groups (see e.g. Monaco et al. 2012).
This paper presents a review of results obtained by seismic dilatometer tests executed in the area of L’Aquila in the period 2009–2011. Some of these tests were carried out in the first months following the April 6, 2009 earthquake, as part of investiga-tions planned for the geotechnical characterization of sites selected for the construction of new tem-porary houses for the homeless people (C.A.S.E. Project). SDMT results were also used, among other soil data, in the seismic microzonation project of the area of L’Aquila promoted by the Italian Department of Civil Protection (MS–AQ Working Group 2010). In addition, several seismic dilatometer tests were executed, both in the historic city center and in the suburban area of L’Aquila, as part of investigations planned to obtain input data for site seismic response analyses for design of restoration / retrofitting of important public build-ings, severely damaged by the earthquake.
2 SEISMIC DILATOMETER TEST (SDMT)
2.1 SDMT by the standard penetration procedure
The seismic dilatometer (SDMT) is the combination of the mechanical flat dilatometer (DMT), intro-duced by Marchetti (1980), with an add-on seismic module for measuring the shear wave velocity VS. First introduced by Hepton (1988), the SDMT was subsequently improved at Georgia Tech, Atlanta, USA (Martin & Mayne 1997, 1998; Mayne et al. 1999). A new SDMT system (Fig. 1) has been recently developed in Italy (Marchetti et al. 2008).
The seismic module (Fig. 1a) is a cylindrical element placed above the DMT blade, equipped with two receivers spaced 0.50 m. The shear wave source, located at ground surface, is a pendulum hammer (≈ 10 kg) which hits horizontally a steel rectangular plate pressed vertically against the soil (by the weight of the truck) and oriented with its long axis parallel to the axis of the receivers, so that they can offer the highest sensitivity to the generated shear wave. When a shear wave is generated at the surface (Fig. 1b) it reaches first the upper receiver, then, after a delay, the lower receiver. The seismograms acquired by the two receivers, amplified and digitized at depth, are transmitted to a PC at the surface, which deter-mines the delay. VS is obtained as the ratio between the difference in distance between the source and the two receivers (S2 − S1) and the delay of the arrival of the impulse from the first to the second receiver (Δt).
482
VS measurements are typically taken every 0.50 m of depth (while the mechanical DMT readings are taken every 0.20 m).
The true-interval test configuration with two receivers avoids possible inaccuracy in the deter-mination of the “zero time” at the hammer impact, sometimes observed in the pseudo-interval one-receiver configuration. Moreover, the couple of seismograms recorded by the two receivers at a given test depth corresponds to the same hammer blow and not to different blows in sequence, which are not necessarily identical. Hence the repeatabil-ity of VS measurements is considerably improved (observed VS repeatability ≈1%, i.e. a few m/s).
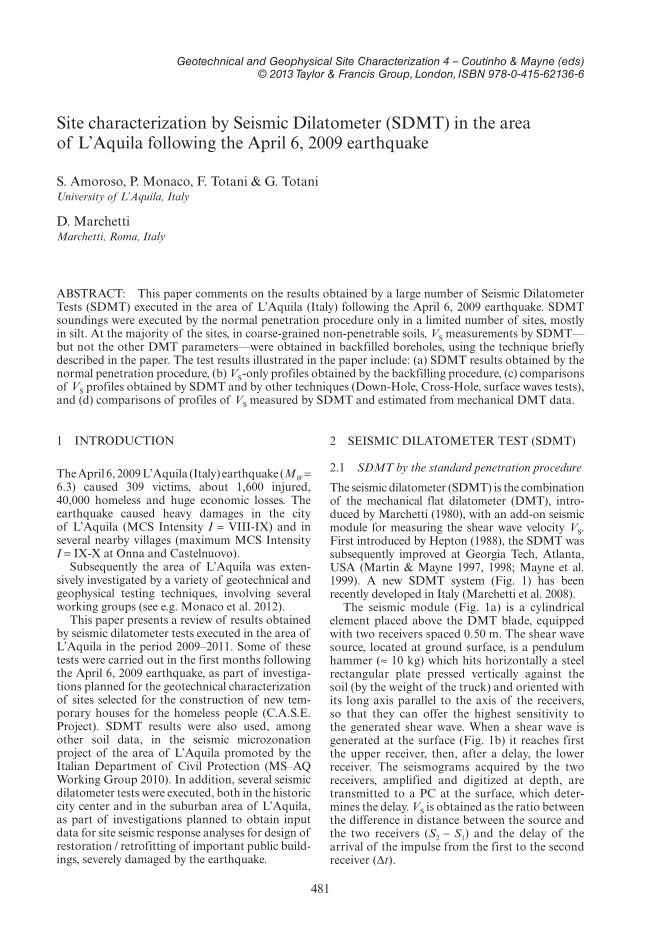
The determination of the delay from SDMT seismograms, normally obtained using a cross-correlation algorithm, is generally well condi-tioned, being based on the waveform analysis of the two seismograms rather than relying on the first arrival time or specific single points in the seis-mogram. An example of seismograms obtained by SDMT—as recorded and re-phased according to the calculated delay—is shown in Figure 2.
Validations of VS measurements by SDMT com-pared to VS measured by other in situ techniques at various research sites are reported by Marchetti et al. (2008). Besides VS, the seismic dilatometer provides the parameters obtained from the usual flat dilatom-eter interpretation (Marchetti 1980, TC16 2001).
2.2 SDMT by the backfilling procedure in non-penetrable soils
The SDMT test procedure proves to be an effec-tive, quick and cost-saving alternative to conven-tional Down-Hole tests in soft to firm soils (no need of holes with pipes to be grouted, operations requiring a few days pause for the cement to set up before testing). A disadvantage of the SDMT
is the impossibility of penetrating very hard soils. However a procedure for obtaining SDMT VS profiles—but not the other DMT parameters—in non-penetrable soils (e.g. in gravel, or even in rock) has been devised by Totani et al. (2009). The pro-cedure is the following:
1. A borehole is drilled to the required test depth.2. The borehole is backfilled with sand.3. The SDMT is inserted and advanced into the
backfilled borehole in the usual way (e.g. by use of a penetrometer rig) and VS measurements are taken every 0.50 m of depth. No DMT measurements—meaningless in the backfill soil—are taken in this case.
The possibility of such measurement descends from the fact that the path of the shear wave from the surface to the upper and lower receiver includes a short path in the backfill of very similar length for both receivers. Comparative tests at various sites where both the usual penetration procedure and the backfilling procedure were adoptable, reported by Totani et al. (2009), indicate that the values of VS obtained in a backfilled borehole are essentially coincident with the VS obtained by pen-etrating the “virgin” soil.
3 SDMT RESULTS IN THE AREA OF L’AQUILA
3.1 SDMT test sites in the area of L’Aquila
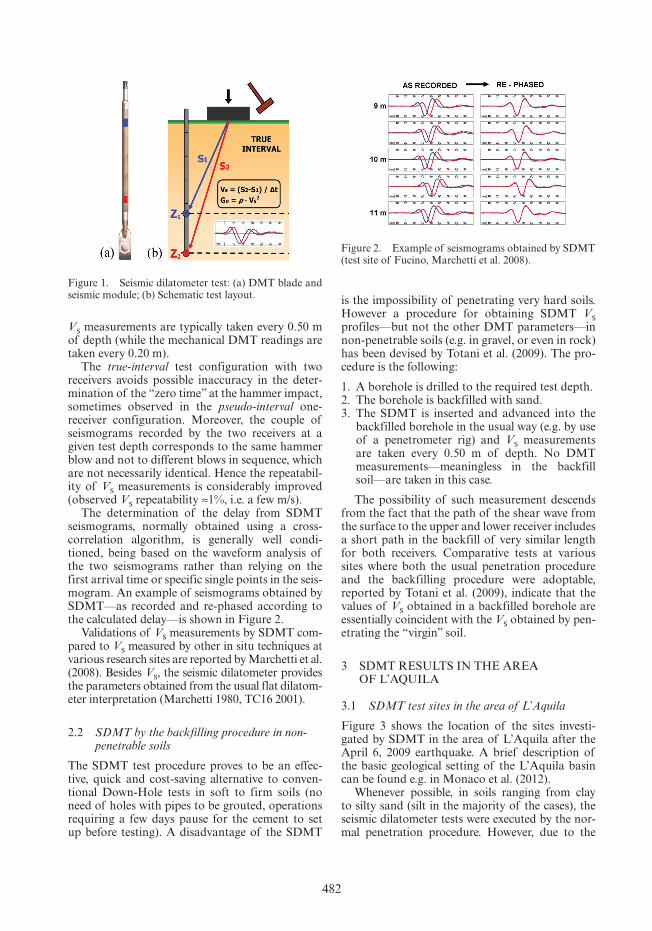
Figure 3 shows the location of the sites investi-gated by SDMT in the area of L’Aquila after the April 6, 2009 earthquake. A brief description of the basic geological setting of the L’Aquila basin can be found e.g. in Monaco et al. (2012).
Whenever possible, in soils ranging from clay to silty sand (silt in the majority of the cases), the seismic dilatometer tests were executed by the nor-mal penetration procedure. However, due to the
Figure 1. Seismic dilatometer test: (a) DMT blade and seismic module; (b) Schematic test layout.
Figure 2. Example of seismograms obtained by SDMT (test site of Fucino, Marchetti et al. 2008).
483
characteristics of the soils commonly encountered in this area (mostly coarse-grained, non-penetra-ble), SDMT measurements (VS -only) were gener-ally executed in backfilled boreholes, according to the Totani et al. (2009) procedure previously described.
3.2 SDMT results by the penetration procedure
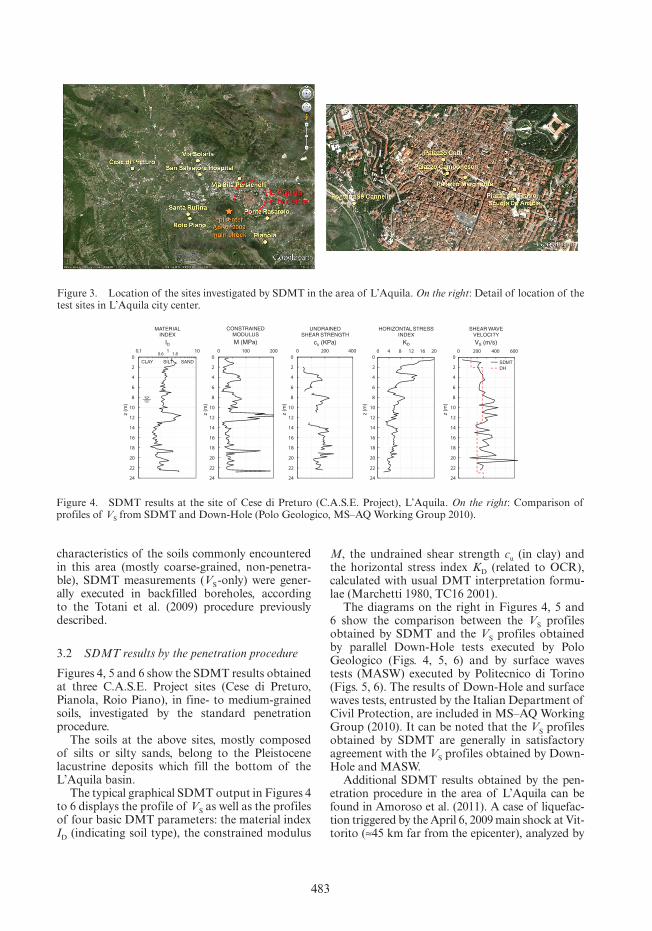
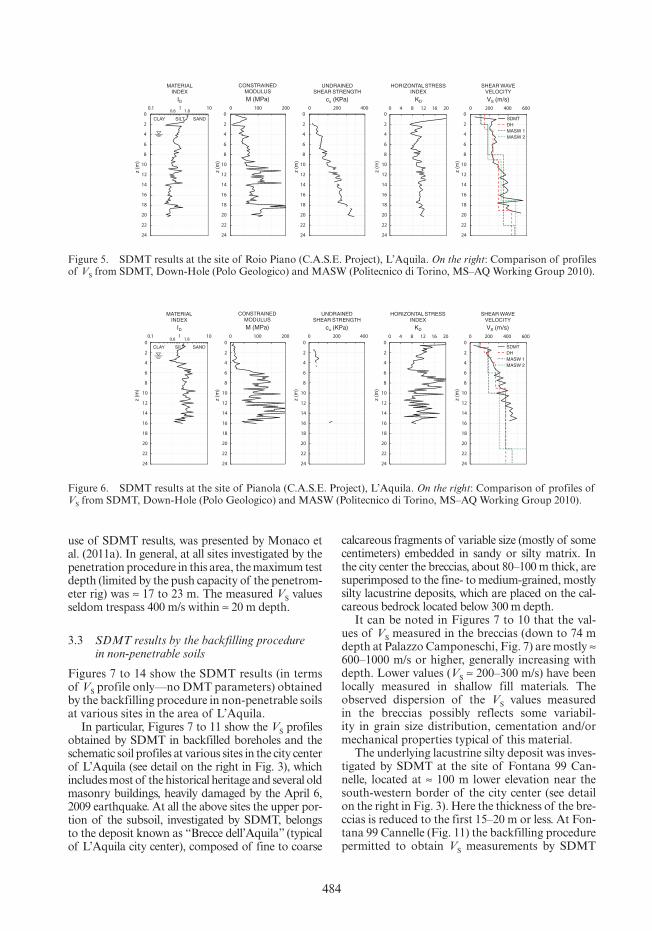
Figures 4, 5 and 6 show the SDMT results obtained at three C.A.S.E. Project sites (Cese di Preturo, Pianola, Roio Piano), in fine- to medium-grained soils, investigated by the standard penetration procedure.
The soils at the above sites, mostly composed of silts or silty sands, belong to the Pleistocene lacustrine deposits which fill the bottom of the L’Aquila basin.
The typical graphical SDMT output in Figures 4 to 6 displays the profile of VS as well as the profiles of four basic DMT parameters: the material index ID (indicating soil type), the constrained modulus
M, the undrained shear strength cu (in clay) and the horizontal stress index KD (related to OCR), calculated with usual DMT interpretation formu-lae (Marchetti 1980, TC16 2001).
The diagrams on the right in Figures 4, 5 and 6 show the comparison between the VS profiles obtained by SDMT and the VS profiles obtained by parallel Down-Hole tests executed by Polo Geologico (Figs. 4, 5, 6) and by surface waves tests (MASW) executed by Politecnico di Torino (Figs. 5, 6). The results of Down-Hole and surface waves tests, entrusted by the Italian Department of Civil Protection, are included in MS–AQ Working Group (2010). It can be noted that the VS profiles obtained by SDMT are generally in satisfactory agreement with the VS profiles obtained by Down-Hole and MASW.
Additional SDMT results obtained by the pen-etration procedure in the area of L’Aquila can be found in Amoroso et al. (2011). A case of liquefac-tion triggered by the April 6, 2009 main shock at Vit-torito (≈45 km far from the epicenter), analyzed by
Figure 3. Location of the sites investigated by SDMT in the area of L’Aquila. On the right: Detail of location of the test sites in L’Aquila city center.
0.6 1.8
CLAY SILT SAND0
2
4
6
8
10
12
14
16
18
20
22
24
0
2
4
6
8
10
12
14
16
18
20
22
24
0
2
4
6
8
10
12
14
16
18
20
22
24
0
2
4
6
8
10
12
14
16
18
20
22
24
0
2
4
6
8
10
12
14
16
18
20
22
24
0.1 1 10
MATERIALINDEX
ID0 100 200
z (m
)
z (m
)
CONSTRAINED MODULUS
M (MPa)0 200 400
z (m
)
UNDRAINEDSHEAR STRENGTH
cu (KPa)0 4 8 12 16 20
z (m
)
HORIZONTAL STRESS INDEX
KD
0 200 400 600
z (m
)
SHEAR WAVEVELOCITY
VS (m/s)
SDMTDH
Figure 4. SDMT results at the site of Cese di Preturo (C.A.S.E. Project), L’Aquila. On the right: Comparison of profiles of VS from SDMT and Down-Hole (Polo Geologico, MS–AQ Working Group 2010).
484
use of SDMT results, was presented by Monaco et al. (2011a). In general, at all sites investigated by the penetration procedure in this area, the maximum test depth (limited by the push capacity of the penetrom-eter rig) was ≈ 17 to 23 m. The measured VS values seldom trespass 400 m/s within ≈ 20 m depth.
3.3 SDMT results by the backfilling procedure in non-penetrable soils
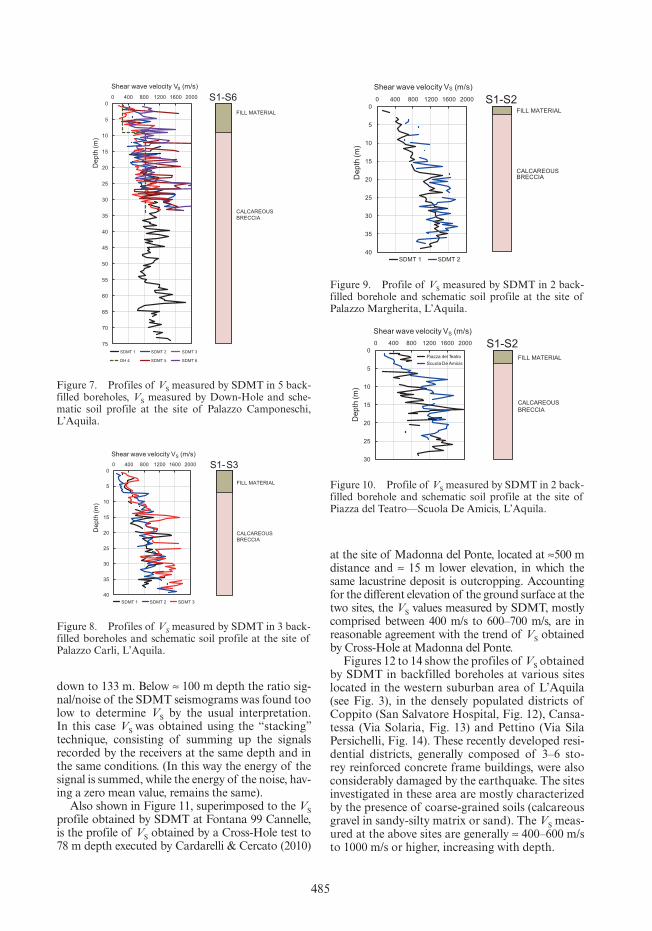
Figures 7 to 14 show the SDMT results (in terms of VS profile only—no DMT parameters) obtained by the backfilling procedure in non-penetrable soils at various sites in the area of L’Aquila.
In particular, Figures 7 to 11 show the VS profiles obtained by SDMT in backfilled boreholes and the schematic soil profiles at various sites in the city center of L’Aquila (see detail on the right in Fig. 3), which includes most of the historical heritage and several old masonry buildings, heavily damaged by the April 6, 2009 earthquake. At all the above sites the upper por-tion of the subsoil, investigated by SDMT, belongs to the deposit known as “Brecce dell’Aquila” (typical of L’Aquila city center), composed of fine to coarse
0.6 1.80.1 1 10 0 100 200 0 200 400 0 4 8 12 16 20 0 200 400 600
CLAY SILT SAND
z (m
)
MATERIALINDEX
ID
z (m
)
CONSTRAINED MODULUS
M (MPa)
z (m
)
UNDRAINEDSHEAR STRENGTH
cu (KPa)
z (m
)
HORIZONTAL STRESS INDEX
KD
z (m
)
SHEAR WAVEVELOCITY
VS (m/s)
SDMTDHMASW 1MASW 2
0
2
4
6
8
10
12
14
16
18
20
22
24
0
2
4
6
8
10
12
14
16
18
20
22
24
0
2
4
6
8
10
12
14
16
18
20
22
24
0
2
4
6
8
10
12
14
16
18
20
22
24
0
2
4
6
8
10
12
14
16
18
20
22
24
Figure 5. SDMT results at the site of Roio Piano (C.A.S.E. Project), L’Aquila. On the right: Comparison of profiles of VS from SDMT, Down-Hole (Polo Geologico) and MASW (Politecnico di Torino, MS–AQ Working Group 2010).
0.6 1.80.1 1 10 0 100 200 0 200 400 0 4 8 12 16 20 0 200 400 600
CLAY SILT SAND
z (m
)
MATERIALINDEX
ID
z (m
)
CONSTRAINED MODULUS
M (MPa)
z (m
)
UNDRAINEDSHEAR STRENGTH
cu (KPa)
z (m
)
HORIZONTAL STRESS INDEX
KD
z (m
)
SHEAR WAVEVELOCITY
VS (m/s)
SDMTDHMASW 1MASW 2
0
2
4
6
8
10
12
14
16
18
20
22
24
0
2
4
6
8
10
12
14
16
18
20
22
24
0
2
4
6
8
10
12
14
16
18
20
22
24
0
2
4
6
8
10
12
14
16
18
20
22
24
0
2
4
6
8
10
12
14
16
18
20
22
24
Figure 6. SDMT results at the site of Pianola (C.A.S.E. Project), L’Aquila. On the right: Comparison of profiles of VS from SDMT, Down-Hole (Polo Geologico) and MASW (Politecnico di Torino, MS–AQ Working Group 2010).
calcareous fragments of variable size (mostly of some centimeters) embedded in sandy or silty matrix. In the city center the breccias, about 80–100 m thick, are superimposed to the fine- to medium-grained, mostly silty lacustrine deposits, which are placed on the cal-careous bedrock located below 300 m depth.
It can be noted in Figures 7 to 10 that the val-ues of VS measured in the breccias (down to 74 m depth at Palazzo Camponeschi, Fig. 7) are mostly ≈ 600–1000 m/s or higher, generally increasing with depth. Lower values (VS ≈ 200–300 m/s) have been locally measured in shallow fill materials. The observed dispersion of the VS values measured in the breccias possibly reflects some variabil-ity in grain size distribution, cementation and/or mechanical properties typical of this material.
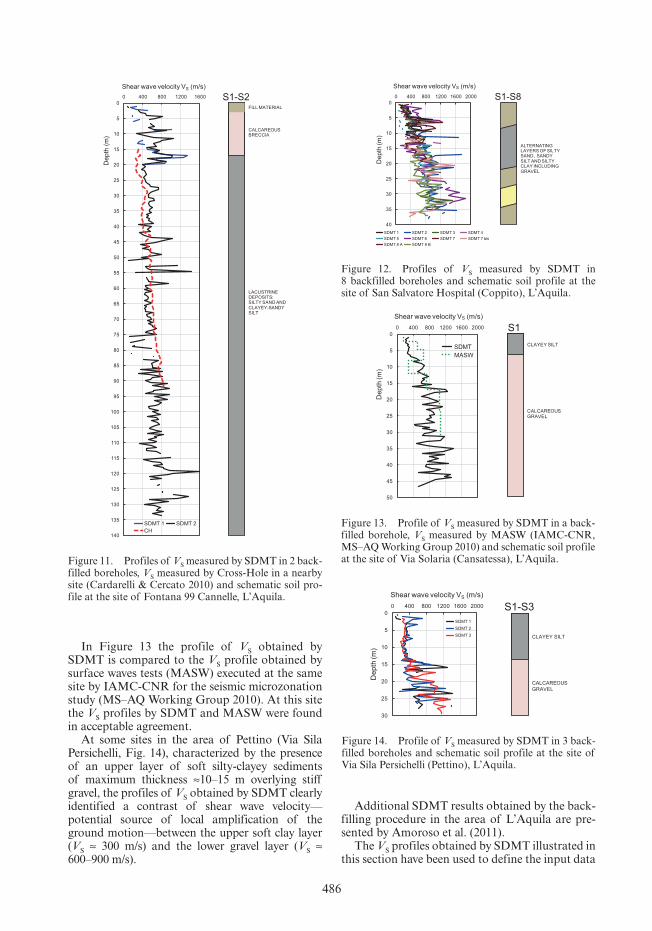
The underlying lacustrine silty deposit was inves-tigated by SDMT at the site of Fontana 99 Can-nelle, located at ≈ 100 m lower elevation near the south-western border of the city center (see detail on the right in Fig. 3). Here the thickness of the bre-ccias is reduced to the first 15–20 m or less. At Fon-tana 99 Cannelle (Fig. 11) the backfilling procedure permitted to obtain VS measurements by SDMT
485
0
5
10
15
20
25
30
35
40
45
50
55
60
65
70
75
0 400 800 1200 1600 2000D
epth
(m)
Shear wave velocity VS (m/s)
SDMT 1 SDMT 2 SDMT 3
DH 4 SDMT 5 SDMT 6
S1-S6FILL MATERIAL
CALCAREOUSBRECCIA
Figure 7. Profiles of VS measured by SDMT in 5 back-filled boreholes, VS measured by Down-Hole and sche-matic soil profile at the site of Palazzo Camponeschi, L’Aquila.
0
5
10
15
20
25
30
35
40
0 400 800 1200 1600 2000
Dep
th (m
)
Shear wave velocity VS (m/s)
SDMT 1 SDMT 2 SDMT 3
S1-S3
FILL MATERIAL
CALCAREOUSBRECCIA
Figure 8. Profiles of VS measured by SDMT in 3 back-filled boreholes and schematic soil profile at the site of Palazzo Carli, L’Aquila.
0
5
10
15
20
25
30
35
40
0 400 800 1200 1600 2000
Dep
th (m
)
Shear wave velocity VS (m/s)
SDMT 1 SDMT 2
S1-S2
CALCAREOUSBRECCIA
FILL MATERIAL
Figure 9. Profile of VS measured by SDMT in 2 back-filled borehole and schematic soil profile at the site of Palazzo Margherita, L’Aquila.
0
5
10
15
20
25
30
0 400 800 1200 1600 2000
Dep
th (m
)
Shear wave velocity VS (m/s)
Piazza del TeatroScuola De Amicis
S1-S2
CALCAREOUSBRECCIA
FILL MATERIAL
Figure 10. Profile of VS measured by SDMT in 2 back-filled borehole and schematic soil profile at the site of Piazza del Teatro—Scuola De Amicis, L’Aquila.
down to 133 m. Below ≈ 100 m depth the ratio sig-nal/noise of the SDMT seismograms was found too low to determine VS by the usual interpretation. In this case VS was obtained using the “stacking” technique, consisting of summing up the signals recorded by the receivers at the same depth and in the same conditions. (In this way the energy of the signal is summed, while the energy of the noise, hav-ing a zero mean value, remains the same).
Also shown in Figure 11, superimposed to the VS profile obtained by SDMT at Fontana 99 Cannelle, is the profile of VS obtained by a Cross-Hole test to 78 m depth executed by Cardarelli & Cercato (2010)
at the site of Madonna del Ponte, located at ≈500 m distance and ≈ 15 m lower elevation, in which the same lacustrine deposit is outcropping. Accounting for the different elevation of the ground surface at the two sites, the VS values measured by SDMT, mostly comprised between 400 m/s to 600–700 m/s, are in reasonable agreement with the trend of VS obtained by Cross-Hole at Madonna del Ponte.
Figures 12 to 14 show the profiles of VS obtained by SDMT in backfilled boreholes at various sites located in the western suburban area of L’Aquila (see Fig. 3), in the densely populated districts of Coppito (San Salvatore Hospital, Fig. 12), Cansa-tessa (Via Solaria, Fig. 13) and Pettino (Via Sila Persichelli, Fig. 14). These recently developed resi-dential districts, generally composed of 3–6 sto-rey reinforced concrete frame buildings, were also considerably damaged by the earthquake. The sites investigated in these area are mostly characterized by the presence of coarse-grained soils (calcareous gravel in sandy-silty matrix or sand). The VS meas-ured at the above sites are generally ≈ 400–600 m/s to 1000 m/s or higher, increasing with depth.
486
In Figure 13 the profile of VS obtained by SDMT is compared to the VS profile obtained by surface waves tests (MASW) executed at the same site by IAMC-CNR for the seismic microzonation study (MS–AQ Working Group 2010). At this site the VS profiles by SDMT and MASW were found in acceptable agreement.
At some sites in the area of Pettino (Via Sila Persichelli, Fig. 14), characterized by the presence of an upper layer of soft silty-clayey sediments of maximum thickness ≈10–15 m overlying stiff gravel, the profiles of VS obtained by SDMT clearly identified a contrast of shear wave velocity—potential source of local amplification of the ground motion—between the upper soft clay layer (VS ≈ 300 m/s) and the lower gravel layer (VS ≈ 600–900 m/s).
Additional SDMT results obtained by the back-filling procedure in the area of L’Aquila are pre-sented by Amoroso et al. (2011).
The VS profiles obtained by SDMT illustrated in this section have been used to define the input data
0
5
10
15
20
25
30
35
40
45
50
55
60
65
70
75
80
85
90
95
100
105
110
115
120
125
130
135
140
0 400 800 1200 1600
Dep
th (m
)
Shear wave velocity VS (m/s)
SDMT 1 SDMT 2CH
S1-S2 FILL MATERIAL
LACUSTRINE DEPOSITS:SILTY SAND AND CLAYEY-SANDY SILT
CALCAREOUSBRECCIA
Figure 11. Profiles of VS measured by SDMT in 2 back-filled boreholes, VS measured by Cross-Hole in a nearby site (Cardarelli & Cercato 2010) and schematic soil pro-file at the site of Fontana 99 Cannelle, L’Aquila.
0
5
10
15
20
25
30
35
40
0 400 800 1200 1600 2000
Dep
th (m
)
Shear wave velocity VS (m/s)
SDMT 1 SDMT 2 SDMT 3 SDMT 4SDMT 5 SDMT 6 SDMT 7 SDMT 7 bisSDMT 8 A SDMT 8 B
S1-S8
ALTERNATING LAYERS OF SILTY SAND, SANDY SILT AND SILTY CLAY INCLUDING GRAVEL
Figure 12. Profiles of VS measured by SDMT in 8 backfilled boreholes and schematic soil profile at the site of San Salvatore Hospital (Coppito), L’Aquila.
0
5
10
15
20
25
30
35
40
45
50
0 400 800 1200 1600 2000
Dep
th (m
)
Shear wave velocity VS (m/s)
SDMTMASW
S1CLAYEY SILT
CALCAREOUSGRAVEL
Figure 13. Profile of VS measured by SDMT in a back-filled borehole, VS measured by MASW (IAMC-CNR, MS–AQ Working Group 2010) and schematic soil profile at the site of Via Solaria (Cansatessa), L’Aquila.
0
5
10
15
20
25
30
0 400 800 1200 1600 2000
Dep
th (m
)
Shear wave velocity VS (m/s)
SDMT 1SDMT 2SDMT 3
S1-S3
CLAYEY SILT
CALCAREOUSGRAVEL
Figure 14. Profile of VS measured by SDMT in 3 back-filled boreholes and schematic soil profile at the site of Via Sila Persichelli (Pettino), L’Aquila.
487
for site seismic response analyses. Monaco et al. (2011b) presented the results of numerical analyses carried out to assess the different seismic response of two sites, one located in L’Aquila city center (Palazzo Camponeschi, Fig. 7) and one in the Pet-tino district (Via Sila Persichelli, Fig. 14). These two areas—both severely damaged by the April 6, 2009 earthquake—are characterized by substantially different subsoil conditions. Basically, in the city center the subsoil is characterized by an inversion of the shear wave velocity with depth, at the transi-tion from the breccias to the lacustrine silts, and the bedrock (geological and seismic) is over 300 m deep. In contrast in the area of Pettino the shear wave velocity increases with depth and the seismic bedrock (VS > 800 m/s) is frequently encountered at ≈20 m depth or less, often in combination with significant contrasts of VS at the shallow contact silty clay/gravel. The results presented by Monaco et al. (2011b) confirm that site effects, related to different subsoil conditions, played an important role in the observed non-uniform damage distri-bution due to the April 6, 2009 earthquake—in agreement with comparisons of strong motion recordings of the main shock at different stations and with the results of the seismic microzonation study (MS–AQ Working Group 2010).
4 ESTIMATES OF VS FROM MECHANICAL DMT DATA
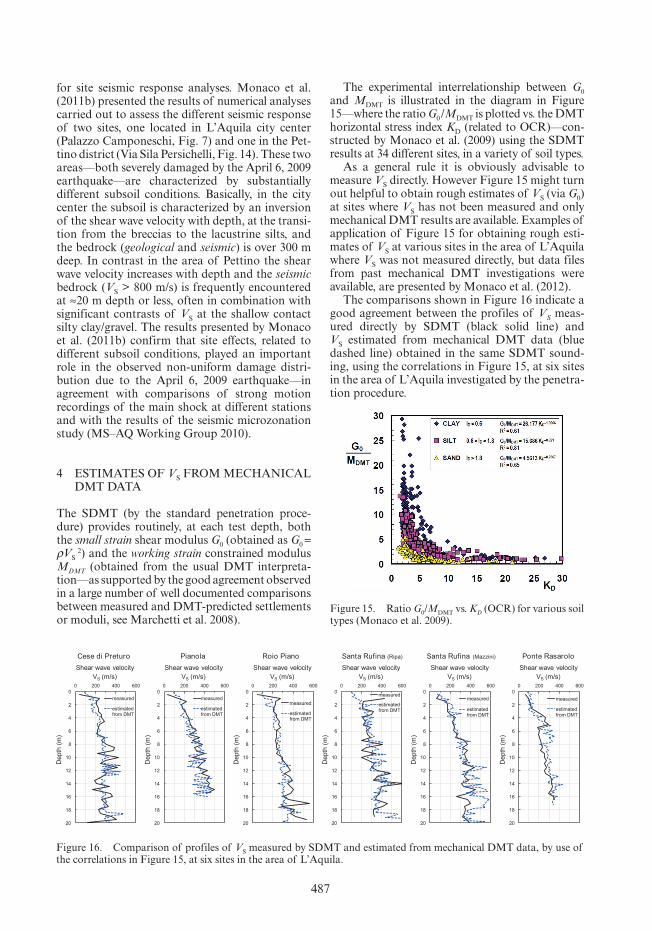
The SDMT (by the standard penetration proce-dure) provides routinely, at each test depth, both the small strain shear modulus G0 (obtained as G0 =
ρVS 2) and the working strain constrained modulus
MDMT (obtained from the usual DMT interpreta-tion—as supported by the good agreement observed in a large number of well documented comparisons between measured and DMT-predicted settlements or moduli, see Marchetti et al. 2008).
The experimental interrelationship between G0 and MDMT is illustrated in the diagram in Figure 15—where the ratio G0 /MDMT is plotted vs. the DMT horizontal stress index KD (related to OCR)—con-structed by Monaco et al. (2009) using the SDMT results at 34 different sites, in a variety of soil types.
As a general rule it is obviously advisable to measure VS directly. However Figure 15 might turn out helpful to obtain rough estimates of VS (via G0) at sites where VS has not been measured and only mechanical DMT results are available. Examples of application of Figure 15 for obtaining rough esti-mates of VS at various sites in the area of L’Aquila where VS was not measured directly, but data files from past mechanical DMT investigations were available, are presented by Monaco et al. (2012).
The comparisons shown in Figure 16 indicate a good agreement between the profiles of VS meas-ured directly by SDMT (black solid line) and VS estimated from mechanical DMT data (blue dashed line) obtained in the same SDMT sound-ing, using the correlations in Figure 15, at six sites in the area of L’Aquila investigated by the penetra-tion procedure.
Figure 15. Ratio G0/MDMT vs. KD (OCR) for various soil types (Monaco et al. 2009).
0
2
4
6
8
10
12
14
16
18
20
0 200 400 600
Dep
th (m
)
Shear wave velocityVS (m/s)
Cese di Preturo
measured
estimated from DMT
0
2
4
6
8
10
12
14
16
18
20
0 200 400 600
Dep
th (m
)
Shear wave velocityVS (m/s)
Roio Piano
measured
estimated from DMT
0
2
4
6
8
10
12
14
16
18
20
0 200 400 600
Dep
th (m
)
Shear wave velocityVS (m/s)
Santa Rufina (Ripa)
measured
estimated from DMT
0
2
4
6
8
10
12
14
16
18
20
0 200 400 600
Dep
th (m
)
Shear wave velocityVS (m/s)
Santa Rufina (Mazzini)
measured
estimated from DMT
0
2
4
6
8
10
12
14
16
18
20
0 200 400 600
Dep
th (m
)
Shear wave velocityVS (m/s)
Ponte Rasarolo
measured
estimated from DMT
0
2
4
6
8
10
12
14
16
18
20
0 200 400 600
Dep
th (m
)
Shear wave velocityVS (m/s)
Pianola
measured
estimated from DMT
Figure 16. Comparison of profiles of VS measured by SDMT and estimated from mechanical DMT data, by use of the correlations in Figure 15, at six sites in the area of L’Aquila.
488
5 CONCLUSIONS
A large number of seismic dilatometer tests were executed in the area of L’Aquila following the April 6, 2009 earthquake. The SDMT results pro-vided useful data for the geotechnical characteriza-tion of new temporary residential sites (C.A.S.E. Project), for the seismic microzonation of the area and for site seismic response analyses aimed at design of restoration/retrofitting of important public buildings, particularly in the historic center of L’Aquila.
Due to the characteristics of the soils generally encountered in the area of L’Aquila, mostly coarse-grained, the seismic dilatometer tests were executed by the normal penetration procedure only in a lim-ited number of sites. However the backfilling proce-dure permitted to obtain VS profiles by SDMT also in non-penetrable soils at several sites, both in the city center and in the suburban area of L’Aquila. In some cases the backfilling procedure permitted to obtain VS measurements by SDMT down to very large depths (≈70 to 130 m), by use of the “stack-ing” technique for interpreting the SDMT seismo-grams in case of low signal/noise ratio.
If only mechanical DMT results are available, e.g. from past investigations, rough estimates of VS (from G0) can be obtained using the correlations in Figure 15 (Monaco et al. 2009). Comparisons of profiles of VS measured by SDMT and estimated from mechanical DMT data at different sites in the area of L’Aquila, showing a good agreement, are presented in the paper.
REFERENCES
Amoroso, S., Marchetti, D., Marchetti, S., Monaco, P., Totani, F. & Totani, G. 2011. Site characterization by seismic dilatometer (SDMT) in the area of L’Aquila. In G. D’Ovidio, Y. Nakamura, A. Rovelli & G. Valente (eds), The Dynamic Interaction of Soil and Structure, 37–62, Roma: Aracne editrice.
Cardarelli, E. & Cercato, M. 2010. Relazione sulla cam-pagna d’indagine geofisica per lo studio della risposta sismica locale della città dell’Aquila. Prova crosshole sondaggi S3–S4. Report DICEA—University of Roma La Sapienza (in Italian), www.cerfis.it
Hepton, P. 1988. Shear wave velocity measurements dur-ing penetration testing. Proc. Penetration Testing in the UK: 275–278. ICE.
Marchetti, S. 1980. In Situ Tests by Flat Dilatometer. J. Geotech. Engrg. Div. ASCE. 106 (GT3): 299–321.
Marchetti, S., Monaco, P., Totani, G. & Marchetti, D. 2008. In Situ Tests by Seismic Dilatometer (SDMT). In J.E. Laier, D.K. Crapps & M.H. Hussein (eds), From Research to Practice in Geotechnical Engineer-ing, Geotechnical Special Publication No. 180: 292–311. ASCE.
Martin, G.K. & Mayne, P.W. 1997. Seismic Flat Dilatom-eter Tests in Connecticut Valley Varved Clay. Geotech. Testing J. 20(3): 357–361. ASTM.
Martin, G.K. & Mayne, P.W. 1998. Seismic flat dilatom-eter in Piedmont residual soils. In P.K. Robertson & P.W. Mayne (eds), Geotechnical Site Characterization, Proc. 1st Int. Conf. on Site Characterization, Atlanta, 2: 837–843. Rotterdam: Balkema.
Mayne, P.W., Schneider, J.A. & Martin, G.K. 1999. Small- and large-strain soil properties from seismic flat dilatometer tests. In M. Jamiolkowski, R. Lancel-lotta & D.C.F. Lo Presti (eds), Pre-failure Deformation Characteristics in Geomaterials: 419–427. Rotterdam: Balkema.
Monaco, P., Marchetti, S., Totani, G. & Marchetti, D. 2009. Interrelationship between small strain modu-lus G0 and operative modulus. In T. Kokusho, Y. Tsukamoto & M. Yoshimine (eds), Performance-Based Design in Earthquake Geotechnical Engineering—from Case History to Practice, Proc. IS-Tokyo 2009, Tsukuba, Japan, June 15–17, 1315–1323. Taylor & Francis Group, London (CD-Rom).
Monaco, P., Santucci de Magistris, F., Grasso, S., Marchetti, S., Maugeri, M. & Totani, G. 2011a. Analysis of the liquefaction phenomena in the village of Vittorito (L’Aquila). Bulletin of Earthquake Engineering, Special Issue: L’Aquila Earthquake: Seis-mic Sequence of 6th April 2009, Abruzzo, Italy, (9)1: 231–261. Springer (NL).
Monaco, P., Totani, G., Barla, G., Cavallaro, A., Costanzo, A., D’Onofrio, A., Evangelista, L., Foti, S., Grasso, S., Lanzo, G., Madiai, C., Maraschini, M., Marchetti, S., Maugeri, M., Pagliaroli, A., Pallara, O., Penna, A., Saccenti, A., Santucci de Magistris, F., Scasserra, G., Silvestri, F., Simonelli, A.L., Simoni, G., Tommasi, P., Vannucchi, G. & Verrucci, L. 2012. Geotechnical aspects of the L’Aquila earthquake. In M.A. Sakr & A. Ansal (eds), Special Topics in Earth-quake Geotechnical Engineering, Chapter 1. Springer Science+Business Media B.V.
Monaco, P., Totani, G., Totani, F., Grasso, S. & Maugeri, M. 2011b. Site effects and site amplification due to the 2009 Abruzzo earthquake. In C.A. Brebbia & M. Maugeri (eds), Earthquake Resistant Engineering Structures VIII, Proc. 8th Int. Conf. on Earthquake Resistant Engineering Structures, Chianciano Terme, Invited lecture, WIT Press.
MS–AQ Working Group. 2010. Microzonazione sis-mica per la ricostruzione dell’area aquilana. Regione Abruzzo—Dipartimento della Protezione Civile, L’Aquila, 3 vol. & Cd-rom (in Italian).
TC16 2001. The Flat Dilatometer Test (DMT) in Soil Investigations—A Report by the ISSMGE Committee TC16. May 2001, 41 pp. Reprint in R.A. Failmezger & J.B. Anderson (eds), Flat Dilatometer Testing, Proc.
2nd Int. Conf. on the Flat Dilatometer, Washington D.C.: 7–48.
Totani, G., Monaco, P., Marchetti, S. & Marchetti, D. 2009. VS measurements by seismic dilatometer (SDMT) in non-penetrable soils. In M. Hamza et al. (eds), Proc. 17th Int. Conf. on Soil Mechanics and Geotechnical Engineering, Alexandria, 2: 977–980, IOS Press.
Related Documents