Sistema JSFC Consumer Assets BU Capital Markets Day October 20, 2009 Felix EVTUSHENKOV Vice-President, Head of Consumer Assets Business Unit

Welcome message from author
This document is posted to help you gain knowledge. Please leave a comment to let me know what you think about it! Share it to your friends and learn new things together.
Transcript

Sistema JSFC
Consumer Assets BUCapital Markets Day
October 20, 2009
Felix EVTUSHENKOV
Vice-President, Head of Consumer Assets Business Unit

2
Certain statements in this presentation may contain assumptions or forecasts in respect to
forthcoming events within JSFC Sistema. The words “expect”, “estimate”, “intend”, “will”,
“could” and similar expressions identify forward-looking statements. We wish to caution you
that these statements are only predictions and that actual events or results may differ materially.
We do not intend to update these statements to reflect events and circumstances occurring after
the above-mentioned date or to reflect the occurrence of unanticipated events. Many factors
could cause the actual Sistema‟s results to differ materially from those contained in our
projections or forward-looking statements, including, among others, deteriorating economic and
credit conditions, our competitive environment, risks associated with operating in Russia, rapid
technological and market change in our industries, as well as many other risks specifically
related to Sistema and its operations.
Disclaimer

3
1. Consumer Assets BU at a glance

4
1.1. Consumer Assets Business Unit Structure
• Top-25 Russian banking group
among peers by net assets
measured under RAS at the end
of 1H 2009
• Full-service universal banking
group with network all over
Russia and presence in
Luxembourg, most respectful
banking jurisdiction in Europe
• The first national chain of
healthcare centers in Russia
• Moscow - 19 clinics and 1
in-patient hospital
• Regions – 11 clinics and 46
medical points
• The largest children‟s goods
retail network in Russia. 127
stores with total retail space
of 217 000 sq.m.
• 95% Detsky Mir brand
recognition*
• Modern distribution center
“Kryokshino” (Moscow
region) since Q1 2009
• 100% owned C-Toys
Company, a leading Russian
toys importer and distributor
FINANCE RETAIL
Consumer Assets Business Unit
HEALTHCARE97% 100%100% TOURIZM66%
• Intourist Group is the largest
vertically integrated tourist
holding in Russia and CIS
• Internationally recognized
brand since 1929
• Intourist position in the tour-
operating market in Russia
and CIS: Leader of inbound
market segment in Russia,
Top-five company in
outbound tourism segment
*ACNielsen Moscow 2007
Consumer BU consists of the market leaders in each particular sector.

5
14,2 15,7 13,811,8
2Q08 4Q08 1Q09 2Q09
1.2. Consumer Assets BU Key financial highlights
Consumer unit demonstrated revenues and OIBDA growth against a backdrop of
unfavorable market conditions. 55
REVENUE
US GAAP, US$ mln
608 588427348
2Q08 4Q08 1Q09 2Q09
-29.8%
OIBDA NET INCOME/LOSS
+22.6%
-8
-21
26
-42
2Q08 4Q08 1Q09 2Q09
-53
-327
-3
-109
2Q08 4Q08 1Q09 2Q09
4.2% - - - Margin
RUB bln
-3.2%
+16.4%
-1,7
-8,9
-0,1
-3,7
2Q08 4Q08 1Q09 2Q09
-129.7%
+63.7%
-1176.8%
+51.5%
-140.9%
+65.5%
-2487.0%
+54.0%
Consumer business unit’s revenues increased by 22.6% q-o-q largely due to the robust performance of the Tourism business. The unit
reported reduction in net loss and OIBDA loss in the 2Q 2009 as a result of stronger performance in the Banking, Tourism and Consumer
businesses, as well as US $14.8 mln foreign exchange gain
-0,2
-0,7
0,6
-1,3
2Q08 4Q08 1Q09 2Q09
6
1.3. Key developments
• Russian retail market generally very attractive from growth, structure and profitability points of view
• Leading companies operating in Russian retail markets have large organic and M&A growth potential
• Sistema JSFC assets present in industries, serving retail customers in Russia, handle the crisis fairly
well – operate with profitability higher than market average and growing their market share
• “Consumer” assets of Sistema JSFC successfully execute their anti-crisis programs, cutting the costs
and exploring and exploiting unique growth opportunities
• BU Consumer Assets continues to develop its assets portfolio to augment and strengthen its market
leadership positions, to ensure profitability growth by introducing best practice operations techniques,
by capitalizing on market opportunities provided by structural changes and overall growth

7
2. Strategy Implementation

8
2.1. BU “Consumer assets” strategy
Simplification of the
corporate
management
structure
Industries‟ productivity lags
behind Western industry
practice
Achievement of strategic objectives “5 X 5 > 25”
Markets of presence have
sizable growth potential
BU CA‟s assets may serve
as consolidation centres,
further increasing market
share
Value creation
Observing strict
financial
discipline
Market windows of opportunity
Strategic initiatives
Strategy is to capitalize on market opportunities to create shareholder’s value through maximizing
business efficiency and development of new products. We aim to build top team of leaders on the market.
Portfolio strategy
and assets
management
enhancement
Best IR and
corporate
governance
practices

9
2.2. What have we done over the year?
All of the major projects and initiatives were aimed at meeting the strategic objectives.
Applicable
assets
Strategic objectives “5 X 5 > 25”
№
Most important strategic
projects and initiatives
1. Value
creation
2. Financial
discipline
3. Simplification
of the
management
structure
4. Portfolio
strategy
implemen-
tation
5. Corporate
governance
and IR
1.Enhancements of top-
management teams
Banking group,
Medsi
2.Active partner search for
certain assets
Intourist,
Detsky Mir
3. Reconfiguration of assets Detsky Mir
4.Reconfiguration of sales
network in assetsAll
5.Headcount and administrative
cost reductionAll
6. Debt management All
7. Capex program optimization All
8.Optimization of reporting and
control functionsAll
9.New IT systems
implementation
Banking group,
Detsky Mir

10
3. Business Overview

11
3.1. Banking Group (financial services) in 2009
The Banking Group of Sistema JSFC is successfully handling the crisis in 2009.
Major events in 2009• A new CEO Mr. Oleg Kapitonov, formerly founder, co-owner and
CEO of Absolut Bank, who led this successful Russian bank over
12 years, hired to provide stronger focus on development.
• In the 4Q the Bank resumed active lending to the small and
medium enterprises, applying, similarly to 2005-2008, prudent
and conservative approach to the assessment of the borrowers
• Cost cutting resulted in 12 % decrease of the cost/income ratio
• Advance repayment of 75 mln USD syndicated loan and 100 mln
USD of Eurobonds
• Pioneer deal in mortgage portfolio securitization of RUR 2.2 bln
guaranteed by AHML in August 09
Operating indicators
Bank is in Top-25 in RF
Target markets : RF (major cities)
Key products :
• Lending to corporate and retail clients
• Settlement and cash services for the corporate and retail
clients
• Products for the financial organizations
Financial indicators, RUR bln
Revenue
* IFRS data (unaudited for 2009)
*
12
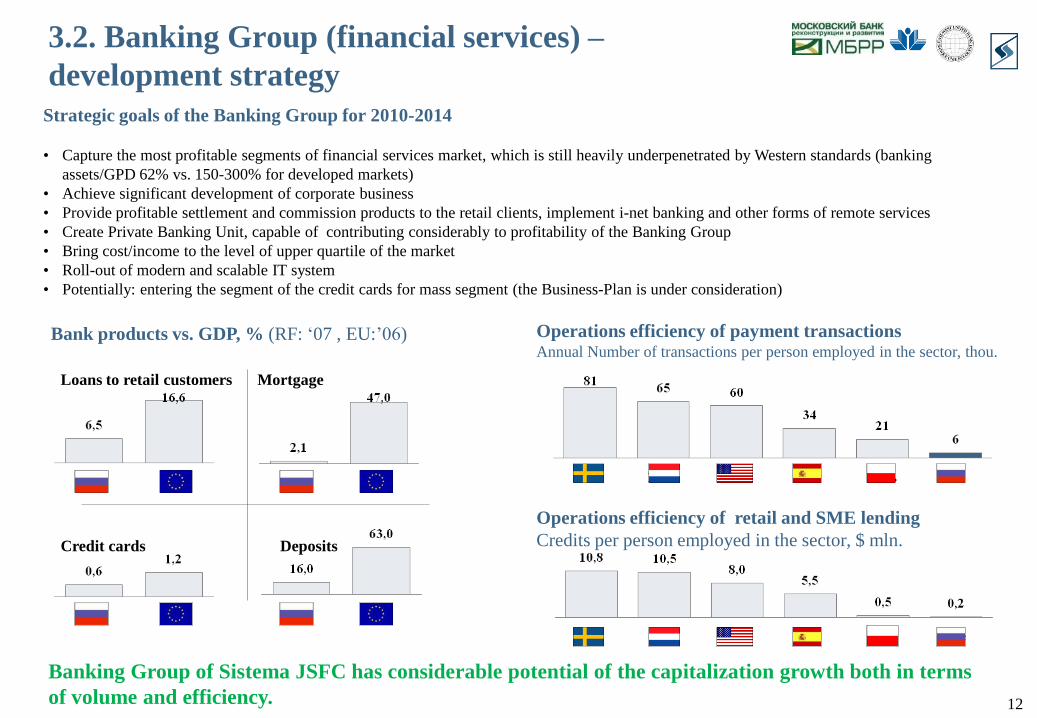
3.2. Banking Group (financial services) –
development strategy
Banking Group of Sistema JSFC has considerable potential of the capitalization growth both in terms
of volume and efficiency.
Strategic goals of the Banking Group for 2010-2014
• Capture the most profitable segments of financial services market, which is still heavily underpenetrated by Western standards (banking
assets/GPD 62% vs. 150-300% for developed markets)
• Achieve significant development of corporate business
• Provide profitable settlement and commission products to the retail clients, implement i-net banking and other forms of remote services
• Create Private Banking Unit, capable of contributing considerably to profitability of the Banking Group
• Bring cost/income to the level of upper quartile of the market
• Roll-out of modern and scalable IT system
• Potentially: entering the segment of the credit cards for mass segment (the Business-Plan is under consideration)
Bank products vs. GDP, % (RF: „07 , EU:‟06)
Loans to retail customers Mortgage
Credit cards Deposits
Operations efficiency of payment transactionsAnnual Number of transactions per person employed in the sector, thou.
Operations efficiency of retail and SME lending
Credits per person employed in the sector, $ mln.
RF RF
RF RF
EU
EU
EU
EU

13
3.3. Detsky Mir in 2009
Full range of goods for children of guaranteed quality
• The largest RF retailer in the segment,
• #3 in world by revenues, following Toys‟R‟Us (US) and
Mothercare (UK - worldwide)
• Footprint covering of almost all regions of the RF
• Market share in the RF – over 30%, the closest competitor
is 5 times smaller
• 60 mln visitors per annum
• 28 mln checks per annum
Operating indicators
Financial indicators, bln RUR
Key events - 2009
• Some of the competitors have gone bankrupt and have
left the market
• New Oracle Retail IT system was deployed across the
company
• New world-class warehouse with IT system was
opened in Krekshino
• Refinanced over RUR 2,168 mln of credit portfolio
Detsky Mir is Russia’s largest children’s goods retail network.
Revenues
Number of bills,
mln. bills
Average bill, RUR

14
3.4. Detsky Mir – development strategy
Share of the retail sector, %
Outdoor markets
Pavilions
and kiosks
Small shops
Discounters
Supermarkets
Hypermarkets
-69%
Forecast CAGR 2007-
2010
By 2010 the market share in the modern formats
in Russia will still be only 50%
9
12
4
24
25
47
Strategic goals for 2010-2014: growth of the clients base and capitalization of the business
• Capturing vast potential of Russian markets promised by birth rate increase and expected economy turn up
• Significant development of private labels in order to improve OIBTDA levels
• Achievement of target level of revenues by less mature shops (opened in 2007-2009) in 2010-2011
• Capitalizing on the conceptually new opportunities in category and costs management arising thanks to implementation of
Oracle Retail
• Under consideration:
• Development of on-line and catalogue trading in the territories with no footprint
• Expansion to less populated areas via franchise
Productivity level vs. that in the developed countries
over the past years, %
Productivity of labor in retail in Russia is significantly behind developed countries
There are objective reasons for the business of Detsky Mir to successfully grow.
2009 2010
(est.) (est.)

15
3.5. Medsi in 2009
Medsi successfully captures new market share while sustaining profitability.
Leader on non-consolidated market of private
medicine services by sales and number of facilities
• Market share of private medical services – 1.7% RF,
3.7% Moscow
• Market share grew in 2009 despite crisis
• Revenues more that 4 bln. rur in 2009
• More than 3 mln visitors
• More than 30 facilities offering full range of services
(including full fledge hospital)
Financial indicators, Bln RUR
Key events in 2009
• New CEO Mr. Igor Salita, with strong experience in
building network businesses, hired to lead development
• New policlinics opened in Perm and Kazan
• Acquired full scale hospital Centrosoyuz (medical area
10 th m2, 150 beds)
• Opened new diagnostic centre – hospital with total area
of 6 th m2 near Belorusskaya metro station
• Launched new investment projects - policlinics in
Mytischi and Schelkovo
Operating indicators

16
3.6. Medsi – development strategy
Strategic goals for 2010-2014
• Protect and strengthen market leadership position
• Consolidate the assets into one operating company with flat management structure
• Improve operational efficiency through overhead cost reduction
• Re-equip existing facilities and expand on high margin markets, such as surgery and high-tech diagnostics
• Develop direct sales channel to address retail clients
• Roll-out 3rd generation MIS system
• Continue Regional expansion
Healthcare services market is one of the most attractive for investments in Russia.
15,3
11,1
9,8
10,7
8,3
6,2
% of GDP
Healthcare system revenues in 2007,
USD per capita
5,2
Emerging markets healthcare services
companies EBITDA margin, 2007
17
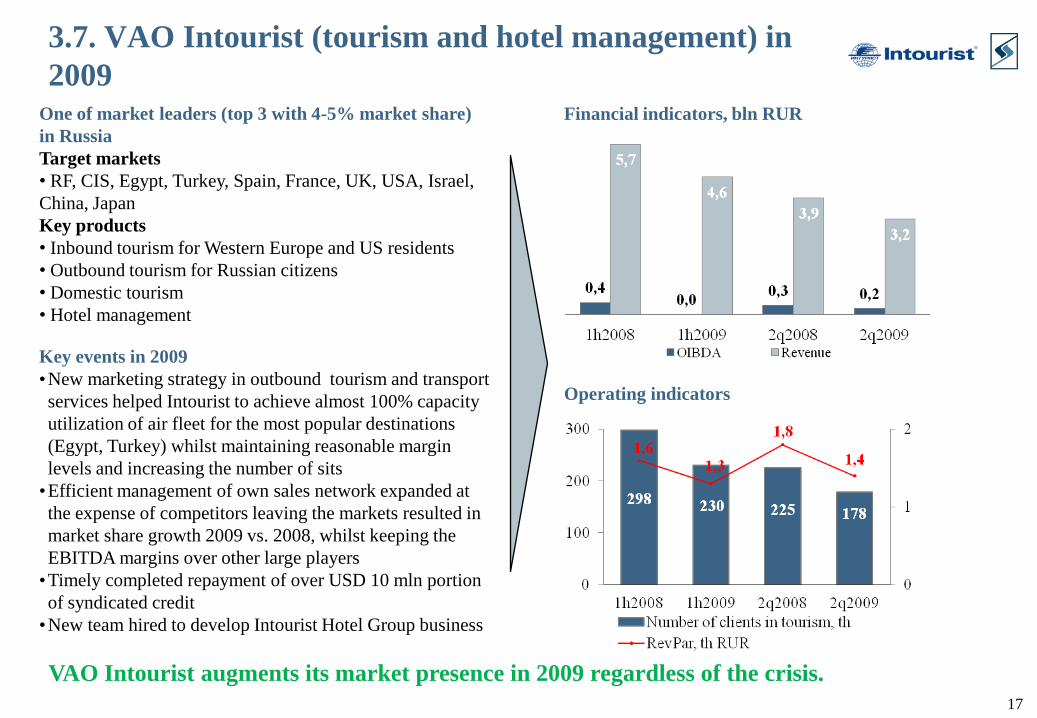
3.7. VAO Intourist (tourism and hotel management) in
2009
VAO Intourist augments its market presence in 2009 regardless of the crisis.
Key events in 2009
•New marketing strategy in outbound tourism and transport
services helped Intourist to achieve almost 100% capacity
utilization of air fleet for the most popular destinations
(Egypt, Turkey) whilst maintaining reasonable margin
levels and increasing the number of sits
•Efficient management of own sales network expanded at
the expense of competitors leaving the markets resulted in
market share growth 2009 vs. 2008, whilst keeping the
EBITDA margins over other large players
•Timely completed repayment of over USD 10 mln portion
of syndicated credit
•New team hired to develop Intourist Hotel Group business
One of market leaders (top 3 with 4-5% market share)
in Russia
Target markets
• RF, CIS, Egypt, Turkey, Spain, France, UK, USA, Israel,
China, Japan
Key products
• Inbound tourism for Western Europe and US residents
• Outbound tourism for Russian citizens
• Domestic tourism
• Hotel management
Operating indicators
Financial indicators, bln RUR
18
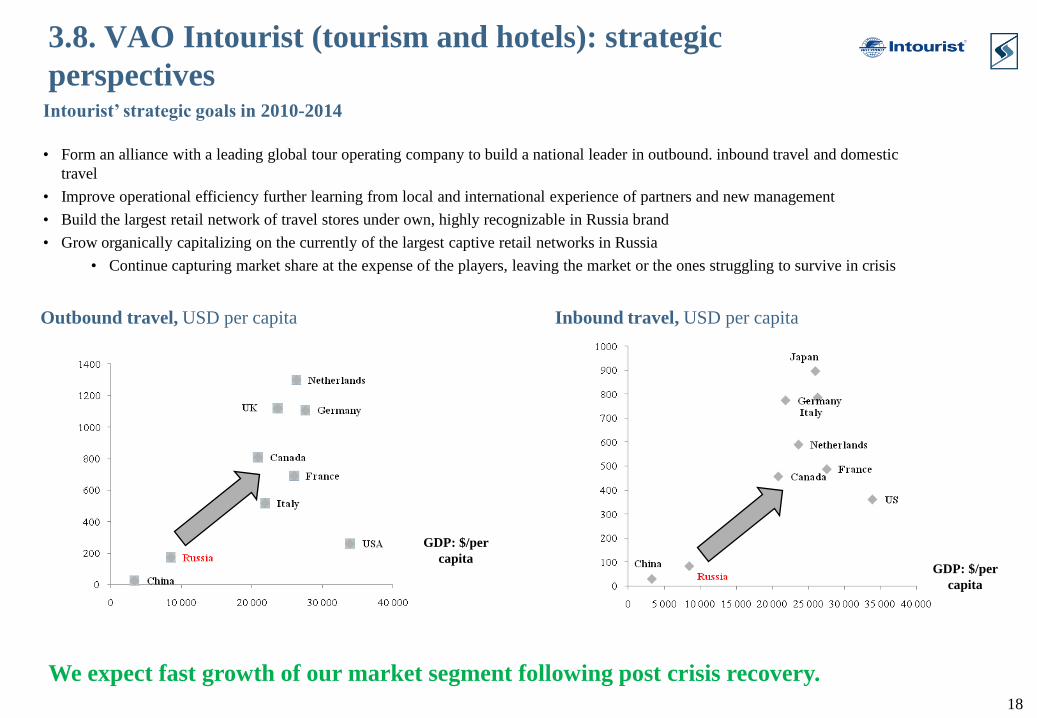
3.8. VAO Intourist (tourism and hotels): strategic
perspectives
We expect fast growth of our market segment following post crisis recovery.
Intourist’ strategic goals in 2010-2014
• Form an alliance with a leading global tour operating company to build a national leader in outbound. inbound travel and domestic
travel
• Improve operational efficiency further learning from local and international experience of partners and new management
• Build the largest retail network of travel stores under own, highly recognizable in Russia brand
• Grow organically capitalizing on the currently of the largest captive retail networks in Russia
• Continue capturing market share at the expense of the players, leaving the market or the ones struggling to survive in crisis
GDP: $/per
capita
Outbound travel, USD per capita Inbound travel, USD per capita
GDP: $/per
capita

19
October 20, 2009
Felix EVTUSHENKOV
Vice-President, Head of Consumer Assets Business Unit
THANK YOU!
YOUR QUESTIONS, PLEASE
Investor Relations Department
Tel. +7 (495) 692 2288
www.sistema.com
Related Documents