0 April 2015 SIR Royalty Income Fund Investor Presentation (TSX: SRV.UN)

Welcome message from author
This document is posted to help you gain knowledge. Please leave a comment to let me know what you think about it! Share it to your friends and learn new things together.
Transcript

0
April 2015
SIR Royalty Income Fund
Investor Presentation (TSX: SRV.UN)

1
Caution Concerning Forward-Looking Statements
Statements in this presentation, including the information set forth as to the future financial or operating performance of the
Fund or SIR, that are not current or historical factual statements may constitute “forward-looking” information within the
meaning of securities laws. Such forward-looking statements involve known and unknown risks, uncertainties and other factors
which may cause the actual results, performance or achievements of the Fund, the Trust, the Partnership, SIR, the SIR
Restaurants, or industry results, to be materially different from any future results, performance or achievements expressed or
implied by such forward-looking statements. When used in this presentation, such statements may include, among other
language, such words as “may”, “will”, “should”, “would”, “expect”, “believe”, “plan”, “anticipate”, “intend”, “estimate” and other
similar terminology. These statements reflect Management’s current expectations, estimates and projections regarding future
events and operating performance and speak only as of the date of this presentation. Readers are cautioned that forward-looking
statements are not guarantees of future performance, and should not place undue reliance on them. The Fund and SIR expressly
disclaim any obligation or undertaking to publicly release any updates or revisions to any forward-looking statements contained
herein to reflect any change in expectations, estimates and projections with regard thereto or any changes in events, conditions or
circumstances on which any statement is based, except as expressly required by law.
In formulating the forward-looking statements contained herein, Management has assumed that business conditions affecting
SIR’s restaurants and the Fund will continue substantially in the ordinary course, including without limitation with respect to
general industry conditions, general levels of economic activity (including in downtown Toronto), regulations (including those
regarding employees, food safety, tobacco and alcohol), weather, taxes, foreign exchange rates and interest rates, that there will
be no pandemics or other material outbreaks of disease or safety issues affecting humans or animals or food products, and that
there will be no unplanned material changes in its facilities, equipment, customer and employee relations, or credit
arrangements. These assumptions, although considered reasonable by Management at the time of preparation, may prove to be
incorrect. The Fund includes in publicly available documents filed from time to time with securities commissions and The Toronto
Stock Exchange, a discussion of the risk factors that can cause anticipated outcomes to differ from actual outcomes. For more
information concerning the Fund’s risks and uncertainties, please refer to the March 18, 2015 Annual Information Form which is
available under the Fund’s profile at www.sedar.com.

2
SIR Investment Highlights
• Diversified portfolio of well-known brands
• Experienced management team with strong alignment of interests
• Corporate ownership model increases flexibility
• Consistent track record of investment in new and existing locations
• Proven track record of sustained growth
• Five distribution increases since Fund inception

3
• SIR: ‘Service Inspired Restaurants’
• A leading Canadian operator of casual and fine dining restaurants
• Founded in 1990 by Fowler family
• Employees: ~5,000
• IPO: October 2004 (TSX: SRV.UN)
• Market Cap: ~ $104.2 m
• Recent close: $13.57 (Apr. 7, 2015)
• Units outstanding: 7.6 m (basic) / 10.1 m (FD)
• Annualized distribution per unit: $1.14
• Effective current distribution yield: ~ 8.3%
SIR Corp. SIR Royalty Income Fund
SIR Overview
SRV.UN 5-year unit price performance

4
Experienced Management Team withStrong Alignment of Interests
Peter Fowler
• Director of SIR Corp. since 1992
• Served as CEO since 2004 and the largest shareholder of SIR Corp.
–Helped create SIR Concepts and continues to focus on Concepts
• President of SIR GP Inc. and a trustee of the SIR Royalty Income Fund since 2004
Paul Bognar
• Joined SIR Corp. in 2012 as COO and EVP
• Head of Marketing, Human Resources, Finance, IT and Purchasing Departments
–Previous: President of Simmons Canada; and held various positions within Maytag Canada
Bruce Elliott
• Joined SIR Corp. in January 2011 as COO and EVP, became the President of Jack Astor’s in March 2012, and effective January 2014 is Vice President Business Development.
–Previous: partner at Level 5 Strategic Brand Advisors; President of Labatt Breweries; and senior management positions at Second Cup
Jeff Good
• CFO of SIR Corp. and SIR GP Inc.
• Has worked with SIR Corp. since 2000
• Helped launch SIR as an Income Fund
– 20 + years experience in Finance and Accounting
– Previously worked at Oliver Bonacini in Toronto
Experienced Management Team
Board of Trustees of the Fund:Peter Fowler: CEO and Director of SIR Corp.;
• President of SIR GP Inc.
Kim van Nieuwkoop: General Counsel, SIR Corp.
Independent Trustees:Peter Luit: Managing Director, CXO Advisory Services Inc.; Chairman
of Audit Committee
John McLaughlin: President, Treasury Technologies International;
Chairman of Board of Trustees
William Rogers: President, The Commercial Capital Corporation;
Chairman of Corporate Governance Committee
5
SIR Corporate Ownership Increases Flexibility
Greater control provides the ability to quickly implement operational and growth initiatives in response to customer trends and competitive activity
• Corporate ownership allows SIR to improve overall operations by:
– Implementing best practices across restaurant network
– Coordinating roll-out of new restaurant locations and product offerings
– Leveraging supplier relationships and delivery logistics
• Flexibility to react quickly to changing market dynamics
– Ability to change restaurant design as needed with minimal lead time
– Allows for menu innovation; EG: Jack Astor’s updates its menu at least twice a year
– Unlike franchises, business change can be affected without lengthy approvals/negotiations
• Consistent execution of brand value proposition
– Consistent customer experience at all restaurant locations creates superior brand value
6
Royalty Pool Concept Restaurants
Royalty Pool Signature Restaurants

7
55 Royalty Pooled Restaurants
S O U T H E R N O N TA R I O
30
8
5
1
1
2 1
Alberta
2
Nova Scotia
Quebec
4
Newfoundland
1

8
Royalty Pooled Restaurants
Signature Group
Revenue Contribution (for the year ended December 31, 2014)
75.5%
10.6%
5.3%8.6%
8
9
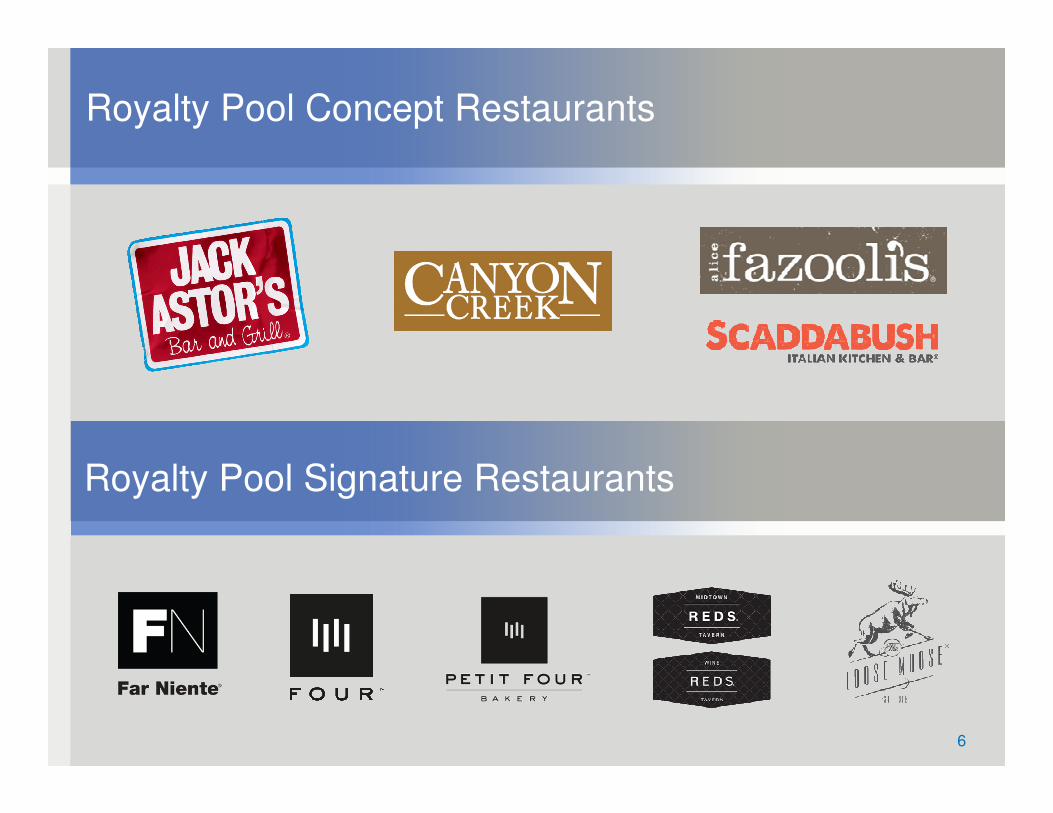
Pooled Revenue
($000s)
Same Store Sales Growth
# o
f re
sta
ura
nts
Concept Royalty Pooled Restaurants
9
3.2%
3.9%
5.0%
0.6%
1.7%
2010 2011 2012 2013 2014
$1
37
,58
2
$1
47
,00
4
$1
57
,62
9
$1
76
,72
3
$1
94
,72
3
29 30 3134
37
0
5
10
15
20
25
30
35
40
$-
$50,000
$100,000
$150,000
$200,000
$250,000
2010 2011 2012 2013 2014

10
Jack Astor’s Evolution
• Over the past 10 years, SIR has “evolved” nearly every Jack Astor’s in the system
Recent Renovations
• Square One (Mississauga) / Newmarket / Bloor St.
Recent New Restaurant Openings
• Kitchener, ON in Q1 2013
• North York, ON in Q2 2013
• Pickering, ON in Q2 2013
• St. John’s, NL in Q2 2014
• Ottawa, ON in Q1 2015
Consistent Track Record of Investment in New and Existing Locations
10

11
Pooled Revenue
$000s
Same Store Sales
# o
f re
sta
ura
nts
Concept Royalty Pooled Restaurants
11
0.5%0.4%
-1.0%
-3.2%
1.7%
2010 2011 2012 2013 2014
$2
7,8
43
$2
7,9
48
$2
7,6
82
$2
6,7
94
$2
7,2
56
8 8 8 8 8
0
1
2
3
4
5
6
7
8
9
$-
$5,000
$10,000
$15,000
$20,000
$25,000
$30,000
$35,000
2010 2011 2012 2013 2014
12
Pooled Revenue
($0
00
s)
Same Store Sales
# o
f re
sta
ura
nts
²
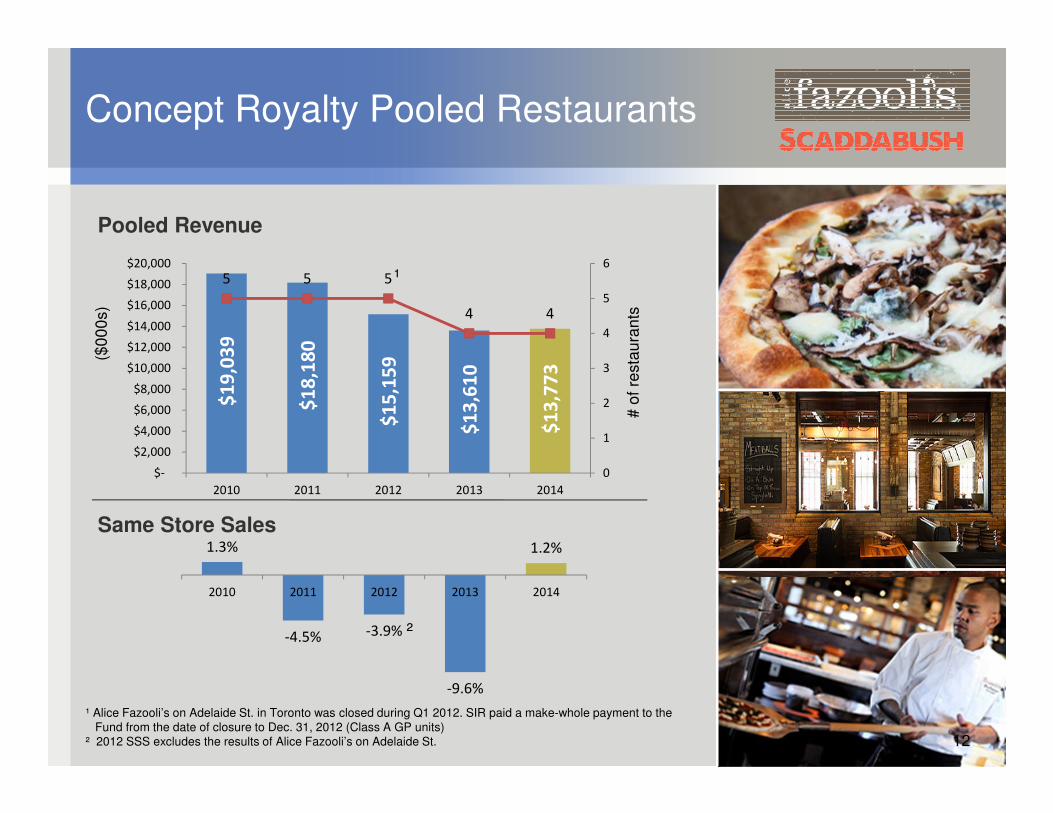
¹ Alice Fazooli’s on Adelaide St. in Toronto was closed during Q1 2012. SIR paid a make-whole payment to the Fund from the date of closure to Dec. 31, 2012 (Class A GP units)
² 2012 SSS excludes the results of Alice Fazooli’s on Adelaide St.
¹
Concept Royalty Pooled Restaurants
12
$1
9,0
39
$1
8,1
80
$1
5,1
59
$1
3,6
10
$1
3,7
73
5 5 5
4 4
0
1
2
3
4
5
6
$-
$2,000
$4,000
$6,000
$8,000
$10,000
$12,000
$14,000
$16,000
$18,000
$20,000
2010 2011 2012 2013 2014
1.3%
-4.5% -3.9%
-9.6%
1.2%
2010 2011 2012 2013 2014
13
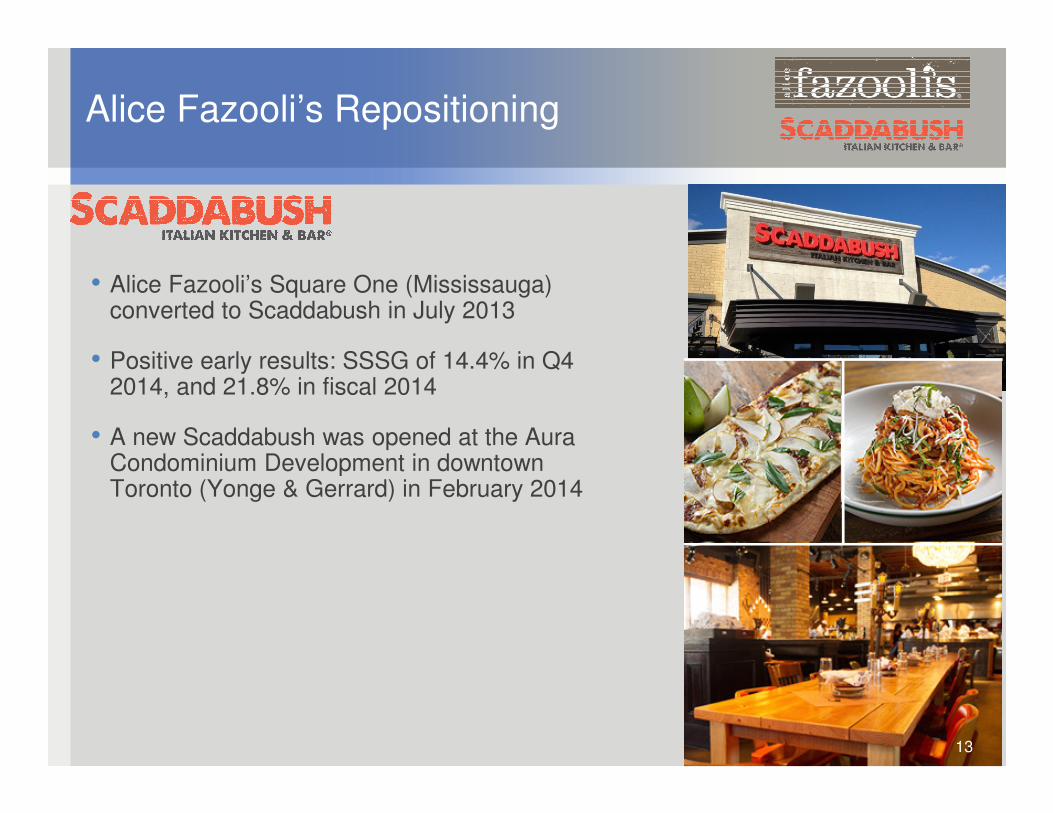
Alice Fazooli’s Repositioning
13
• Alice Fazooli’s Square One (Mississauga) converted to Scaddabush in July 2013
• Positive early results: SSSG of 14.4% in Q4 2014, and 21.8% in fiscal 2014
• A new Scaddabush was opened at the Aura Condominium Development in downtown Toronto (Yonge & Gerrard) in February 2014
13
14
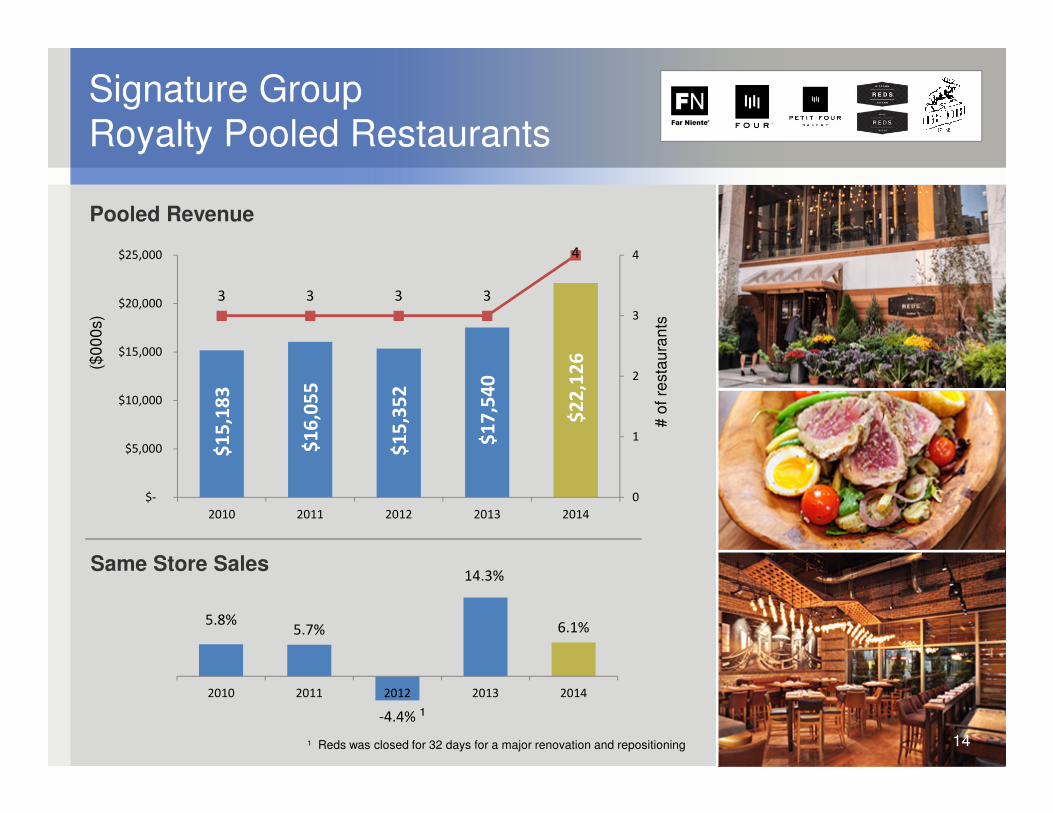
Signature Group Royalty Pooled Restaurants
($0
00
s)
Pooled Revenue
Same Store Sales
# o
f re
sta
ura
nts
14
¹
¹ Reds was closed for 32 days for a major renovation and repositioning
5.8%5.7%
-4.4%
14.3%
6.1%
2010 2011 2012 2013 2014
$1
5,1
83
$1
6,0
55
$1
5,3
52
$1
7,5
40
$2
2,1
26
3 3 3 3
4
0
1
2
3
4
$-
$5,000
$10,000
$15,000
$20,000
$25,000
2010 2011 2012 2013 2014

15
• Major renovation and repositioning of Reds completed October 2012 and reopened as Reds Wine Tavern
• Redevelopment of lower level of the Loose Moose into the “Antler Room” completed December 2012
• Major renovation of the Loose Moose completed February 2013
Consistent Track Record of Investment in New and Existing Locations
15

16
New Signature Restaurants
• Reds Midtown Tavern and Duke’s Refresher are two of the three new SIR restaurants at Aura Condominium Development (Yonge & Gerrard)
• Reds Midtown Tavern opened on October 30, 2013
• Duke’s Refresher opened December 4, 2013
Downtown Toronto Expansion
16
17
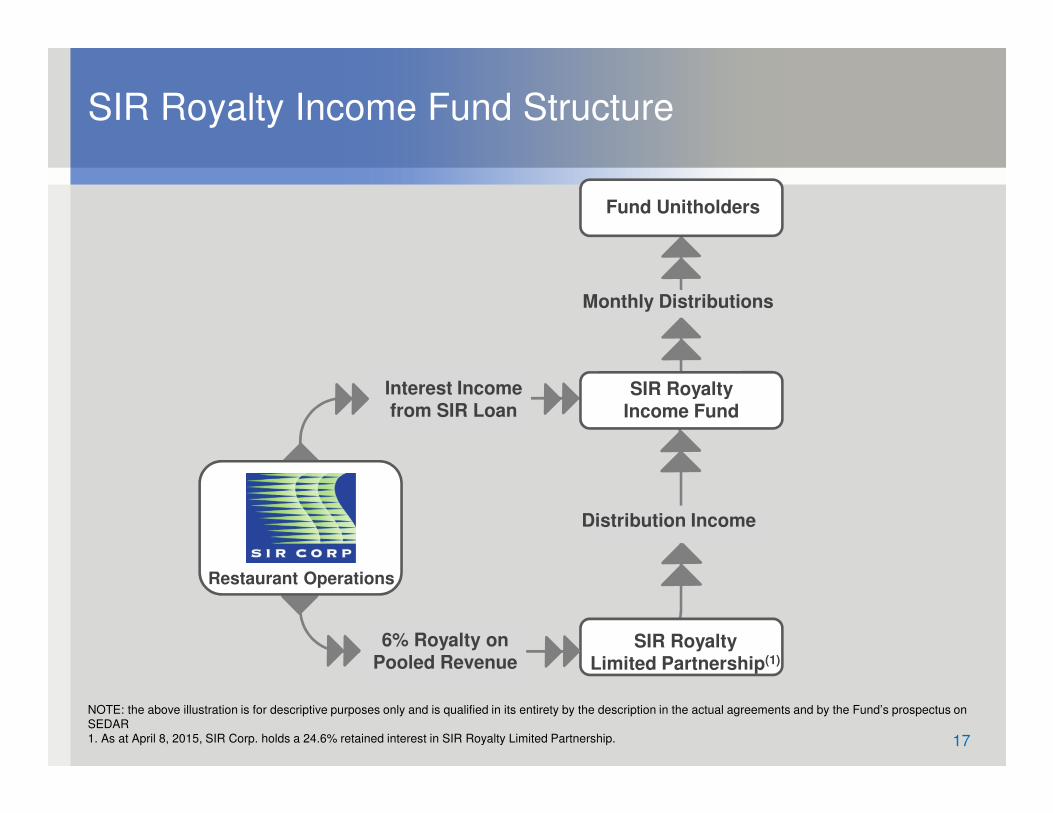
SIR Royalty Income Fund Structure
NOTE: the above illustration is for descriptive purposes only and is qualified in its entirety by the description in the actual agreements and by the Fund’s prospectus on SEDAR1. As at April 8, 2015, SIR Corp. holds a 24.6% retained interest in SIR Royalty Limited Partnership.
SIR Royalty Limited Partnership(1)
SIR Royalty Income Fund
Fund Unitholders
Restaurant Operations
Interest Income from SIR Loan
6% Royalty on Pooled Revenue
Distribution Income
Monthly Distributions

18
Fund Unit Offerings
Transaction Mechanics:
• The Fund issues units in exchange for Class A GP units held by SIR
• SIR sells Fund units via TSX for gross proceeds
• The Fund converts Class A GP units into Class A LP units, which are entitled to a pro rata share of residual LP income
Net proceeds used to partially fund renovations to existing restaurants and construction / development costs of new restaurants
PeriodNumber of Units Issued in Exchange for Class A GP units
Gross Proceeds
Q1 2013 895,000 $11.0 million
Q1 2014 500,000 $7.0 million
Q4 2014 350,000 $4.4 million

19
Q4 2014 Same Store Sales Growth
(3 months ended December 31, 2014)
Overall SSSG
3.5% 2.2% 3.0% 7.1% 3.6%0.0%
1.0%
2.0%
3.0%
4.0%
5.0%
6.0%
7.0%
8.0%

20
Historical Pooled Revenue Growth
Pooled Revenue (in $ millions)
Number of Royalty Pooled Restaurants
Restaurants in Royalty PoolPooled Revenue
NOTE: On January 1, 2015 two additional restaurants were added to the Royalty Pool
$199.6 $209.2 $215.8 $234.7 $257.9
45 46 4749
53
0
10
20
30
40
50
60
0
50
100
150
200
250
300
2010 2011 2012 2013 2014
21
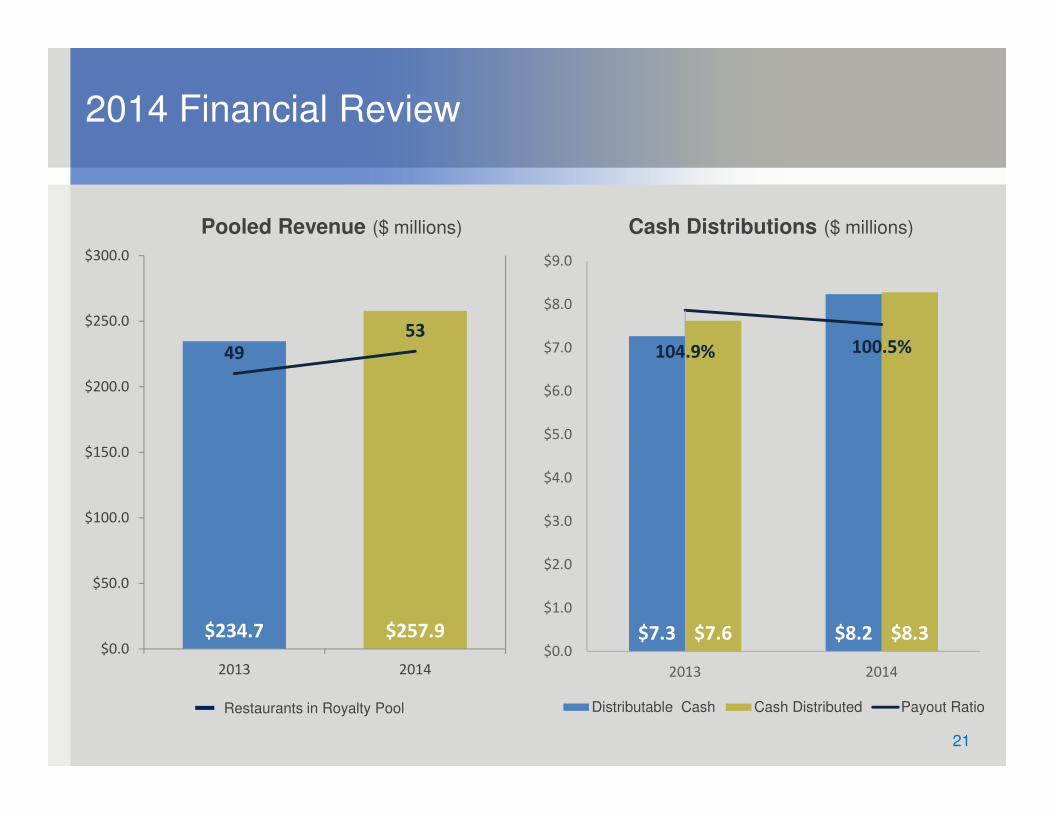
2014 Financial Review
Restaurants in Royalty Pool
$234.7 $257.9
49
53
$0.0
$50.0
$100.0
$150.0
$200.0
$250.0
$300.0
2013 2014
Pooled Revenue ($ millions) Cash Distributions ($ millions)
$7.3 $8.2$7.6 $8.3
104.9% 100.5%
$0.0
$1.0
$2.0
$3.0
$4.0
$5.0
$6.0
$7.0
$8.0
$9.0
2013 2014
Distributable Cash Cash Distributed Payout Ratio

22
Historical Same Store Sales Growth
2.8% 2.8% 2.8%
0.4%
2.0%
2010 2011 2012 2013 2014

23
7.3
9
7.3
9
5.5
1
5.6
2
7.6
2 8.2
8
7.1
4
7.3
8
5.5
1
5.9
1
7.2
7 8.2
4
103.6%100.1% 99.9%
95.1%
104.9%100.5%
0
1
2
3
4
5
6
7
8
9
10
2009 2010 2011 2012 2013 2014
Distributions Distributable Cash Payout Ratio
Historical Cash Distributions & Payout Ratio
SIFT Tax¹
1. The reduction in distributions beginning in 2011 was equal to the estimated SIFT tax payable on the Fund’s 2011 income.2. The special year end distribution of $0.05/unit to unitholders of record as of December 31, 2012 is not included in the chart above.3. Cash distributed to unitholders in 2013 includes the special year-end distribution of $0.05 per unit that was declared in December 2012 and paid on
January 11, 2013. The Fund also increased monthly distributions to $0.095 / unit effective for the June 2013 distribution. The payout ratio was significantly affected by these items.
(in $ millions)
2 3
The Fund’s payout ratio is intended to average 100% per annum over the long term. The Fund’s payout ratio from inception in 2004 through to YE 2014 is 99.4%.

24
Attractive and Stable Yield with History of Increases
2004 to
May 2006
$0.095$0.088
$0.115
$0.083
$0.110$0.105
$0.100
June 2006 to
May 2007
June 2007 to
May 2008
June 2008 to
Jan. 2011
SIFT Tax
Feb. 2011 to
May 2012
June 2012to
May 2013
June 2013to
Present
• Current monthly distribution of $0.095 / unit, current yield ~ 8.3%
• Five distribution increases since IPO in 2004

25
Outlook
• Recent opening of new Jack Astor’s in Ottawa, ON (Q1 2015)
• Royalty pool additions of Scaddabush (Toronto) and Jack Astor’s (St. John’s) in Q1
2015
• Continued focus on Alice Fazooli’s / Scaddabush repositioning driving strong SSSG
• Commitments to lease three properties: two new Jack Astor’s restaurants and one new
Scaddabush restaurant, expected to open in fiscal 2015 and fiscal 2016
• Continued investment in existing restaurants to drive SSSG
Related Documents