SINTEF A2199 − Unrestricted REPORT Quality Evaluation of the CORAS UML Profile SINTEF ICT September 2007

Welcome message from author
This document is posted to help you gain knowledge. Please leave a comment to let me know what you think about it! Share it to your friends and learn new things together.
Transcript

SINTEF A2199 − Unrestricted
REPORT
Quality Evaluation of the CORAS UML Profile
SINTEF ICT September 2007


i
TABLE OF CONTENTS 1 INTRODUCTION................................................................................................................................................1
2 THE CORAS UML PROFILE ...........................................................................................................................3 2.1 THE CONCEPTUAL MODEL .............................................................................................................................3 2.2 THE DIAGRAM TYPES.....................................................................................................................................4
3 THE MODELING NEEDS IN A SECURITY ANALYSIS (THE CORE SECURITY RISK SCENARIOS).................................................................................................................................................................9
3.1 CORE SECURITY RISK SCENARIOS IN PHASE I .................................................................................................9 3.2 CORE SECURITY RISK SCENARIOS IN PHASE II..............................................................................................11 3.3 CORE SECURITY RISK SCENARIOS IN PHASE III ............................................................................................14 3.4 CORE SECURITY RISK SCENARIOS IN PHASE IV ............................................................................................14 3.5 CORE SECURITY RISK SCENARIOS IN PHASE V..............................................................................................15
4 MODELING THE CORE SECURITY RISK SCENARIOS WITH THE UML PROFILE ......................19 4.1 PHASE I: ESTABLISHING THE CONTEXT ........................................................................................................19
4.1.1 Evaluation of the modeling effort...........................................................................................................20 4.2 PHASE II: IDENTIFYING RISKS ......................................................................................................................20
4.2.1 Evaluation of the modeling effort...........................................................................................................29 4.3 PHASE III & IV: ESTIMATING AND EVALUATING RISKS................................................................................30
4.3.1 Evaluation of the modeling effort...........................................................................................................35 4.4 PHASE V: IDENTIFYING TREATMENTS..........................................................................................................36
4.4.1 Evaluation of the modeling effort...........................................................................................................49 5 A LANGUAGE QUALITY FRAMEWORK...................................................................................................51
5.1 ADAPTING SEQUAL TO THE SECURITY ANALYSIS SETTING........................................................................52 5.2 DOMAIN APPROPRIATENESS ........................................................................................................................53 5.3 PARTICIPANT LANGUAGE KNOWLEDGE APPROPRIATENESS .........................................................................57 5.4 KNOWLEDGE EXTERNALIZABILITY APPROPRIATENESS ................................................................................58 5.5 COMPREHENSIBILITY APPROPRIATENESS.....................................................................................................59 5.6 TECHNICAL ACTOR INTERPRETATION APPROPRIATENESS ............................................................................63 5.7 ORGANIZATIONAL APPROPRIATENESS .........................................................................................................63
6 QUALITY EVALUATION OF THE UML PROFILE ..................................................................................64 6.1 DOMAIN APPROPRIATENESS ........................................................................................................................64 6.2 PARTICIPANT LANGUAGE KNOWLEDGE APPROPRIATENESS .........................................................................67 6.3 KNOWLEDGE EXTERNALIZABILITY APPROPRIATENESS ................................................................................68 6.4 COMPREHENSIBILITY APPROPRIATENESS.....................................................................................................69 6.5 TECHNICAL ACTOR APPROPRIATENESS ........................................................................................................75 6.6 ORGANIZATIONAL APPROPRIATENESS .........................................................................................................75 6.7 SUMMARY OF THE RESULTS.........................................................................................................................76
6.7.1 Requirements that were left out from the evaluation .............................................................................77 7 CONCLUSION...................................................................................................................................................79
REFERENCES ............................................................................................................................................................81


1
1 Introduction This report presents an evaluation of the CORAS UML profile (hereafter called the UML profile). The evaluation consists of two parts:
• Modeling a benchmarking test called “the core security risk scenarios” • Assessing the quality of the UML profile using a quality evaluation framework for
modeling languages
The report is structured as follows: • Chapter 2 presents the different diagram types in the UML profile. • In Chapter 3 we present the textual description of the core security risk scenarios which is
an example of information gathered during a security risk analysis. • In Chapter 4 we use the UML profile to model the core security risk scenarios and
evaluate how well suited the language is for this task. • Chapter 5 describes the quality framework for modeling languages that have been adapted
to the security analysis domain. The framework consists of a number of detailed requirements, covering all appropriateness factors of a modeling language.
• In Chapter 6 the quality of the UML profile is evaluated against the requirements in Chapter 5, including a summary of the results.
• Chapter 7 provides concluding remarks regarding the evaluation results.

2

3
2 The CORAS UML profile The full name for the CORAS UML profile is the UML Profile for Modeling Quality of Service and Fault Tolerance Characteristics and Mechanisms [17], and it is standardized by the OMG (Object Management Group). The UML profile was developed as part of the CORAS project1. The language is based on the use case notation from the Unified Modeling Language (UML) [18].
2.1 The conceptual model The UML profile uses the official UML meta model, but with added expression power in terms of domain specific symbols and concepts related to security risk modeling. The concepts related to security risk modeling are shown in Figure 1 using UML class diagram notation. The associations between the elements have cardinalities that say how many instances of one element can be related to one instance of the other. Example: “a stakeholder has at least one and maximum infinite assets; and an asset belongs to only one stakeholder”.
Figure 1 – The conceptual model of the CORAS UML profile
We explain Figure 1 as follows: the system or part of a system, assessed during a security analysis is called the target of evaluation. Everyone with interests in the target is stakeholders of the system. System users, system maintainers and system developers are typical stakeholders. Different stakeholders often value the system differently; a system user who is dependent on the system will put a high value on it, while other stakeholders might not value the system equally high. The same entity may be assigned different values by different stakeholders. We refer to these entities with their values as assets. An asset is something to which a stakeholder directly assigns value and, hence, for which the stakeholder requires protection. An asset is therefore uniquely linked to a single stakeholder. A stakeholder wants to protect his/her assets from loosing value. Examples of assets are customer information, source code, company routines, critical system services etc. Target system stakeholders and their assets are normally identified early in the security analysis process. Figure 1 includes four important security analysis concepts related to asset: vulnerability, unwanted incident, threat and risk. A vulnerability is a weakness making an asset vulnerable to harmful actions. One may understand a vulnerability as something that is missing, e.g. if a company network lacks a firewall then this may be a vulnerability with respect to some assets in the network. An unwanted incident is an event that may harm the asset and is something we want to prevent. An unwanted incident is the result of a threat exploiting a
1 http://coras.sourceforge.net

4
vulnerability. If the company network is an asset, then an unwanted incident is unauthorized access to the network by intruders. A threat is someone or something that wants to destroy, remove or interfere with the asset and a risk is the chance of this happening. With respect to the already mentioned company network a threat may be a person who knows or discovers the vulnerability and wants to exploit it. First the company does not recognize the situation as a potential risk because nobody outside the company is aware of the security hole, but when an employee is fired, they suddenly realize that there is a risk for unauthorized network access by people familiar with the company infrastructure. The risk is characterized by a risk value (e.g. low, medium, high or other scales) which is based upon the estimated frequency for it to happen and its consequence in terms of loss of asset value. If a risk is estimated to occur two times a year and the consequence is a loss of 200000 dollars each time, the risk value could be “high” which means the risk should be treated. The treatment is applied either to the unwanted incident, the threat or the asset’s vulnerability and the desired effect is reduced frequency and/or consequence, i.e. a reduced risk value.
2.2 The diagram types In the following we describe the CORAS UML profile by means of examples of modeling taken from the profile [17]. The presentation will guide you through a complete security risk modeling process. The diagrams have not been given special names in the standard, but for simplicity we provide each diagram with a name in the figure caption. Stereotyping is a technique used in UML to add information to a model element by giving it special names or stereotyping labels. The values and scales that will be used during the security analysis are defined in the value definition diagram (Figure 2). The stereotype <<ValueDefinition>> is used for defining each value type that is used. In this example all values are enumerations, i.e., values on an ordinal scale, except for "RiskReductionRef" which defines a mapping. Alternatively, assets could have been defined in terms of monetary values, frequency as probabilities and so on.
Figure 2 – Value definitions diagram in the CORAS UML profile
Figure 3 shows the specification of an asset which is an important part of the CORAS method. An entity is a service that has some quality characterizations associated with it. The asset is defined as the quality level of the service, related to some offered service quality. The asset is owned by the stakeholder "Service provider," and its value is assigned by instantiating the value definition for asset values (Figure 3). The diagram also shows that the asset has one vulnerability: "extensive computation".

5
Figure 3 – Asset specification diagram in the CORAS UML profile
In Figure 4, the modeling of a threat is exemplified in a CORAS UML profile threat diagram. The threat "Malicious person" has the scenario (i.e. behavior) "Flooding". This threat scenario is related to the asset "QualityLevel". In this diagram, asset is shown using the UML actor stereotype only, while Figure 3 provided detailed information about the same asset.
Figure 4 – Threat diagram in the CORAS UML profile
Figure 5 illustrates how unwanted incidents are modeled with the CORAS UML profile. The unwanted incident "Denial-of-Service" may harm the asset "QualityLevel", and includes the threat scenario from the threat diagram above. A scenario may lead to another scenario, and this is shown by use of the stereotype <<Initiate>>. In this case, "Denial-of-Service" initiates the unwanted incident "Loss of customer" which may affect the asset "Customers".
Figure 5 – Unwanted incident diagram in the CORAS UML profile
6
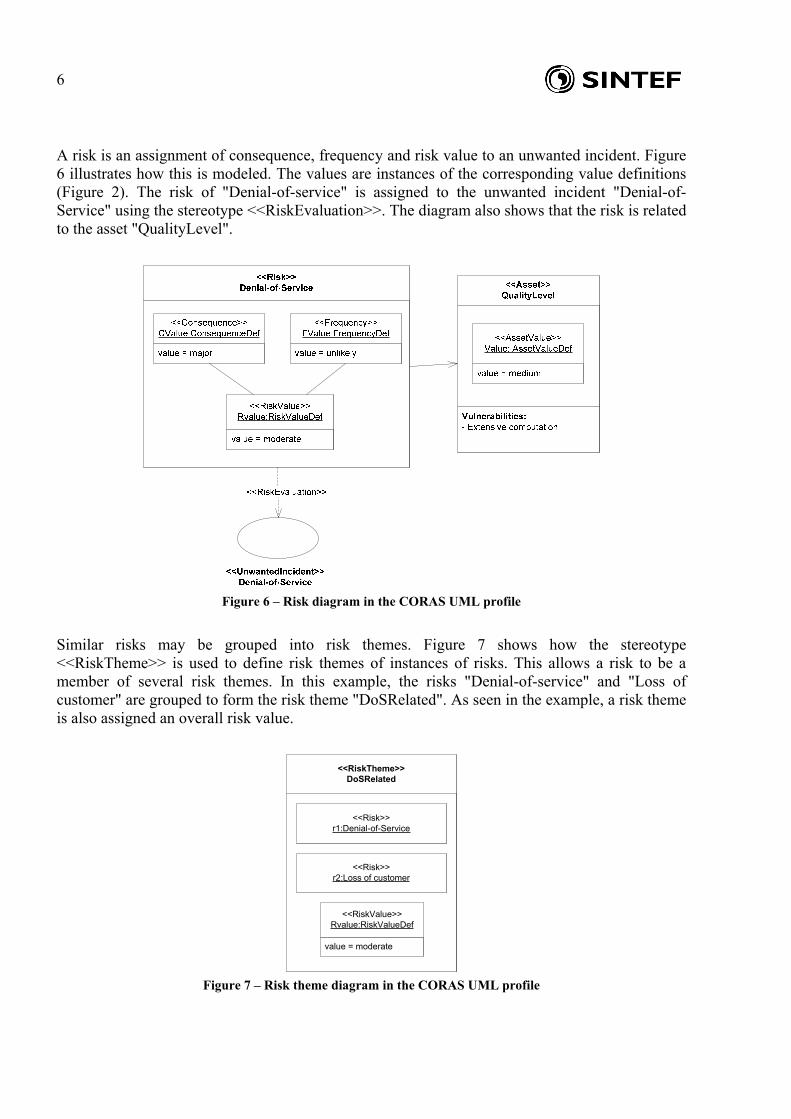
A risk is an assignment of consequence, frequency and risk value to an unwanted incident. Figure 6 illustrates how this is modeled. The values are instances of the corresponding value definitions (Figure 2). The risk of "Denial-of-service" is assigned to the unwanted incident "Denial-of-Service" using the stereotype <<RiskEvaluation>>. The diagram also shows that the risk is related to the asset "QualityLevel".
Figure 6 – Risk diagram in the CORAS UML profile
Similar risks may be grouped into risk themes. Figure 7 shows how the stereotype <<RiskTheme>> is used to define risk themes of instances of risks. This allows a risk to be a member of several risk themes. In this example, the risks "Denial-of-service" and "Loss of customer" are grouped to form the risk theme "DoSRelated". As seen in the example, a risk theme is also assigned an overall risk value.
<<RiskTheme>>DoSRelated
<<Risk>>r1:Denial-of-Service
<<Risk>>r2:Loss of customer
value = moderate
<<RiskValue>>Rvalue:RiskValueDef
Figure 7 – Risk theme diagram in the CORAS UML profile

7
Figure 8 models "Authentication" as a treatment for the unwanted incident "Denial-of-Service". The stereotype <<Transfer>> (one of the predefined treatment options in AS/NZS4360) denotes that this treatment involves transferring the responsibility for the risk to the authentication mechanism solution.
Figure 8 – Treatment diagram in the CORAS UML profile
Figure 9 shows an example of how a treatment effect is modeled. The treatment effect "DoSTransfer" is bound to the treatment "Authentication" by the use of the stereotype <<TreatmentEvaluation>>. The figure also shows that "DoSTransfer" relates to the risk "Denial-of-Service". The risk reduction, i.e. the value of the treatment effect, is a mapping from moderate to low, which means that implementing the treatment will reduce the risk value of "Denial-of-Service" from moderate to low.
Figure 9 – Treatment effect diagram in the CORAS UML profile
The CORAS UML profile is as far as we know the only modeling notation that supports the entire security analysis process step-by-step. However, there exists related notations that can be used to

8
model particular parts of the documentation in a security analysis, like reliability aspects of the system analyzed (e.g. "block diagram") or potential ways of attacking a system (e.g. "attack tree").

9
3 The modeling needs in a security analysis (the core security risk scenarios) In order to evaluate a security risk modeling language we need a benchmarking case representing core security risk scenarios to test the notation against. Through experience from several major security analyses in the SECURIS project we have gathered typical security analysis information into a complete set of scenarios from (1)-context establishment through (2)-risk identification, (3)-risk estimation, (4)-risk evaluation and (5) treatment identification. In the following we first explain the objectives and modeling needs of each phase in the security analysis process followed by the relevant security risk scenarios. For each of the five phases we explain what the purpose of the phase is and what tasks it includes. An example of typical information gathered during the phase is provided. This information is later modeled in the evaluations of both the UML profile and the current CORAS language.
3.1 Core security risk scenarios in phase I In this phase it is important to obtain an understanding of the target of analysis and its assets. The context establishment also focuses on the stakeholder’s main concerns regarding target vulnerabilities and threats. The following aspects needs to be modeled (in one or more diagrams)
• Target overview diagram: an overview of the target (system or part of a system) that will be analyzed, annotated with the stakeholder(s), the assets, the main vulnerabilities and the main threats
An overview diagram of this type will help scoping the analysis during the preliminary security analysis and ensure that the correct level of details is established at an early point in time. The assets are important in the CORAS method and therefore it can be useful to model them explicitly in a separate diagram:
• Asset diagram: describing the assets, how they relate and a ranking of their perceived importance. Assets that are affected by risks often have relations to other assets which indirectly may be affected. Even if some assets are defined to be out of the scope of the analysis, it is useful to model them to see the overall asset-picture.
Example of typical information gathered: Target description: The target of analysis is a web portal that serves as a communication medium between ordinary citizens and various public entities. The information provided is confidential personal information. The company that develops the portal will gather information from several databases within the public entities. The users authenticate themselves to the web portal using a password and username, while the authentication mechanism is simpler for the developers. Inside the developers network one uses a simple “remember-this-computer” mechanism to access the portal without being prompted for username and password each time. The users are free to set their own passwords without restrictions. Due to the importance of the information provided to its users, the service must be available 24/7. The web portal will gradually put into service and the security analysis will look at the security during development, testing and maintenance. Stakeholders, clients and other interested parties: There are two stakeholders in this case where the company management is the client of the analysis, i.e. the one paying for the analysis. The other stakeholder is the central authority who is considered to be one of the “other parties”. Other parties are not paying for the analysis itself, but have the authority to set requirements to the
10
risk acceptance levels. In this case the analysis has been initiated as a consequence of the security requirements from the central authorities and therefore they are included in the analysis:
• Company management (CM) that develops and delivers the service, and therefore bears all the costs related to the development and maintenance.
• Central authorities (CA) that regulate what information the service should provide and how it should be protected. They have the authority to close down the service if it fails to fulfill their regulations.
Assets: The assets related to the target of analysis are ranked according to its values to the client and other parties. The potential damage a threat may cause to the asset (lost asset value) is not specified in details but described shortly in the parentheses: The company management’s assets:
• CM1 – Users personal information (damage is measured by the type of information disclosure, e.g. major = the information is available to the public for one day, medium = the information is available to the public for one hour, minor = the information is available to an unauthorized employee in the company for a week)
• CM2 – Company reputation (damage is measured by the type of negative media publicity in, TV, radio, large newspaper or small newspaper, negative rumors etc.)
• CM3 – Availability of service (damage is measured as down time of the service) • CM4 – User efficiency (damage is measured as the increased effort needed to use the
functions provided by the service) The central authorities’ assets:
• CA1 – Users personal information (measured as above) • CA2 – Availability of the service (measured as above) • CA3 – User efficiency (measured as above)
The assets are not independent, meaning if one asset is harmed it may affect other assets. An in some cases an asset has to be harmed first before another asset can be harmed. In this case the first asset is called a direct asset and the second an indirect asset. The identified relations between assets are:
• Company reputation (CM2) can only be harmed if one of the other assets is harmed first. This means that CM2 is an indirect asset.
• Within the scope of the analysis, only damage to the availability of service may affect user efficiency (CM4, CA3), making User efficiency (CA3) an indirect asset.
Measures: One needs to define several different measures like asset values, likelihood of risk and consequences of risks:
• Assets: may be ranked according to their perceived importance, monetary values etc. but this is not required.
• Likelihood is measured qualitatively in three categories: seldom (= 1 time per 5 years or less), sometimes (= more than 1 time per 5 years and less than 1 time per year) and often (= 1 time per year or more). The categories may be mapped to intervals of probabilities if such data is available and appropriate to use.
• Consequence is measured qualitatively in three categories: minor, moderate and major. The consequence categories should to be mapped to actual damage for each asset. A “minor” damage could in some cases mean “system down in 2 minutes” while in other cases a minor consequence could be “system down in 4 hours”. This should be specified in
11
accordance with the client and other parties. In this generic case we will only use the category names since substituting them with numbers or text would have no impact on how it is modeled graphically.
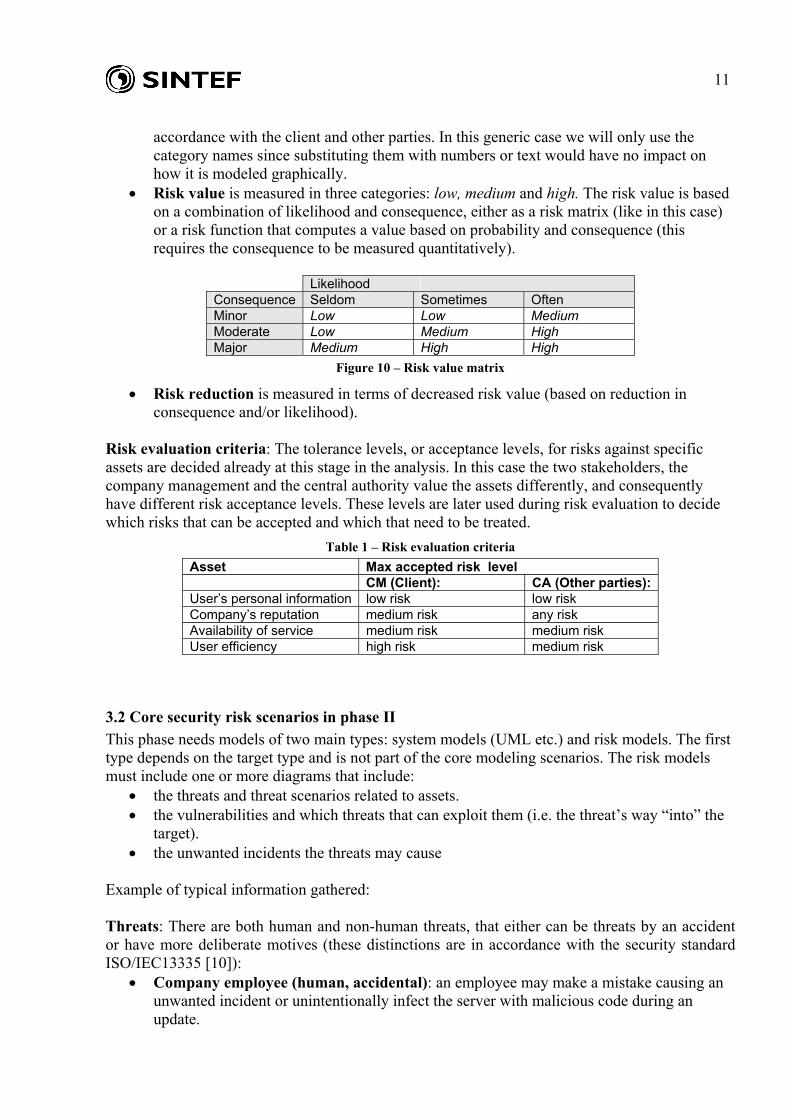
• Risk value is measured in three categories: low, medium and high. The risk value is based on a combination of likelihood and consequence, either as a risk matrix (like in this case) or a risk function that computes a value based on probability and consequence (this requires the consequence to be measured quantitatively).
Likelihood Consequence Seldom Sometimes Often Minor Low Low Medium Moderate Low Medium High Major Medium High High
Figure 10 – Risk value matrix
• Risk reduction is measured in terms of decreased risk value (based on reduction in consequence and/or likelihood).
Risk evaluation criteria: The tolerance levels, or acceptance levels, for risks against specific assets are decided already at this stage in the analysis. In this case the two stakeholders, the company management and the central authority value the assets differently, and consequently have different risk acceptance levels. These levels are later used during risk evaluation to decide which risks that can be accepted and which that need to be treated.
Table 1 – Risk evaluation criteria Asset Max accepted risk level CM (Client): CA (Other parties): User’s personal information low risk low risk Company’s reputation medium risk any risk Availability of service medium risk medium risk User efficiency high risk medium risk
3.2 Core security risk scenarios in phase II This phase needs models of two main types: system models (UML etc.) and risk models. The first type depends on the target type and is not part of the core modeling scenarios. The risk models must include one or more diagrams that include:
• the threats and threat scenarios related to assets. • the vulnerabilities and which threats that can exploit them (i.e. the threat’s way “into” the
target). • the unwanted incidents the threats may cause
Example of typical information gathered: Threats: There are both human and non-human threats, that either can be threats by an accident or have more deliberate motives (these distinctions are in accordance with the security standard ISO/IEC13335 [10]):
• Company employee (human, accidental): an employee may make a mistake causing an unwanted incident or unintentionally infect the server with malicious code during an update.

12
• Company employee (human, deliberate): an employee may use his or her access rights to intentionally cause an unwanted incident.
• Hacker (human, deliberate): a hacker may want to harm the users or the company for fun or for economical reasons (e.g. blackmailing).
• Internal infrastructure (non-human): hardware or software, part of the service, may fail and initiate unwanted incidents.
• External resources (non-human): resources that deliver data to the service. • Virus attack (non-human): an environmental circumstance outside the company’s
control. • Web portal service user (human, accidental): a user may for example use the service
incorrectly Vulnerabilities:
• Insufficient authentication mechanisms: within the company development team the authentication mechanism only requires a username and a password, no secure ID or similar identification. Inside the company network the user is not prompted for username or password when applying the “remember-me” function.
• System design weakness: the development environment used by the company has very few restrictions on what an employee may modify and does not provide warnings related to critical updates.
• Unsecured WLAN: the company has an open WLAN in their development environment which is possible to detect outside the company building.
• Too simple password: there is no control on whether the user of the portal changes his initial password, and if he does there are no rules for how the new password should look like (length and combination of letters, numbers)
• Shared infrastructure resources: the service runs on hardware or software that is shared with other less critical services. This means that if one of the other services encounter a problem it may affect the service.
• Low robustness: in cases of high traffic to the portal, the server tends to degrade in performance and response time increases.
• External resource failure: a resource that provides data to the web portal service may fail, and the service is dependent on the availability of these databases.
• Internal hardware or software failure: the internal infrastructure may fail due to hardware or software errors.
• Insufficient logging: access and modification of user’s personal information is insufficiently logged, meaning that one cannot be sure who has made the changes (i.e. the user or one of the company’s employees).
• Unclear security update routines: security updates are communicated via e-mail or the intranet and the individual employee is responsible for keeping his or her computer updated.
Unwanted incidents: The unwanted incidents that may happen are listed below followed by a description of the threat scenarios that may lead to the incident (the threat is marked with bold fonts): U1: Disclosure of users’ personal information:
1. An employee may unintentionally modify the system making it disclose personal information of one or more users to all other users.

13
2. An employee may use her or his job privileges to access users’ personal information and
use it for blackmailing (no internal logging in the company). 3. An employee in the company may use another employee’s computer that has the
“remember-me” function enabled and thereby get access to users’ personal information. 4. A hacker may attack the service via the WLAN and eavesdrop to the data transmission. 5. A hacker may exploit the simple password policy to access users’ personal information.
U2: Unauthorized modification of users’ personal information:
1. An employee may use her or his job privileges to modify users’ personal information without being logged.
2. An employee may unintentionally update the system causing it to modify or delete users’ personal information.
3. A user may enter information repeatedly if the service’s response time is too long, accidentally making the information incorrect.
4. A hacker may attack the data transmission via the WLAN and tamper with users’ personal information.
5. Virus attack on the service may cause the server to crash, deleting all active user sessions and their previous data modifications leaving the information partly incorrect.
6. A user may unintentionally enter wrong or incomplete information to the service, affecting the already stored data. Without any logging it is impossible to prove who is responsible for the changes.
U3: Unavailability of service due to hackers:
1. A hacker may cause a denial-of-service-attack to the service making it unavailable to both customers and employees.
2. A hacker may use the WLAN to obtain a password and a username and then use this to log in as an employee with authorized access to servers, and therefore be able to tamper with the server or databases.
U4: Unavailability of service due to infrastructure failure:
1. Hardware or software, part of the service infrastructure, may fail or malfunction and make the service fully or partly unavailable.
2. External sources of information may fail or malfunction making the service unavailable. U5: Unavailability of service due to malicious code:
1. An employee may unintentionally infect the server with malicious code using a false security or operative system patch.
2. A virus attack may cause extensive traffic and thereby make the service unavailable. U6: Damage to company reputation:
1. If users’ personal information is disclosed to media it may harm the company’s reputation. 2. If the possibility to modify users’ personal information is disclosed to the press it may
harm the company’s reputation. 3. If the service is unavailable it may harm the company’s reputation.
U7: Reduced user efficiency:
1. If the service is unavailable it may reduce the users’ efficiency.

14
3.3 Core security risk scenarios in phase III Estimating risks is to provide frequency and potential consequence estimates for each risk. The modeling needs in this phase are:
• a description of the risks that includes both the threat’s method(s) and which assets that are harmed (possibly with frequency estimates annotated to the threat scenarios and unwanted incidents).
• a description of the associations between an unwanted incident and an asset, representing risks. This can be annotated with the most likely consequence value (e.g. “loss of 1-10K €”, “10-20% reduced user efficiency”) reflecting the scale the asset is measured in.
If the proper data is available one can apply statistical methods and conventional modeling notations like fault trees [9] and event trees [8]. Example of typical information gathered: Each risk is given a consequence and likelihood estimate as shown in the following table.
Table 2 – Risks with consequence and likelihood estimates Risks Asset
harmed Consequence estimate
Likelihood estimate
R1CM) Disclosure of users’ personal information
CM1 Major Sometimes
R1CA) Disclosure of users’ personal information
CA1 Major Sometimes
R2CM) Unauthorized modification of user’s personal information
CM1 Major Seldom
R2CA) Unauthorized modification of user’s personal information
CA1 Major Seldom
R3CM) Unavailability of service due to hackers
CM3 Major Seldom
R3CA) Unavailability of service due to hackers
CA2 Major Seldom
R4CM) Unavailability of service due to infrastructure failure
CM3 Moderate Sometimes
R4CA) Unavailability of service due to infrastructure failure
CA2 Moderate Sometimes
R5CM) Unavailability of service due to malicious code
CM3 Moderate Seldom
R5CA) Unavailability of service due to malicious code
CA2 Moderate Seldom
R6CM) Damage to company reputation CM2 Moderate Seldom R7CM) Reduced user efficiency CM4 Minor Sometimes R7CA) Reduced user efficiency CA3 Moderate Sometimes
3.4 Core security risk scenarios in phase IV Evaluating risks is to decide which ones that are most serious. The risks are prioritized according to their gravity and the ones that can not be tolerated are subject to treatment identification. In the example case we have placed the unwanted incidents according to their likelihood and consequence which gives us a classification of the risks: white area = low risk value, light grey = medium risk value and dark grey area = high risk value.

15
In this phase we need to model an overview of the acceptable and unacceptable risks. Example of typical information gathered:
Table 3 – Risks with risk values
Risks Asset harmed
Computed risk value*
R1CM) Disclosure of users’ personal information CM1 High risk R1CA) Disclosure of users’ personal information CA1 High risk R2CM) Unauthorized modification of user’s personal information CM1 Medium risk R2CA) Unauthorized modification of user’s personal information CA1 Medium risk R3CM) Unavailability of service due to hackers CM3 Medium risk R3CA) Unavailability of service due to hackers CA2 Medium risk R4CM) Unavailability of service due to infrastructure failure CM3 Medium risk R4CA) Unavailability of service due to infrastructure failure CA2 Medium risk R5CM) Unavailability of service due to malicious code CM3 Low risk R5CA) Unavailability of service due to malicious code CA2 Low risk R6CM) Damage to company reputation CM2 Low risk R7CM) Reduced user efficiency CM4 Low risk R7CA) Reduced user efficiency CA3 Medium risk
*The risk value is set using the risk matrix in Figure 10. Comparing the risk values with the risk tolerance levels from phase 1 (Table 1) gives the following risk evaluation (shown in Figure 11):
• Company management: R1CM and R2CM are higher than the accepted risk level. • Central authorities: R1CA and R2CA are higher than the accepted risk level.
Likelihood Consequence Seldom Sometimes Often Minor R7CM
Moderate R5CM, R5CA, R6CM
R4CM, R4CA, R7CA
Major R2CM, R2CA, R3CM, R3CA R1CM, R1CA
Figure 11 – Risks placed in the risk evaluation matrix
3.5 Core security risk scenarios in phase V The purpose of this phase is to decide which risks that need treatments, i.e. are too serious to be left unattended and what kind of treatments. In this phase it is useful to have an overview diagram of the risks (including the vulnerabilities, threats and unwanted incidents involved) with risk values as input and extend it with various treatments options. One uses the risk value to decide which risks that needs to be treated. The client (the person or organization that initiated the analysis in the beginning, often identical to the stakeholder, but not always) decides the risk tolerance level. Example of typical information gathered: Treatment options:
• TO1: Upgrade to more robust infrastructure solution that have lower failure rate.

16
• TO2: Install redundant system that will take over in case of infrastructure failure or attack.
• TO3: Install improved firewall that will make it more difficult for a hacker to find vulnerabilities.
• TO4: Install intrusion detection system that will detect the attack rapidly and make it possibly to switch to manual routines.
• TO5: Remove employees’ possibility to access other users’ personal information. • TO6: Remove the unsecured WLAN. • TO7: Remove the “remember me”-function for employees. • TO8: Involve users in the development of an improved system. • TO9: Implement logging facilities. • TO10: The user and the service provider should share the responsibility for modification
of data due to user errors in combination with slow response from the service. This should be stated in a legal contract.
Treatment effects: Estimated effects on likelihood and/or consequence are shown in the table below. These are only for example purposes and have not been estimated on basis of any expert judgments or other sources of information.
Table 4 – Treatment effects R1CM R1CA R2CM R2CA TO1 - - Reduce likelihood Reduce likelihood TO2 - - Reduce consequence Reduce consequenceTO3 Reduce likelihood Reduce likelihood Reduce likelihood Reduce likelihood TO4 Reduce consequence Reduce consequence Reduce consequence
Reduce likelihood Reduce consequenceReduce likelihood
TO5 Reduce likelihood Reduce likelihood Reduce likelihood Reduce likelihood TO6 Reduce likelihood Reduce likelihood Reduce likelihood Reduce likelihood TO7 Reduce likelihood Reduce likelihood Reduce consequence Reduce consequenceTO8 Reduce likelihood Reduce likelihood Reduce likelihood Reduce likelihood TO9 Reduce likelihood Reduce likelihood Reduce consequence
Reduce likelihood Reduce consequenceReduce likelihood
TO10 - Reduce consequence Reduce consequence The individual treatment options’ effects on risk values are shown in the table below (unchanged risk values means that the single treatment is not sufficient to reduce the risk value, “-” means the treatment is not applied for the risk). Since these estimates are included in the core security risk scenarios with the purpose of showing how they are dealt with in the models, they are only example estimates without a thorough rationale.
Table 5 – Treatment effects on risk values R1CM R1CA R2CM R2CA TO1 - - medium low medium low TO2 - - medium low medium low TO3 high high high high medium medium medium medium TO4 high high high high medium medium medium medium TO5 high high high high medium medium medium medium TO6 high low high low medium low medium low TO7 high high high high medium medium medium medium TO8 high medium high medium medium medium medium medium TO9 high medium high medium medium low medium low TO10 - - medium medium medium medium

17
The final treatments selected for implementation are typically decided upon after a cost-benefit assessment of each of the treatment options. However, such an assessment is outside the scope of this core security risk scenario example.

18

19
4 Modeling the core security risk scenarios with the UML profile In this section the core security risk scenarios from the previous section are modeled using the UML profile. We have used the graphical icons that are suggested in [16], although they are not defined as part of the official UML profile.
4.1 Phase I: establishing the context A natural task of this phase is to model the target of evaluation. This can be done in any kind of modeling language according to the analysis scope, the client or modeler’s preferences etc. An evaluation of the target models is however not part of our work. After the presentation of the target, the core security risk scenarios define the stakeholders of the analysis and their assets. Using the asset diagram from the UML profile, this information is illustrated in Figure 12. This diagram contains information about each asset’s ranking according to importance. As we see, when two stakeholders have the same asset, the asset must be modeled twice even though it represents the same entity. This has to do with the definition of asset used in the UML profile, where an asset is a part or feature of the system (entity) which is assigned value by a stakeholder. Relations between the different entities are modeled at the top of the diagram. An arrow means that the entity is a part of the entity it points at.
Figure 12 – Asset diagram
The scales for asset value, likelihood and consequences, and risk values are defined in the value definition diagram (Figure 13). Since the exact asset values are not specified in the core security scenarios we use “1” as the highest asset value, “4” as the lowest. This is denoted by specifying “decreasing” for the 1-4 scale. In the same manner it is specified that “minor” and “seldom” are the lowest categories in the consequence and likelihood scales, and “low” is the lowest risk value. Any risk reduction that comes as a result from applying risk treatments is measured as reduced risk value as specified in the “RiskReductionDef”.

20
Figure 13 – Value definition diagram
4.1.1 Evaluation of the modeling effort Using the UML profile, it was possible to model:
• Each of the assets including their ranking. • The stakeholders interests’ in the assets.
It was unclear or impossible to model:
• The distinction between direct and indirect assets within the asset diagram. • The risk acceptance level set by each client for each asset.
This lack of a method of illustrating direct and indirect assets means that one cannot specify how damage to one asset may cause damage to other assets. However, the UML profile provides an option to model relationships between concepts like assets by using other UML notations, e.g. class diagrams. The standard does not provide any examples of this, but it means that one can create a hierarchy of assets and show the relationships between them. The UML profile also suggests modeling value definitions like shown in Figure 13, and the relationships between the assets as shown over the assets in Figure 12. The usefulness of this is unclear to the modeler, and we refer to the diagram evaluation in Sect. 6.4 where value definition diagrams are discussed.
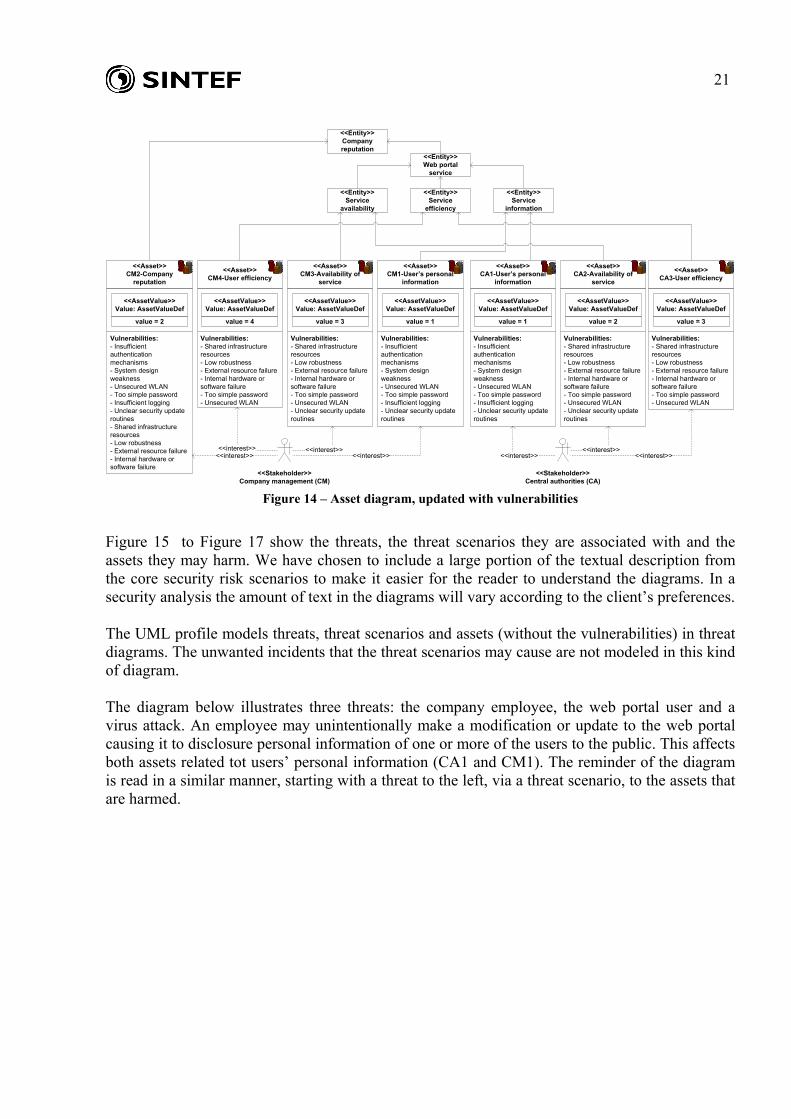
4.2 Phase II: identifying risks This section concentrates on modeling the threat scenarios and unwanted incidents identified during the structured brainstorming (called incident scenario in the UML profile). The vulnerabilities that are found are added to the asset diagram from the previous phase (Figure 14).
21
<<Asset>>CM1-User’s personal
information
Vulnerabilities:- Insufficient authentication mechanisms- System design weakness- Unsecured WLAN- Too simple password- Insufficient logging- Unclear security update routines
<<AssetValue>>Value: AssetValueDef
<<Entity>>Web portal
service
<<Stakeholder>>Company management (CM)
value = 1
<<Asset>>CM2-Company
reputation
Vulnerabilities:- Insufficient authentication mechanisms- System design weakness- Unsecured WLAN- Too simple password- Insufficient logging- Unclear security update routines- Shared infrastructure resources- Low robustness- External resource failure- Internal hardware or software failure
<<AssetValue>>Value: AssetValueDef
value = 2
<<Asset>>CM4-User efficiency
Vulnerabilities:- Shared infrastructure resources- Low robustness- External resource failure- Internal hardware or software failure- Too simple password- Unsecured WLAN
<<AssetValue>>Value: AssetValueDef
value = 4
<<Asset>>CM3-Availability of
service
Vulnerabilities:- Shared infrastructure resources- Low robustness- External resource failure- Internal hardware or software failure- Too simple password- Unsecured WLAN- Unclear security update routines
<<AssetValue>>Value: AssetValueDef
value = 3
<<Entity>>Service
information
<<Stakeholder>>Central authorities (CA)
<<Asset>>CA2-Availability of
service
Vulnerabilities:- Shared infrastructure resources- Low robustness- External resource failure- Internal hardware or software failure- Too simple password- Unsecured WLAN- Unclear security update routines
<<AssetValue>>Value: AssetValueDef
value = 2
<<Asset>>CA1-User’s personal
information
Vulnerabilities:- Insufficient authentication mechanisms- System design weakness- Unsecured WLAN- Too simple password- Insufficient logging- Unclear security update routines
<<AssetValue>>Value: AssetValueDef
value = 1
<<interest>><<interest>>
<<interest>><<interest>><<interest>><<interest>>
<<Asset>>CA3-User efficiency
Vulnerabilities:- Shared infrastructure resources- Low robustness- External resource failure- Internal hardware or software failure- Too simple password- Unsecured WLAN
<<AssetValue>>Value: AssetValueDef
value = 3
<<interest>>
<<Entity>>Company reputation
<<Entity>>Service
efficiency
<<Entity>>Service
availability
Figure 14 – Asset diagram, updated with vulnerabilities
Figure 15 to Figure 17 show the threats, the threat scenarios they are associated with and the assets they may harm. We have chosen to include a large portion of the textual description from the core security risk scenarios to make it easier for the reader to understand the diagrams. In a security analysis the amount of text in the diagrams will vary according to the client’s preferences. The UML profile models threats, threat scenarios and assets (without the vulnerabilities) in threat diagrams. The unwanted incidents that the threat scenarios may cause are not modeled in this kind of diagram. The diagram below illustrates three threats: the company employee, the web portal user and a virus attack. An employee may unintentionally make a modification or update to the web portal causing it to disclosure personal information of one or more of the users to the public. This affects both assets related tot users’ personal information (CA1 and CM1). The reminder of the diagram is read in a similar manner, starting with a threat to the left, via a threat scenario, to the assets that are harmed.

22
<<HumanThreat>>Company Employee <<Asset>>
CA1-Users’ personal
information
<<ThreatScenario>>An employee may unintentionally modify the system causing it todisclose one or more users’ personal information to all other users.
<<ThreatScenario>>An employee may unintentionally update the system causing it to modify or delete users’ personal information.
<<Asset>>CM1-Users’
personal information
<<HumanThreat>>Web portal
service user
<<ThreatScenario>>A user may enter information repeatedly if the service’s response time is too long, accidentally making the information incorrect.
<<ThreatScenario>>A user may unintentionally enter wrong or incomplete information to the service affecting on the already stored data. Wwithout any logging it is impossible to prove who is responsible for the changes.
<<ThreatScenario>>Virus attack on the service may cause the server to crash, deleting all active user sessions and their previous data modifications leaving the information partly incorrect.
<<Virus>>Virus attack
Figure 15 – Threat diagram: non-human + human accidental threats

23
<<Insider>>Company Employee
I
<<Asset>>CA1-Users’
personal information
<<ThreatScenario>>An employee may use her or his job privileges to modify users’ personal information without being logged.
<<ThreatScenario>>An employee in the company may use another employee’s computer that has the “remember-me” function enabled and thereby get access to users’ personal information.
<<ThreatScenario>>An employee may use her or his job privileges to access users’ personal information and use it for blackmailing (no internal logging in the company).
<<Asset>>CM1-Users’
personal information
<<Attacker>>Hacker
A
<<ThreatScenario>>A hacker may exploit the simple password policy to access users’ personal information.
<<ThreatScenario>>A hacker may attack the service via the WLAN and eavesdrop onthe data transmission.
<<ThreatScenario>>A hacker may attack the data transmission via the WLAN and tamper with users’ personal information.
Figure 16 – Threat diagram: human deliberate threats

24
<<Asset>>CA2-
Availability of service
<<ThreatScenario>>Hardware or software, which is part of the service infrastructure, may fail or malfunction and make the service fully or partly unavailable.
<<Attacker>>Hacker
A
<<ThreatScenario>>A hacker may cause a denial-of-service-attack to the service making it unavailable to both customers and employees.
<<ThreatScenario>>A hacker may use the WLAN to obtain a password and a username and then use this to log in as an employee with authorized access to servers, and therefore be able to tamper with the server or databases.
<<ThreatScenario>>An employee may unintentionally infect the server with malicious code using a false security or operative system patch.
<<ThreatScenario>>A virus attack may cause extensive traffic and thereby make the service unavailable.
<<HumanThreat>>Company employee
<<Asset>>CM3-
Availability of service
<<Virus>>Virus attack
<<SystemThreat>>Internal infrastructure
<<SystemThreat>>External resources
<<ThreatScenario>>External sources of information may fail or malfunction making the service unavailable.
Figure 17 – Threat diagram: all threats for “availability of service”
It is unclear whether three of the assets shown in Figure 18 should be modeled in this type of diagram since it seems like the notation only shows the assets that are directly associated with a threat scenario. Neither “CA3-User efficiency”, “CM4-User efficiency” nor “CM2-Company reputation” are considered direct assets, which means that they are only harmed if the service itself is harmed first.
Figure 18 – Assets left out of the diagrams

25
Figure 19 - Figure 23 show how the relation between threat scenarios, unwanted incidents, assets and vulnerabilities may be modeled (NB: the UML profile calls unwanted incidents for incident scenarios). The threat scenarios and assets from the threat diagrams are all repeated and the diagrams are structured according to each of the unwanted incidents (incident scenarios). All the vulnerabilities an asset is subject to are listed below the asset. This means that a vulnerability may be replicated in several diagrams. In the diagram below we see that U1: “Disclosure of users’ personal information” may be caused by five different threat scenarios, and it may harm two assets.
Figure 19 – Unwanted incident diagram: disclosure of users’ personal information
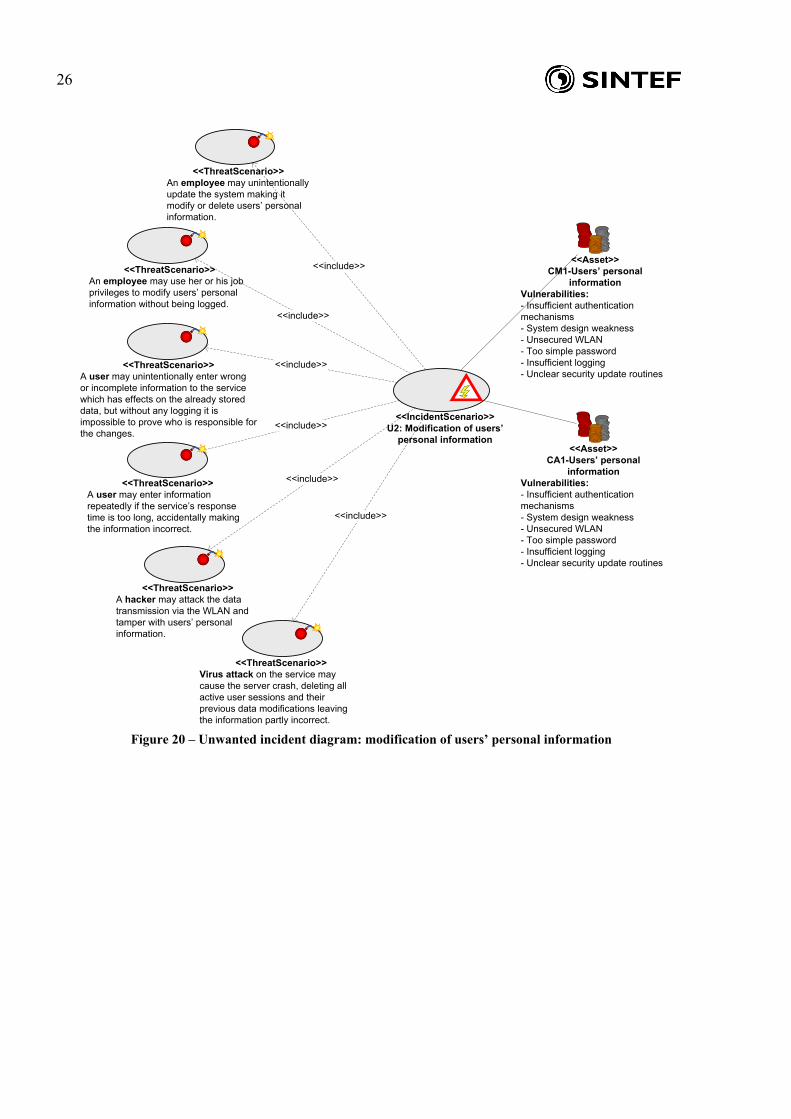
26
<<IncidentScenario>>U2: Modification of users’
personal information
<<include>>
<<include>>
<<include>>
<<include>>
<<include>>
<<include>>
<<Asset>>CM1-Users’ personal
informationVulnerabilities:- Insufficient authentication mechanisms- System design weakness- Unsecured WLAN- Too simple password- Insufficient logging- Unclear security update routines
<<Asset>>CA1-Users’ personal
informationVulnerabilities:- Insufficient authentication mechanisms- System design weakness- Unsecured WLAN- Too simple password- Insufficient logging- Unclear security update routines
<<ThreatScenario>>An employee may use her or his job privileges to modify users’ personal information without being logged.
<<ThreatScenario>>A hacker may attack the data transmission via the WLAN and tamper with users’ personal information.
<<ThreatScenario>>An employee may unintentionally update the system making it modify or delete users’ personal information.
<<ThreatScenario>>A user may enter information repeatedly if the service’s response time is too long, accidentally making the information incorrect.
<<ThreatScenario>>A user may unintentionally enter wrong or incomplete information to the service which has effects on the already stored data, but without any logging it is impossible to prove who is responsible for the changes.
<<ThreatScenario>>Virus attack on the service may cause the server crash, deleting all active user sessions and their previous data modifications leaving the information partly incorrect.
Figure 20 – Unwanted incident diagram: modification of users’ personal information

27
Figure 21 – Unwanted incident diagram: unavailability of service
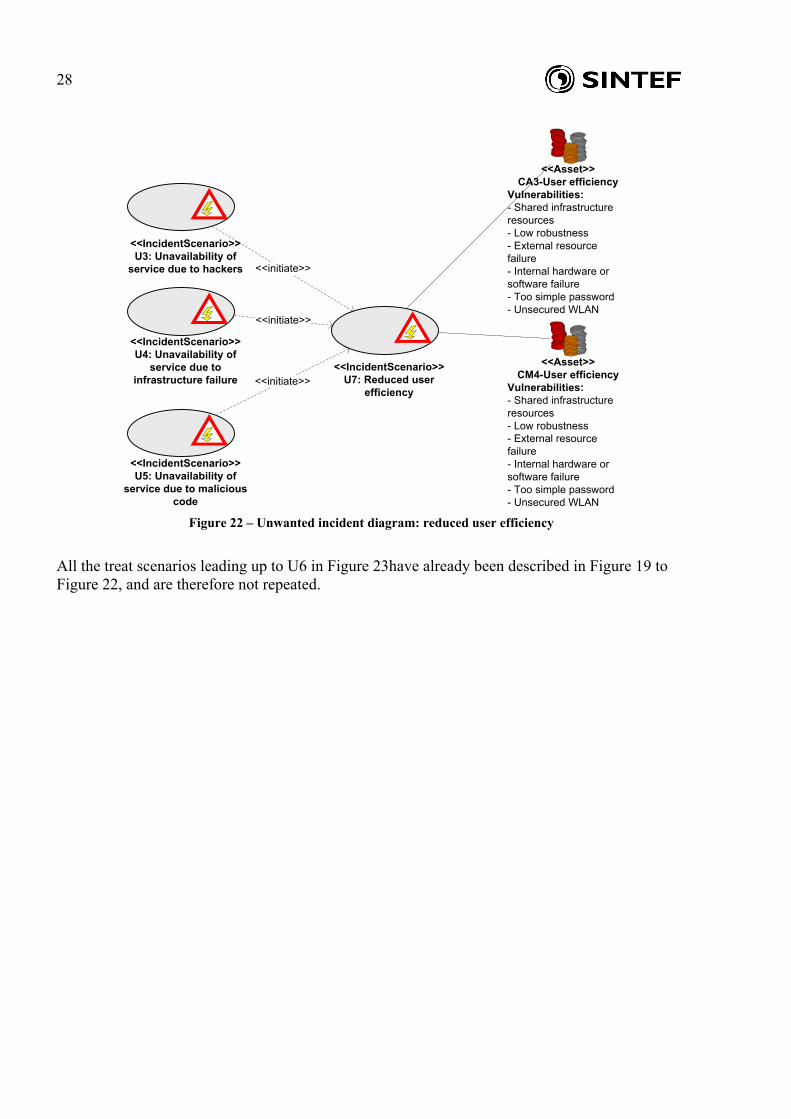
When an unwanted incident may lead to other unwanted incidents, this is modeled as shown in Figure 22. The threat scenarios leading up to U3, U4 and U5 in Figure 22 are not repeated since they were modeled in Figure 21.
28
<<IncidentScenario>>U3: Unavailability of
service due to hackers
<<IncidentScenario>>U4: Unavailability of
service due to infrastructure failure
<<IncidentScenario>>U7: Reduced user
efficiency
<<initiate>>
<<initiate>>
<<IncidentScenario>>U5: Unavailability of
service due to malicious code
<<initiate>>
<<Asset>>CA3-User efficiency
Vulnerabilities:- Shared infrastructure resources- Low robustness- External resource failure- Internal hardware or software failure- Too simple password- Unsecured WLAN
<<Asset>>CM4-User efficiency
Vulnerabilities:- Shared infrastructure resources- Low robustness- External resource failure- Internal hardware or software failure- Too simple password- Unsecured WLAN
Figure 22 – Unwanted incident diagram: reduced user efficiency
All the treat scenarios leading up to U6 in Figure 23have already been described in Figure 19 to Figure 22, and are therefore not repeated.
29
<<IncidentScenario>>U6: Damage to company
reputation
<<initiate>>
<<IncidentScenario>>U3: Unavailability of
service due to hackers
<<initiate>>
<<IncidentScenario>>U4: Unavailability of
service due to infrastructure failure
<<initiate>>
<<Asset>>CM2-Company
reputationVulnerabilities:- Insufficient authentication mechanisms- System design weakness- Unsecured WLAN- Too simple password- Insufficient logging- Unclear security update routines- Shared infrastructure resources- Low robustness- External resource failure- Internal hardware or software failure<<IncidentScenario>>
U5: Unavailability of service due to malicious
code
<<initiate>>
<<IncidentScenario>>U1: Disclosure of
users’personal information
<<IncidentScenario>>U2: Modification of users’
personal information <<initiate>>
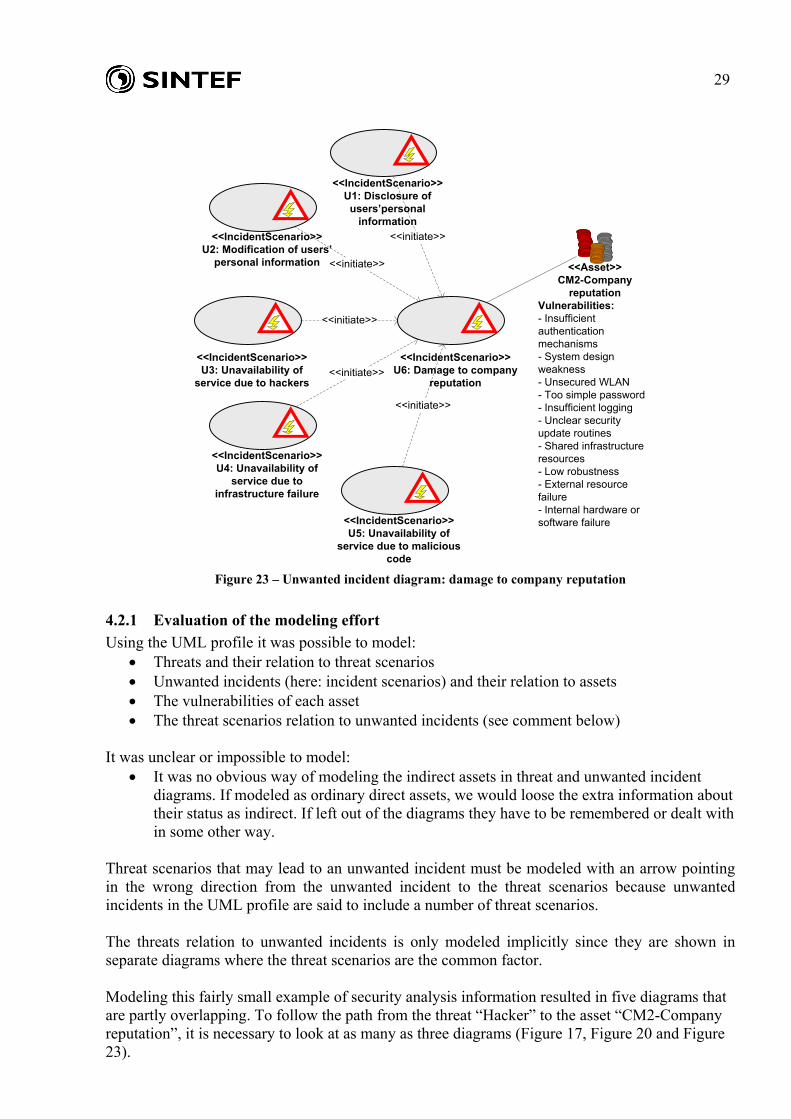
Figure 23 – Unwanted incident diagram: damage to company reputation
4.2.1 Evaluation of the modeling effort Using the UML profile it was possible to model:
• Threats and their relation to threat scenarios • Unwanted incidents (here: incident scenarios) and their relation to assets • The vulnerabilities of each asset • The threat scenarios relation to unwanted incidents (see comment below)
It was unclear or impossible to model:
• It was no obvious way of modeling the indirect assets in threat and unwanted incident diagrams. If modeled as ordinary direct assets, we would loose the extra information about their status as indirect. If left out of the diagrams they have to be remembered or dealt with in some other way.
Threat scenarios that may lead to an unwanted incident must be modeled with an arrow pointing in the wrong direction from the unwanted incident to the threat scenarios because unwanted incidents in the UML profile are said to include a number of threat scenarios. The threats relation to unwanted incidents is only modeled implicitly since they are shown in separate diagrams where the threat scenarios are the common factor. Modeling this fairly small example of security analysis information resulted in five diagrams that are partly overlapping. To follow the path from the threat “Hacker” to the asset “CM2-Company reputation”, it is necessary to look at as many as three diagrams (Figure 17, Figure 20 and Figure 23).

30
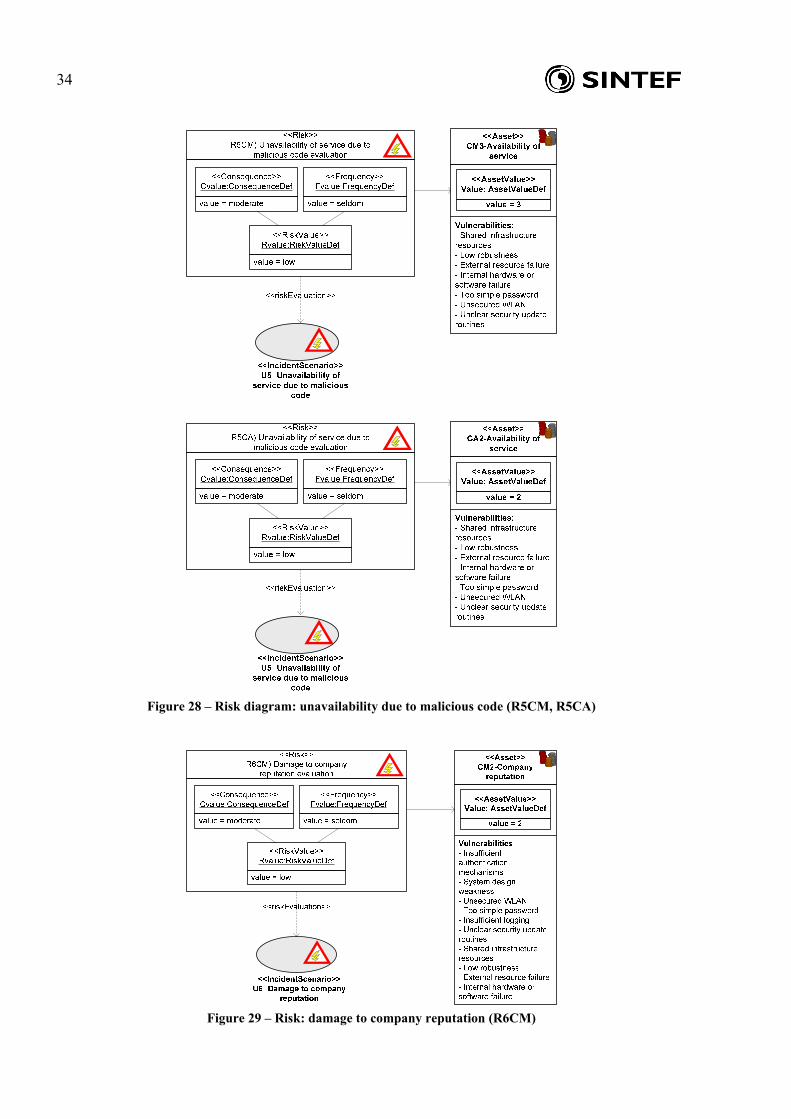
4.3 Phase III & IV: estimating and evaluating risks Figure 24 to Figure 30 show how risks are specified using the UML profile. The risks that are modeled are taken from Table 2 and Table 3. Every unwanted incident (incident scenario)-asset relation is defined as a risk where the risk value is based on the likelihood and consequence.
Figure 24 – Risk diagram: disclosure of users’ personal information (R1CA, R1CM)

31
<<Risk>>
R2CM) Unauthorized modification of users’ personal information evaluation
value = major
<<Consequence>>Cvalue:ConsequenceDef
value = seldom
<<Frequency>>Fvalue:FrequencyDef
value = medium
<<RiskValue>>Rvalue:RiskValueDef
<<IncidentScenario>>U2: Modification of users’
personal information:
<<IncidentScenario>>U2: Modification of users’
personal information:
<<Risk>>R2CA) Unauthorized modification of users’
personal information evaluation
value = major
<<Consequence>>Cvalue:ConsequenceDef
value = seldom
<<Frequency>>Fvalue:FrequencyDef
value = medium
<<RiskValue>>Rvalue:RiskValueDef
<<riskEvaluation>>
<<riskEvaluation>>
<<Asset>>CM1-User’s personal
information
Vulnerabilities:- Insufficient authentication mechanisms- System design weakness- Unsecured WLAN- Too simple password- Insufficient logging- Unclear security update routines
<<AssetValue>>Value: AssetValueDef
value = 1
<<Asset>>CA1-User’s personal
information
Vulnerabilities:- Insufficient authentication mechanisms- System design weakness- Unsecured WLAN- Too simple password- Insufficient logging- Unclear security update routines
<<AssetValue>>Value: AssetValueDef
value = 1
Figure 25 – Risk diagram: modification of users’ personal information (R2CM, R2CA)

32
Figure 26 – Risk diagram: unavailability due to hackers (R3CM, R3CA)
33
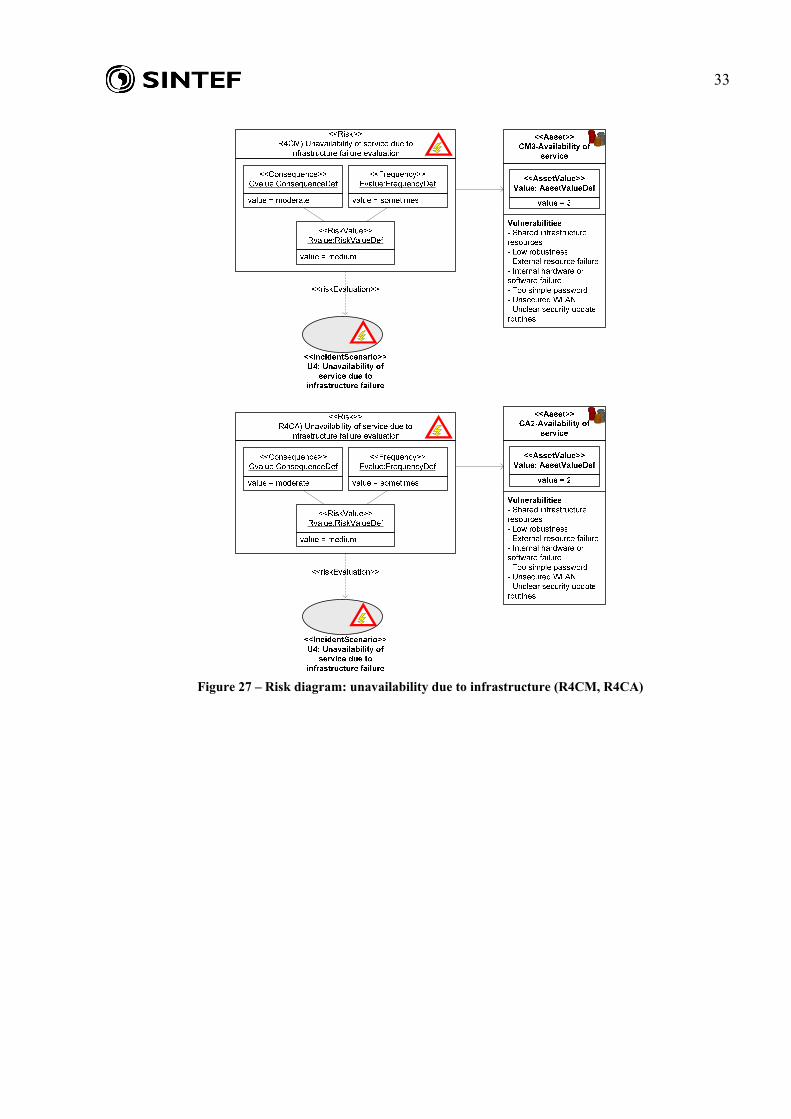
Figure 27 – Risk diagram: unavailability due to infrastructure (R4CM, R4CA)
34
Figure 28 – Risk diagram: unavailability due to malicious code (R5CM, R5CA)
Figure 29 – Risk: damage to company reputation (R6CM)

35
<<Risk>>
R7CM) Reduced user efficiencyevaluation
value = minor
<<Consequence>>Cvalue:ConsequenceDef
value = sometimes
<<Frequency>>Fvalue:FrequencyDef
value = low
<<RiskValue>>Rvalue:RiskValueDef
<<IncidentScenario>>U7: Reduced user
efficiency
<<riskEvaluation>>
<<Risk>>R7CA) Reduced user efficiency
evaluation
value = moderate
<<Consequence>>Cvalue:ConsequenceDef
value = sometimes
<<Frequency>>Fvalue:FrequencyDef
value = medium
<<RiskValue>>Rvalue:RiskValueDef
<<IncidentScenario>>U7: Reduced user
efficiency
<<riskEvaluation>>
<<Asset>>CM4-User efficiency
Vulnerabilities:- Shared infrastructure resources- Low robustness- External resource failure- Internal hardware or software failure- Too simple password- Unsecured WLAN
<<AssetValue>>Value: AssetValueDef
value = 4
<<Asset>>CA3-User efficiency
Vulnerabilities:- Shared infrastructure resources- Low robustness- External resource failure- Internal hardware or software failure- Too simple password- Unsecured WLAN
<<AssetValue>>Value: AssetValueDef
value = 3
Figure 30 – Risk diagram: reduced user efficiency (R7CM, R7CA)
When consulting the risk acceptance criteria (Table 1) from the context identification we see that only the risks R1CA, R1CM, R2CA and R2CM are above the acceptable risk level and consequently need to be evaluated further to find appropriate treatments.
4.3.1 Evaluation of the modeling effort Using the UML profile it was possible to model:
• The information in Table 2 (risks, assets harmed, consequence- and likelihood estimates) was modeled using the UML profile’s risk diagrams.
It was unclear or impossible to model:
• It was not possible to model risks in the already existing diagrams. • It was not possible to annotate existing diagrams with consequence- and likelihood
estimates. • It was not possible to differentiate between acceptable and non-acceptable risks in the
models.

36
The thirteen risks resulted in as many as 7 risk diagrams. Also in these diagrams, information that already has been modeled is repeated (vulnerabilities). To find out which threats that may cause a risk one has trace the path backwards from unwanted incident via each of its threat scenarios to find the initiating threats. This makes it difficult to get a complete overview of the risk picture. When the diagrams lacks the possibility to highlight unacceptable from acceptable risks one is dependent on yet another way of representing these findings. Traditionally risk matrixes have been used for this purpose, but there is no reason for not modeling this directly in the diagrams.
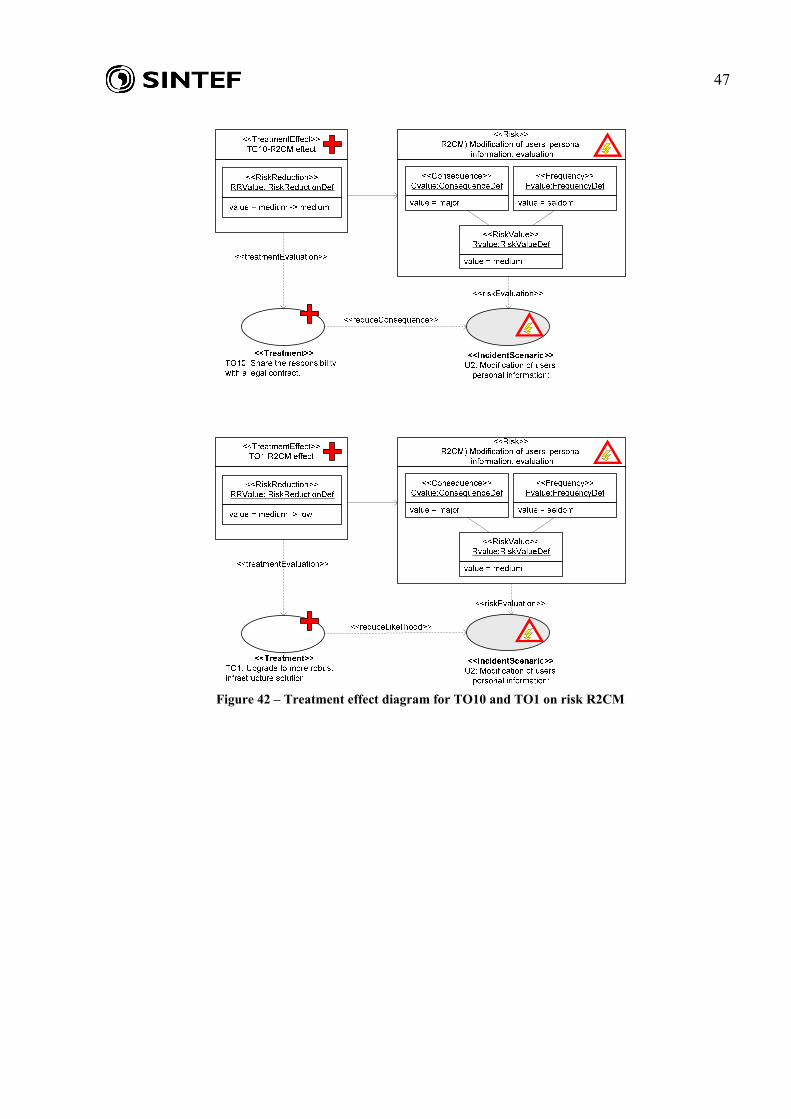
4.4 Phase V: identifying treatments In phase five, the modeling consists of illustrating the treatments for unacceptable risks, their effects and the resulting risk values after treatment. Figure 31 - Figure 34 show where the treatments can be applied to risks that are above the tolerated risk level, while Figure 36 - Figure 40 illustrate the effects of the treatments. Each treatment points to the place in the diagram where it should be applied, and the anticipated effect to the risk’s consequence or likelihood is annotated to the treatment arrow. Exactly where the treatments should be applied is underspecified in the core security risk scenarios. In the following diagrams we have added them where we feel they are appropriate.
<<reduceLikelihood>>
<<reduceLikelihood>>
<<reduceLikelihood>>
<<Treatment>>TO5: Remove access to other users’ personal information.
<<Treatment>>TO7: Remove the “remember me”-function.
<<IncidentScenario>>U1: Disclosure of
users’personal information
<<Asset>>CM1-Users’ personal
informationVulnerabilities:- Insufficient authentication mechanisms- System design weakness- Unsecured WLAN- Too simple password- Insufficient logging- Unclear security update routines
<<include>>
<<include>>
<<include>>
<<include>>
<<include>>
<<Asset>>CA1-Users’ personal
informationVulnerabilities:- Insufficient authentication mechanisms- System design weakness- Unsecured WLAN- Too simple password- Insufficient logging- Unclear security update routines
<<ThreatScenario>>An employee may unintentionally modify the system making it disclose one or more users’ personal information to all other users.
<<ThreatScenario>>A hacker may exploit the simple password policy to access users’ personal information.
<<ThreatScenario>>A hacker may attack the service via the WLAN and eavesdrop to the data transmission.
<<ThreatScenario>>An employee in the company may use another employee’s computer that has the “remember-me” function enabled and thereby get access to users’ personal information.
<<ThreatScenario>>An employee may use her or his job privileges to access users’ personal information and use it for blackmailing (no logging internal in the company).
<<HumanThreat>>Company Employee
<<Insider>>Company Employee
I
<<Treatment>>TO8: Involve users in development
<<reduceLikelihood>>
<<Treatment>>TO9: Implement logging facilities.
<<reduceLikelihood>>
<<Treatment>>TO5: Remove access other users’ personal information.
Figure 31 – Treatment diagram for R1CM, R1CA (focusing on employees as threats)

37
Figure 32 – Treatments for R1CM, R1CA (focusing on hackers as threats)
38
<<reduceLikelihood>><<Treatment>>
TO5: Remove access toother users’ personal information.
<<Insider>>Company Employee
I
<<IncidentScenario>>U2: Modification of users’
personal information
<<include>>
<<include>>
<<include>>
<<include>>
<<include>>
<<include>>
<<Asset>>CM1-Users’ personal
informationVulnerabilities:- Insufficient authentication mechanisms- System design weakness- Unsecured WLAN- Too simple password- Insufficient logging- Unclear security update routines
<<Asset>>CA1-Users’ personal
informationVulnerabilities:- Insufficient authentication mechanisms- System design weakness- Unsecured WLAN- Too simple password- Insufficient logging- Unclear security update routines
<<ThreatScenario>>An employee may use her or his job privileges to modify users’ personal information without being logged.
<<ThreatScenario>>A hacker may attack the data transmission via the WLAN and tamper with users’ personal information.
<<ThreatScenario>>An employee may unintentionally update the system making it modify or delete users’ personal information.
<<ThreatScenario>>A user may enter information repeatedly if the service’s response time is too long, accidentally making the information incorrect.
<<ThreatScenario>>A user may unintentionally enter wrong or incomplete information to the service which has effects on the already stored data, but without any logging it is impossible to prove who is responsible for the changes.
<<ThreatScenario>>Virus attack on the service may cause the server crash, deleting all active user sessions and their previous data modifications leaving the information partly incorrect.
<<Treatment>>TO7: Remove the “remember me”-function
<<Treatment>>TO8: Involve users in development
<<Treatment>>TO9: Implement logging facilities.
<<reduceConsequence>>
<<reduceConsequence>><<ReduceLikelihood>>
<<reduceLikelihood>> <<HumanThreat>>Company Employee
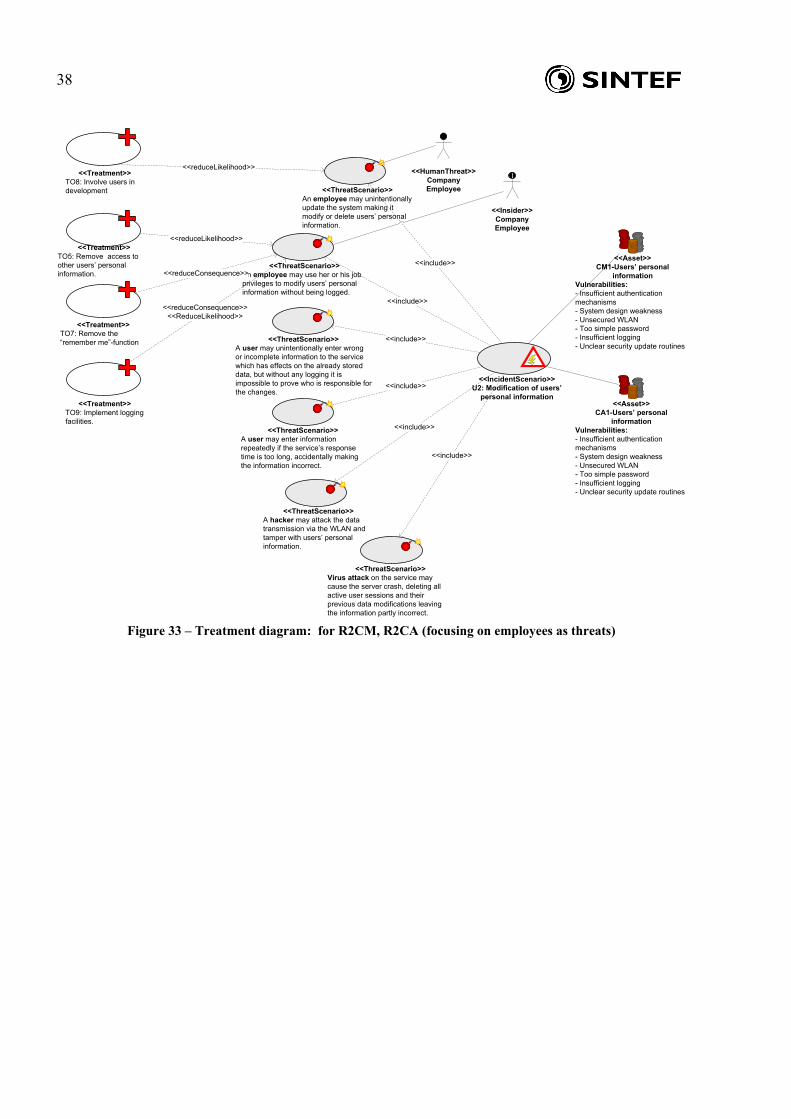
Figure 33 – Treatment diagram: for R2CM, R2CA (focusing on employees as threats)

39
Figure 34 – Treatment diagram: for R2CM, R2CA (focusing on users as threats)

40
Figure 35 – Treatment diagram: for R2CM, R2CA (focusing on virus and hackers as threats)
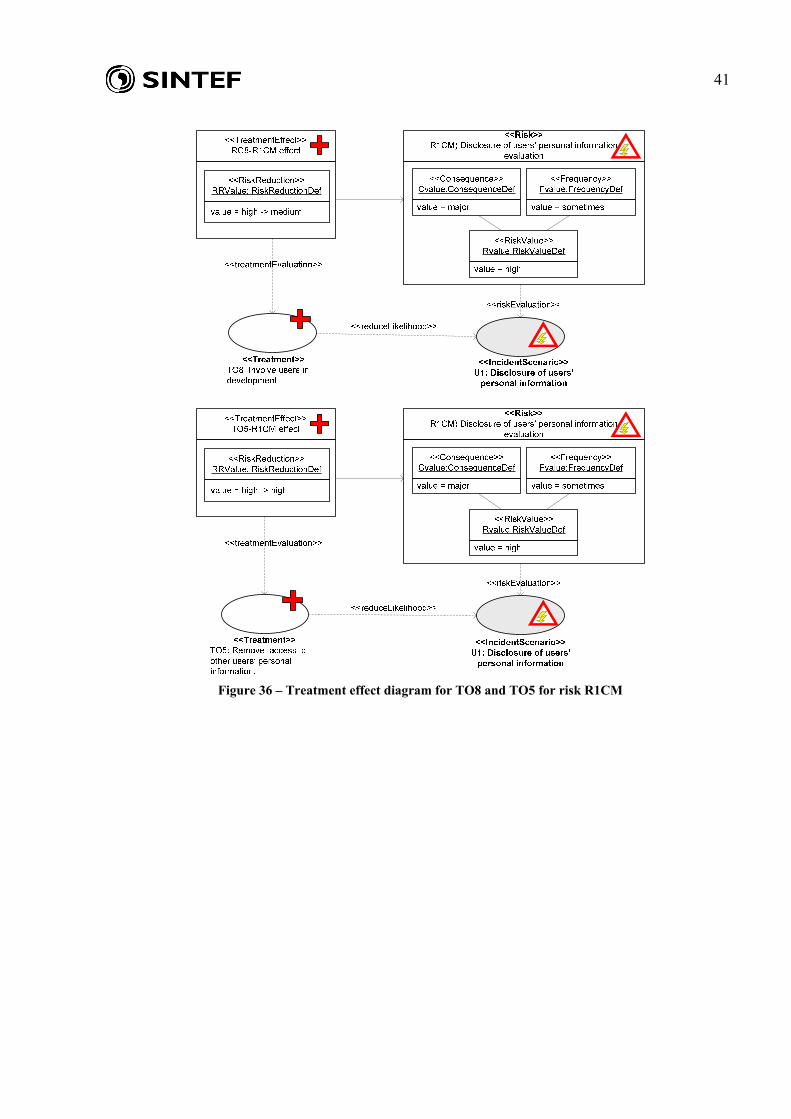
The next step after treatment modeling is to model the treatments’ effects on the risk values. The effects on the risk’s consequence and/or likelihood are taken from Table 4 and Table 5. Since the treatments are directed towards threat scenarios that lead to the various risks, the treatment effects are implicitly transferred over to the unwanted incidents (incident scenarios). Let us then explain the first treatment effect in the following figure. The treatment TO8: “Involve users in development” is expected to reduce the likelihood of the unwanted incident U1: “Disclosure of users’ personal information”. From the risk evaluation, this risk has been estimated to occur “sometimes” with a “major” consequence and therefore has the risk value “high”. The estimated effect of TO8 on this risk is a reduction in risk value from “high” to “medium”.
41
Figure 36 – Treatment effect diagram for TO8 and TO5 for risk R1CM
42
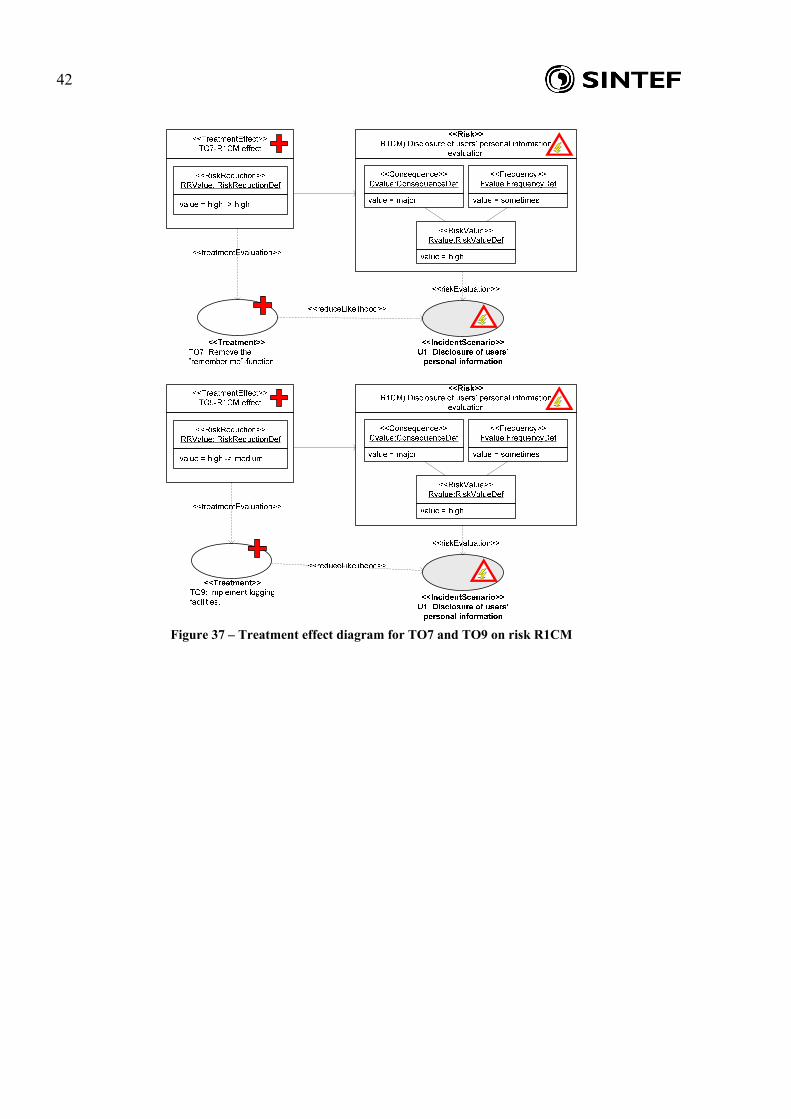
Figure 37 – Treatment effect diagram for TO7 and TO9 on risk R1CM

43
<<IncidentScenario>>U1: Disclosure of users’
personal information
<<Risk>>R1CA) Disclosure of users’ personal information
evaluation
value = major
<<Consequence>>Cvalue:ConsequenceDef
value = sometimes
<<Frequency>>Fvalue:FrequencyDef
value = high
<<RiskValue>>Rvalue:RiskValueDef
<<riskEvaluation>>
<<reduceLikelihood>>
<<reduceLikelihood>>
<<IncidentScenario>>U1: Disclosure of users’
personal information
<<Risk>>R1CA) Disclosure of users’ personal information
evaluation
value = major
<<Consequence>>Cvalue:ConsequenceDef
value = sometimes
<<Frequency>>Fvalue:FrequencyDef
value = high
<<RiskValue>>Rvalue:RiskValueDef
<<riskEvaluation>>
<<TreatmentEffect>>RO8-R1CA effect
<<RiskReduction>>RRValue: RiskReductionDef
value = high -> medium
<<treatmentEvaluation>>
<<TreatmentEffect>>TO5-R1CA effect
<<RiskReduction>>RRValue: RiskReductionDef
value = high -> high
<<treatmentEvaluation>>
<<Treatment>>TO5: Remove access to other users’ personal information.
<<Treatment>>TO8: Involve users in development
Figure 38 – Treatment effect diagram for TO8 and TO5 on risk R1CA

44
<<IncidentScenario>>U1: Disclosure of users’
personal information
<<Risk>>R1CA) Disclosure of users’ personal information
evaluation
value = major
<<Consequence>>Cvalue:ConsequenceDef
value = sometimes
<<Frequency>>Fvalue:FrequencyDef
value = high
<<RiskValue>>Rvalue:RiskValueDef
<<riskEvaluation>>
<<Treatment>>TO9: Implement logging facilities.
<<TreatmentEffect>>TO9-R1CA effect
<<RiskReduction>>RRValue: RiskReductionDef
value = high -> medium
<<treatmentEvaluation>>
<<reduceLikelihood>>
<<reduceLikelihood>>
<<Risk>>R1CA) Disclosure of users’ personal information
evaluation
value = major
<<Consequence>>Cvalue:ConsequenceDef
value = sometimes
<<Frequency>>Fvalue:FrequencyDef
value = high
<<RiskValue>>Rvalue:RiskValueDef
<<riskEvaluation>>
<<IncidentScenario>>U1: Disclosure of users’
personal information
<<TreatmentEffect>>TO7-R1CA effect
<<RiskReduction>>RRValue: RiskReductionDef
value = high -> high
<<treatmentEvaluation>>
<<Treatment>>TO7: Remove the “remember me”-function.
Figure 39 – Treatment effect diagram for TO7 and TO9 on risk R1CA

45
<<Risk>>
R2CM) Modification of users’ personal information:evaluation
value = major
<<Consequence>>Cvalue:ConsequenceDef
value = seldom
<<Frequency>>Fvalue:FrequencyDef
value = medium
<<RiskValue>>Rvalue:RiskValueDef
<<IncidentScenario>>U2: Modification of users’
personal information:
<<riskEvaluation>>
<<treatmentEvaluation>>
<<TreatmentEffect>>TO8-R2CM effect
<<RiskReduction>>RRValue: RiskReductionDef
value = medium -> medium
<<Risk>>R2CM) Modification of users’ personal information:
evaluation
value = major
<<Consequence>>Cvalue:ConsequenceDef
value = seldom
<<Frequency>>Fvalue:FrequencyDef
value = medium
<<RiskValue>>Rvalue:RiskValueDef
<<IncidentScenario>>U2: Modification of users’
personal information:
<<riskEvaluation>>
<<treatmentEvaluation>>
<<TreatmentEffect>>TO5-R2CM effect
<<RiskReduction>>RRValue: RiskReductionDef
value = medium -> medium
<<reduceLikelihood>>
<<reduceLikelihood>>
<<Treatment>>TO5: Remove access to other users’ personal information.
<<Treatment>>TO8: Involve users in development
Figure 40 – Treatment effect diagram for TO8 and TO5 on risk R2CM

46
<<Risk>>R2CM) Modification of users’ personal
information: evaluation
value = major
<<Consequence>>Cvalue:ConsequenceDef
value = seldom
<<Frequency>>Fvalue:FrequencyDef
value = medium
<<RiskValue>>Rvalue:RiskValueDef
<<IncidentScenario>>U2: Modification of users’
personal information:
<<riskEvaluation>>
<<treatmentEvaluation>>
<<TreatmentEffect>>TO9-R2CM effect
<<RiskReduction>>RRValue: RiskReductionDef
value = medium -> low
<<Risk>>R2CM) Modification of users’ personal
information: evaluation
value = major
<<Consequence>>Cvalue:ConsequenceDef
value = seldom
<<Frequency>>Fvalue:FrequencyDef
value = medium
<<RiskValue>>Rvalue:RiskValueDef
<<IncidentScenario>>U2: Modification of users’
personal information:
<<riskEvaluation>>
<<treatmentEvaluation>>
<<TreatmentEffect>>TO7-R2CM effect
<<RiskReduction>>RRValue: RiskReductionDef
value = medium -> medium
<<reduceConsequence>>
<<reduceLikelihood>><<reduceConsequence>>
<<Treatment>>TO7: Remove the “remember me”-function
<<Treatment>>TO9: Implement logging facilities.
Figure 41 – Treatment effect diagram for TO7 and TO9 on risk R2CM
47
Figure 42 – Treatment effect diagram for TO10 and TO1 on risk R2CM

48
<<Risk>>R2CM) Modification of users’ personal
information: evaluation
value = major
<<Consequence>>Cvalue:ConsequenceDef
value = seldom
<<Frequency>>Fvalue:FrequencyDef
value = medium
<<RiskValue>>Rvalue:RiskValueDef
<<IncidentScenario>>U2: Modification of users’
personal information:
<<riskEvaluation>>
<<treatmentEvaluation>>
<<TreatmentEffect>>TO4-R2CM effect
<<RiskReduction>>RRValue: RiskReductionDef
value = medium -> medium
<<Risk>>R2CM) Modification of users’ personal
information: evaluation
value = major
<<Consequence>>Cvalue:ConsequenceDef
value = seldom
<<Frequency>>Fvalue:FrequencyDef
value = medium
<<RiskValue>>Rvalue:RiskValueDef
<<IncidentScenario>>U2: Modification of users’
personal information:
<<riskEvaluation>>
<<treatmentEvaluation>>
<<TreatmentEffect>>TO2-R2CM effect
<<RiskReduction>>RRValue: RiskReductionDef
value = medium -> low
<<reduceLikelihood>>
<<reduceConsequence>><<reduceLikelihood>>
<<Treatment>>TO2: Install redundant system
<<Treatment>>TO4: Install intrusion detection system
Figure 43– Treatment effect diagram for TO2 and TO4 on risk R2CM

49
Figure 44 – Treatment effect diagram for TO6 and TO3 on risk R2CM
To make the modeling complete according to the UML profile, all the treatment effects for R2CA should also be modeled. In practice this is almost a duplication of Figure 40 - Figure 44 since the treatment effects are identical as for risk R2CM (only the risk identifier is different). We feel this is unnecessary since the reader by now has been given a thorough introduction to treatment effect modeling with the UML profile.
4.4.1 Evaluation of the modeling effort Using the UML profile it was possible to model:
• It was able to express all the information in this phase (some diagrams were omitted to save space)
It was unclear or impossible to model:
• -
It was positive that the UML profile was able to express all the information, but in order to do so it was necessary to use 14 figures (approx. 9 pages) for the information that is originally presented
50
on 1,5 A4 page in Sect. 3.5. If we were to complete the diagrams (i.e. include R2CA) it would have required another five figures. See Sect. 6.4 for a discussion of these diagram types.
51
5 A Language Quality Framework Modeling is a commonly used technique within system development and there exist a number of modeling languages which are more or less suitable for this purpose. Graphical models are often used to ease the understanding of complex systems. In a security analysis one deals with critical systems that may contain confidential data, provide critical services or have a high demand for availability. A correct understanding of the system and its risks is highly important, and this is where graphical models are found useful. The participants in the analysis are normally competent in different aspects of the target and may therefore view it differently. This may cause problems in understanding each other or problems in agreeing on the appropriate level of precision or scope of the analysis. By graphically modeling the target with its threats, assets and risks one can easily reduce the number of misunderstandings since this clarifies these aspects. The challenge is to find a modeling language that people understand, preferably suitable for use in a computerized modeling tool. The quality of a modeling language depends on several factors: a language which is excellent for one task may be inappropriate for a different task. Through our experience with modeling in industrial security risk analyses, we have developed a set of detailed requirements to this kind of modeling language. To structure these requirements we have implemented them in the quality framework for modeling languages called SEQUAL developed by Krogstie, Sindre, Lindland and Sølvberg [11-15]. The framework can be used when selecting between different languages, investigating possible improvement areas for a language, or as the basis requirements to a new modeling language. The framework deals with both the quality of a particular model, and with the quality of modeling languages. In this work we will only use the part related to modeling languages, or what we call the language’s “appropriateness factors”. The appropriateness factors of a modeling language are related to the modeling task definition, i.e. the goal of the modeling task (G), its domain (D), the knowledge of the people involved in the modeling task (Ks, Km), the interpretation of the models (I), the language that is used (L) and the tools (T) (illustrated in Figure 45). Figure 45 also shows the graphical model (model externalization, M), but as mentioned above, this work will not go into the quality aspects of a concrete model. In this evaluation, the purpose is to evaluate the CORAS UML profile’s appropriateness factors for security risk modeling in structured brainstorming sessions. The six appropriateness factors are:
• Domain appropriateness: to be appropriate for the domain, the language should include all concepts necessary to express anything within the domain that it is meant for.
• Participant language knowledge appropriateness: to be appropriate for the participants’ language knowledge, the concepts and constructs in the languages should be as close as possible to the participants’ understanding of the “real world”.
• Knowledge externalizability appropriateness: to be appropriate for the knowledge externalizability the language should be able to express all aspects of the domain that the users are interested in.
• Comprehensibility appropriateness: to have an appropriate comprehensibility the language should be understandable for the users.
• Technical actor interpretation appropriateness: to be considered appropriate for the technical actors (the computerized tools) the language should have a syntax and semantics that a computerized tool can understand.

52
• Organizational appropriateness: to be appropriate for the organization the language should fit into existing technology, work processes and modeling methods that are used by the organization.
Figure 45 – The quality framework
5.1 Adapting SEQUAL to the security analysis setting Before assessing the appropriateness of a language, it is necessary to define the modeling task for which the modeling language should be used.
Table 6 – Modeling task definition The goal of modeling (G) the goals of the modeling task (normally organizational) The modeling domain (D) the domain, i.e., the set of all statements which can be stated about the
situation at hand. The relevant explicit knowledge (Ks) Km (a subset of Ks)
the relevant explicit knowledge of the set of stakeholders being involved in modeling (the audience). A subset of the audience is those actively involved in modeling, and their knowledge is denoted Km.
The social actor interpretation (I)
the social actor interpretation, i.e., the set of all statements which the audience thinks an externalized model consists of.
The model externalization (M)
the externalized model, i.e., the set of all statements in someone’s model of part of the perceived reality, written in a language.
The language extension (L) the language extension, i.e., the set of all statements that are possible to make according to the graphemes, vocabulary, and syntax of the modeling languages used
The technical actor interpretation (T)
the technical actor interpretation, i.e., the statements in the model as ‘interpreted’ by different model activators (for example modeling tools).
In order to reflect the security analysis setting, or more specifically the structured brainstorming setting, the definition in Table 6 is translated from its general form into a more specialized form (Table 7). A structured brainstorming is a methodical “walk-through” of a target system with purpose of identifying as much information about the target as possible for each step. The brainstorming is a group exercise involving highly skilled people with competence in relevant parts of the target of analysis.

53
Table 7 – Modeling task definition in a security analysis setting
G: to reduce the effort needed to identify and understand the overall risk picture for the system assessed in a structured brainstorming, and thereby contribute to increased control of the risks for the organization D: the security risks towards the system assessed. Ks: the knowledge of the people who contributes to the models in the structured brainstorming. This will typically be experts on various parts of the system assessed, in addition to the analysis leader and the secretary. Km: the knowledge of the security analysis leader (or analysis secretary) which gathers information from the participants and models it during the structured brainstorming. I: the interpretation of models seen from the participant’s point of view (e.g. system owner’s, developer’s and user’s). M: the model of the system’s risks. L: all the statements that are possible to make in the CORAS UML profile according to its definition. T: the statements in the model that can be interpreted by other modeling tools or specialized security analysis tools. In the following we discuss our requirements to a security risk modeling language for each of the appropriateness factor categories. Throughout the evaluation we will refer to the modeling task definition using the letters from Table 7 (modeling domain = D, modeling goal = G etc.). Within each category we have included a number of extra requirements based on experiences with the CORAS security analysis method in industrial field trials. The requirements are not assigned explicit weights to show their importance since they all represent desired language features, instead we use the terms “must” and “should” to indicate their importance (requirements described with “must” are more required than those explained with “should”). The requirements are numbered sequential and “S-x” means that the requirement originates directly from SEQUAL, while “C-x” means that the requirement comes from user-experiences with the CORAS method.
5.2 Domain appropriateness The domain appropriateness of a modeling language relates to how much of a domain one is capable of modelling (defined in the language’s internal representation) and how it is expressed in a diagram (defined in the language’s external representation). In information modeling there are several types of modeling perspectives to choose between. According to Krogstie and Sølvberg [15] there are 7 general modeling perspectives: structural, functional, behavioral, rule-oriented, object-oriented, language-action-oriented [22] and role & actor-oriented modeling perspective. Security risk modeling has many similarities with information modeling. Information modeling often describes the behavior of a workflow or process, whereas security risk modeling deals with describing the “workflow” of a threat that initiates an unwanted incident. For security risk modeling we have identified the need of describing both how incidents can happen, who’s initiating them and what will be affected. There is also a need for showing more static relations that can specify dependencies between assets, treatments, risks and more. Based on this we require our modeling language to provide the following modeling perspectives:

54
Table 8 – Domain appropriateness: modeling perspectives Requirements Explanation C-1 Structural
modeling
L must provide a structural modeling perspective. Structural modeling is used to illustrate e.g. how assets relate to each other, how one can group similar risks or treatments, how vulnerabilities relate to assets and more.
C-2 Behavioral modeling
L must provide a behavioral modeling perspective. The behavior modeling perspective shows how a threat can initiate one or more unwanted incidents to harm assets, or how various treatments can be applied to risks and more.
SEQUAL distinguishes between symbol and concept: a concept is a phenomena/something one wants to express, while a symbol is the graphical notation used to model the concept. In terms of requirements to domain appropriateness, L must support the concepts and relations according to the revised CORAS conceptual model for security analysis terminology (specified in [5]). By enforcing this requirement we will insure that L covers all terms and relations that we find relevant for security analysis. To fulfill this requirement L must be able to express what is described in the explanation of the conceptual model, i.e. which concepts relate to each other and in what way.
Table 9 – Domain appropriateness: concepts
Requirements Explanation C-3 Asset L must include the concept “asset”. An asset is something to which an
organization directly assigns value and, hence, for which the organization requires protection [3]. The concept is very central in a security analysis. It should be up to the modeler to decide how much details the specification of an asset should include. Often an asset can be affected by other assets, e.g. a company’s reputation is affected by the quality of the product they deliver, the service they provide, the employee’s satisfaction etc. The modeler should have the option to create groups of assets that are similar or affect each other.
C-4 Vulnerability L must include the concept “vulnerability”. A vulnerability is a weakness with respect to an asset or group of assets that can be exploited by one or more threats [10]. Vulnerabilities are critical parts of the system and important to establish early in the security analysis. Vulnerability can be composed into composite vulnerabilities according to the chosen level of detail. It would be useful to group similar vulnerabilities since they may be treated in the same way.
C-5 Risk L must include the concept “risk”. A risk is the chance of something happening that will have an impact upon objectives [1]. Similar risks may be grouped and risk can be composed into composite risks.
C-6 Stakeholder L must include the concept “stakeholder”. Stakeholders are those people and organizations who may affect, be affected by, or perceive themselves to be affected by, a decision or activity [1]. By identifying a system’s stakeholders one gets an overview of e.g. which people or systems that use it or depend on its functions.
C-7 Threat L must include the concept “threat”. A threat is a potential cause of an unwanted incident which may result in harm to a system or organization [10]. It should be possible to specify whether a threat is human or non-human. Other more specified threats can be specified within these categories, e.g. deliberate threats and non-deliberate (accidental), but we do not find it necessary to define these as separate concepts in L.

55
C-8 Unwanted incident L must include the concept “unwanted incident”. An unwanted incident
may result in harm to a system or organization [10]. An unwanted incident can vary in the level of details and L should provide the possibility to model both very detailed and more general. An unwanted incident may very well consist of more incidents.
C-9 Treatment L must include the concept “treatment”. A treatment is the selection and implementation of appropriate options for dealing with risk [1]. It should be possible to specify the treatment strategy. According to [1] treatment strategies can be categorized into four groups: 1) reduce likelihood of risk, 2) reduce consequence of risk, 3) transfer risk in full or part, 4) avoid risk or 5) retain risk. We do not require L to support exactly these categories, but there should be an option to specify a treatment in more detail if the user finds it necessary. In our opinion treatment strategies are of two types, either their purpose is to reduce the likelihood of a risk, or reduce its consequence(s). Transferring a risk partly or full can e.g. mean outsourcing the risky part to someone more qualified (reduce the likelihood of risk) or buying insurance against the risk (reduce the consequence of the risk). The strategy of avoiding a risk is really reducing its likelihood or consequence to zero. Based on this a treatment can either be regarded as preventive (i.e. reduce the likelihood) or repairing (i.e. reduce the consequence) and these interpretations should be included in the treatment concept in L. While [1] uses the term treatment, [10] uses the term safeguard defined as a practice, procedure or mechanism that reduces risk. These terms are two names for the same concept. One could possibly argue that safeguard is more representative for a protection mechanism against threats that already exist in the system than treatment, which sounds like something applied after an unwanted incident. Establishing existing safeguards is relevant both in context- and treatment identification.
C-10 Likelihood/ frequency/ probability
L must include the concepts “likelihood, frequency, probability”. Likelihood, frequency and probability are all measures for variants of “how likely is it that this will happen”. L must support all these measure-types. Likelihood is a qualitative or quantitative description of frequency or probability [1]. Frequency and probability are quantitative measures with a higher degree of precision. Frequency is an exact number of occurrences, while probability is a number between 0-1 where 0 = unlikely and 1 = will happen (in practice one normally says 50% instead of 0.5). Depending on the statistical data available for the security analysis the user should decide which measure to use.
C-11 Consequence L must include the concept “consequence”. A consequence is the outcome of an event expressed qualitatively or quantitatively, being a loss, injury, disadvantage or gain. There may be a range of possible outcomes associated with an event [1] Sometimes consequence is called “Impact” but have the same meaning: the result of an unwanted incident [10].
C-12 Threat scenario L must include the concept “threat scenario”. A threat scenario is a description of how a threat may lead to an unwanted incident by exploiting vulnerabilities. A threat scenario must be able to express all from very detailed scenarios to vaguer scenario descriptions. A threat scenario can be a chain of threat scenarios, meaning that a threat scenario can lead to one or more scenarios depending on the level of details required. A threat scenario may be given a likelihood estimate. This is used in cases where the likelihood of an unwanted incident cannot be decided precisely but is best estimated from the likelihoods of each threat scenario that may lead to the incident.

56
C-13 The relations in the CORAS conceptual model
L must support the explicit relations in the conceptual model, but it must also be possible to specify relations between concepts that are not part of the model (e.g. threat scenario). The symbols used to represent these relations are discussed in the symbol section. The following relations must be supported:
1. A stakeholder can be associated with one or more assets, but an asset can only be associated with one stakeholder
2. An asset is associated with at least one vulnerability, a vulnerability can be associated with more than one asset.
3. A threat must exploit (go via) at least one vulnerability in order to harm an asset.
4. A threat is associated with at least one unwanted incident via one or more threat scenarios. An unwanted incident is associated with at least one threat.
5. A threat is associated with at least one asset via threat scenario(s) and unwanted incident. An asset is associated with at least one threat via unwanted incident and threat scenario(s).
6. A threat is indirectly associated with a risk through its relation to unwanted incident (not explicitly shown in the model). This means that all threats are associated with at least one risk and every risk is associated with at least one threat.
7. An unwanted incident is indirectly associated with at least one asset through risk. In special cases one may experience that an asset is not related to any unwanted incidents, meaning that it has not been identified any risks for this asset.
8. A treatment is always related to one or more risks. 9. A treatment is indirectly related to an unwanted incident, threat,
or vulnerability (or a combination of these) via risk (not explicitly shown in the model). Still it should be possible to model a treatment towards one of these concepts.
10. A risk is always associated with one asset, while an asset may be affected by many risks.
11. A risk always includes estimates of likelihood and consequence.12. A risk always includes one unwanted incident, while an
unwanted incident may participate in several risks, meaning that there must be a relation between risk and unwanted incident.
C-14 And/or operators
There must exist and/or operators in L. In practice an unwanted incident often requires two or more threat scenarios to occur simultaneously before it occurs. To handle these cases we require L to provide “and” and “or” operators. If the outcomes of two or more events are joined in an and-operator they all are required to initiate a new event. If the operator is an or-operator it is sufficient that only one event occurs to initiate a new event. Operators will provide additional information about the behavior in the threat scenarios, specifying the alternative ways a threat can behave. Operators will also increase the possibilities of using conventional fault tree techniques to compute the likelihood of risks.
C-15 L must be independent of the target that is assessed
This requirement means that L must be useful for describing any type of security critical system. It should not have any concepts that depend on a specific system type or technology. Since the CORAS method can be applied to any security critical target, the modeling language should have the same level of flexibility.
C-16 Region There must exist a concept similar to region. A region is a logical or physical part of the target that can be used as the link between the risk specific documentation and the target documentation. This is useful for structuring the documentation and helps the reader understand the risk models.

57
As already mentioned, SEQUAL distinguishes between concepts and symbols. To be a language with high domain appropriateness L must provide symbols for the set of the concepts identified in the discussion above:
Table 10 – Domain appropriateness: symbols Requirements Explanation C-17 Asset There must be a symbol for asset. C-18 Vulnerability There must be a symbol for vulnerability. C-19 Aggregated vulnerability There should be symbols for aggregated vulnerabilities C-20 Risk There must be a risk symbol that can show a risk value. C-21 Risk theme There should be symbols for risk themes (similar types of risks). C-22 Aggregated risk There should be symbols for aggregated risk. C-23 Stakeholder There must be a stakeholder symbol. C-24 Threat There must be a general threat symbol. C-25 Human threat
C-26 Non-human threat
As a minimum L should provide symbols for human- and non-human threat. Any other type of threat can be specified within one of these categories and extra symbols can be added if desired.
C-27 Threat scenario There must be a symbol for threat scenario. The symbol should have the option to illustrate its estimated likelihood.
C-28 Unwanted incident There must be a symbol for unwanted incident. C-29 Treatment There must be a symbol for treatment. C-30 Treatment type It should be possible to specify the type of treatment (e.g. preventive or
repairing) C-31 Likelihood, frequency,
probability There should be a symbol for likelihood/frequency/probability that could be used if particular attention to this concept is required.
C-32 Consequence There should be a symbol for consequence that could be used if particular attention to this concept is required.
C-33 Association type We must have both directed (arrow) and undirected associations (line only). A concept may initiate another, a concept may affect another, or one concept has some relation to another without specifying direction. It should also be possible to assign these relations with a description. We need:
a) an undirected association between two symbols (a line with no arrow ends):
b) a directed association pointing from X to Y, with the option to annotate it with a description (e.g. “initiates”, “affects”, “reduces frequency” etc.):
C-34 Operators a) There must be an and-symbol for fault tree modeling where two or more relations are joined together and initiate a new event(s) in the meaning “if both A and B, then C”.
b) There must be an or-symbol for fault tree modeling where two or more relations are joined and initiate to a new event(s) in the meaning “if either A or B, then C”.
C-35 Region There should be a symbol for logical or physical regions that can be used to specify target.
5.3 Participant language knowledge appropriateness Participant language knowledge appropriateness is related to L and Ks. Ks is the participant’s knowledge about D and L (including all other modeling languages). M (the external representation) is made on the basis of Ks. In this setting “participants” means those who are involved in modeling, but without doing the actual modeling (e.g. expert participants in the
58
brainstorming). In order for L to be appropriate for the participant’s language knowledge, L’s internal representation should not conflict with the participants understanding of D, and M should relate to D in an intuitive manner (this is also relevant for comprehensibility appropriateness). With respect to participant knowledge appropriateness we have identified the following requirements:
Table 11 – Participant language knowledge appropriateness Requirements Explanation S-1 L’s external
representation must imitate the real world
If the interpretation of M corresponds to the participants’ understanding of the real world (Ks) there will be less confusion and misunderstandings. An example is: “an unwanted incident affects three assets simultaneously” this can be modeled several ways but to avoid conflicts with the modelers understanding of the real world it should clearly illustrate the “simultaneously” aspect.
S-2 The symbols used in L must be based on the most common interpretation of the concept-symbol
This means that the symbols used in L represent D better or are more intuitive than other symbols that could have been used.
C-36 L must be understandable for people unfamiliar with modeling and without specific training
M made with L should be easy to understand (read), even for people without modeling experience. To find how much effort is needed to learn L, one should base oneself upon experiences with similar modeling languages like UML use cases, activity diagrams or flow charts.
5.4 Knowledge externalizability appropriateness This appropriateness factor focuses on how Km (relevant modeler knowledge) may be articulated in L (the modeling language). Is it possible for the modeler to express his or her knowledge about e.g. the target threats with L? To achieve high score on knowledge externalizability appropriateness the modeler (the one who creates the actual model M) should be able to use Km to learn L faster, be able to express all Km with L, and design better M.
Table 12 – Knowledge externalizability appropriateness
Requirements Explanation S-3 L must help externalize
tacit knowledge This means that L should use well-known metaphors/analogies to explain/model more complicated relations to lower the effort needed to understand the models
S-4 It must be easy to model as part of actual work
The modeling should not require extensive training and heavy tool-support. The models should be easy and quick to create as part of the security analysis, and update during maintenance of the system. This means that modeling should not only be done before (planning) or after (post-hoc rationalization), but support interactive modeling.
C-37 It must be possible to model fault trees with L
Fault tree analysis (FTA)[9] is a well known risk analysis technique and it must be possible to draw fault tree diagrams using L. A conventional fault tree diagram has a restricted expressiveness which means that the notation is a subset of L.
C-38 It should be possible to model event trees with L
Event tree analysis (ETA) [8] is a well known risk analysis technique and it should be possible to draw event tree diagrams using L.

59
5.5 Comprehensibility appropriateness Comprehensibility appropriateness relates L (the modeling language) and I (the social actor’s interpretation) and focuses on how easy it is to interpret M (models) made with L. There are requirements both to the internal (Table 13) and external representation of L (Table 14).
Table 13 – Comprehensibility appropriateness: internal representation Requirements Explanation C-39 L must build on most-
common I of risk specific concepts
If the interpretation of the terms corresponds to the participants’ intuitive understanding of security analysis specific terms, there will be less confusion and misunderstandings.
S-5 The concepts in L must be general rather than specialized
The more delimited D is the more specialized concepts can be used, but the use of specialization should correspond to the specialization level in the security analysis, i.e. if the analysis has a high-level scope, M should also be high-level. The security analysis domain is in itself specialized, but within this domain we want L to be general (i.e. independent of target type, analysis scope and technology).
S-6 The concepts in L must be composable
L should make it possible to group related statements in a natural way. This means that we use compose in the sense “aggregate”, meaning a form for grouping, e.g. vulnerabilities may be aggregated into a group of vulnerabilities etc.
S-7 L must be flexible in precision
L must be able to express both precise knowledge and more vague information, meaning it must include both precise and vague constructs. Initially in a security analysis one often deals with incomplete or incorrect information about threats or assets, but they still must be modeled to provide an overview (even though they may be changed as more information is gathered). In some cases the natural language description of the modeling element will decide the model’s precision level.
S-8 If the number of concepts has to be large, the phenomena must be organized hierarchically
In D there exists many types of threats, vulnerabilities, assets and so on, but it should be possible to see these concepts as a hierarchy where the top concepts are more general than the ones on the lower levels.
S-9 The concepts of L must be easily distinguishable from each other.
By using easily distinguishable concepts the models will be easier to understand.
S-10 The use of concepts must be uniform throughout the whole set of statements that can be expressed within L
Meaning that a concept like ‘risk’ is to mean the same thing every time it is used
S-11 L must be flexible in the level of detail
This is especially relevant early in the security analysis, e.g. it must be possible to specify some threat scenarios very detailed, while others will be more high level. In architectural descriptions one has different viewpoints of the architecture that shows specific parts or aspects of the architecture. The same idea can be used in security risk modeling, some diagrams may show the overall risk picture, some are dedicated to show details about threats etc. Modeling tools often have functions for showing/hiding diagram details, and the idea can also be used even without computerized tool. E.g. L should be able to provide an overall risk picture for a system, describing risks and threats that can harm the various assets in the system without details about “how” (threat scenarios + unwanted incidents)
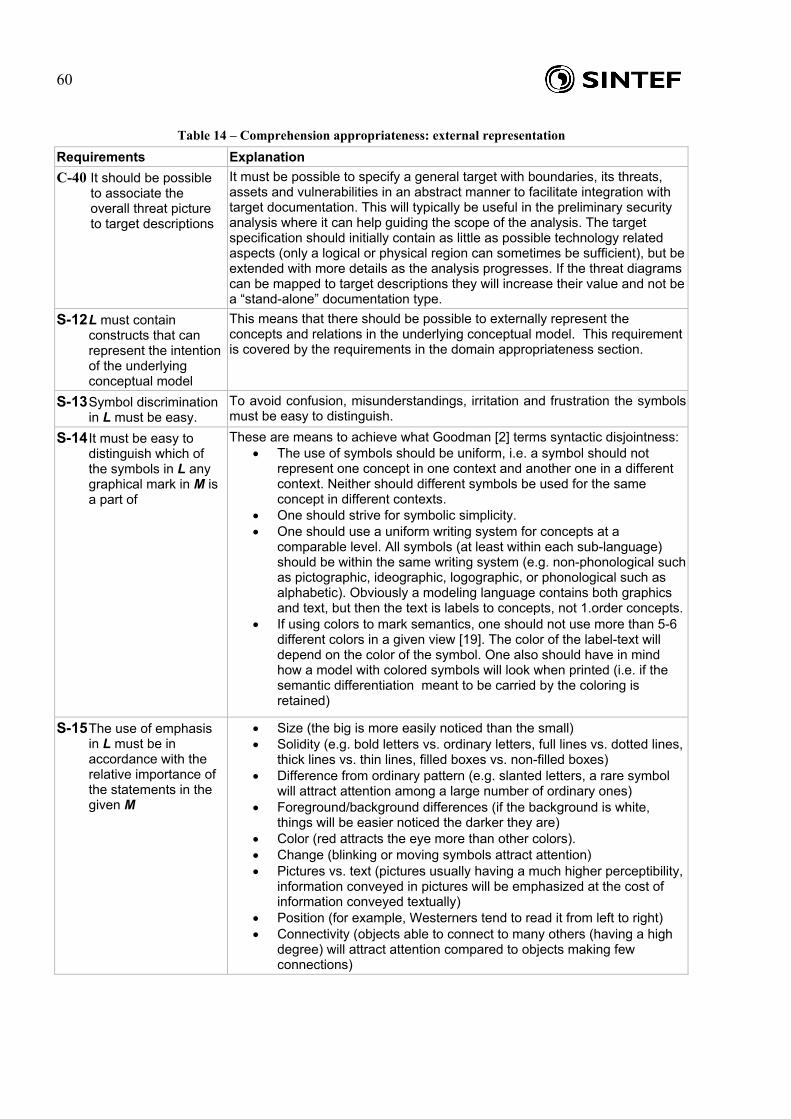
60
Table 14 – Comprehension appropriateness: external representation Requirements Explanation C-40 It should be possible
to associate the overall threat picture to target descriptions
It must be possible to specify a general target with boundaries, its threats, assets and vulnerabilities in an abstract manner to facilitate integration with target documentation. This will typically be useful in the preliminary security analysis where it can help guiding the scope of the analysis. The target specification should initially contain as little as possible technology related aspects (only a logical or physical region can sometimes be sufficient), but be extended with more details as the analysis progresses. If the threat diagrams can be mapped to target descriptions they will increase their value and not be a “stand-alone” documentation type.
S-12 L must contain constructs that can represent the intention of the underlying conceptual model
This means that there should be possible to externally represent the concepts and relations in the underlying conceptual model. This requirement is covered by the requirements in the domain appropriateness section.
S-13 Symbol discrimination in L must be easy.
To avoid confusion, misunderstandings, irritation and frustration the symbols must be easy to distinguish.
S-14 It must be easy to distinguish which of the symbols in L any graphical mark in M is a part of
These are means to achieve what Goodman [2] terms syntactic disjointness: • The use of symbols should be uniform, i.e. a symbol should not
represent one concept in one context and another one in a different context. Neither should different symbols be used for the same concept in different contexts.
• One should strive for symbolic simplicity. • One should use a uniform writing system for concepts at a
comparable level. All symbols (at least within each sub-language) should be within the same writing system (e.g. non-phonological such as pictographic, ideographic, logographic, or phonological such as alphabetic). Obviously a modeling language contains both graphics and text, but then the text is labels to concepts, not 1.order concepts.
• If using colors to mark semantics, one should not use more than 5-6 different colors in a given view [19]. The color of the label-text will depend on the color of the symbol. One also should have in mind how a model with colored symbols will look when printed (i.e. if the semantic differentiation meant to be carried by the coloring is retained)
S-15 The use of emphasis in L must be in accordance with the relative importance of the statements in the given M
• Size (the big is more easily noticed than the small) • Solidity (e.g. bold letters vs. ordinary letters, full lines vs. dotted lines,
thick lines vs. thin lines, filled boxes vs. non-filled boxes) • Difference from ordinary pattern (e.g. slanted letters, a rare symbol
will attract attention among a large number of ordinary ones) • Foreground/background differences (if the background is white,
things will be easier noticed the darker they are) • Color (red attracts the eye more than other colors). • Change (blinking or moving symbols attract attention) • Pictures vs. text (pictures usually having a much higher perceptibility,
information conveyed in pictures will be emphasized at the cost of information conveyed textually)
• Position (for example, Westerners tend to read it from left to right) • Connectivity (objects able to connect to many others (having a high
degree) will attract attention compared to objects making few connections)

61
S-16 Composition of
symbols should be made in an aesthetically pleasing way
These are means for achieving an aesthetically pleasing M (according to [20]):
• Angles between edges should not be too small • Minimize the area occupied by the drawing • Balance the diagram with respect to the axis • Minimize the number of bends along edges • Maximize the number of faces drawn as convex polygons • Minimize the number of crossings between edges • Place nodes with high degree in the centre of the drawing • Minimize differences among nodes' dimensions • Minimize the global length of edges • Minimize the length of the longest edge • Have symmetry of sons in hierarchies • Have uniform density of nodes in the drawing • Have verticality of hierarchical structures
S-17 L should not have empty symbols.
Symbols that are not related to a specific concept should not be used.
This does not mean that L should incorporate all the principles listed below, but rather avoid direct violation of them. Within the area of gestalt psychology, a number of principles for how to convey meaning through perceptual means is provided [21]:
• A closed contour in a node-link diagram generally represents a concept of some kind.
• The shape of a closed contour is frequently
used to represent a concept type.
• The color of an enclosed region represent
a concept type
• The size of an enclosed region can be used to represent the magnitude of a concept.
• Lines that partition a region within a closed contour can delineate subparts of a concept
• Closed-contour regions may be aggregated by overlapping them. The result is readily seen as a composite concept
• A number of closed-contour regions within a larger closed contour can represent conceptual containment
• Placing closed contours spatially in an
ordered sequence can represent conceptual ordering of some kind
• A linking line between concepts represents some kind of relationship between them
• A lined linking closed contours can have
different colors, or other graphical qualities such as waviness, and this effectively represents an attribute or type of relationship
S-18 M must adhere to the most common principles from gestalt psychology
• The thickness of a connecting line can be used to represent the magnitude of a relationship (a scalar attribute)

62
• A contour can be shaped with tabs and sockets that can indicate which components have particular relationships
• Proximity of components can represent groups
S-19 The most common
modeling tasks should be as efficient as possible
Meaning that the most common modeling tasks should take less effort to model than more unusual tasks. “Common” in a CORAS setting must be interpreted as the most high-level modeling tasks or the minimal modeling effort required by the method. The modeling test case in Sect. 3 provides an example of the minimum amount of information that needs to be modeled using the CORAS method.
C-41 There must be a reasonable number of diagram types
L should not include numerous different diagram types, ideally it should concentrate on one main diagram type with the possibility to specify details of this diagram in separate diagrams.
C-42 L must have a precise semantics
To ensure that the language is understood in the same manner by all readers, L should have a precise textual semantics.
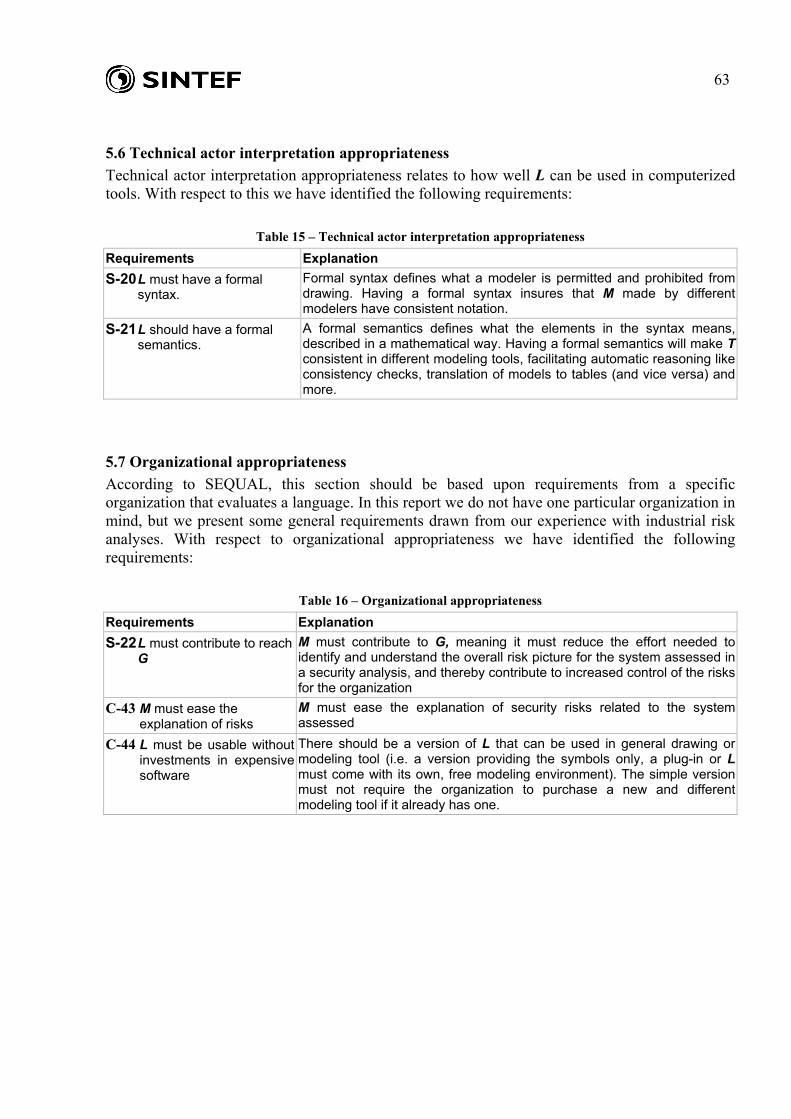
63
5.6 Technical actor interpretation appropriateness Technical actor interpretation appropriateness relates to how well L can be used in computerized tools. With respect to this we have identified the following requirements:
Table 15 – Technical actor interpretation appropriateness Requirements Explanation S-20 L must have a formal
syntax. Formal syntax defines what a modeler is permitted and prohibited from drawing. Having a formal syntax insures that M made by different modelers have consistent notation.
S-21 L should have a formal semantics.
A formal semantics defines what the elements in the syntax means, described in a mathematical way. Having a formal semantics will make Tconsistent in different modeling tools, facilitating automatic reasoning like consistency checks, translation of models to tables (and vice versa) and more.
5.7 Organizational appropriateness According to SEQUAL, this section should be based upon requirements from a specific organization that evaluates a language. In this report we do not have one particular organization in mind, but we present some general requirements drawn from our experience with industrial risk analyses. With respect to organizational appropriateness we have identified the following requirements:
Table 16 – Organizational appropriateness
Requirements Explanation S-22 L must contribute to reach
G M must contribute to G, meaning it must reduce the effort needed to identify and understand the overall risk picture for the system assessed in a security analysis, and thereby contribute to increased control of the risks for the organization
C-43 M must ease the explanation of risks
M must ease the explanation of security risks related to the system assessed
C-44 L must be usable without investments in expensive software
There should be a version of L that can be used in general drawing or modeling tool (i.e. a version providing the symbols only, a plug-in or Lmust come with its own, free modeling environment). The simple version must not require the organization to purchase a new and different modeling tool if it already has one.

64
6 Quality Evaluation of the UML profile Within each of SEQUAL’s appropriateness factor categories, we do not find all the requirements equally important and the evaluation reflects this by categorizing the two types of requirements as either a “must have” or “should have”, where a “must have” is more important than a “should have”. This is the grade scale that will be used in the evaluation: 0 - None or little support for the requirement 1 - There is some, though insufficiently support for the requirement 2 - The requirement is sufficiently supported 3 - The requirement is well supported The scores will help evaluating each section of requirements and give indications as to where the weaknesses and strengths of the UML profile lies. Since the requirements vary in their level of detail, and the should/must category does not reflect this (i.e. a small, detailed requirement may be less important compared to a high level requirement), the average score should be seen as as indicators of weak and strong parts. The requirements from the previous chapter are presented in tables below and the score is assigned according to the scale above. Each evaluation is also documented by a rationale.
6.1 Domain appropriateness The domain appropriateness is divided into three main areas: modeling perspectives, concepts and symbols which are evaluated separately. The modeling perspectives we require (structural and behavioral) are quite well supported in the UML profile:
Table 17 – Domain appropriateness: modeling perspectives Must Should Rationale C-1 Structural
modeling
3 The UML class diagram notation on which the UML profile is partly based on is very suitable from a structural modeling perspective.
C-2 Behavioral modeling
2 The UML use case diagram notation on which the UML profile is partly based on, is sufficient for describing behavior, but lacks the ability to show details of the processes like branches (choose between different alternative routes), vulnerabilities and consequence/frequency information.
Total score: 5 - Avg: 2,5 - All in all, the concepts needed are well supported with only a few small exceptions. There are relations that would be useful to model which are not explicitly defined in the UML profile’s conceptual model (Sect. 2.1). An example is the concept “vulnerability” which is not sufficiently supported as a stand-alone concept, but more like a property of asset. Ex: one cannot specify how two different threats exploit different vulnerabilities to harm an asset since the vulnerabilities are properties of the asset. The concepts and/or-ports are not supported. Both required relationship types (directed and undirected associations) are supported.

65
Table 18 – Domain appropriateness: concepts Must Should Rationale C-3 Asset 3 Asset: the concept is supported. C-4 Vulnerability 1 Vulnerability: There is some, though insufficiently support for
the requirement, since the concept is not a “stand-alone” concept, but more like an attribute of the asset.
C-5 Risk 3 Risk: the concept is supported. C-6 Stakeholder 3 Stakeholder: the concept is supported. C-7 Threat 3 Threat: the concept is supported. C-8 Unwanted
incident 3 Unwanted incident: The concept is supported, but in the last
revision of the language the concept that used to be an unwanted incident was renamed to incident scenario which is again defined to lead to/include the unwanted incident.
C-9 Treatment 3 Treatment: the concept is supported, but not the treatment type. Since there has not been a strong need for the latter concept during field trials, we leave the requirement out of this evaluation.
C-10 Likelihood/ frequency/ probability
3 Likelihood/frequency/probability: The concepts are supported, but frequency is mainly used throughout the UML profile and method.
C-11 Consequence 3 Consequence: the concept is supported. C-12 Threat
scenario 3 Threat scenario: the concept is supported.
Meaning the following relationships: 3 1. Stakeholder-asset: the relation is supported. 3 2. Asset-vulnerability: the relation is supported in the sense that
vulnerability is like a property of asset not a stand alone concept.
2 3. Threat-vulnerability: the relation is supported indirectly viathreat scenario to unwanted incident to an asset with the specific vulnerability.
3 4. Threat-unwanted incident: the relation is supported. 3 5. Threat-asset: the relation is supported. 2 6. Threat-risk: not modeled as an explicit relation but indirectly
via the threat’s relation to the unwanted incidents, which represent risks.
3 7. Unwanted incident-asset: the relation is supported. 2 8. Treatment-risk: only indirectly by pointing towards the
unwanted incident, which is associated with the risk. 2 9. Treatment-unwanted incident / threat / vulnerability: the first
is supported, but the other two are only indirectly supported via their relations to unwanted incident.
3 10. Risk-asset: the relation is supported. 3 11. Risk-consequence/likelihood: the relations are supported. 3 12. Risk-unwanted incident: the relation is supported.
C-13 The relations in the CORAS conceptual model
Avg.: 32/12=2,7
C-14 And/or operators
1 AND/OR operators: There are no explicit use of and/or operations in the UML profile, but one may read the threat diagrams as if they implicitly use “or” whenever more than one threat may lead to the same scenario.

66
C-15 L must be independent of the target that is assessed
3 Target independence: The UML profile does not have any system specific notation, meaning it can be applied to all types of systems.
C-16 Region 0 There exists no physical or logical region that can be used to link risk specific documentation to target documentation.
Total score: 34,7 - Avg.: 2,5 - Regarding symbols in the UML profile they have not been included in the first edition of the OMG standard [17], but there exists a technical report [16] that includes suggestions to symbols which we use as basis for the symbol evaluation. Most of the required symbols are supported, but the symbol for threat is misleading the focus towards human threats only, and one lacks symbols for e.g. vulnerability, non-human threat, and logical operators.
Table 19 – Domain appropriateness: symbols Must Should Rationale C-17 Asset 3 Asset: OK. C-18 Vulnerability 0 Vulnerability: The symbol is not supported. C-19 Aggregated
vulnerability - Aggregated vulnerability: The symbol is not supported. There has
not been any need for this symbol in any of the field trials; we therefore leave it out of the evaluation.
C-20 Risk 2 Risk: The same symbol for unwanted incident is also used for risk; this is more or less ok since unwanted incident is a part of a risk, and problems has not arisen yet, probably because risks are not modeled explicitly. The moment we introduce risk diagrams one could potentially experience misunderstanding regarding the symbols. The risk symbol cannot show risk value, this have to be specified in separate UML profile risk diagrams.
C-21 Risk theme - Risk theme: Risk theme is using the same symbols as risk which may be confusing for the reader. There has not been any need for this symbol in any of the field trials; we therefore leave it out of the evaluation.
C-22 Aggregated risk
- Aggregated risk: There is no symbol for aggregated risks (if risk themes are used to symbolize aggregated risk the symbol is identical to the risk symbol). There has not been any need for this symbol in any of the field trials; we therefore leave it out of the evaluation.
C-23 Stakeholder 3 Stakeholder: The symbol for stakeholder is a pin-man with a stake, its simple and resembles the UML symbol for actor, but may be too simple compared to the other icons.
C-24 Threat 2 General threat is symbolized with a pin-man with a bomb, but this may be misleading with respect to non-human threats.
C-25 Human threat 3 Human threat: OK, but people may react towards the “black person” symbol, which probably is inspired by the misuse case notation.
C-26 Non-human threat
1 Non-human threat: There is no specific symbol for non-human threat. The symbol for “system threat” or “hardware failure” can be used but they have a relatively poor design.

67
C-27 Threat
scenario 3 Threat scenario: OK. A threat scenario may very well be
specified further in other diagrams, but this is not reflected in the symbol.
C-28 Unwanted incident
3 Unwanted incident: OK
C-29 Treatment 3 Treatment (scenario): OK C-30 Treatment
type - Treatment type:
Preventing treatment: The symbol is not supported, but it might be sufficiently to annotate the treatment arrow with “preventive”. There has not been a strong need for this symbol in the field trials and we therefore leave it out of this evaluation. Repairing treatment: as for preventive treatment it might be sufficiently to annotate the treatment arrow with “repairing”.
C-31 Likelihood, frequency, probability
- Likelihood/frequency/probability: The symbol is not supported. There has not been any need for this symbol in any of the field trials; we therefore leave it out of the evaluation.
C-32 Consequence - Consequence: The symbol is not supported. There has not been any need for this symbol in any of the field trials; we therefore leave it out of the evaluation.
C-33 Association type
2,5 Association type: Undirected association: There exists a solid, undirected association line. Directed association: There exists a stapled, directed association for “include”, “initiate” and “treatment effect”, but not a solid alternative.
C-34 Operators 0 Operators: And-operator: The symbol is not supported. Or-operator: OR-combinations can be interpreted as the default in the UML profile for threat scenarios, but not explicitly modeled with a special operator symbol.
C-35 Region 0 There are no regions in the UML profile. Total score 21,5 4 Avg.: 2,2 1,3
6.2 Participant language knowledge appropriateness The terminology the language builds upon is quite well understood, even without proper training [4, 7]. The understanding of the diagrams without being familiar with UML, at least use-case diagrams, has not been investigated. The modeler needs to understand the underlying basis of the language, i.e. UML, in order to be able to fully express him- or herself in the UML profile. This requirement may in some cases be hard to accomplish and it may prevent users unfamiliar with UML from trying the UML profile. The symbols used are not based on most common interpretation of the concepts, and this needs to be improved.
Table 20 – Participant language knowledge appropriateness Must Should Rationale S-1 L’s external
representation must imitate the real world
2 The threat diagrams in the UML profile let the modeler model natural sequences of events from initiator via event to ”victim” (asset), but the directed association between threat scenarios and incident scenarios are pointing in the opposite direction when reading the chain of events (left to right). We have also experienced problems regarding scalability where the diagrams tend to become large and chaotic as they grow in size.

68
S-2 The symbols used in L must be based on the most common interpretation of the concept-symbol
1 The underlying symbols (use case, actor) are similar to the ones in UML, but the suggested UML profile symbols are not uniform, intuitive or well designed and give an amateurish impression. On the other hand the symbols are not finalized but only sketches of possible representations.
C-36 L must be understandable for people unfamiliar with modeling and without specific training
2 According to investigations [4, 7] the UML profile builds on well understood risk specific terms, but there are terms that are found more difficult to understand than other (e.g. risk, likelihood, frequency). Some terms cannot be said to have a most-common-interpretation (e.g. risk value). The language builds on UML, and requires the readers to at least understand UML use case diagrams.
Total score: 5 - Avg.: 1,7 -
6.3 Knowledge externalizability appropriateness The threat diagrams and the unwanted incident diagrams in the UML profile has potential to be well suited for modeling logical sequences of events. The modeling sequence should start with the threat that initiates a threat scenario which leads to an unwanted incident that harms an asset, including the vulnerabilities it exploits on its way. Illustrating vulnerabilities in this manner may not be possible since they do not fall within any of the concepts in the underlying use case notation. The diagram notation also lacks the option to illustrate AND/OR gates, which gives an unclear interpretation of e.g. two arrows pointing to the same threat scenario.
Table 21 – Knowledge externalizability appropriateness Must Should Rationale S-3 L must
help externalize tacit knowledge
1 The natural way of describing how a threat harms an asset is a logical sequence of events starting with the threat that initiates a threat scenario which leads to an unwanted incident that harms an asset. This idea is part of the language, but unfortunately the external representation fails to show the logical sequence. The UML profile makes use of the UML construct “include” which intend to show how one use case is included in another use case but at first glance they look like they are on the same “level”: In Figure 5 the threat scenario is included in the incident scenario “Denial-of-service”, but for an untrained reader they seem like two equal entities, a clear violation of common gestalt principles. Another aspect that is missing in representing the logical sequence of events is the connection between the threat and the vulnerability it exploits. The way the language is designed one cannot see which vulnerabilities a threat exploits since they are properties of the asset and often more than one threat can potentially harm the same asset. The main obstacle towards modeling vulnerabilities as stand-alone symbols is the underlying UML use case notation on which the diagrams are based. The use case notation is used for describing dynamic behavior and has two concepts, actor and use case. A vulnerability cannot be said to be a special case of either of these, since it in most cases is a static a property of the target system.

69
S-4 It must be
easy to model as part of actual work
2 Currently the UML profile has mainly been used as input to brainstorming sessions and documentation of the final results. The models are difficult to create from scratch “on-the-fly” as the information collected in a brainstorming often needs to be restructured and corrected before it can be modeled properly. For the brainstorming session, modeling suggestions are often prepared in advance, corrected and updated with more information during the session and then remodeled. From the modeler’s perspective the models are created as part of the modelers work, they can also be developed iteratively during the analysis and evolve as more and more details are added. Depending on the case, the experience of the modeler and the tool support, it should be possible to make updates to the models during the actual brainstorming.
C-37 It must be possible to model fault trees with L
1 Fault tree diagrams: the lack of operators makes fault tree modeling difficult to draw with the UML profile. Threat diagrams can be used to model something similar to fault trees, but it requires that all associations that lead to a threat scenario are interpreted as or-ports.
C-38 It should be possible to model event trees with L
0 Event tree diagrams: even though similar to fault trees, an event tree appears differently in its notation. To model event trees one needs more expressive power than the UML profile currently provides.
Total score: 4 0 Avg.: 1,3 0
6.4 Comprehensibility appropriateness Comprehensibility appropriateness covers both the language’s internal end external representation. The comprehensibility regarding the internal representation of the UML profile is satisfactory. The number of terms, including specialized terms, is kept at a minimum but the user still has the possibility to specialize a term as needed. Based on empirical investigations we can conclude that the understanding of the terms’ definitions is good [7]. The modeler can choose the preferred level of precision and detailing and the concepts has a uniform interpretation whenever they are used.
Table 22 – Comprehensibility appropriateness: internal representation Must Should Rationale C-39 L must build
on most-common I of risk specific concepts
2 The results from empirical investigations of the understanding of risk specific terminology show that the CORAS terms are quite well understood [7] due to their use in the daily language. Still there are some terms that are more difficult than others like risk and frequency measures.
S-5 The concepts in L must be general rather than specialized
3 There are very few specialized terms in the UML profile, but the language lets the modeler specialize if needed (e.g. threat types, asset types).
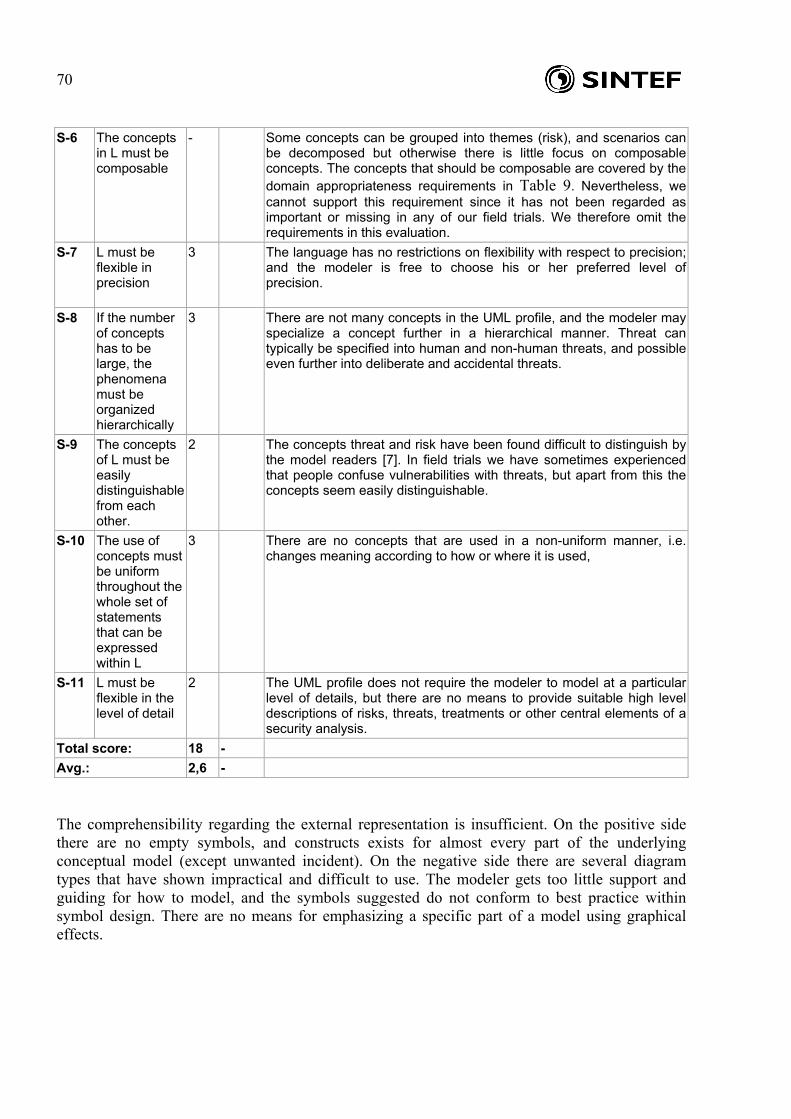
70
S-6 The concepts in L must be composable
- Some concepts can be grouped into themes (risk), and scenarios can be decomposed but otherwise there is little focus on composable concepts. The concepts that should be composable are covered by the domain appropriateness requirements in Table 9. Nevertheless, we cannot support this requirement since it has not been regarded as important or missing in any of our field trials. We therefore omit the requirements in this evaluation.
S-7 L must be flexible in precision
3 The language has no restrictions on flexibility with respect to precision; and the modeler is free to choose his or her preferred level of precision.
S-8 If the number of concepts has to be large, the phenomena must be organized hierarchically
3 There are not many concepts in the UML profile, and the modeler may specialize a concept further in a hierarchical manner. Threat can typically be specified into human and non-human threats, and possible even further into deliberate and accidental threats.
S-9 The concepts of L must be easily distinguishable from each other.
2 The concepts threat and risk have been found difficult to distinguish by the model readers [7]. In field trials we have sometimes experienced that people confuse vulnerabilities with threats, but apart from this the concepts seem easily distinguishable.
S-10 The use of concepts must be uniform throughout the whole set of statements that can be expressed within L
3 There are no concepts that are used in a non-uniform manner, i.e. changes meaning according to how or where it is used,
S-11 L must be flexible in the level of detail
2 The UML profile does not require the modeler to model at a particular level of details, but there are no means to provide suitable high level descriptions of risks, threats, treatments or other central elements of a security analysis.
Total score: 18 - Avg.: 2,6 - The comprehensibility regarding the external representation is insufficient. On the positive side there are no empty symbols, and constructs exists for almost every part of the underlying conceptual model (except unwanted incident). On the negative side there are several diagram types that have shown impractical and difficult to use. The modeler gets too little support and guiding for how to model, and the symbols suggested do not conform to best practice within symbol design. There are no means for emphasizing a specific part of a model using graphical effects.

71
Table 23 – Comprehensibility appropriateness: external representation
Must Should Rationale C-40 It should be
possible to associate the overall threat picture to target descriptions
0 There are no means for linking the risk diagrams to the target specification.
S-12 L must contain constructs that can represent the intention of the underlying conceptual model
- Covered by the requirements in the domain appropriateness section.
S-13 Symbol discrimination in L must be easy.
1 Since the QoSFT standard does not yet include icons or symbols except the actor and use case symbol from UML, we evaluate the developers’ suggestions to icons found in [16]. • The stakeholder icon is difficult to see from distance and differs
from other icons because of its simple style. • The asset icon becomes very dark when printed in black-white • The SWOT icons are not uniform, not intuitive and show signs
of extensive use of Microsoft clip art. • The threat icon is simple and the bomb it carries is too small.
The fact that the threat icon is a pin-man is misleading as it emphasizes human threats.
• The treat scenario icon: is ok as long as the bomb is easily associated with a threat, but the dark color does not convey an apparent meaning.
• The vulnerability icon: this does not exist • The unwanted incident icon: does not exist • The incident scenario icon: uses a non-logical icon compared to
the bomb in threat scenario. The dark color used in the use case blob does not convey any apparent meaning.
• The various types of human threat icons are non-distinguishable.
• The various types of system threats (non-human) are partly non-intuitive, unconventional and lack a uniform style.
• Risk, risk theme and incident scenario have identical icons (except for the use case blob symbolizing scenario)
• There is not an intuitive relation between the symbol for threat scenario and incident scenario (an ignited bomb and a road sign warning about the danger of lightning). When igniting a bomb it usually explodes.
• The icon for treatment could have cultural dependencies, in our culture the red cross symbolizes medical attention, but in other cultures it may not have the same interpretation. When the number of threat scenarios and treatment scenarios increases it becomes difficult to distinguish between the red bomb and the red cross symbols.

72
S-14 It must be easy to distinguish which of the symbols in L any graphical mark in M is a part of
2 See the requirement specification for details about each bullet point below: • It is sometimes difficult to avoid crossing lines from e.g.
treatment to treated entity. The problem of crossing lines also arises related to incident scenarios-assets, threats-incident scenarios, unwanted incident-assets etc, this is a general problem of the underlying UML use case notation and leaves the responsibility of creating aesthetically pleasing models to the modeler.
• The symbol for incident scenario is also used for risk. • The symbols are within the same writing system: pictorial. • The number of colors used in symbols is limited and the
diagrams do not appear too colorful. • The dark asset symbol is not suitable for black-white printing.
S-15 The use of emphasis in L must be in accordance with the relative importance of the statements in the given M
- There is no deliberate use of emphasis in the UML profile notation. It would have been beneficial to be able to specify which risks are most likely or which are most harmful etc. Evaluation of the bullet points specified in the requirement: • Size: not used • Solidity: not used • Difference: not used, except from different symbols (icons) • Foreground/background: the incident- and threat scenarios
have a darker color than other icons like treatment, and this makes them easier to distinguish, but why exactly these are emphasized is not clear.
• Red is used in many of the icons (risk, threat scenario, incident scenario). Red is in our culture associated with danger, but other cultures have different interpretation of red. The fact that also the treatment icon uses red in its symbol can be confusing because a treatment should not be associated with danger. One needs to consider the use of the color red thoroughly.
• Change: not used • Pictures: not used, except icons • Position: left to right reading direction is used in some
examples, but since the language does not have a modeling guide this is entirely up to the modeler to decide.
• Connectivity: difficult to properly evaluate. The requirement has shown less important due to later empirical investigations regarding modeling preferences [5, 6], and its evaluation score is therefore omitted in the final evaluation.
S-16 Composition of symbols should be made in an aesthetically pleasing way
- Since the UML profile is not accompanied with a modeling guide, it is difficult to judge this requirement. The modeler can create models in the style he or she prefer. The developers of the language should provide a guide, or at least more examples.
S-17 L should not have empty symbols.
3 There are no empty symbols, but there are concepts with symbols that are rarely used.
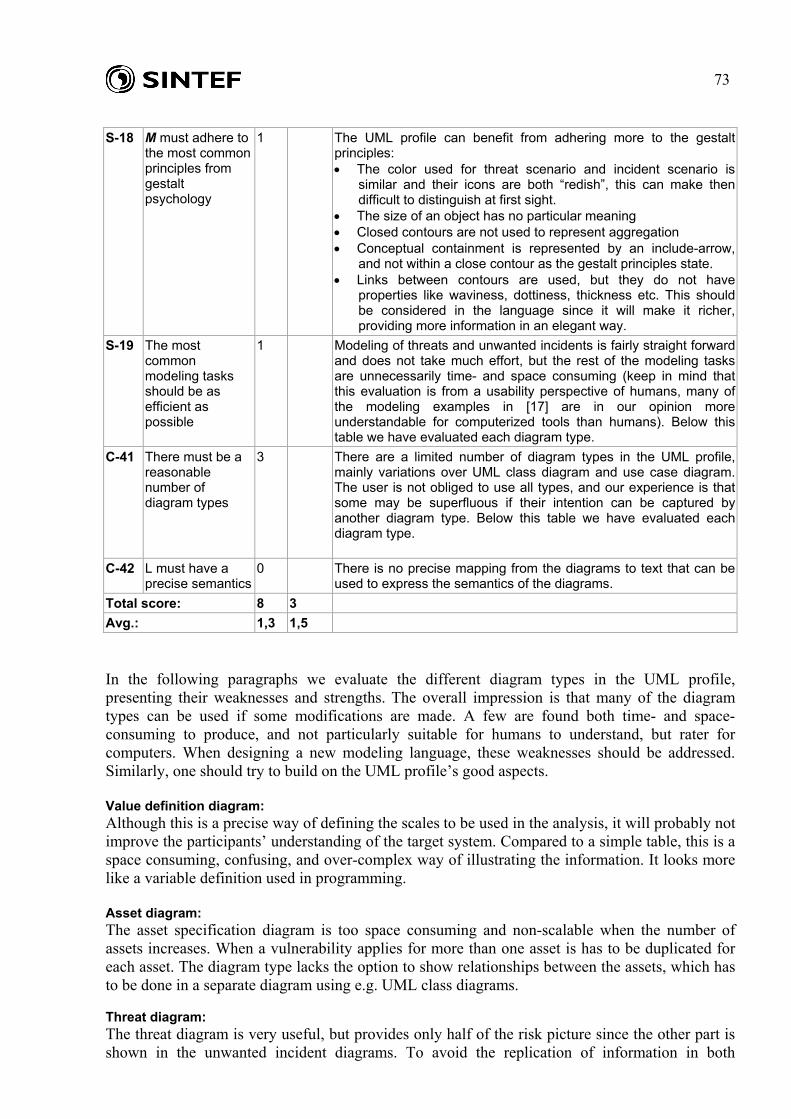
73
S-18 M must adhere to
the most common principles from gestalt psychology
1 The UML profile can benefit from adhering more to the gestalt principles: • The color used for threat scenario and incident scenario is
similar and their icons are both “redish”, this can make then difficult to distinguish at first sight.
• The size of an object has no particular meaning • Closed contours are not used to represent aggregation • Conceptual containment is represented by an include-arrow,
and not within a close contour as the gestalt principles state. • Links between contours are used, but they do not have
properties like waviness, dottiness, thickness etc. This should be considered in the language since it will make it richer, providing more information in an elegant way.
S-19 The most common modeling tasks should be as efficient as possible
1 Modeling of threats and unwanted incidents is fairly straight forward and does not take much effort, but the rest of the modeling tasksare unnecessarily time- and space consuming (keep in mind that this evaluation is from a usability perspective of humans, many of the modeling examples in [17] are in our opinion more understandable for computerized tools than humans). Below this table we have evaluated each diagram type.
C-41
There must be a reasonable number of diagram types
3 There are a limited number of diagram types in the UML profile, mainly variations over UML class diagram and use case diagram. The user is not obliged to use all types, and our experience is that some may be superfluous if their intention can be captured by another diagram type. Below this table we have evaluated each diagram type.
C-42 L must have a precise semantics
0 There is no precise mapping from the diagrams to text that can be used to express the semantics of the diagrams.
Total score: 8 3 Avg.: 1,3 1,5 In the following paragraphs we evaluate the different diagram types in the UML profile, presenting their weaknesses and strengths. The overall impression is that many of the diagram types can be used if some modifications are made. A few are found both time- and space-consuming to produce, and not particularly suitable for humans to understand, but rater for computers. When designing a new modeling language, these weaknesses should be addressed. Similarly, one should try to build on the UML profile’s good aspects. Value definition diagram: Although this is a precise way of defining the scales to be used in the analysis, it will probably not improve the participants’ understanding of the target system. Compared to a simple table, this is a space consuming, confusing, and over-complex way of illustrating the information. It looks more like a variable definition used in programming. Asset diagram: The asset specification diagram is too space consuming and non-scalable when the number of assets increases. When a vulnerability applies for more than one asset is has to be duplicated for each asset. The diagram type lacks the option to show relationships between the assets, which has to be done in a separate diagram using e.g. UML class diagrams. Threat diagram: The threat diagram is very useful, but provides only half of the risk picture since the other part is shown in the unwanted incident diagrams. To avoid the replication of information in both

74
diagrams, they may be combined into one diagram type. This type of diagram requires well defined guidelines as for when and how to split diagrams into smaller diagrams in order to avoid too complex diagrams. Unwanted incident diagram: As pointed out before, the unwanted incident diagram should be included in the threat diagram to give the reader the complete picture. As it is in the UML profile, the reader has to switch between several diagrams because the threats are not shown in the diagrams. The way vulnerabilities are specified for each asset takes too much space and limits the number of assets that can be modeled in a diagram. In the same manner as for the threat diagram, also this diagram type needs firm guidelines for where and when to split into smaller diagrams to avoid a cluttered and non-scalable diagram. Risk diagram: A major problem of this type of diagram is its lack of relation to the threats and threat scenarios. The reader is required to look at several diagrams to get the complete picture, which is bothersome to a person who wants an overview. Empirical experiments [6] have shown that people prefer to see the risk in the threat diagram, not in separate diagrams. The risk specification diagram has shown non-scalable and extremely space- and time-consuming when the number of risks increases. Even in our relatively small modeling test case the diagrams needed several pages. One of the conclusions from this evaluation is that there is in fact a need for modeling risks, but in lack of a better representation this information has only been documented in tables. Risk theme diagram: The diagram type may be useful if the assets can be grouped into themes that can be treated in the same way. This depends on the target of analysis, but so far we have not found it useful to model themes in field trials. Treatment diagram The treatment diagrams are useful, but can easily become messy and complex if the placement of treatments is not considered carefully. A considerably improvement would be just hiding the treatment effect label from the treatment arrow, since this feature contributes strongly to the messy appearance. This information may instead be specified in a table. Treatment effect diagram: The treatment effect diagrams are space- and time-consuming, and too complex for the reader. A simple table conveys this type of information in a much more efficient way.
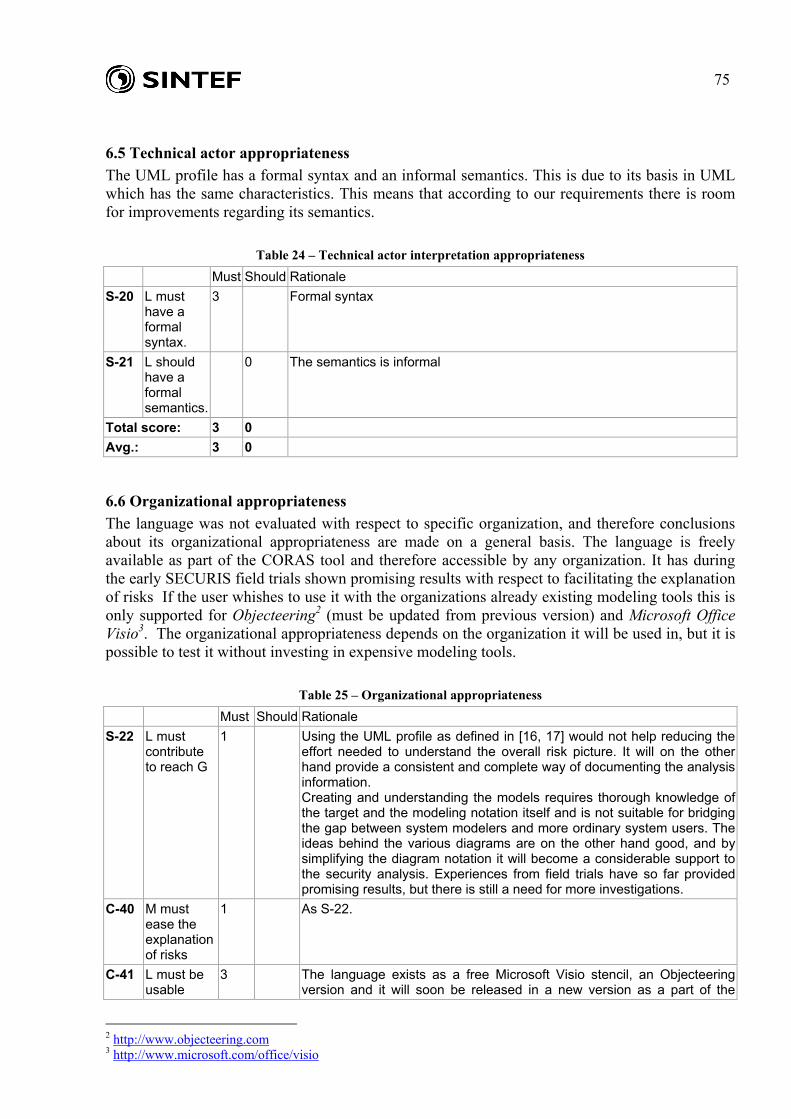
75
6.5 Technical actor appropriateness The UML profile has a formal syntax and an informal semantics. This is due to its basis in UML which has the same characteristics. This means that according to our requirements there is room for improvements regarding its semantics.
Table 24 – Technical actor interpretation appropriateness Must Should Rationale S-20 L must
have a formal syntax.
3 Formal syntax
S-21 L should have a formal semantics.
0 The semantics is informal
Total score: 3 0 Avg.: 3 0
6.6 Organizational appropriateness The language was not evaluated with respect to specific organization, and therefore conclusions about its organizational appropriateness are made on a general basis. The language is freely available as part of the CORAS tool and therefore accessible by any organization. It has during the early SECURIS field trials shown promising results with respect to facilitating the explanation of risks If the user whishes to use it with the organizations already existing modeling tools this is only supported for Objecteering2 (must be updated from previous version) and Microsoft Office Visio3. The organizational appropriateness depends on the organization it will be used in, but it is possible to test it without investing in expensive modeling tools.
Table 25 – Organizational appropriateness Must Should Rationale S-22 L must
contribute to reach G
1 Using the UML profile as defined in [16, 17] would not help reducing the effort needed to understand the overall risk picture. It will on the other hand provide a consistent and complete way of documenting the analysis information. Creating and understanding the models requires thorough knowledge of the target and the modeling notation itself and is not suitable for bridging the gap between system modelers and more ordinary system users. The ideas behind the various diagrams are on the other hand good, and by simplifying the diagram notation it will become a considerable support to the security analysis. Experiences from field trials have so far provided promising results, but there is still a need for more investigations.
C-40 M must ease the explanation of risks
1 As S-22.
C-41 L must be usable
3 The language exists as a free Microsoft Visio stencil, an Objecteering version and it will soon be released in a new version as a part of the
2 http://www.objecteering.com 3 http://www.microsoft.com/office/visio

76
without investments in expensive software
CORAS modeling tool.
Total score: 5 - Avg.: 1,7 -
6.7 Summary of the results The table below summarizes the average scores for each appropriateness factor discussed above. The scores provides an indication of weak and strong aspects of the UML profile, but since the level of details in the requirements can vary and no weighting has been included to adjust the score for this, we only use this as an indication of how well the language meets our requirements.
Table 26 – Evaluation scores Category Must-requirements Should-requirements Score # req. Avg. Score # req. Avg.: Domain appropriateness: • modeling perspectives • concepts • symbols
534,7 21,5
21410
2,52,5
2 4
- -
3*
- -
1,3
Participant language knowledge appropriateness 5 3 1,7 - - Knowledge externalizability appropriateness 4 3 1,3 0 1 0 Comprehensibility appropriateness: • internal representation • external representation
188
7*6*
2,61,3 3
- 2
-
1,5
Technical actor interpretation appropriateness 3 1 3 0 1 0 Organizational appropriateness 5 3 1,7 - -
* one or more requirements were omitted, see Sect. 6.7.1 As we can se from Table 26, the UML profile has both weak and strong aspects. The knowledge externalizability appropriateness receives a low score due to the illogical representation of the threats’ paths via threat scenarios to the unwanted incidents where they cause harm to assets. The natural way of describing this is a logical sequence of events starting with the threat that initiates a threat scenario which leads to an unwanted incident that harms an asset. This idea is part of the language, but unfortunately the external representation fails to show its logical order. The UML profile makes use of the UML construct “include” which intend to show how a use case is included in another use case, but at first glance they look like they are on the same “level”. In Figure 5 the threat scenario is included in the incident scenario “Denial-of-service”, but for an untrained reader they seem like two equal entities, a clear violation of common gestalt principles. The language also fails to show which vulnerabilities a threat may exploit since these are only modeled as properties of the asset. The fact that more than one threat potentially can harm the same asset using different vulnerabilities is not possible to model. Often a risk picture includes several dependencies, i.e. events that simultaneously may lead to an unwanted incident. This is traditionally modeled using fault trees, but the lack of AND/OR-operators in the UML profile makes fault tree modeling impossible.

77
Comprehensibility appropriateness of the external representation receives a low score, mainly related to the lack of adherence to common gestalt principles. The use of colors and size are not well considered and the include arrow in threat diagrams can easily be misunderstood. When it comes to judging the modeling effort required to make diagrams as a natural part of the analyais process there are differences between the various diagram types. While threat and unwanted incident diagrams are fairly straightforward and does not take much effort, the rest of the diagrams are unnecessarily time- and space consuming from a usability perspective. To ensure a common understanding of the diagrams, a precise mapping from diagrams to text should be used. This mapping is not defined for the UML profile. The rather low score for participant language knowledge appropriateness is caused by the symbols (icons) used. The UML profile symbols we have evaluated are based on standard UML use case symbols, but they are neither uniform, intuitive nor well designed and give an amateurish impression. Since the symbols are not finalized and just sketches of possible representations, the low score for this factor should not be emphasized as much as the other appropriateness factors of the language. The UML profiles organizational appropriateness could have been better. It will probably provide a consistent and complete way of documenting the analysis information, but used as defined in [16, 17] would not help reducing the effort needed to understand the organization’s overall risk picture. Creating and understanding the models requires thorough knowledge of the target and the modeling notation itself and is not suitable for bridging the gap between system modelers and more ordinary system users. The ideas behind the various diagrams are on the other hand good, but they need to become simpler and more manageable in terms of complexity.
6.7.1 Requirements that were left out from the evaluation The following requirements were omitted from the evaluation, either because they are overlapping with other requirements, or they cannot be justified based on practical experience from industrial field trials (an explanation for why they were left out is provided in their respective sections):
• Domain appropriateness, symbols: C-19, C-21, C-22, C-30, C-31, C-32 • Comprehensibility appropriateness, internal representation: S-6 • Comprehensibility appropriateness, external representation: S-12, S-15, S-16
If these requirements repeatedly are omitted in several different evaluations, they should be considered revised or removed from the quality framework.

78
79
7 Conclusion This section summarizes the results from modeling the core security risk scenarios with the CORAS UML profile and the quality evaluation using SEQUAL. As we showed in Chapter 4, it was possible to model almost all the information in the core security risk scenarios with the UML profile. However, being able to express the core security risk scenarios is not sufficient. The models should also present the information in the core security scenarios in a better way than the textual description alone. The diagrams should be understandable and manageable in terms of complexity, and provide a good overview of the information. With respect to this, many of the diagram types are not suitable for presentation of security risk analysis information. They are often characterized by duplication of information, and information that is spread out over several diagrams which makes it difficult to get an overview. The diagrams tend to be extremely space consuming (particularly the treatment effect and risk evaluation diagrams), and require that the modeler repeatedly models almost identical diagrams. The UML profile’s internal representation and underlying concepts related to expressing the domain have been found appropriate for the security analysis setting. The language includes the main security analysis concepts and modeling perspectives. Its technical actor appropriateness (how suitable is it for use with computerized tools) receives a high score. The UML profile benefits from being based on a well-known and widely used modeling language for which several tools are available. The quality evaluation points at the language’s comprehensibility appropriateness factor as one of its main weakness. The language should be a means for visualizing, explaining and documenting the security risk analysis and this highly depends on a well defined external representation. The symbols in the UML profile do not always conform to best practice within symbol design. Some of the diagrams are more confusing than they are explanatory, and they can be extremely time-consuming to make. Apparently, the arrow from the threat scenarios goes in the opposite direction of what they should. The lack of logical AND-OR gates makes it difficult to model fault trees which is one of the most commonly used graphical risk analysis techniques. Both these aspects affect the knowledge externalizability appropriateness factor of the language. Unfortunately, some of these weaknesses are related to the restrictions of the underlying UML notation itself. This makes it difficult to redesign the language without violating fundamental UML constructs. There seems to be an inevitable choice to make, either use a non-optimal language with a notation that conforms to UML, or develop a new language without any notation related restrictions. A new language will on the one side not have the support and strength from a well known and widely used modeling language, but on the other side it may be developed with main focus on understandability and usability. The two languages could be seen as two different versions based on the same underlying security analysis foundation, but with different strengths and application areas.

80

81
References [1] AS/NZS4360, Australian/New Zealand Standard for Risk Management: Standards
Australia/Standards New Zealand, 1999. [2] Goodman, N., Languages of Art: An Approach to a Theory of Symbols. Indianapolis:
Hackett, 1976. [3] HB231, Information security risk management guidelines: Standards Australia/Standards
New Zealand, 2000. [4] Hogganvik, I. and Stølen, K., "Empirical Investigations of the CORAS Language for
Structured Brainstorming", SINTEF ICT, Technical report STF90 A05041, January, 2005. [5] Hogganvik, I. and Stølen, K., "A Graphical Approach to Risk Identification, Motivated by
Empirical Investigations", in Proc. MoDELS'06 (LNCS 4199), pp. 574-588, 2006. [6] Hogganvik, I. and Stølen, K., "Investigating Preferences in Graphical Risk Modeling",
SINTEF ICT, Tech. report SINTEF A57, 2006. [7] Hogganvik, I. and Stølen, K., "Risk Analysis Terminology for IT-systems: does it match
intuition?" in Proc. International Symposium on Empirical Software Engineering (ISESE'05), pp. 13-25, 2005.
[8] IEC60300-3-9, Event Tree Analysis (ETA) in Dependability management - Part 3: Application guide - Section 9: Risk analysis of technological systems, 1995.
[9] IEC61025, Fault Tree Analysis (FTA), 1990. [10] ISO/IEC13335, Information technology – Guidelines for management of IT Security (Part
1-5), 1996-2000. [11] Krogstie, J., "Evaluating UML Using a Generic Quality Framework", in UML and the
Unified Process, L. Favre, Ed.: IRM Press, 2003, pp. 1-22. [12] Krogstie, J., "Using a semiotic framework to evaluate UML for the development of
models of high quality", in Unified Modeling Language: Systems analysis, design, and development issues, K. Siau and T. Halpin, Eds.: Idea Group Publishing, 2001, pp. 89-106.
[13] Krogstie, J. and Arnesen, S. d. F., "Assessing Enterprise Modeling Languages Using a Generic Quality Framework", in Information Modeling Methods and Methodologies: Idea Group, 2005, pp. 63-79.
[14] Krogstie, J., Lindland, O. I., and Sindre, G., "Defining Quality Aspects for Conceptual Models", in Proc. IFIP8.1 working conference on Information Systems Concepts (ISCO3); Towards a consolidation of views, pp. 216-231. Marburg, Germany, 1995.
[15] Krogstie, J. and Sølvberg, A., Information Systems Engineering: Conceptual Modeling in a Quality Perspective: Kompendiumforlaget, 2003.
[16] Lund, M. S., Hogganvik, I., Seehusen, F., and Stølen, K., "UML profile for security assessment", SINTEF ICT, Technical report STF40 A03066, 2003.
[17] OMG, "UML Profile for Modeling Quality of Service and Fault Tolerance Characteristics and Mechanisms", Object Management Group, 2006.
[18] Rumbaugh, J., Jacobson, I., and Booch, G., The Unified Modeling Language Reference Manual: Addison Wesley Longman, Inc., 1998.
[19] Shneiderman, B., Designing the User Interface: Addison-Wesley, 1992. [20] Tamassia, R., Di Battista, G., and Batini, C., "Automatic Graph Drawing and Readability
of Diagrams." IEEE Transactions on Systems, Man, and Cybernetics., vol. 18 (1), pp. 61-79, 1988.
[21] Ware, C., Information Visualization: Perception for Design, 2 ed: Elsevier Inc., 2005. [22] Winograd, T. and Flores, F., Understanding Computers and Cognition: Addison-Wesley
Professional, 1987.
Related Documents


