THE JOURNAL OF CELL BIOLOGY JCB: ARTICLE The Rockefeller University Press $30.00 J. Cell Biol. Vol. 182 No. 4 765–776 www.jcb.org/cgi/doi/10.1083/jcb.200803010 JCB 765 Correspondence to Pierre-Emmanuel Milhiet: [email protected] Abbreviations used in this paper: ADC, apparent diffusion coefficient; Chl, cho- lesterol; GPI, glycosyl-phosphatidylinositol; LAT, linker for activation of T cells; LTB, latrunculin B; M CD, methyl- -cyclodextrin; MSD, mean squared displace- ment; TEA, tetraspanin-enriched area; TIRF, total internal reflection fluorescence; WT, wild type. The online version of this article contains supplemental material. Introduction Lateral segregation of constituents of the plasma membrane of eukaryotic cells is now widely accepted as a requirement for the function of biological membranes. However, the mechanisms underlying this membrane organization are still a matter of de- bate, and several theories have been proposed to explain the lat- eral segregation of lipids and proteins. The most popular remains the lipid raft microdomains model (Simons and van Meer, 1988). These microdomains are currently defined as small, hetero- geneous, highly dynamic sterol- and sphingolipid-enriched do- mains that compartmentalize cellular processes (Jacobson et al., 2007). According to this model, plasma membrane may alter- nate liquid-ordered ( l o ; rafts) and fluid (nonraft) phases, the for- mer forming functional platforms (for review see London, 2005). Lipids, especially cholesterol (Chl), are considered key elements in the sorting of proteins into rafts. In the fence picket model, the underlying membrane skeleton is proposed to create or stabilize membrane domains that participate in the confine- ment of proteins (for review see Kusumi and Suzuki, 2005). Recent results using single-molecule approaches have con- firmed that protein–protein interactions also play an important role in the organization of macromolecular structures in the plasma membrane of eukaryotic cells (Douglass and Vale, 2005). Indeed, protein clustering of the transmembrane molecules CD2 and linker for activation of T cells (LAT) was shown to form discrete subdomains during T cell activation (Douglass and Vale, 2005), and these domains are distinct from lipid rafts. They appear after activation of T cell receptors and result from the formation of an interaction network recruiting cytoplasmic signaling molecules without involvement of the cytoskeleton. Furthermore, a recent study has also described the dynamics of T etraspanins regulate cell migration, sperm–egg fusion, and viral infection. Through interactions with one another and other cell surface proteins, tetraspanins form a network of molecular interactions called the tetraspanin web. In this study, we use single-molecule fluorescence microscopy to dissect dynamics and parti- tioning of the tetraspanin CD9. We show that lateral mo- bility of CD9 in the plasma membrane is regulated by at least two modes of interaction that each exhibit specific dynamics. The majority of CD9 molecules display Brown- ian behavior but can be transiently confined to an inter- action platform that is in permanent exchange with the rest of the membrane. These platforms, which are enriched in CD9 and its binding partners, are constant in shape and localization. Two CD9 molecules undergoing Brownian trajectories can also codiffuse, revealing extra platform interactions. CD9 mobility and partitioning are both de- pendent on its palmitoylation and plasma membrane cholesterol. Our data show the high dynamic of inter- actions in the tetraspanin web and further indicate that the tetraspanin web is distinct from raft microdomains. Single-molecule analysis of CD9 dynamics and partitioning reveals multiple modes of interaction in the tetraspanin web Cedric Espenel, 1,2 Emmanuel Margeat, 1,2 Patrice Dosset, 1,2 Cécile Arduise, 3,4 Christian Le Grimellec, 1,2 Catherine A. Royer, 1,2 Claude Boucheix, 3,4 Eric Rubinstein, 3,4 and Pierre-Emmanuel Milhiet 1,2 1 Institut National de la Santé et de la Recherche Medicale, Unité 554, 34090 Montpellier, France 2 Université de Montpellier, Centre National de la Recherche Scientifique, Unité Mixte Recherche 5048, Centre de Biochimie Structurale, 34090 Montpellier, France 3 Institut National de la Santé et de la Recherche Medicale, Unité 602,94804 Villejuif, France 4 Université Paris 11, Institut André Lwoff, 94801 Villejuif, France © 2008 Espenel et al. This article is distributed under the terms of an Attribution– Noncommercial–Share Alike–No Mirror Sites license for the first six months after the publica- tion date (see http://www.jcb.org/misc/terms.shtml). After six months it is available under a Creative Commons License (Attribution–Noncommercial–Share Alike 3.0 Unported license, as described at http://creativecommons.org/licenses/by-nc-sa/3.0/).

Welcome message from author
This document is posted to help you gain knowledge. Please leave a comment to let me know what you think about it! Share it to your friends and learn new things together.
Transcript
TH
EJ
OU
RN
AL
OF
CE
LL
BIO
LO
GY
JCB: ARTICLE
The Rockefeller University Press $30.00J. Cell Biol. Vol. 182 No. 4 765–776www.jcb.org/cgi/doi/10.1083/jcb.200803010 JCB 765
Correspondence to Pierre-Emmanuel Milhiet: [email protected]
Abbreviations used in this paper: ADC, apparent diffusion coeffi cient; Chl, cho-lesterol; GPI, glycosyl-phosphatidylinositol; LAT, linker for activation of T cells; LTB, latrunculin B; M � CD, methyl- � -cyclodextrin; MSD, mean squared displace-ment; TEA, tetraspanin-enriched area; TIRF, total internal refl ection fl uorescence; WT, wild type.
The online version of this article contains supplemental material.
Introduction Lateral segregation of constituents of the plasma membrane of
eukaryotic cells is now widely accepted as a requirement for the
function of biological membranes. However, the mechanisms
underlying this membrane organization are still a matter of de-
bate, and several theories have been proposed to explain the lat-
eral segregation of lipids and proteins. The most popular remains
the lipid raft microdomains model ( Simons and van Meer, 1988 ).
These microdomains are currently defi ned as small, hetero-
geneous, highly dynamic sterol- and sphingolipid-enriched do-
mains that compartmentalize cellular processes ( Jacobson et al.,
2007 ). According to this model, plasma membrane may alter-
nate liquid-ordered ( l o ; rafts) and fl uid (nonraft) phases, the for-
mer forming functional platforms (for review see London,
2005 ). Lipids, especially cholesterol (Chl), are considered key
elements in the sorting of proteins into rafts. In the fence picket
model, the underlying membrane skeleton is proposed to create
or stabilize membrane domains that participate in the confi ne-
ment of proteins (for review see Kusumi and Suzuki, 2005 ).
Recent results using single-molecule approaches have con-
fi rmed that protein – protein interactions also play an important
role in the organization of macromolecular structures in the
plasma membrane of eukaryotic cells ( Douglass and Vale, 2005 ).
Indeed, protein clustering of the transmembrane molecules CD2
and linker for activation of T cells (LAT) was shown to form
discrete subdomains during T cell activation ( Douglass and
Vale, 2005 ), and these domains are distinct from lipid rafts.
They appear after activation of T cell receptors and result from
the formation of an interaction network recruiting cytoplasmic
signaling molecules without involvement of the cytoskeleton.
Furthermore, a recent study has also described the dynamics of
Tetraspanins regulate cell migration, sperm – egg
fusion, and viral infection. Through interactions
with one another and other cell surface proteins,
tetraspanins form a network of molecular interactions called
the tetraspanin web. In this study, we use single-molecule
fl uorescence microscopy to dissect dynamics and parti-
tioning of the tetraspanin CD9. We show that lateral mo-
bility of CD9 in the plasma membrane is regulated by at
least two modes of interaction that each exhibit specifi c
dynamics. The majority of CD9 molecules display Brown-
ian behavior but can be transiently confi ned to an inter-
action platform that is in permanent exchange with the rest
of the membrane. These platforms, which are enriched in
CD9 and its binding partners, are constant in shape and
localization. Two CD9 molecules undergoing Brownian
trajectories can also codiffuse, revealing extra platform
interactions. CD9 mobility and partitioning are both de-
pendent on its palmitoylation and plasma membrane
cholesterol. Our data show the high dynamic of inter-
actions in the tetraspanin web and further indicate that the
tetraspanin web is distinct from raft microdomains.
Single-molecule analysis of CD9 dynamics and partitioning reveals multiple modes of interaction in the tetraspanin web
Cedric Espenel , 1,2 Emmanuel Margeat , 1,2 Patrice Dosset , 1,2 C é cile Arduise , 3,4 Christian Le Grimellec , 1,2
Catherine A. Royer , 1,2 Claude Boucheix , 3,4 Eric Rubinstein , 3,4 and Pierre-Emmanuel Milhiet 1,2
1 Institut National de la Sant é et de la Recherche Medicale, Unit é 554, 34090 Montpellier, France 2 Universit é de Montpellier, Centre National de la Recherche Scientifi que, Unit é Mixte Recherche 5048, Centre de Biochimie Structurale, 34090 Montpellier, France 3 Institut National de la Sant é et de la Recherche Medicale, Unit é 602,94804 Villejuif, France 4 Universit é Paris 11, Institut Andr é Lwoff, 94801 Villejuif, France
© 2008 Espenel et al. This article is distributed under the terms of an Attribution–Noncommercial–Share Alike–No Mirror Sites license for the fi rst six months after the publica-tion date (see http://www.jcb.org/misc/terms.shtml). After six months it is available under a Creative Commons License (Attribution–Noncommercial–Share Alike 3.0 Unported license, as described at http://creativecommons.org/licenses/by-nc-sa/3.0/).
JCB • VOLUME 182 • NUMBER 4 • 2008 766
their ability to associate with detergent-resistant membranes,
tetraspanins have been suggested to laterally segregate the pro-
teins to which they associate, possibly by forming micro-
domains physically and functionally distinct from lipid rafts
(for reviews see Boucheix and Rubinstein, 2001 ; Hemler, 2003 ;
Levy and Shoham, 2005 ).
So far, tetraspanins have been mainly studied using bio-
chemical techniques such as coimmunoprecipitation or con-
ventional fl uorescence microscopy on fi xed cells, which only
provide a snapshot of tetraspanin-mediated interactions. To under-
stand how tetraspanins functionally regulate the molecules to
which they associate, it is important to determine how they lat-
erally segregate in the plasma membrane. Single-molecule
fl uorescence microscopy on living cells, a technique pioneered
by Sako et al. (2000) and Schutz et al. (2000) , can provide in-
sights into spatial and temporal behavior of membrane compo-
nents of eukaryotic cells. Diffusion coeffi cients of membrane
proteins as well as the different modes of motion yield informa-
tion on their local environment and allow the study of factors
that limit diffusion ( Lommerse et al., 2004 ).
In this paper, we focused on the membrane behavior of
CD9, a prototype tetraspanin. Thanks to a dual-view – based de-
tection, we compared the behavior of CD9 in single molecules
to its ensemble membrane distribution. We demonstrate that
tetraspanin assemblies form dynamic interaction platforms in
permanent exchange with the rest of the membrane and also
highlight different modes of interaction in the tetraspanin web.
Results Characterization of tetraspanin complexes in PC3 cells PC3 is a well-characterized human prostatic carcinoma cell line
that expresses several tetraspanin molecules, including CD81
and CD9. Loss of CD9 expression in prostate cancer cells
has been associated with prostate cancer progression ( Wang
et al., 2007 ). Before carrying out single-molecule experiments,
tetraspanin assemblies in PC3 cells were fi rst characterized using
immunoprecipitation and immunofluorescence experiments.
Immunoprecipitation experiments were performed with anti-
CD9 and anti-CD81 antibodies on biotin-labeled cells lysed
with the detergent Brij97 ( Fig. 1 A ). Because Brij97 preserves
tetraspanin – tetraspanin interactions, any tetraspanin antibody can
precipitate the entire set of proteins present in the tetraspanin
web ( Fig. 1 A , compare CD81 and CD9 profi les). Among these
proteins are most likely CD9P-1, EWI-2, and the integrin � 3 � 1 ,
which associate with tetraspanins in all cells studied so far
( Fig. 1 A ; Charrin et al., 2001 , 2003a ; Stipp et al., 2001 ). As a
negative control, the integrin � 5 � 1 did not immunoprecipitate
CD9 or CD81 (no band comigrating with CD9 or CD81 was de-
tected even at higher exposure). As one of the aims of this study
was to determine the role of CD9 palmitoylation, we expressed a
nonpalmitoylatable CD9 mutant (CD9 plm ) in PC3 cells ( Charrin
et al., 2002 ) so that CD9 plm molecules represented at least 75%
of the total surface CD9 fraction (unpublished data). We also
overexpressed wild-type (WT) CD9 as a control (PC3/CD9).
As expected ( Rubinstein et al., 1996 ), quantitatively more proteins
supramolecular protein clusters formed by syntaxin 1 ( Sieber
et al., 2007 ). It was suggested that proteins could spontaneously
self-associate based on simple physical principles, namely a
balance between weak homophilic interactions and crowding-
induced steric repulsion ( Sieber et al., 2007 ). The existence of
small, stable clusters of membrane proteins is also supported by
numerical simulations ( Destainville, 2008 ).
Tetraspanins compose a family of proteins with four trans-
membrane domains delineating two extracellular domains of
unequal size. All mammalian cells tested so far express several
of these proteins; thus, not surprisingly, these molecules have
been implicated in numerous physiological processes. In many
examples, tetraspanins have been shown to share similar func-
tions. For example, antibodies to several tetraspanins modulate
cell migration, induce a costimulatory signal, or trigger a trans-
duction signal (for reviews see Boucheix and Rubinstein, 2001 ;
Hemler, 2003 ; Levy and Shoham, 2005 ). In addition, it has been
shown that the tetraspanins CD9 and CD81 act in concert for an
effective sperm – egg fusion ( Rubinstein et al., 2006 ). Tetraspanins
are also implicated in different diseases. Several of them, in-
cluding CD9, can modulate metastasis formation (for review
see Boucheix and Rubinstein, 2001 ). Antibodies to tetraspanins
have been shown to interfere with virus-induced cell – cell fu-
sion, including HIV ( Gordon-Alonso et al., 2006 ), and HIV as-
sembly takes place in tetraspanin-enriched plasma membrane
domains that may serve as gateways for the virus ( Nydegger
et al., 2006 ). CD81 is also required for infection of hepatocytes
by the hepatitis C virus and malaria sporozoites ( Silvie et al.,
2003 ; Cocquerel et al., 2006 ).
The function of tetraspanins is thought to be related to
their ability to interact with one another and with various other
surface proteins, forming a network of molecular interactions
referred to as the tetraspanin web. Inside the tetraspanin web,
small primary complexes composed of particular tetraspanins
associated with partner nontetraspanin proteins have been iden-
tifi ed (for review see Boucheix and Rubinstein, 2001 ). The fact
that primary complexes are observed only under conditions dis-
rupting tetraspanin – tetraspanin interactions using digitonin
and, in some cases, Triton X-100 ( Serru et al., 1999 ) suggests
that most interactions in the tetraspanin web are secondary to
tetraspanin – tetraspanin interactions. The demonstration that CD151
contributed to the interaction of the integrin � 3 � 1 with other
tetraspanins, as did CD9 for one of its molecular partners, CD9P-1,
provided strong support for this hypothesis ( Berditchevski
et al., 2002 ; Charrin et al., 2003b ). Tetraspanin – tetraspanin
interactions have been shown to be dependent at least in part
on lipids, including gangliosides and Chl ( Charrin et al., 2003c ;
Odintsova et al., 2006 ). The interaction of tetraspanins with Chl
is functionally important because modulation of cellular Chl
levels was shown to modify the extent of tyrosine phosphory-
lation observed upon antibody ligation of tetraspanins ( Charrin
et al., 2003c ; Delaguillaumie et al., 2004 ) and the CD81-depen-
dent entry of malaria sporozoites into hepatocytic cells ( Silvie
et al., 2006 ). Additionally, palmitoylation of tetraspanins partic-
ipates in the interaction with one another, although other mech-
anisms of interaction are likely ( Berditchevski et al., 2002 ;
Charrin et al., 2002 ; Yang et al., 2002 ). Based on these data and
767SINGLE-MOLECULE ANALYSIS OF THE TETRASPANIN WEB • Espenel et al.
were coimmunoprecipitated with CD9 (or CD9 plm ) in transfected
cells as compared with WT cells. We note that, as already ob-
served ( Charrin et al., 2002 ; Kovalenko et al., 2004 ), the apparent
molecular weight of CD9 plm was lower than that of WT CD9.
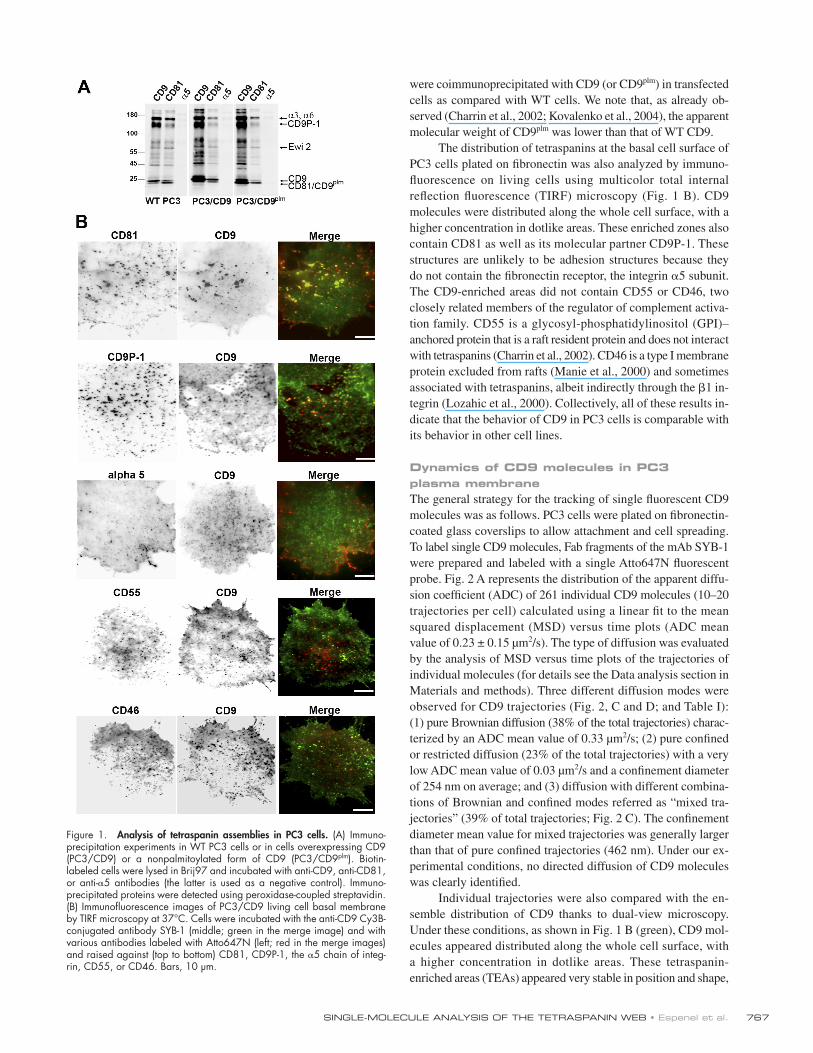
The distribution of tetraspanins at the basal cell surface of
PC3 cells plated on fi bronectin was also analyzed by immuno-
fl uorescence on living cells using multicolor total internal
refl ection fl uorescence (TIRF) microscopy ( Fig. 1 B ). CD9
molecules were distributed along the whole cell surface, with a
higher concentration in dotlike areas. These enriched zones also
contain CD81 as well as its molecular partner CD9P-1. These
structures are unlikely to be adhesion structures because they
do not contain the fi bronectin receptor, the integrin � 5 subunit.
The CD9-enriched areas did not contain CD55 or CD46, two
closely related members of the regulator of complement activa-
tion family. CD55 is a glycosyl-phosphatidylinositol (GPI) –
anchored protein that is a raft resident protein and does not interact
with tetraspanins ( Charrin et al., 2002 ). CD46 is a type I membrane
protein excluded from rafts ( Manie et al., 2000 ) and sometimes
associated with tetraspanins, albeit indirectly through the � 1 in-
tegrin ( Lozahic et al., 2000 ). Collectively, all of these results in-
dicate that the behavior of CD9 in PC3 cells is comparable with
its behavior in other cell lines.
Dynamics of CD9 molecules in PC3 plasma membrane The general strategy for the tracking of single fl uorescent CD9
molecules was as follows. PC3 cells were plated on fi bronectin-
coated glass coverslips to allow attachment and cell spreading.
To label single CD9 molecules, Fab fragments of the mAb SYB-1
were prepared and labeled with a single Atto647N fl uorescent
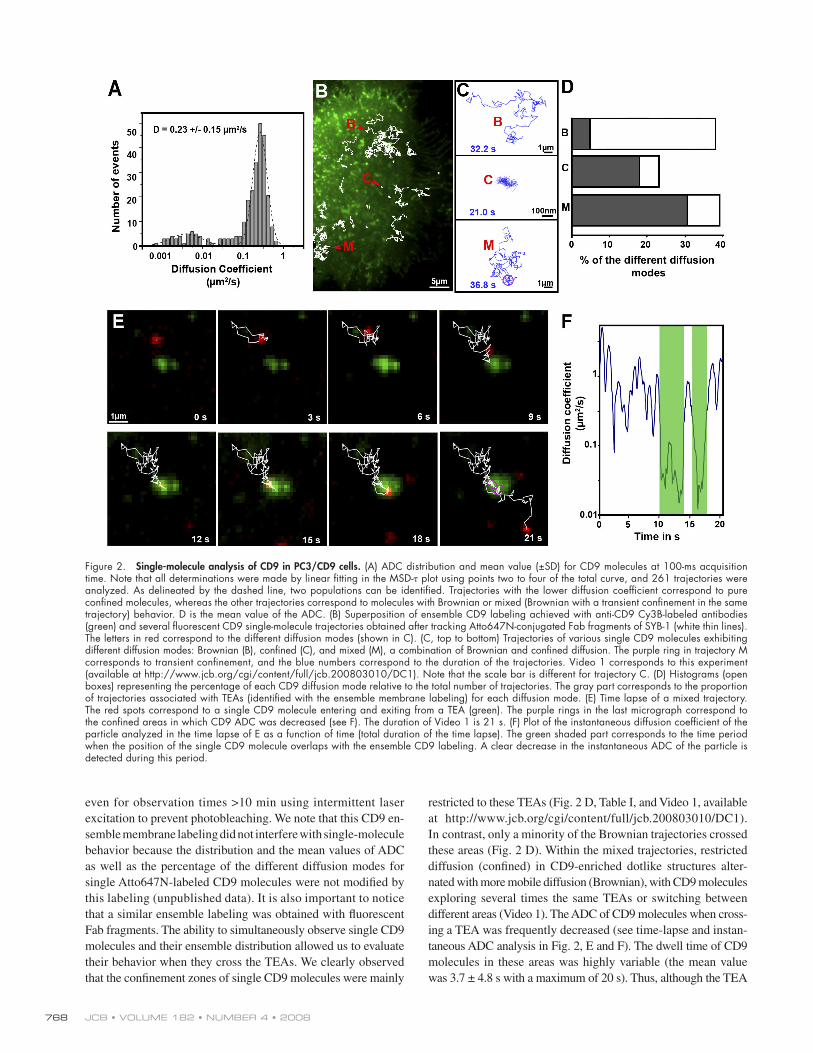
probe. Fig. 2 A represents the distribution of the apparent diffu-
sion coeffi cient (ADC) of 261 individual CD9 molecules (10 – 20
trajectories per cell) calculated using a linear fi t to the mean
squared displacement (MSD) versus time plots (ADC mean
value of 0.23 ± 0.15 μ m 2 /s). The type of diffusion was evaluated
by the analysis of MSD versus time plots of the trajectories of
individual molecules (for details see the Data analysis section in
Materials and methods). Three different diffusion modes were
observed for CD9 trajectories ( Fig. 2, C and D ; and Table I ):
(1) pure Brownian diffusion (38% of the total trajectories) charac-
terized by an ADC mean value of 0.33 μ m 2 /s; (2) pure confi ned
or restricted diffusion (23% of the total trajectories) with a very
low ADC mean value of 0.03 μ m 2 /s and a confi nement diameter
of 254 nm on average; and (3) diffusion with different combina-
tions of Brownian and confi ned modes referred as “ mixed tra-
jectories ” (39% of total trajectories; Fig. 2 C ). The confi nement
diameter mean value for mixed trajectories was generally larger
than that of pure confi ned trajectories (462 nm). Under our ex-
perimental conditions, no directed diffusion of CD9 molecules
was clearly identifi ed.
Individual trajectories were also compared with the en-
semble distribution of CD9 thanks to dual-view microscopy.
Under these conditions, as shown in Fig. 1 B (green), CD9 mol-
ecules appeared distributed along the whole cell surface, with
a higher concentration in dotlike areas. These tetraspanin-
enriched areas (TEAs) appeared very stable in position and shape,
Figure 1. Analysis of tetraspanin assemblies in PC3 cells. (A) Immuno-precipitation experiments in WT PC3 cells or in cells overexpressing CD9 (PC3/CD9) or a nonpalmitoylated form of CD9 (PC3/CD9 plm ). Biotin- labeled cells were lysed in Brij97 and incubated with anti-CD9, anti-CD81, or anti- � 5 antibodies (the latter is used as a negative control). Immuno-precipitated proteins were detected using peroxidase-coupled streptavidin. (B) Immunofl uorescence images of PC3/CD9 living cell basal membrane by TIRF microscopy at 37 ° C. Cells were incubated with the anti-CD9 Cy3B-conjugated antibody SYB-1 (middle; green in the merge image) and with various antibodies labeled with Atto647N (left; red in the merge images) and raised against (top to bottom) CD81, CD9P-1, the � 5 chain of integ-rin, CD55, or CD46. Bars, 10 μ m.
JCB • VOLUME 182 • NUMBER 4 • 2008 768
restricted to these TEAs ( Fig. 2 D , Table I , and Video 1, available
at http://www.jcb.org/cgi/content/full/jcb.200803010/DC1).
In contrast, only a minority of the Brownian trajectories crossed
these areas ( Fig. 2 D ). Within the mixed trajectories, restricted
diffusion (confi ned) in CD9-enriched dotlike structures alter-
nated with more mobile diffusion (Brownian), with CD9 molecules
exploring several times the same TEAs or switching between
different areas (Video 1). The ADC of CD9 molecules when cross-
ing a TEA was frequently decreased (see time-lapse and instan-
taneous ADC analysis in Fig. 2, E and F ). The dwell time of CD9
molecules in these areas was highly variable (the mean value
was 3.7 ± 4.8 s with a maximum of 20 s). Thus, although the TEA
even for observation times > 10 min using intermittent laser
excitation to prevent photobleaching. We note that this CD9 en-
semble membrane labeling did not interfere with single-molecule
behavior because the distribution and the mean values of ADC
as well as the percentage of the different diffusion modes for
single Atto647N-labeled CD9 molecules were not modifi ed by
this labeling (unpublished data). It is also important to notice
that a similar ensemble labeling was obtained with fl uorescent
Fab fragments. The ability to simultaneously observe single CD9
molecules and their ensemble distribution allowed us to evaluate
their behavior when they cross the TEAs. We clearly observed
that the confi nement zones of single CD9 molecules were mainly
Figure 2. Single-molecule analysis of CD9 in PC3/CD9 cells. (A) ADC distribution and mean value ( ± SD) for CD9 molecules at 100-ms acquisition time. Note that all determinations were made by linear fi tting in the MSD- � plot using points two to four of the total curve, and 261 trajectories were analyzed. As delineated by the dashed line, two populations can be identifi ed. Trajectories with the lower diffusion coeffi cient correspond to pure confi ned molecules, whereas the other trajectories correspond to molecules with Brownian or mixed (Brownian with a transient confi nement in the same trajectory) behavior. D is the mean value of the ADC. (B) Superposition of ensemble CD9 labeling achieved with anti-CD9 Cy3B-labeled antibodies (green) and several fl uorescent CD9 single-molecule trajectories obtained after tracking Atto647N-conjugated Fab fragments of SYB-1 (white thin lines). The letters in red correspond to the different diffusion modes (shown in C). (C, top to bottom) Trajectories of various single CD9 molecules exhibiting different diffusion modes: Brownian (B), confi ned (C), and mixed (M), a combination of Brownian and confi ned diffusion. The purple ring in trajectory M corresponds to transient confi nement, and the blue numbers correspond to the duration of the trajectories. Video 1 corresponds to this experiment (available at http://www.jcb.org/cgi/ content/full/jcb.200803010/DC1). Note that the scale bar is different for trajectory C. (D) Histograms (open boxes) representing the percentage of each CD9 diffusion mode relative to the total number of trajectories. The gray part corresponds to the proportion of trajectories associated with TEAs (identifi ed with the ensemble membrane labeling) for each diffusion mode. (E) Time lapse of a mixed trajectory. The red spots correspond to a single CD9 molecule entering and exiting from a TEA (green). The purple rings in the last micrograph correspond to the confi ned areas in which CD9 ADC was decreased (see F). The duration of Video 1 is 21 s. (F) Plot of the instantaneous diffusion coeffi cient of the particle analyzed in the time lapse of E as a function of time (total duration of the time lapse). The green shaded part corresponds to the time period when the position of the single CD9 molecule overlaps with the ensemble CD9 labeling. A clear decrease in the instantaneous ADC of the particle is detected during this period.
769SINGLE-MOLECULE ANALYSIS OF THE TETRASPANIN WEB • Espenel et al.
methods) and did not dramatically alter the cells as shown by the
preservation of the actin network and the conservation of dotlike
structures enriched in CD9 (Fig. S2 B, available at http://www
.jcb.org/cgi/content/full/jcb.200803010/DC1). Decrease of the
membrane Chl content led to a threefold reduction of the mean
are relatively stable in time and place on the minute time scale,
their majority appear to be highly dynamic structural domains in
that numerous exchanges in or out of these structures take place.
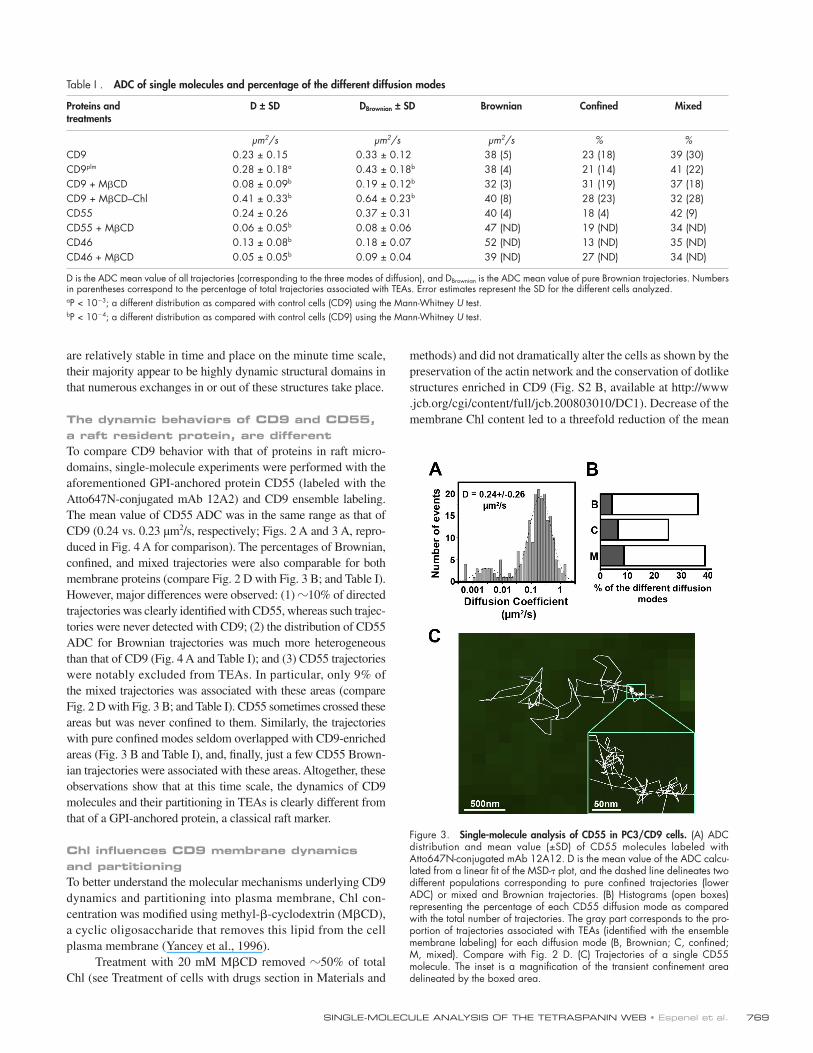
The dynamic behaviors of CD9 and CD55, a raft resident protein, are different To compare CD9 behavior with that of proteins in raft micro-
domains, single-molecule experiments were performed with the
aforementioned GPI-anchored protein CD55 (labeled with the
Atto647N-conjugated mAb 12A2) and CD9 ensemble labeling.
The mean value of CD55 ADC was in the same range as that of
CD9 (0.24 vs. 0.23 μ m 2 /s, respectively; Figs. 2 A and 3 A , repro-
duced in Fig. 4 A for comparison). The percentages of Brownian,
confi ned, and mixed trajectories were also comparable for both
membrane proteins (compare Fig. 2 D with Fig. 3 B ; and Table I ).
However, major differences were observed: (1) � 10% of directed
trajectories was clearly identifi ed with CD55, whereas such trajec-
tories were never detected with CD9; (2) the distribution of CD55
ADC for Brownian trajectories was much more heterogeneous
than that of CD9 ( Fig. 4 A and Table I ); and (3) CD55 trajectories
were notably excluded from TEAs. In particular, only 9% of
the mixed trajectories was associated with these areas (compare
Fig. 2 D with Fig. 3 B ; and Table I ). CD55 sometimes crossed these
areas but was never confi ned to them. Similarly, the trajectories
with pure confi ned modes seldom overlapped with CD9-enriched
areas ( Fig. 3 B and Table I ), and, fi nally, just a few CD55 Brown-
ian trajectories were associated with these areas. Altogether, these
observations show that at this time scale, the dynamics of CD9
molecules and their partitioning in TEAs is clearly different from
that of a GPI-anchored protein, a classical raft marker.
Chl infl uences CD9 membrane dynamics and partitioning To better understand the molecular mechanisms underlying CD9
dynamics and partitioning into plasma membrane, Chl con-
centration was modifi ed using methyl- � -cyclodextrin (M � CD),
a cyclic oligosaccharide that removes this lipid from the cell
plasma membrane ( Yancey et al., 1996 ).
Treatment with 20 mM M � CD removed � 50% of total
Chl (see Treatment of cells with drugs section in Materials and
Table I . ADC of single molecules and percentage of the different diffusion modes
Proteins and treatments
D ± SD D Brownian ± SD Brownian Confi ned Mixed
μ m 2 /s μ m 2 /s μ m 2 /s % %
CD9 0.23 ± 0.15 0.33 ± 0.12 38 (5) 23 (18) 39 (30)
CD9 plm 0.28 ± 0.18 a 0.43 ± 0.18 b 38 (4) 21 (14) 41 (22)
CD9 + M � CD 0.08 ± 0.09 b 0.19 ± 0.12 b 32 (3) 31 (19) 37 (18)
CD9 + M � CD – Chl 0.41 ± 0.33 b 0.64 ± 0.23 b 40 (8) 28 (23) 32 (28)
CD55 0.24 ± 0.26 0.37 ± 0.31 40 (4) 18 (4) 42 (9)
CD55 + M � CD 0.06 ± 0.05 b 0.08 ± 0.06 47 (ND) 19 (ND) 34 (ND)
CD46 0.13 ± 0.08 b 0.18 ± 0.07 52 (ND) 13 (ND) 35 (ND)
CD46 + M � CD 0.05 ± 0.05 b 0.09 ± 0.04 39 (ND) 27 (ND) 34 (ND)
D is the ADC mean value of all trajectories (corresponding to the three modes of diffusion), and D Brownian is the ADC mean value of pure Brownian trajectories. Numbers in parentheses correspond to the percentage of total trajectories associated with TEAs. Error estimates represent the SD for the different cells analyzed.
a P < 10 � 3 ; a different distribution as compared with control cells (CD9) using the Mann-Whitney U test.
b P < 10 � 4 ; a different distribution as compared with control cells (CD9) using the Mann-Whitney U test.
Figure 3. Single-molecule analysis of CD55 in PC3/CD9 cells. (A) ADC distribution and mean value ( ± SD) of CD55 molecules labeled with Atto647N-conjugated mAb 12A12. D is the mean value of the ADC calcu-lated from a linear fi t of the MSD- � plot, and the dashed line delineates two different populations corresponding to pure confi ned trajectories (lower ADC) or mixed and Brownian trajectories. (B) Histograms (open boxes) representing the percentage of each CD55 diffusion mode as compared with the total number of trajectories. The gray part corresponds to the pro-portion of trajectories associated with TEAs (identifi ed with the ensemble membrane labeling) for each diffusion mode (B, Brownian; C, confi ned; M, mixed). Compare with Fig. 2 D . (C) Trajectories of a single CD55 molecule. The inset is a magnifi cation of the transient confi nement area delineated by the boxed area.
JCB • VOLUME 182 • NUMBER 4 • 2008 770
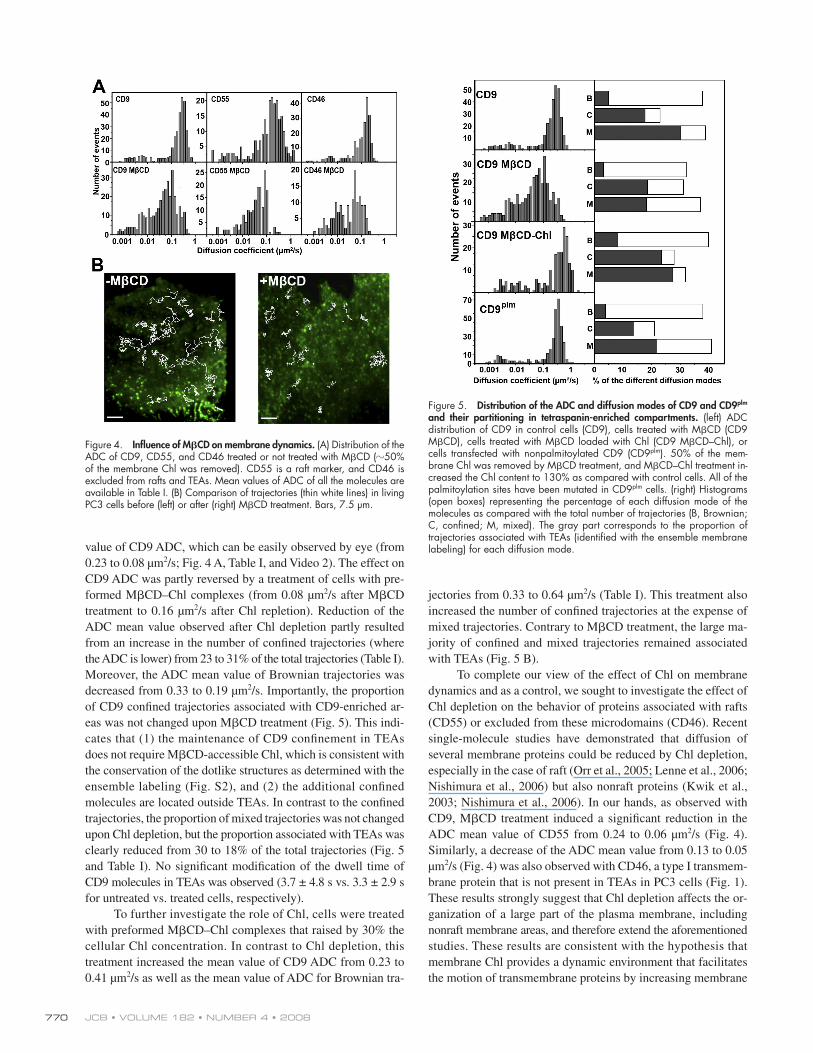
jectories from 0.33 to 0.64 μ m 2 /s ( Table I ). This treatment also
increased the number of confi ned trajectories at the expense of
mixed trajectories. Contrary to M � CD treatment, the large ma-
jority of confi ned and mixed trajectories remained associated
with TEAs ( Fig. 5 B ).
To complete our view of the effect of Chl on membrane
dynamics and as a control, we sought to investigate the effect of
Chl depletion on the behavior of proteins associated with rafts
(CD55) or excluded from these microdomains (CD46). Recent
single-molecule studies have demonstrated that diffusion of
several membrane proteins could be reduced by Chl depletion,
especially in the case of raft ( Orr et al., 2005 ; Lenne et al., 2006 ;
Nishimura et al., 2006 ) but also nonraft proteins ( Kwik et al.,
2003 ; Nishimura et al., 2006 ). In our hands, as observed with
CD9, M � CD treatment induced a signifi cant reduction in the
ADC mean value of CD55 from 0.24 to 0.06 μ m 2 /s ( Fig. 4 ).
Similarly, a decrease of the ADC mean value from 0.13 to 0.05
μ m 2 /s ( Fig. 4 ) was also observed with CD46, a type I transmem-
brane protein that is not present in TEAs in PC3 cells ( Fig. 1 ).
These results strongly suggest that Chl depletion affects the or-
ganization of a large part of the plasma membrane, including
nonraft membrane areas, and therefore extend the aforementioned
studies. These results are consistent with the hypothesis that
membrane Chl provides a dynamic environment that facilitates
the motion of transmembrane proteins by increasing membrane
value of CD9 ADC, which can be easily observed by eye (from
0.23 to 0.08 μ m 2 /s; Fig. 4 A , Table I , and Video 2). The effect on
CD9 ADC was partly reversed by a treatment of cells with pre-
formed M � CD – Chl complexes (from 0.08 μ m 2 /s after M � CD
treatment to 0.16 μ m 2 /s after Chl repletion). Reduction of the
ADC mean value observed after Chl depletion partly resulted
from an increase in the number of confi ned trajectories (where
the ADC is lower) from 23 to 31% of the total trajectories ( Table I ).
Moreover, the ADC mean value of Brownian trajectories was
decreased from 0.33 to 0.19 μ m 2 /s. Importantly, the proportion
of CD9 confi ned trajectories associated with CD9-enriched ar-
eas was not changed upon M � CD treatment ( Fig. 5 ). This indi-
cates that (1) the maintenance of CD9 confi nement in TEAs
does not require M � CD-accessible Chl, which is consistent with
the conservation of the dotlike structures as determined with the
ensemble labeling (Fig. S2), and (2) the additional confi ned
molecules are located outside TEAs. In contrast to the confi ned
trajectories, the proportion of mixed trajectories was not changed
upon Chl depletion, but the proportion associated with TEAs was
clearly reduced from 30 to 18% of the total trajectories ( Fig. 5
and Table I ). No signifi cant modifi cation of the dwell time of
CD9 molecules in TEAs was observed (3.7 ± 4.8 s vs. 3.3 ± 2.9 s
for untreated vs. treated cells, respectively).
To further investigate the role of Chl, cells were treated
with preformed M � CD – Chl complexes that raised by 30% the
cellular Chl concentration. In contrast to Chl depletion, this
treatment increased the mean value of CD9 ADC from 0.23 to
0.41 μ m 2 /s as well as the mean value of ADC for Brownian tra-
Figure 4. Infl uence of M � CD on membrane dynamics. (A) Distribution of the ADC of CD9, CD55, and CD46 treated or not treated with M � CD ( � 50% of the membrane Chl was removed). CD55 is a raft marker, and CD46 is excluded from rafts and TEAs. Mean values of ADC of all the molecules are available in Table I . (B) Comparison of trajectories (thin white lines) in living PC3 cells before (left) or after (right) M � CD treatment. Bars, 7.5 μ m.
Figure 5. Distribution of the ADC and diffusion modes of CD9 and CD9 plm and their partitioning in tetraspanin-enriched compartments. (left) ADC distribution of CD9 in control cells (CD9), cells treated with M � CD (CD9 M � CD), cells treated with M � CD loaded with Chl (CD9 M � CD – Chl), or cells transfected with nonpalmitoylated CD9 (CD9 plm ). 50% of the mem-brane Chl was removed by M � CD treatment, and M � CD – Chl treatment in-creased the Chl content to 130% as compared with control cells. All of the palmitoylation sites have been mutated in CD9 plm cells. (right) Histograms (open boxes) representing the percentage of each diffusion mode of the molecules as compared with the total number of trajectories (B, Brownian; C, confi ned; M, mixed). The gray part corresponds to the proportion of trajectories associated with TEAs (identifi ed with the ensemble membrane labeling) for each diffusion mode.
771SINGLE-MOLECULE ANALYSIS OF THE TETRASPANIN WEB • Espenel et al.
In PC3 cells, codiffusing CD9 molecules were observed
in � 15% of the Brownian and mixed trajectories. However, for
comparison with other molecules and to prevent any drawbacks
that could be caused by a difference in the density of molecules
expressed in different analyzed cells (the higher the density, the
higher the probability of two molecules to diffuse together), we
express our results as the percentage of colocalized pairs of tra-
jectories as compared with the number of total possible pairs of
single-labeled molecules per cell (see Dynamic colocalization
section in Materials and methods). Under these conditions, dy-
namic CD9 colocalization was observed in 5% of the total pos-
sible pairs (number of pairs, n = 14,535; Fig. 6 C , histogram).
The specifi city of CD9 behavior was assessed by measuring the
percentage of trajectories displaying dynamic colocalization for
fl uidity through its preferential interaction with lipids, present-
ing a high order parameter.
Collectively, our results demonstrate that Chl greatly in-
fl uences CD9 membrane dynamics and partitioning into TEAs.
Decrease of CD9 dynamics by Chl depletion is likely to be the
result of a general effect on the plasma membrane, probably by
modifying its fl uidity, whereas modifi cation of CD9 partition-
ing appears to be linked directly to the organization of the
tetraspanin web.
Palmitoylation modifi es CD9 membrane behavior Palmitoylation plays a key role in the association of tetraspanins
with each other, and indirect evidence suggests that it may con-
tribute to the interaction with Chl ( Berditchevski et al., 2002 ;
Yang et al., 2002 ; Charrin et al., 2003b ). Taking into account the
aforementioned infl uence of Chl in CD9 dynamics, we evalu-
ated the role of this posttranslational modifi cation in CD9 be-
havior using PC3 cells expressing a nonpalmitoylatable CD9
mutant (PC3/CD9 plm ; Charrin et al., 2002 ).
Single-molecule analysis reveals a slight but signifi cant
difference in the ADC mean value between WT CD9 and its
nonpalmitoylatable form CD9 plm (0.23 μ m 2 /s and 0.28 μ m 2 /s,
respectively). This difference mainly corresponds to an increase
of the ADC of Brownian trajectories (from 0.33 to 0.43 μ m 2 /s),
suggesting that such lipid modifi cation contributes to restricting
the free diffusion of CD9. Palmitoylation is also involved in
CD9 partitioning. Indeed, the absence of CD9 palmitoylation
largely decreased the percentage of total trajectories with a mixed
(from 30 to 22%) and a confi ned (from 18 to 14%) diffusion
mode that are localized in or associated with TEAs ( Fig. 5 and
Table I ). As already observed after Chl depletion, modifi cation
of CD9 partitioning was not associated with a modifi cation of
the dwell time of CD9 plm molecules in confi ned areas of mixed
trajectories (3.7 ± 4.8 s vs. 3.7 ± 2.7 s for WT CD9 vs. CD9 plm
cells, respectively). Because the distribution of the different dif-
fusion modes for CD9 plm was similar to that of the WT protein
( Fig. 5 and Table I ), these results strongly suggest that palmi-
toylation promotes CD9 confi nement within TEAs.
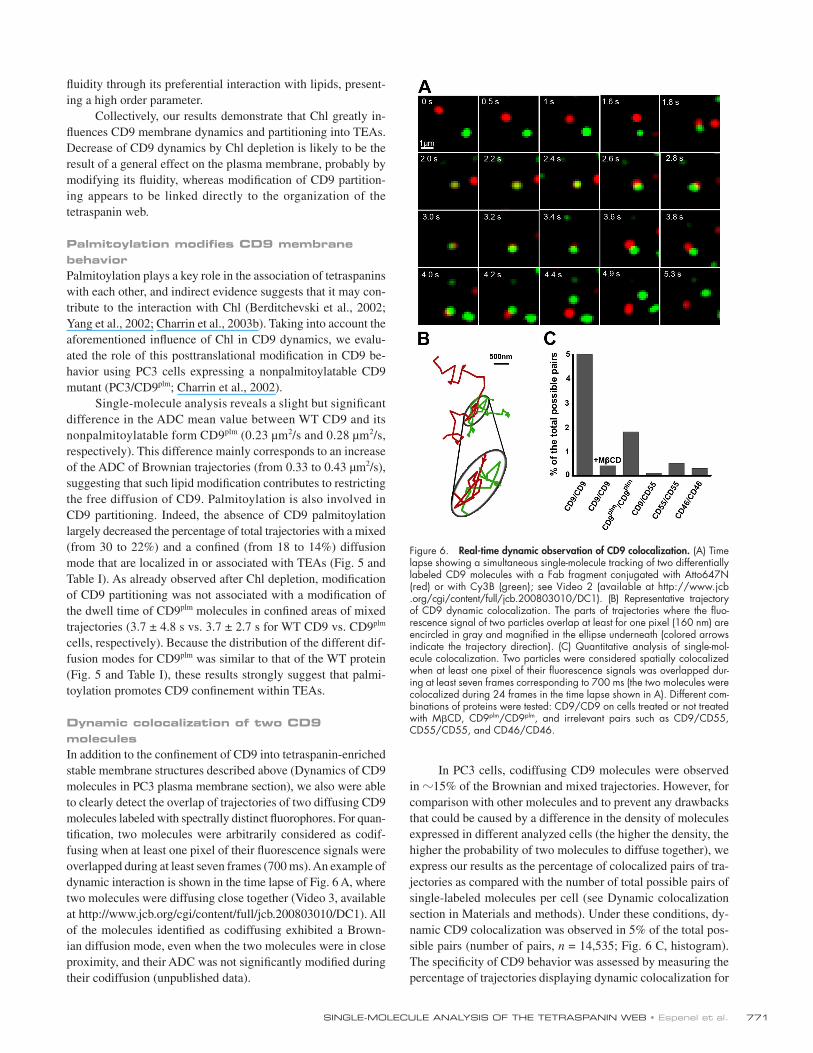
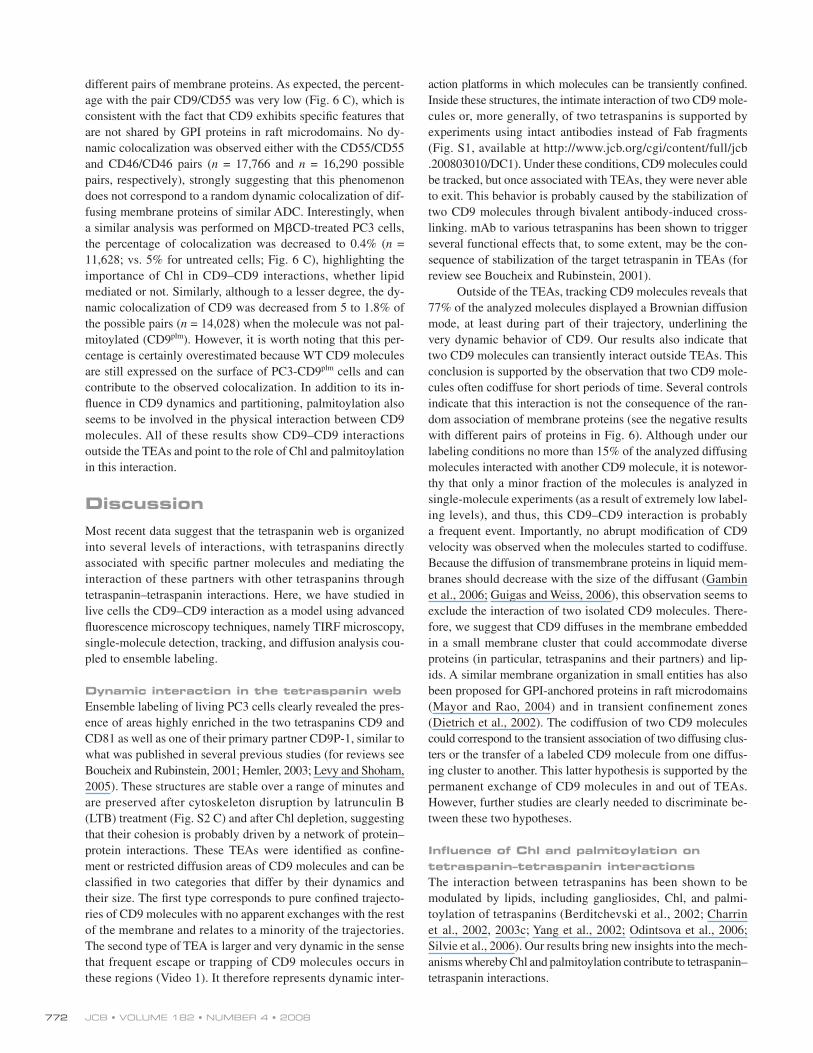
Dynamic colocalization of two CD9 molecules In addition to the confi nement of CD9 into tetraspanin-enriched
stable membrane structures described above (Dynamics of CD9
molecules in PC3 plasma membrane section), we also were able
to clearly detect the overlap of trajectories of two diffusing CD9
molecules labeled with spectrally distinct fl uorophores. For quan-
tifi cation, two molecules were arbitrarily considered as codif-
fusing when at least one pixel of their fl uorescence signals were
overlapped during at least seven frames (700 ms). An example of
dynamic interaction is shown in the time lapse of Fig. 6 A, where
two molecules were diffusing close together (Video 3, available
at http://www.jcb.org/cgi/content/full/jcb.200803010/DC1). All
of the molecules identifi ed as codiffusing exhibited a Brown-
ian diffusion mode, even when the two molecules were in close
proximity, and their ADC was not signifi cantly modifi ed during
their codiffusion (unpublished data).
Figure 6. Real-time dynamic observation of CD9 colocalization. (A) Time lapse showing a simultaneous single-molecule tracking of two differentially labeled CD9 molecules with a Fab fragment conjugated with Atto647N (red) or with Cy3B (green); see Video 2 (available at http://www.jcb.org/cgi/content/full/jcb.200803010/DC1). (B) Representative trajectory of CD9 dynamic colocalization. The parts of trajectories where the fl uo-rescence signal of two particles overlap at least for one pixel (160 nm) are encircled in gray and magnifi ed in the ellipse underneath (colored arrows indicate the trajectory direction). (C) Quantitative analysis of single-mol-ecule colocalization. Two particles were considered spatially colocalized when at least one pixel of their fl uorescence signals was overlapped dur-ing at least seven frames corresponding to 700 ms (the two molecules were colocalized during 24 frames in the time lapse shown in A). Different com-binations of proteins were tested: CD9/CD9 on cells treated or not treated with M � CD, CD9 plm /CD9 plm , and irrelevant pairs such as CD9/CD55, CD55/CD55, and CD46/CD46.
JCB • VOLUME 182 • NUMBER 4 • 2008 772
action platforms in which molecules can be transiently confi ned.
Inside these structures, the intimate interaction of two CD9 mole-
cules or, more generally, of two tetraspanins is supported by
experiments using intact antibodies instead of Fab fragments
(Fig. S1, available at http://www.jcb.org/cgi/content/full/jcb
.200803010/DC1). Under these conditions, CD9 molecules could
be tracked, but once associated with TEAs, they were never able
to exit. This behavior is probably caused by the stabilization of
two CD9 molecules through bivalent antibody-induced cross-
linking. mAb to various tetraspanins has been shown to trigger
several functional effects that, to some extent, may be the con-
sequence of stabilization of the target tetraspanin in TEAs (for
review see Boucheix and Rubinstein, 2001 ).
Outside of the TEAs, tracking CD9 molecules reveals that
77% of the analyzed molecules displayed a Brownian diffusion
mode, at least during part of their trajectory, underlining the
very dynamic behavior of CD9. Our results also indicate that
two CD9 molecules can transiently interact outside TEAs. This
conclusion is supported by the observation that two CD9 mole-
cules often codiffuse for short periods of time. Several controls
indicate that this interaction is not the consequence of the ran-
dom association of membrane proteins (see the negative results
with different pairs of proteins in Fig. 6 ). Although under our
labeling conditions no more than 15% of the analyzed diffusing
molecules interacted with another CD9 molecule, it is notewor-
thy that only a minor fraction of the molecules is analyzed in
single-molecule experiments (as a result of extremely low label-
ing levels), and thus, this CD9 – CD9 interaction is probably
a frequent event. Importantly, no abrupt modifi cation of CD9
velocity was observed when the molecules started to codiffuse.
Because the diffusion of transmembrane proteins in liquid mem-
branes should decrease with the size of the diffusant ( Gambin
et al., 2006 ; Guigas and Weiss, 2006 ), this observation seems to
exclude the interaction of two isolated CD9 molecules. There-
fore, we suggest that CD9 diffuses in the membrane embedded
in a small membrane cluster that could accommodate diverse
proteins (in particular, tetraspanins and their partners) and lip-
ids. A similar membrane organization in small entities has also
been proposed for GPI-anchored proteins in raft microdomains
( Mayor and Rao, 2004 ) and in transient confi nement zones
( Dietrich et al., 2002 ). The codiffusion of two CD9 molecules
could correspond to the transient association of two diffusing clus-
ters or the transfer of a labeled CD9 molecule from one diffus-
ing cluster to another. This latter hypothesis is supported by the
permanent exchange of CD9 molecules in and out of TEAs.
However, further studies are clearly needed to discriminate be-
tween these two hypotheses.
Infl uence of Chl and palmitoylation on tetraspanin – tetraspanin interactions The interaction between tetraspanins has been shown to be
modulated by lipids, including gangliosides, Chl, and palmi-
toylation of tetraspanins ( Berditchevski et al., 2002 ; Charrin
et al., 2002 , 2003c ; Yang et al., 2002 ; Odintsova et al., 2006 ;
Silvie et al., 2006 ). Our results bring new insights into the mech-
anisms whereby Chl and palmitoylation contribute to tetraspanin –
tetraspanin interactions.
different pairs of membrane proteins. As expected, the percent-
age with the pair CD9/CD55 was very low ( Fig. 6 C ), which is
consistent with the fact that CD9 exhibits specifi c features that
are not shared by GPI proteins in raft microdomains. No dy-
namic colocalization was observed either with the CD55/CD55
and CD46/CD46 pairs ( n = 17,766 and n = 16,290 possible
pairs, respectively), strongly suggesting that this phenomenon
does not correspond to a random dynamic colocalization of dif-
fusing membrane proteins of similar ADC. Interestingly, when
a similar analysis was performed on M � CD-treated PC3 cells,
the percentage of colocalization was decreased to 0.4% ( n =
11,628; vs. 5% for untreated cells; Fig. 6 C ), highlighting the
importance of Chl in CD9 – CD9 interactions, whether lipid
mediated or not. Similarly, although to a lesser degree, the dy-
namic colocalization of CD9 was decreased from 5 to 1.8% of
the possible pairs ( n = 14,028) when the molecule was not pal-
mitoylated (CD9 plm ). However, it is worth noting that this per-
centage is certainly overestimated because WT CD9 molecules
are still expressed on the surface of PC3-CD9 plm cells and can
contribute to the observed colocalization. In addition to its in-
fl uence in CD9 dynamics and partitioning, palmitoylation also
seems to be involved in the physical interaction between CD9
molecules. All of these results show CD9 – CD9 interactions
outside the TEAs and point to the role of Chl and palmitoylation
in this interaction.
Discussion Most recent data suggest that the tetraspanin web is organized
into several levels of interactions, with tetraspanins directly
associated with specifi c partner molecules and mediating the
interaction of these partners with other tetraspanins through
tetraspanin – tetraspanin interactions. Here, we have studied in
live cells the CD9 – CD9 interaction as a model using advanced
fl uorescence microscopy techniques, namely TIRF microscopy,
single-molecule detection, tracking, and diffusion analysis cou-
pled to ensemble labeling.
Dynamic interaction in the tetraspanin web Ensemble labeling of living PC3 cells clearly revealed the pres-
ence of areas highly enriched in the two tetraspanins CD9 and
CD81 as well as one of their primary partner CD9P-1, similar to
what was published in several previous studies (for reviews see
Boucheix and Rubinstein, 2001 ; Hemler, 2003 ; Levy and Shoham,
2005 ). These structures are stable over a range of minutes and
are preserved after cytoskeleton disruption by latrunculin B
(LTB) treatment (Fig. S2 C) and after Chl depletion, suggesting
that their cohesion is probably driven by a network of protein –
protein interactions. These TEAs were identifi ed as confi ne-
ment or restricted diffusion areas of CD9 molecules and can be
classifi ed in two categories that differ by their dynamics and
their size. The fi rst type corresponds to pure confi ned trajecto-
ries of CD9 molecules with no apparent exchanges with the rest
of the membrane and relates to a minority of the trajectories.
The second type of TEA is larger and very dynamic in the sense
that frequent escape or trapping of CD9 molecules occurs in
these regions (Video 1). It therefore represents dynamic inter-
773SINGLE-MOLECULE ANALYSIS OF THE TETRASPANIN WEB • Espenel et al.
et al., 2002 ; Charrin et al., 2002 ; Yang et al., 2002 ) and why Chl
depletion in living cells did not produce any apparent modifi ca-
tion of tetraspanin – tetraspanin interactions ( Charrin et al., 2003c ).
In addition, treatment of living cells with M � CD was shown to
inhibit the CD81-dependent infection of liver cells by malaria
sporozoites ( Silvie et al., 2003 ), tyrosine phosphorylation in-
duced upon tetraspanin ligation in lymphoid B cells ( Charrin
et al., 2003c ), and functional effects induced by CD82 engage-
ment in Jurkat T cells ( Delaguillaumie et al., 2004 ). These ef-
fects may refl ect the importance of the dynamic of interactions
within the tetraspanin web.
Comparison of CD9 dynamic behavior with other membrane proteins The dynamic parameters that we have measured for CD9 com-
pare well with other membrane proteins. The mean diffusion
coeffi cient of CD9 is of the same order of magnitude as other
membrane proteins such GPI-anchored proteins (CD55 in this
study or CD59 in recent publications using single dye tracking;
Suzuki et al., 2007 ; Wieser et al., 2007 ) or transmembrane pro-
teins (the single-span transmembrane protein CD46 in this study,
LAT [ Douglass and Vale, 2005 ], or the G protein – coupled
μ -opioid receptor [ Suzuki et al., 2005 ]). Similarly, the differ-
ent types of diffusion modes that we observed with CD9, namely
confi ned, Brownian, and mixed (a combination of Brownian and
confi ned or restricted diffusion), correspond with a widespread be-
havior of plasma membrane proteins because similar results were
obtained for two other proteins in this study and are described
in several publications (for reviews see Kusumi and Suzuki,
2005 ; Sako, 2006 ). This behavior certainly refl ects the general
dynamics of plasma membrane and the ubiquitous membrane
compartmentalization in regions or domains that can be enriched
in specialized lipids as described for rafts ( Jacobson et al., 2007 ),
in specialized proteins as described for T signaling clusters
( Douglass and Vale, 2005 ), or a mixture of both, as suggested
here for CD9.
Despite these similarities with other membrane proteins,
several major and unique characteristics of CD9 can be noted.
The actin cytoskeleton does not appear to be involved in mainte-
nance of the TEAs identifi ed as confi nement areas. This feature
clearly differentiates TEAs from other transient confi nement
areas such as transient confinement zones enriched in GPI-
anchored protein Thy-1 ( Chen et al., 2006 ) or from regions
of temporary arrest of lateral diffusion observed with CD59
( Suzuki et al., 2007 ). Importantly, the confi nement areas observed
with the GPI-anchored protein CD55 (pure or transient confi ne-
ment in mixed trajectories) were different from those of CD9
because they were not enriched in tetraspanins, suggesting that
different mechanisms drive the transient confi nement of differ-
ent types of membrane proteins. Moreover, no codiffusion be-
tween CD9 and CD55 molecules could be observed. Altogether,
these data indicate that the tetraspanin web is physically distinct
from the raft microdomains enriched in GPI-anchored proteins.
A model for the tetraspanin web The tetraspanin web has been defi ned as a network of molecular
interactions organized by tetraspanins. Our data indicate that
We have demonstrated that the number of transient con-
fi nements of CD9 in the TEAs (observed in mixed trajectories)
was reduced after Chl depletion and mutation of palmitoylation
sites. Importantly Chl depletion did not disrupt the dotlike CD9-
enriched structures (Fig. S2) and did not change CD9 dwell time
in TEAs. Similarly, the dwell time of CD9 plm residency was not
different from that of WT CD9. Altogether, these data suggest
that neither Chl nor palmitoylation contribute signifi cantly to the
maintenance of CD9 in these structures and rather further sup-
port a role of protein – protein interactions. Chl and palmitoylation
may therefore facilitate the initial interaction of CD9 with TEAs.
This hypothesis is supported by the fact that increasing Chl con-
centration increased the number of confi ned trajectories and the
confi nement of CD9 in TEAs in the mixed trajectories.
The number of CD9 molecules dynamically interacting
with one another outside the TEAs was also strongly dimin-
ished after Chl depletion or palmitoylation removal ( Fig. 6 ).
The effect of palmitoylation removal can be explained in the
context of the model whereby tetraspanins diffuse in the mem-
brane embedded in small clusters. A possibility is that palmi-
toylation may be involved in the interactions of CD9 in such
clusters or in the assembly of these clusters. This hypothesis is
consistent with the fact that diffusion of the nonpalmitoylated
CD9 is faster than that of WT CD9. A possible explanation for
this faster diffusion is that this mutant diffuses in smaller plat-
forms than those containing WT CD9, or possibly as an isolated
molecule (a similar increase in the ADC for a nonpalmitoylat-
able mutant of LAT has also been reported; Douglass and Vale,
2005 ). One can argue that this faster diffusion could also be ex-
plained by the preferential partition of palmitoylated proteins in
the l o phase ( Melkonian et al., 1999 ), in which lipids diffuse
slower than in a fl uid phase. However, even if we cannot com-
pletely exclude this possibility, the palmitoylation of tetraspan-
ins does not appear to drive their partition into a l o phase because
their solubilization by detergents is not infl uenced by this modi-
fi cation as determined by sucrose gradient fractionation ( Charrin
et al., 2002 ; Yang et al., 2002 ).
The decrease of the number of dynamically interacting
CD9 molecules after Chl depletion cannot be explained by a
30% decrease of CD9 ADC of the Brownian trajectories ob-
served after M � CD treatment. Indeed, simulation of randomly
chosen Brownian particles under experimental conditions close
to those described with CD9 (in terms of the number of particles
in a fi eld and the diffusion coeffi cients; see Brownian dynamic
simulation section in Materials and methods) indicates that the
number of associations of particles is not dramatically modifi ed
by a twofold decrease of the ADC of these particles (unpub-
lished data). It is therefore tempting to speculate that Chl could
mediate direct interaction between two diffusing CD9 mole-
cules in agreement with the observation that tetraspanins asso-
ciate with this lipid ( Charrin et al., 2003c ).
We propose that palmitoylation and Chl are especially im-
portant for the dynamics of tetraspanin interactions rather than
being involved in the maintenance of these interactions, whether
they take place inside or outside TEAs. This may explain why
mutation of palmitoylation sites of tetraspanins has only a par-
tial effect on tetraspanin – tetraspanin interactions ( Berditchevski
JCB • VOLUME 182 • NUMBER 4 • 2008 774
Single-molecule experimental setup Cells were incubated in DME/F12 at 37 ° C for 10 min with 4 ng/ml Cy3B-labeled antibodies for ensemble labeling or/and 4 pg/ml Atto647N- labeled Fab fragments for single-molecule labeling. The dynamics of single tetraspanin molecules was investigated at 37 ° C using TIRF microscopy, which reduces background fl uorescence caused by the cytoplasmic auto-fl uorescence ( Sako et al., 2000 ). A homemade objective-type TIRF setup allowing multicolor single-molecule imaging was used. Excitation was achieved by focusing the 532-nm light from a diode-pumped double Nd – yttrium aluminium garnet laser (Crystalaser) and/or the 632.8-nm light from a HeNe laser (Melles Griot) into the back focal plane of an � Plan Fluor 100 × /1.45 NA objective (Carl Zeiss, Inc.). The emitted photons were collected through the same objective, and the beam was split into two regions of the CCD detector (Cascade 512B; Roper Scientifi c) using two dichroic mirrors (630DRLP; Omega Optical), allowing simultaneous obser-vation of the two fl uorescent dyes (dual-view format according to Kinosita et al., 1991 ). Further selection of the Cy3B and Atto647N emissions was achieved with a 580/40BP (Semrock) and 660LP fi lter (Omega Optical), respectively. All of the experiments were performed with a 100-ms integra-tion time. For some experiments, to achieve a better specifi city in the detection of the two fl uorescent signals, alternating laser excitation was performed using an acousto-optical tunable fi lter and controller (AA Optoelectronics; Margeat et al., 2006 ). The alternation period was defi ned by the integra-tion time of the camera (i.e., typically 100 ms.)
Data analysis All of the videos were analyzed using a homemade software (named Pa-Track) implemented in visual C++. Trajectories were constructed using the individual diffraction limited signal of each molecule. The center of each fl uorescence peak was determined with subpixel resolution by fi tting a two-dimensional elliptical Gaussian function. The accuracy of the position mea-surement in living cells was estimated to be 50 nm by fi tting a 2D Gaussian to the emission intensity distribution of an immobile single molecule conju-gated with Atto647N. The 2D trajectories of single molecules were con-structed frame per frame. Only trajectories containing at least 40 points and including a one-step photobleaching event were retained (mean dura-tion of trajectories is 15 s, ranging from 4 to 55 s). Diffusion coeffi cient val-ues were determined from a linear fi t to the MSD- � plots between the second and the fourth points (D 2 – 4 ) according to the equation MSD(t) = 4Dt ( Kusumi et al., 1993 ). More than 200 trajectories were analyzed for each condition. Instantaneous diffusion coeffi cient as shown in Fig. 2 F was de-rived from MSD curves calculated over contiguous trajectory stretches of 10 frames (1 s).
Determination of the motional modes (Brownian, confi ned, or di-rected) and parameters was performed according to Kusumi et al. (1993) . For each trajectory, we fi rst linearly fi tted the MSD on the 10% fi rst points to use suffi ciently populated curves. If the MSD- � plot shows positive or negative deviation from a straight line with a slope of 4D (Brownian diffu-sion), the MSD is adjusted with a quadratic curve (4 Dt + � 2 t 2 ) (directed dif-fusion) or with an exponential curve,
L Dt
L
²[ exp(
²)]
31
12− −
(confi ned diffusion where L is the side of a square domain, the confi nement diameter being related to L by d conf = (2/ √ � )L). For the mixed trajectory exhibiting a combination of Brownian and apparent confi ned motion mode, the trajectory was split, and the MSD of each segment was adjusted with a linear or an exponential curve.
The software is also implemented to superimpose the two regions of the CCD detector when working in dual-view mode. To achieve the super-imposition of the two split images, a few NeutrAvidin-labeled microspheres (TransFluoSpheres) were imaged before each experiment. Pairs of the dif-ferent peaks were selected and used to calculate a transformation matrix that is applied to our experiment.
Dynamic colocalization To determine real-time colocalization of particles, PC3 cells were doubly la-beled with Cy3B and Atto647N SYB-1 Fab fragments at single-molecule concentrations. Thanks to the dual-view setup and our single-molecule track-ing software, the respective trajectories for two different molecules labeled with spectrally distinct fl uorophores could be determined with a lateral re-solution of � 50 nm. We chose a scheme in which two particles were con-sidered spatially colocalized when at least one pixel of two fl uorescence signals was overlapped during at least seven frames (700 ms). The lateral precision of the superimposition of the particle tracking was � 50 nm.
inside the web, tetraspanin – tetraspanin interactions (and there-
fore secondary interactions) are transient and highly dynamic.
Two modes of interactions have been identifi ed. The fi rst mode
is based on tetraspanin assemblies that can form membrane
platforms stable in shape and localization. The maintenance of
these platforms depends neither on membrane Chl nor on the
underlying cytoskeleton, strengthening the involvement of di-
rect or indirect protein – protein interaction. Some of these plat-
forms appear to be unconnected to the rest of the membrane, but
the majority of these platforms are in permanent exchange with
it. Chl and palmitoylation likely contribute to the initial inter-
action of diffusing tetraspanins with these platforms. A second
mode of interaction is suggested by the codiffusion of two CD9
molecules outside TEAs. We suggest that tetraspanins diffuse in
the plasma membrane embedded in small clusters that could
contain other tetraspanins, some protein partners, and lipids.
These clusters interact with each other and possibly exchange
CD9 molecules. This dynamic colocalization is dependent on
Chl and palmitoylation, although the precise role of these lipids
remains unclear. These results exclude a possible self-organization
of tetraspanins based uniquely on protein – protein interactions.
Collectively, our characterization of the membrane dynamics
and partitioning of the CD9 tetraspanin on the single-molecule
level reveals a dynamic web of membrane protein – protein –
lipid interactions with an organization distinct from that of
raft microdomains.
Materials and methods Materials Cell culture reagents, Amplex red Chl assay kit, and TransFluoSpheres were purchased from Invitrogen. Atto647N succinimidyl ester was obtained from Atto-tec, and Cy3B succinimidyl ester and PD10 columns were pur-chased from GE Healthcare. Glass coverslips were obtained from Dutcher, and fi bronectin, M � CD, M � CD – Chl, LTB, and BSA were purchased from Sigma-Aldrich.
Cell culture Human metastatic prostate PC3 cell lines were grown in DME-F12 medium supplemented with antibiotics and 10% FCS. Cells were plated on 25-mm Ø glass coverslips (precoated with 10 μ g/ml fi bronectin) 24 – 48 h before the experiment and used at � 60% confl uence. Before coating, coverslips were successively washed with acetone, methanol, and water, sonicated for 30 min in 1 M KOH, and extensively rinsed with water.
Antibody labeling The mAbs SYB-1 (CD9), TS81 (CD81), 1F11 (CD9P1), 12A12 (CD55), 11C5 (CD46), and v5-vjf (integrin � 5) were previously described ( Lozahic et al., 2000 ; Charrin et al., 2003a ). Fab fragments were produced using papain digestion according to the protocol provided by Thermo Fisher Sci-entifi c. Antibodies or Fab fragments were labeled with Cy3B or Atto647N. In brief, covalent amine labeling of antibodies was performed by adding the fl uorophore (succinimidyl ester) to antibody solution in a 3:2 molar ratio in PBS buffer, pH 7.4. The labeling reaction was performed for 2 h at room temperature, and the nonreacted dye was removed with a PD10 column. The dye/protein ratio after labeling was always inferior to 1.
Treatment of cells with drugs For Chl depletion, cells were incubated in the DME-F12 medium containing 20 mM M � CD and 2% BSA at 37 ° C for 30 min. Treatment with M � CD re-moved � 50% of the Chl content of PC3 cells, as determined using the Am-plex red Chl kit. Increase in membrane Chl was achieved by incubating the cells with 1 mM of a 1:10 complex of Chl and M � CD in serum-free medium at 37 ° C for 15 min. Treatment with M � CD – Chl led to � 30% Chl increase in the PC3 membrane.
775SINGLE-MOLECULE ANALYSIS OF THE TETRASPANIN WEB • Espenel et al.
Dietrich , C. , B. Yang , T. Fujiwara , A. Kusumi , and K. Jacobson . 2002 . Relationship of lipid rafts to transient confi nement zones detected by single particle tracking. Biophys. J. 82 : 274 – 284 .
Douglass , A.D. , and R.D. Vale . 2005 . Single-molecule microscopy reveals plasma membrane microdomains created by protein-protein networks that exclude or trap signaling molecules in T cells. Cell . 121 : 937 – 950 .
Gambin , Y. , R. Lopez-Esparza , M. Reffay , E. Sierecki , N.S. Gov , M. Genest , R.S. Hodges , and W. Urbach . 2006 . Lateral mobility of proteins in liquid membranes revisited. Proc. Natl. Acad. Sci. USA . 103 : 2098 – 2102 .
Gordon-Alonso , M. , M. Yanez-Mo , O. Barreiro , S. Alvarez , M.A. Munoz-Fernandez , A. Valenzuela-Fernandez , and F. Sanchez-Madrid . 2006 . Tetraspanins CD9 and CD81 modulate HIV-1-induced membrane fusion. J. Immunol. 177 : 5129 – 5137 .
Guigas , G. , and M. Weiss . 2006 . Size-dependent diffusion of membrane inclu-sions. Biophys. J. 91 : 2393 – 2398 .
Hemler , M.E. 2003 . Tetraspanin proteins mediate cellular penetration, invasion, and fusion events and defi ne a novel type of membrane microdomain. Annu. Rev. Cell Dev. Biol. 19 : 397 – 422 .
Jacobson , K. , O.G. Mouritsen , and R.G. Anderson . 2007 . Lipid rafts: at a cross-road between cell biology and physics. Nat. Cell Biol. 9 : 7 – 14 .
Kinosita , K. Jr ., H. Itoh , S. Ishiwata , K. Hirano , T. Nishizaka , and T. Hayakawa . 1991 . Dual-view microscopy with a single camera: real-time imaging of molecular orientations and calcium. J. Cell Biol. 115 : 67 – 73 .
Kovalenko , O.V. , X. Yang , T.V. Kolesnikova , and M.E. Hemler . 2004 . Evidence for specifi c tetraspanin homodimers: inhibition of palmitoylation makes cysteine residues available for cross-linking. Biochem. J. 377 : 407 – 417 .
Kusumi , A. , and K. Suzuki . 2005 . Toward understanding the dynamics of membrane-raft-based molecular interactions. Biochim. Biophys. Acta . 1746 : 234 – 251 .
Kusumi , A. , Y. Sako , and M. Yamamoto . 1993 . Confi ned lateral diffusion of membrane receptors as studied by single particle tracking (nanovid microscopy). Effects of calcium-induced differentiation in cultured epi-thelial cells. Biophys. J. 65 : 2021 – 2040 .
Kwik , J. , S. Boyle , D. Fooksman , L. Margolis , M.P. Sheetz , and M. Edidin . 2003 . Membrane cholesterol, lateral mobility, and the phosphatidylinositol 4,5-bisphosphate-dependent organization of cell actin. Proc. Natl. Acad. Sci. USA . 100 : 13964 – 13969 .
Lenne , P.F. , L. Wawrezinieck , F. Conchonaud , O. Wurtz , A. Boned , X.J. Guo , H. Rigneault , H.T. He , and D. Marguet . 2006 . Dynamic molecular con-fi nement in the plasma membrane by microdomains and the cytoskeleton meshwork. EMBO J. 25 : 3245 – 3256 .
Levy , S. , and T. Shoham . 2005 . Protein-protein interactions in the tetraspanin web. Physiology (Bethesda) . 20 : 218 – 224 .
Lommerse , P.H. , H.P. Spaink , and T. Schmidt . 2004 . In vivo plasma membrane organization: results of biophysical approaches. Biochim. Biophys. Acta . 1664 : 119 – 131 .
London , E. 2005 . How principles of domain formation in model membranes may explain ambiguities concerning lipid raft formation in cells. Biochim. Biophys. Acta . 1746 : 203 – 220 .
Lozahic , S. , D. Christiansen , S. Manie , D. Gerlier , M. Billard , C. Boucheix , and E. Rubinstein . 2000 . CD46 (membrane cofactor protein) associates with multiple beta1 integrins and tetraspans. Eur. J. Immunol. 30 : 900 – 907 .
Manie , S.N. , S. Debreyne , S. Vincent , and D. Gerlier . 2000 . Measles virus struc-tural components are enriched into lipid raft microdomains: a potential cellular location for virus assembly. J. Virol. 74 : 305 – 311 .
Margeat , E. , A.N. Kapanidis , P. Tinnefeld , Y. Wang , J. Mukhopadhyay , R.H. Ebright , and S. Weiss . 2006 . Direct observation of abortive initiation and promoter escape within single immobilized transcription complexes. Biophys. J. 90 : 1419 – 1431 .
Mayor , S. , and M. Rao . 2004 . Rafts: scale-dependent, active lipid organization at the cell surface. Traffi c . 5 : 231 – 240 .
Melkonian , K.A. , A.G. Ostermeyer , J.Z. Chen , M.G. Roth , and D.A. Brown . 1999 . Role of lipid modifi cations in targeting proteins to detergent-resistant membrane rafts - many raft proteins are acylated, while few are prenylated. J. Biol. Chem. 274 : 3910 – 3917 .
Nishimura , S.Y. , S.J. Lord , L.O. Klein , K.A. Willets , M. He , Z. Lu , R.J. Twieg , and W.E. Moerner . 2006 . Diffusion of lipid-like single-molecule fl uoro-phores in the cell membrane. J. Phys. Chem. B. 110 : 8151 – 8157 .
Nydegger , S. , S. Khurana , D.N. Krementsov , M. Foti , and M. Thali . 2006 . Mapping of tetraspanin-enriched microdomains that can function as gate-ways for HIV-1. J. Cell Biol. 173 : 795 – 807 .
Odintsova , E. , T.D. Butters , E. Monti , H. Sprong , G. van Meer , and F. Berditchevski . 2006 . Gangliosides play an important role in the organiza-tion of CD82-enriched microdomains. Biochem. J. 400 : 315 – 325 .
Orr , G. , D. Hu , S. Ozcelik , L.K. Opresko , H.S. Wiley , and S.D. Colson . 2005 . Cholesterol dictates the freedom of EGF receptors and HER2 in the plane of the membrane. Biophys. J. 89 : 1362 – 1373 .
Because we cannot exactly control the proportion of labeled parti-cles at the surface of our cells, our results are expressed as a percentage of superimposed particles as compared with the number of possible pairs ac-cording to the equation % = [ O /( i × j )] × 100, where O is the total number of superimposed red and green particles at the cell surface, i is the number of green-labeled particles, and j is the number of red-labeled particles.
Brownian dynamic simulation The lateral diffusion of particles was described by Brownian diffusion simu-lation. At t = 0, particles were placed either randomly with nonoverlapping positions (their number was based on experiments) or using coordinates of CD9 molecules in one frame of videos acquired using a 100-ms time scale. The particle was represented by a 2D Gaussian. Its diffusion between t and t + 1 was defi ned as a 2D Gaussian with an SD of √ 2 Dt with D = 0.1 or 0.2 μ m 2 /s and t = 100 ms. Two particles were considered spatially co-localized as mentioned in the previous section.
Online supplemental material Fig. S1 shows ADC distribution and partitioning of CD9 obtained with the intact mAb SYB-1 or with Fab fragments. Fig. S2 shows M � CD and LTB treat-ment of PC3 cells. Video 1 shows dynamic behavior of CD9 in the context of the tetraspanin-enriched compartment. Video 2 shows that M � CD treatment of PC3 cells decreased membrane dynamics, and Video 3 shows real-time dynamic colocalization of CD9. Online supplemental material is available at http://www.jcb.org/cgi/content/full/jcb.200803010/DC1.
C. Espenel and C. Arduise are recipients of grants from the French Ministry for Research and Technology and from the Association pour la Recherche sur le Cancer. This study was supported by grants from the French Ministry for Re-search (Action Concert é e Incitative [ACI] Biologie Cellulaire, Mol é culaire, et Structurale and ACI Dynamique et R é activit é des Assemblages Biologiques), the Association Nationale pour la Recherche Blanc, Institut de Canc é rologie et Immunog é n é tique, l ’ Association pour la Recherche sur le Cancer, and Nou-velles Recherches Biom é dicales Vaincre Le Cancer.
Submitted: 3 March 2008 Accepted: 24 July 2008
References Berditchevski , F. , E. Odintsova , S. Sawada , and E. Gilbert . 2002 . Expression of
the palmitoylation-defi cient CD151 weakens the association of alpha 3 beta 1 integrin with the tetraspanin-enriched microdomains and affects integrin-dependent signaling. J. Biol. Chem. 277 : 36991 – 37000 .
Boucheix , C. , and E. Rubinstein . 2001 . Tetraspanins. Cell. Mol. Life Sci. 58 : 1189 – 1205 .
Charrin , S. , F. Le Naour , M. Oualid , M. Billard , G. Faure , S.M. Hanash , C. Boucheix , and E. Rubinstein . 2001 . The major CD9 and CD81 molecu-lar partner. Identifi cation and characterization of the complexes. J. Biol. Chem. 276 : 14329 – 14337 .
Charrin , S. , S. Manie , M. Oualid , M. Billard , C. Boucheix , and E. Rubinstein . 2002 . Differential stability of tetraspanin/tetraspanin interactions: role of palmitoylation. FEBS Lett. 516 : 139 – 144 .
Charrin , S. , F. Le Naour , V. Labas , M. Billard , J.P. Le Caer , J.F. Emile , M.A. Petit , C. Boucheix , and E. Rubinstein . 2003a . EWI-2 is a new component of the tetraspanin web in hepatocytes and lymphoid cells. Biochem. J. 373 : 409 – 421 .
Charrin , S. , S. Manie , M. Billard , L. Ashman , D. Gerlier , C. Boucheix , and E. Rubinstein . 2003b . Multiple levels of interactions within the tetraspanin web. Biochem. Biophys. Res. Commun. 304 : 107 – 112 .
Charrin , S. , S. Manie , C. Thiele , M. Billard , D. Gerlier , C. Boucheix , and E. Rubinstein . 2003c . A physical and functional link between cholesterol and tetraspanins. Eur. J. Immunol. 33 : 2479 – 2489 .
Chen , Y. , W.R. Thelin , B. Yang , S.L. Milgram , and K. Jacobson . 2006 . Transient anchorage of cross-linked glycosyl-phosphatidylinositol-anchored pro-teins depends on cholesterol, Src family kinases, caveolin, and phospho-inositides. J. Cell Biol. 175 : 169 – 178 .
Cocquerel , L. , C. Voisset , and J. Dubuisson . 2006 . Hepatitis C virus entry: potential receptors and their biological functions. J. Gen. Virol. 87 : 1075 – 1084 .
Delaguillaumie , A. , J. Harriague , S. Kohanna , G. Bismuth , E. Rubinstein , M. Seigneuret , and H. Conjeaud . 2004 . Tetraspanin CD82 controls the associa-tion of cholesterol-dependent microdomains with the actin cytoskeleton in T lymphocytes: relevance to co-stimulation. J. Cell Sci. 117 : 5269 – 5282 .
Destainville , N. 2008 . Cluster phases of membrane proteins. Phys. Rev. E Stat. Nonlin. Soft Matter Phys. 77 : 011905 .
JCB • VOLUME 182 • NUMBER 4 • 2008 776
Rubinstein , E. , F. Le Naour , C. Lagaudriere-Gesbert , M. Billard , H. Conjeaud , and C. Boucheix . 1996 . CD9, CD63, CD81, and CD82 are components of a surface tetraspan network connected to HLA-DR and VLA integrins. Eur. J. Immunol. 26 : 2657 – 2665 .
Rubinstein , E. , A. Ziyyat , M. Prenant , E. Wrobel , J.P. Wolf , S. Levy , F. Le Naour , and C. Boucheix . 2006 . Reduced fertility of female mice lacking CD81. Dev. Biol. 290 : 351 – 358 .
Sako , Y. 2006 . Imaging single molecules in living cells for systems biology. Mol. Syst. Biol . 2 : 56 .
Sako , Y. , S. Minoghchi , and T. Yanagida . 2000 . Single-molecule imaging of EGFR signalling on the surface of living cells. Nat. Cell Biol. 2 : 168 – 172 .
Schutz , G.J. , G. Kada , V.P. Pastushenko , and H. Schindler . 2000 . Properties of lipid microdomains in a muscle cell membrane visualized by single mol-ecule microscopy. EMBO J. 19 : 892 – 901 .
Serru , V. , F. Le Naour , M. Billard , D.O. Azorsa , F. Lanza , C. Boucheix , and E. Rubinstein . 1999 . Selective tetraspan-integrin complexes (CD81/alpha-4beta1, CD151/alpha3beta1, CD151/alpha6beta1) under conditions dis-rupting tetraspan interactions. Biochem. J. 340 : 103 – 111 .
Sieber , J.J. , K.I. Willig , C. Kutzner , C. Gerding-Reimers , B. Harke , G. Donnert , B. Rammner , C. Eggeling , S.W. Hell , H. Grubmuller , and T. Lang . 2007 . Anatomy and dynamics of a supramolecular membrane protein cluster. Science . 317 : 1072 – 1076 .
Silvie , O. , E. Rubinstein , J.F. Franetich , M. Prenant , E. Belnoue , L. Renia , L. Hannoun , W. Eling , S. Levy , C. Boucheix , and D. Mazier . 2003 . Hepatocyte CD81 is required for Plasmodium falciparum and Plasmodium yoelii sporozoite infectivity. Nat. Med. 9 : 93 – 96 .
Silvie , O. , S. Charrin , M. Billard , J.F. Franetich , K.L. Clark , G.J. van Gemert , R.W. Sauerwein , F. Dautry , C. Boucheix , D. Mazier , and E. Rubinstein . 2006 . Cholesterol contributes to the organization of tetraspanin-enriched microdomains and to CD81-dependent infection by malaria sporozoites. J. Cell Sci. 119 : 1992 – 2002 .
Simons , K. , and G. van Meer . 1988 . Lipid sorting in epithelial cells. Biochemistry . 27 : 6197 – 6202 .
Stipp , C.S. , T.V. Kolesnikova , and M.E. Hemler . 2001 . EWI-2 is a major CD9 and CD81 partner and member of a novel Ig protein subfamily. J. Biol. Chem. 276 : 40545 – 40554 .
Suzuki , K. , K. Ritchie , E. Kajikawa , T. Fujiwara , and A. Kusumi . 2005 . Rapid hop diffusion of a G-protein-coupled receptor in the plasma membrane as revealed by single-molecule techniques. Biophys. J. 88 : 3659 – 3680 .
Suzuki , K.G. , T.K. Fujiwara , F. Sanematsu , R. Iino , M. Edidin , and A. Kusumi . 2007 . GPI-anchored receptor clusters transiently recruit Lyn and G � for temporary cluster immobilization and Lyn activation: single-molecule tracking study 1. J. Cell Biol. 177 : 717 – 730 .
Wang , J.C. , L.R. Begin , N.G. Berube , S. Chevalier , A.G. Aprikian , H. Gourdeau , and M. Chevrette . 2007 . Down-regulation of CD9 expression during prostate carcinoma progression is associated with CD9 mRNA modifi ca-tions. Clin. Cancer Res. 13 : 2354 – 2361 .
Wieser , S. , M. Moertelmaier , E. Fuertbauer , H. Stockinger , and G.J. Schutz . 2007 . (Un)confi ned diffusion of CD59 in the plasma membrane determined by high-resolution single molecule microscopy. Biophys. J. 92 : 3719 – 3728 .
Yancey , P.G. , W.V. Rodrigueza , E.P. Kilsdonk , G.W. Stoudt , W.J. Johnson , M.C. Phillips , and G.H. Rothblat . 1996 . Cellular cholesterol effl ux mediated by cyclodextrins. Demonstration of kinetic pools and mechanism of effl ux. J. Biol. Chem. 271 : 16026 – 16034 .
Yang , X. , C. Claas , S.K. Kraeft , L.B. Chen , Z. Wang , J.A. Kreidberg , and M.E. Hemler . 2002 . Palmitoylation of tetraspanin proteins: modulation of CD151 lateral interactions, subcellular distribution, and integrin-dependent cell morphology. Mol. Biol. Cell . 13 : 767 – 781 .
Related Documents