1 Vol.:(0123456789) Scientific Reports | (2021) 11:14714 | https://doi.org/10.1038/s41598-021-94163-y www.nature.com/scientificreports Single‑cell transcriptomic profile of human pulmonary artery endothelial cells in health and pulmonary arterial hypertension Kewal Asosingh 1,3* , Suzy Comhair 1 , Lori Mavrakis 1 , Weiling Xu 1 , Dean Horton 4 , Ian Taylor 5 , Svyatoslav Tkachenko 2 , Bo Hu 2 & Serpil Erzurum 1,4* Pulmonary arterial hypertension (PAH) is an insidious disease characterized by severe remodeling of the pulmonary vasculature caused in part by pathologic changes of endothelial cell functions. Although heterogeneity of endothelial cells across various vascular beds is well known, the diversity among endothelial cells in the healthy pulmonary vascular bed and the pathologic diversity among pulmonary arterial endothelial cells (PAEC) in PAH is unknown and previously unexplored. Here single‑cell RNA sequencing technology was used to decipher the cellular heterogeneity among PAEC in the human pulmonary arteries isolated from explanted lungs from three patients with PAH undergoing lung transplantation and three healthy donor lungs not utilized for transplantation. Datasets of 36,368 PAH individual endothelial cells and 36,086 healthy cells were analyzed using the SeqGeq bioinformatics program. Total population differential gene expression analyses identified 629 differentially expressed genes between PAH and controls. Gene Ontology and Canonical Ingenuity analysis revealed pathways that are known to be involved in pathogenesis, as well as unique new pathways. At the individual cell level, dimensionality reduction followed by density based clustering revealed the presence of eight unique PAEC clusters that were typified by proliferative, angiogenic or quiescent phenotypes. While control and PAH harbored many similar subgroups of endothelial cells, PAH had greater proportions of angiogenic and proliferative subsets. These findings identify that only specific subgroups of PAH PAEC have gene expression different than healthy PAEC, and suggest these subpopulations lead to the pathologic functions leading to remodeling. Pulmonary artery hypertension (PAH) is a deadly cardiopulmonary disease characterized by profound structural changes to the pulmonary artery wall 1 . Pulmonary artery endothelial cells (PAEC) are causally linked the vascular remodeling in PAH 2–6 . For example, apoptosis-resistant proliferation and dysregulated metabolism in PAEC are key features of PAH 4–7 . Although endothelium exhibits a marked heterogeneity in structure and function 8–10 , little is known about the single-cell transcriptomic heterogeneity of the pulmonary vasculature. e pulmonary vasculature is distinct from other vascular beds; it is a low pressure vascular bed and accommodates the com- plete venous return from the systemic vascular bed. Because endothelial remodeling in PAH is patchy 11 , PAEC isolated from explanted lung contain a mixture of cells from healthy and affected areas. Analysis of these cells in bulk cultures may mask phenotypically altered PAEC subsets. Here, we hypothesized that the transcriptomic diversity of PAEC isolated from healthy and PAH lungs would differ and that PAH would have specific expan- sion of pathological phenotypes of cells. To test this, we evaluated PAH and control PAEC by methodologies to identify cell clusters and their phenotypes. Eight distinct clusters of endothelial cells were identified from healthy OPEN 1 Departments of Inflammation and Immunity, Lerner Research Institute and Respiratory Institute, Cleveland Clinic, 9500 Euclid Ave, NB20, Cleveland, OH 44195, USA. 2 Departments of Quantitative Health Sciences, Lerner Research Institute and Respiratory Institute, Cleveland Clinic, Cleveland, OH, USA. 3 Departments of Flow Cytometry Core, Lerner Research Institute and Respiratory Institute, Cleveland Clinic, Cleveland, OH, USA. 4 Departments of Genomics Core, Lerner Research Institute and Respiratory Institute, Cleveland Clinic, Cleveland, OH, USA. 5 BD Life Sciences: Informatics, Ashland, OR, USA. * email: [email protected]; [email protected]

Welcome message from author
This document is posted to help you gain knowledge. Please leave a comment to let me know what you think about it! Share it to your friends and learn new things together.
Transcript
1
Vol.:(0123456789)
Scientific Reports | (2021) 11:14714 | https://doi.org/10.1038/s41598-021-94163-y
www.nature.com/scientificreports
Single‑cell transcriptomic profile of human pulmonary artery endothelial cells in health and pulmonary arterial hypertensionKewal Asosingh1,3*, Suzy Comhair1, Lori Mavrakis1, Weiling Xu1, Dean Horton4, Ian Taylor5, Svyatoslav Tkachenko2, Bo Hu2 & Serpil Erzurum1,4*
Pulmonary arterial hypertension (PAH) is an insidious disease characterized by severe remodeling of the pulmonary vasculature caused in part by pathologic changes of endothelial cell functions. Although heterogeneity of endothelial cells across various vascular beds is well known, the diversity among endothelial cells in the healthy pulmonary vascular bed and the pathologic diversity among pulmonary arterial endothelial cells (PAEC) in PAH is unknown and previously unexplored. Here single‑cell RNA sequencing technology was used to decipher the cellular heterogeneity among PAEC in the human pulmonary arteries isolated from explanted lungs from three patients with PAH undergoing lung transplantation and three healthy donor lungs not utilized for transplantation. Datasets of 36,368 PAH individual endothelial cells and 36,086 healthy cells were analyzed using the SeqGeq bioinformatics program. Total population differential gene expression analyses identified 629 differentially expressed genes between PAH and controls. Gene Ontology and Canonical Ingenuity analysis revealed pathways that are known to be involved in pathogenesis, as well as unique new pathways. At the individual cell level, dimensionality reduction followed by density based clustering revealed the presence of eight unique PAEC clusters that were typified by proliferative, angiogenic or quiescent phenotypes. While control and PAH harbored many similar subgroups of endothelial cells, PAH had greater proportions of angiogenic and proliferative subsets. These findings identify that only specific subgroups of PAH PAEC have gene expression different than healthy PAEC, and suggest these subpopulations lead to the pathologic functions leading to remodeling.
Pulmonary artery hypertension (PAH) is a deadly cardiopulmonary disease characterized by profound structural changes to the pulmonary artery wall1. Pulmonary artery endothelial cells (PAEC) are causally linked the vascular remodeling in PAH2–6. For example, apoptosis-resistant proliferation and dysregulated metabolism in PAEC are key features of PAH4–7. Although endothelium exhibits a marked heterogeneity in structure and function8–10, little is known about the single-cell transcriptomic heterogeneity of the pulmonary vasculature. The pulmonary vasculature is distinct from other vascular beds; it is a low pressure vascular bed and accommodates the com-plete venous return from the systemic vascular bed. Because endothelial remodeling in PAH is patchy11, PAEC isolated from explanted lung contain a mixture of cells from healthy and affected areas. Analysis of these cells in bulk cultures may mask phenotypically altered PAEC subsets. Here, we hypothesized that the transcriptomic diversity of PAEC isolated from healthy and PAH lungs would differ and that PAH would have specific expan-sion of pathological phenotypes of cells. To test this, we evaluated PAH and control PAEC by methodologies to identify cell clusters and their phenotypes. Eight distinct clusters of endothelial cells were identified from healthy
OPEN
1Departments of Inflammation and Immunity, Lerner Research Institute and Respiratory Institute, Cleveland Clinic, 9500 Euclid Ave, NB20, Cleveland, OH 44195, USA. 2Departments of Quantitative Health Sciences, Lerner Research Institute and Respiratory Institute, Cleveland Clinic, Cleveland, OH, USA. 3Departments of Flow Cytometry Core, Lerner Research Institute and Respiratory Institute, Cleveland Clinic, Cleveland, OH, USA. 4Departments of Genomics Core, Lerner Research Institute and Respiratory Institute, Cleveland Clinic, Cleveland, OH, USA. 5BD Life Sciences: Informatics, Ashland, OR, USA. *email: [email protected]; [email protected]
2
Vol:.(1234567890)
Scientific Reports | (2021) 11:14714 | https://doi.org/10.1038/s41598-021-94163-y
www.nature.com/scientificreports/
and PAH lungs. Transcriptomic profiles identified expansion of clusters with proliferative and angiogenic gene signatures in PAH.
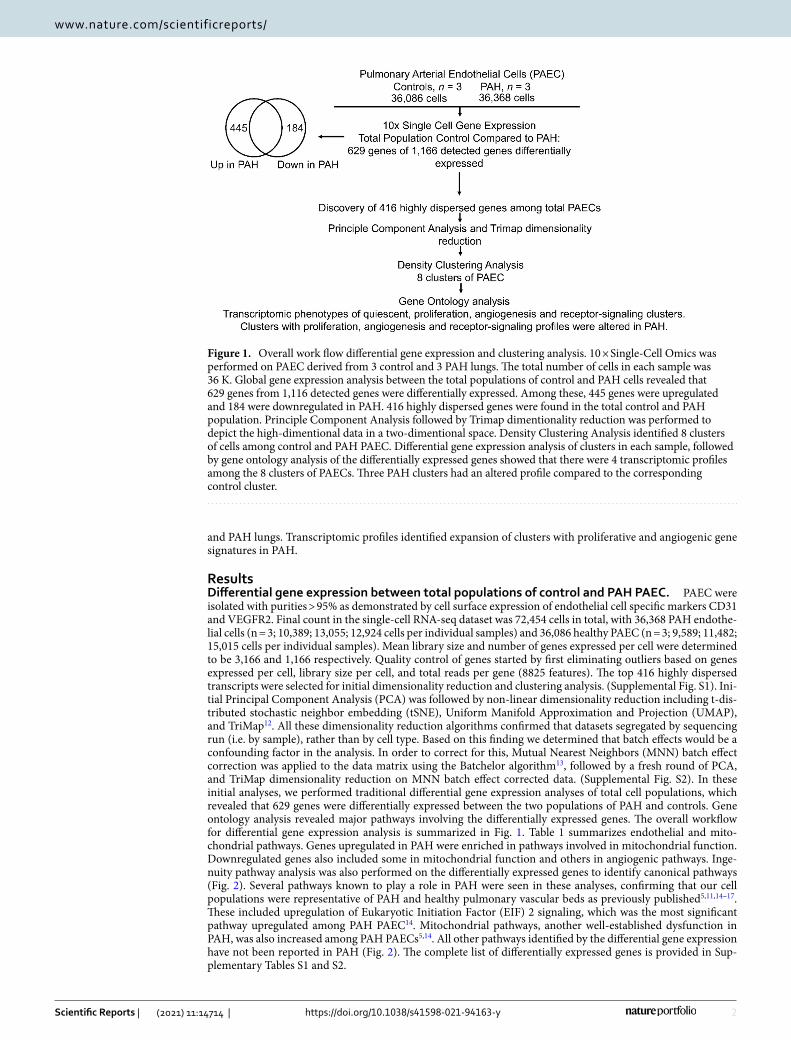
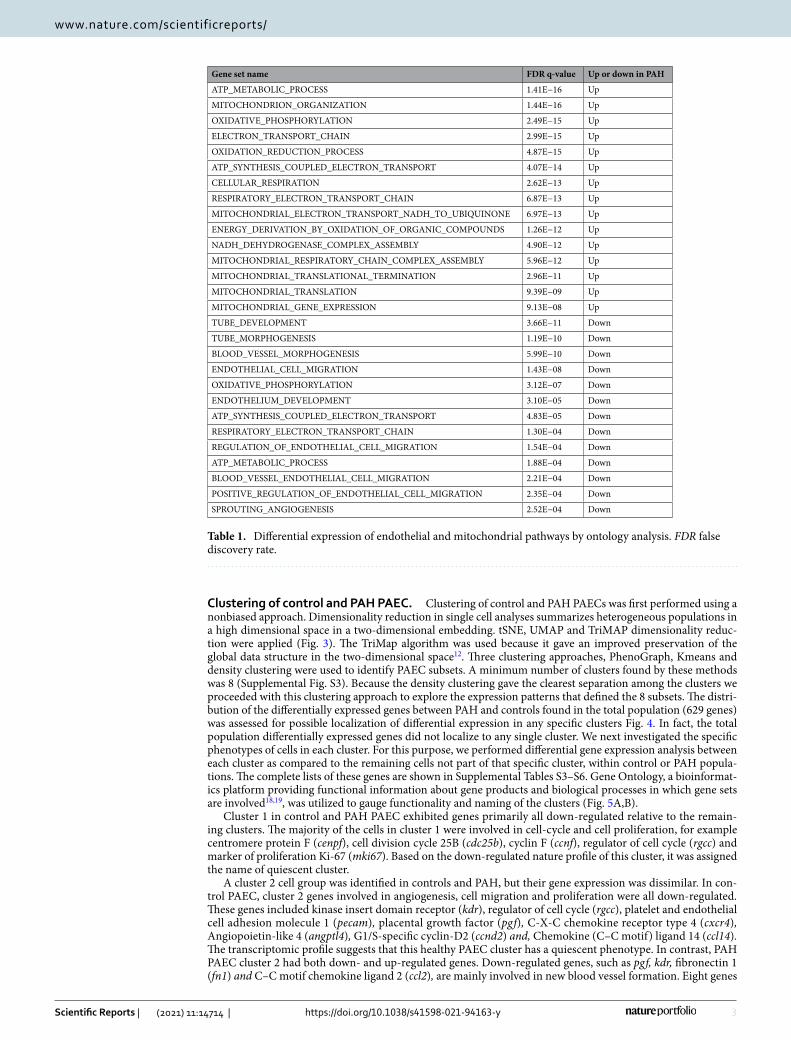
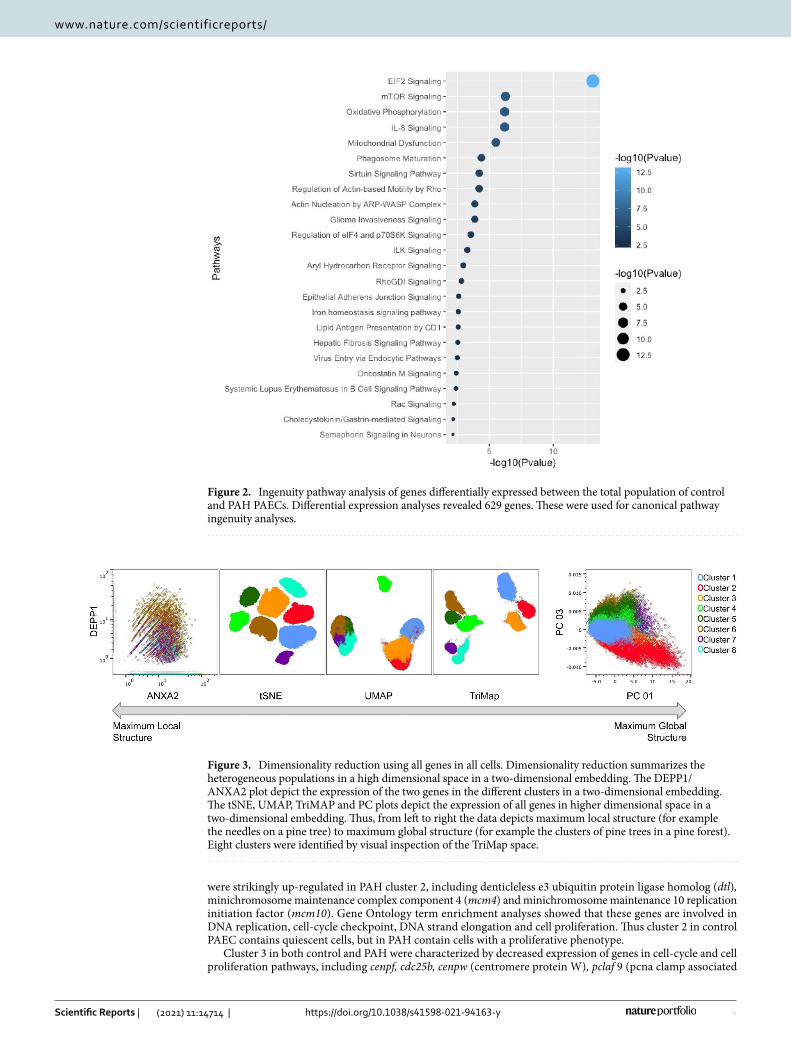
ResultsDifferential gene expression between total populations of control and PAH PAEC. PAEC were isolated with purities > 95% as demonstrated by cell surface expression of endothelial cell specific markers CD31 and VEGFR2. Final count in the single-cell RNA-seq dataset was 72,454 cells in total, with 36,368 PAH endothe-lial cells (n = 3; 10,389; 13,055; 12,924 cells per individual samples) and 36,086 healthy PAEC (n = 3; 9,589; 11,482; 15,015 cells per individual samples). Mean library size and number of genes expressed per cell were determined to be 3,166 and 1,166 respectively. Quality control of genes started by first eliminating outliers based on genes expressed per cell, library size per cell, and total reads per gene (8825 features). The top 416 highly dispersed transcripts were selected for initial dimensionality reduction and clustering analysis. (Supplemental Fig. S1). Ini-tial Principal Component Analysis (PCA) was followed by non-linear dimensionality reduction including t-dis-tributed stochastic neighbor embedding (tSNE), Uniform Manifold Approximation and Projection (UMAP), and TriMap12. All these dimensionality reduction algorithms confirmed that datasets segregated by sequencing run (i.e. by sample), rather than by cell type. Based on this finding we determined that batch effects would be a confounding factor in the analysis. In order to correct for this, Mutual Nearest Neighbors (MNN) batch effect correction was applied to the data matrix using the Batchelor algorithm13, followed by a fresh round of PCA, and TriMap dimensionality reduction on MNN batch effect corrected data. (Supplemental Fig. S2). In these initial analyses, we performed traditional differential gene expression analyses of total cell populations, which revealed that 629 genes were differentially expressed between the two populations of PAH and controls. Gene ontology analysis revealed major pathways involving the differentially expressed genes. The overall workflow for differential gene expression analysis is summarized in Fig. 1. Table 1 summarizes endothelial and mito-chondrial pathways. Genes upregulated in PAH were enriched in pathways involved in mitochondrial function. Downregulated genes also included some in mitochondrial function and others in angiogenic pathways. Inge-nuity pathway analysis was also performed on the differentially expressed genes to identify canonical pathways (Fig. 2). Several pathways known to play a role in PAH were seen in these analyses, confirming that our cell populations were representative of PAH and healthy pulmonary vascular beds as previously published5,11,14–17. These included upregulation of Eukaryotic Initiation Factor (EIF) 2 signaling, which was the most significant pathway upregulated among PAH PAEC14. Mitochondrial pathways, another well-established dysfunction in PAH, was also increased among PAH PAECs5,14. All other pathways identified by the differential gene expression have not been reported in PAH (Fig. 2). The complete list of differentially expressed genes is provided in Sup-plementary Tables S1 and S2.
Figure 1. Overall work flow differential gene expression and clustering analysis. 10 × Single-Cell Omics was performed on PAEC derived from 3 control and 3 PAH lungs. The total number of cells in each sample was 36 K. Global gene expression analysis between the total populations of control and PAH cells revealed that 629 genes from 1,116 detected genes were differentially expressed. Among these, 445 genes were upregulated and 184 were downregulated in PAH. 416 highly dispersed genes were found in the total control and PAH population. Principle Component Analysis followed by Trimap dimentionality reduction was performed to depict the high-dimentional data in a two-dimentional space. Density Clustering Analysis identified 8 clusters of cells among control and PAH PAEC. Differential gene expression analysis of clusters in each sample, followed by gene ontology analysis of the differentially expressed genes showed that there were 4 transcriptomic profiles among the 8 clusters of PAECs. Three PAH clusters had an altered profile compared to the corresponding control cluster.
3
Vol.:(0123456789)
Scientific Reports | (2021) 11:14714 | https://doi.org/10.1038/s41598-021-94163-y
www.nature.com/scientificreports/
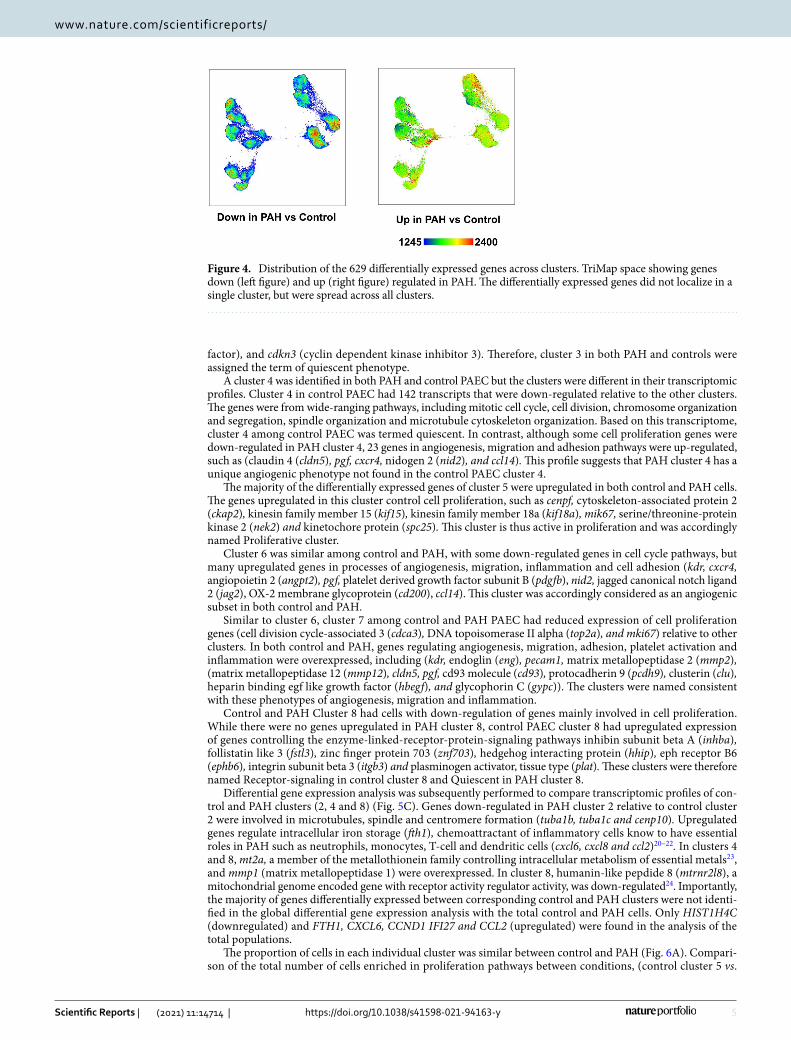
Clustering of control and PAH PAEC. Clustering of control and PAH PAECs was first performed using a nonbiased approach. Dimensionality reduction in single cell analyses summarizes heterogeneous populations in a high dimensional space in a two-dimensional embedding. tSNE, UMAP and TriMAP dimensionality reduc-tion were applied (Fig. 3). The TriMap algorithm was used because it gave an improved preservation of the global data structure in the two-dimensional space12. Three clustering approaches, PhenoGraph, Kmeans and density clustering were used to identify PAEC subsets. A minimum number of clusters found by these methods was 8 (Supplemental Fig. S3). Because the density clustering gave the clearest separation among the clusters we proceeded with this clustering approach to explore the expression patterns that defined the 8 subsets. The distri-bution of the differentially expressed genes between PAH and controls found in the total population (629 genes) was assessed for possible localization of differential expression in any specific clusters Fig. 4. In fact, the total population differentially expressed genes did not localize to any single cluster. We next investigated the specific phenotypes of cells in each cluster. For this purpose, we performed differential gene expression analysis between each cluster as compared to the remaining cells not part of that specific cluster, within control or PAH popula-tions. The complete lists of these genes are shown in Supplemental Tables S3–S6. Gene Ontology, a bioinformat-ics platform providing functional information about gene products and biological processes in which gene sets are involved18,19, was utilized to gauge functionality and naming of the clusters (Fig. 5A,B).
Cluster 1 in control and PAH PAEC exhibited genes primarily all down-regulated relative to the remain-ing clusters. The majority of the cells in cluster 1 were involved in cell-cycle and cell proliferation, for example centromere protein F (cenpf), cell division cycle 25B (cdc25b), cyclin F (ccnf), regulator of cell cycle (rgcc) and marker of proliferation Ki-67 (mki67). Based on the down-regulated nature profile of this cluster, it was assigned the name of quiescent cluster.
A cluster 2 cell group was identified in controls and PAH, but their gene expression was dissimilar. In con-trol PAEC, cluster 2 genes involved in angiogenesis, cell migration and proliferation were all down-regulated. These genes included kinase insert domain receptor (kdr), regulator of cell cycle (rgcc), platelet and endothelial cell adhesion molecule 1 (pecam), placental growth factor (pgf), C-X-C chemokine receptor type 4 (cxcr4), Angiopoietin-like 4 (angptl4), G1/S-specific cyclin-D2 (ccnd2) and, Chemokine (C–C motif) ligand 14 (ccl14). The transcriptomic profile suggests that this healthy PAEC cluster has a quiescent phenotype. In contrast, PAH PAEC cluster 2 had both down- and up-regulated genes. Down-regulated genes, such as pgf, kdr, fibronectin 1 (fn1) and C–C motif chemokine ligand 2 (ccl2), are mainly involved in new blood vessel formation. Eight genes
Table 1. Differential expression of endothelial and mitochondrial pathways by ontology analysis. FDR false discovery rate.
Gene set name FDR q-value Up or down in PAH
ATP_METABOLIC_PROCESS 1.41E−16 Up
MITOCHONDRION_ORGANIZATION 1.44E−16 Up
OXIDATIVE_PHOSPHORYLATION 2.49E−15 Up
ELECTRON_TRANSPORT_CHAIN 2.99E−15 Up
OXIDATION_REDUCTION_PROCESS 4.87E−15 Up
ATP_SYNTHESIS_COUPLED_ELECTRON_TRANSPORT 4.07E−14 Up
CELLULAR_RESPIRATION 2.62E−13 Up
RESPIRATORY_ELECTRON_TRANSPORT_CHAIN 6.87E−13 Up
MITOCHONDRIAL_ELECTRON_TRANSPORT_NADH_TO_UBIQUINONE 6.97E−13 Up
ENERGY_DERIVATION_BY_OXIDATION_OF_ORGANIC_COMPOUNDS 1.26E−12 Up
NADH_DEHYDROGENASE_COMPLEX_ASSEMBLY 4.90E−12 Up
MITOCHONDRIAL_RESPIRATORY_CHAIN_COMPLEX_ASSEMBLY 5.96E−12 Up
MITOCHONDRIAL_TRANSLATIONAL_TERMINATION 2.96E−11 Up
MITOCHONDRIAL_TRANSLATION 9.39E−09 Up
MITOCHONDRIAL_GENE_EXPRESSION 9.13E−08 Up
TUBE_DEVELOPMENT 3.66E−11 Down
TUBE_MORPHOGENESIS 1.19E−10 Down
BLOOD_VESSEL_MORPHOGENESIS 5.99E−10 Down
ENDOTHELIAL_CELL_MIGRATION 1.43E−08 Down
OXIDATIVE_PHOSPHORYLATION 3.12E−07 Down
ENDOTHELIUM_DEVELOPMENT 3.10E−05 Down
ATP_SYNTHESIS_COUPLED_ELECTRON_TRANSPORT 4.83E−05 Down
RESPIRATORY_ELECTRON_TRANSPORT_CHAIN 1.30E−04 Down
REGULATION_OF_ENDOTHELIAL_CELL_MIGRATION 1.54E−04 Down
ATP_METABOLIC_PROCESS 1.88E−04 Down
BLOOD_VESSEL_ENDOTHELIAL_CELL_MIGRATION 2.21E−04 Down
POSITIVE_REGULATION_OF_ENDOTHELIAL_CELL_MIGRATION 2.35E−04 Down
SPROUTING_ANGIOGENESIS 2.52E−04 Down
4
Vol:.(1234567890)
Scientific Reports | (2021) 11:14714 | https://doi.org/10.1038/s41598-021-94163-y
www.nature.com/scientificreports/
were strikingly up-regulated in PAH cluster 2, including denticleless e3 ubiquitin protein ligase homolog (dtl), minichromosome maintenance complex component 4 (mcm4) and minichromosome maintenance 10 replication initiation factor (mcm10). Gene Ontology term enrichment analyses showed that these genes are involved in DNA replication, cell-cycle checkpoint, DNA strand elongation and cell proliferation. Thus cluster 2 in control PAEC contains quiescent cells, but in PAH contain cells with a proliferative phenotype.
Cluster 3 in both control and PAH were characterized by decreased expression of genes in cell-cycle and cell proliferation pathways, including cenpf, cdc25b, cenpw (centromere protein W), pclaf 9 (pcna clamp associated
Figure 2. Ingenuity pathway analysis of genes differentially expressed between the total population of control and PAH PAECs. Differential expression analyses revealed 629 genes. These were used for canonical pathway ingenuity analyses.
Figure 3. Dimensionality reduction using all genes in all cells. Dimensionality reduction summarizes the heterogeneous populations in a high dimensional space in a two-dimensional embedding. The DEPP1/ANXA2 plot depict the expression of the two genes in the different clusters in a two-dimensional embedding. The tSNE, UMAP, TriMAP and PC plots depict the expression of all genes in higher dimensional space in a two-dimensional embedding. Thus, from left to right the data depicts maximum local structure (for example the needles on a pine tree) to maximum global structure (for example the clusters of pine trees in a pine forest). Eight clusters were identified by visual inspection of the TriMap space.
5
Vol.:(0123456789)
Scientific Reports | (2021) 11:14714 | https://doi.org/10.1038/s41598-021-94163-y
www.nature.com/scientificreports/
factor), and cdkn3 (cyclin dependent kinase inhibitor 3). Therefore, cluster 3 in both PAH and controls were assigned the term of quiescent phenotype.
A cluster 4 was identified in both PAH and control PAEC but the clusters were different in their transcriptomic profiles. Cluster 4 in control PAEC had 142 transcripts that were down-regulated relative to the other clusters. The genes were from wide-ranging pathways, including mitotic cell cycle, cell division, chromosome organization and segregation, spindle organization and microtubule cytoskeleton organization. Based on this transcriptome, cluster 4 among control PAEC was termed quiescent. In contrast, although some cell proliferation genes were down-regulated in PAH cluster 4, 23 genes in angiogenesis, migration and adhesion pathways were up-regulated, such as (claudin 4 (cldn5), pgf, cxcr4, nidogen 2 (nid2), and ccl14). This profile suggests that PAH cluster 4 has a unique angiogenic phenotype not found in the control PAEC cluster 4.
The majority of the differentially expressed genes of cluster 5 were upregulated in both control and PAH cells. The genes upregulated in this cluster control cell proliferation, such as cenpf, cytoskeleton-associated protein 2 (ckap2), kinesin family member 15 (kif15), kinesin family member 18a (kif18a), mik67, serine/threonine-protein kinase 2 (nek2) and kinetochore protein (spc25). This cluster is thus active in proliferation and was accordingly named Proliferative cluster.
Cluster 6 was similar among control and PAH, with some down-regulated genes in cell cycle pathways, but many upregulated genes in processes of angiogenesis, migration, inflammation and cell adhesion (kdr, cxcr4, angiopoietin 2 (angpt2), pgf, platelet derived growth factor subunit B (pdgfb), nid2, jagged canonical notch ligand 2 (jag2), OX-2 membrane glycoprotein (cd200), ccl14). This cluster was accordingly considered as an angiogenic subset in both control and PAH.
Similar to cluster 6, cluster 7 among control and PAH PAEC had reduced expression of cell proliferation genes (cell division cycle-associated 3 (cdca3), DNA topoisomerase II alpha (top2a), and mki67) relative to other clusters. In both control and PAH, genes regulating angiogenesis, migration, adhesion, platelet activation and inflammation were overexpressed, including (kdr, endoglin (eng), pecam1, matrix metallopeptidase 2 (mmp2), (matrix metallopeptidase 12 (mmp12), cldn5, pgf, cd93 molecule (cd93), protocadherin 9 (pcdh9), clusterin (clu), heparin binding egf like growth factor (hbegf), and glycophorin C (gypc)). The clusters were named consistent with these phenotypes of angiogenesis, migration and inflammation.
Control and PAH Cluster 8 had cells with down-regulation of genes mainly involved in cell proliferation. While there were no genes upregulated in PAH cluster 8, control PAEC cluster 8 had upregulated expression of genes controlling the enzyme-linked-receptor-protein-signaling pathways inhibin subunit beta A (inhba), follistatin like 3 (fstl3), zinc finger protein 703 (znf703), hedgehog interacting protein (hhip), eph receptor B6 (ephb6), integrin subunit beta 3 (itgb3) and plasminogen activator, tissue type (plat). These clusters were therefore named Receptor-signaling in control cluster 8 and Quiescent in PAH cluster 8.
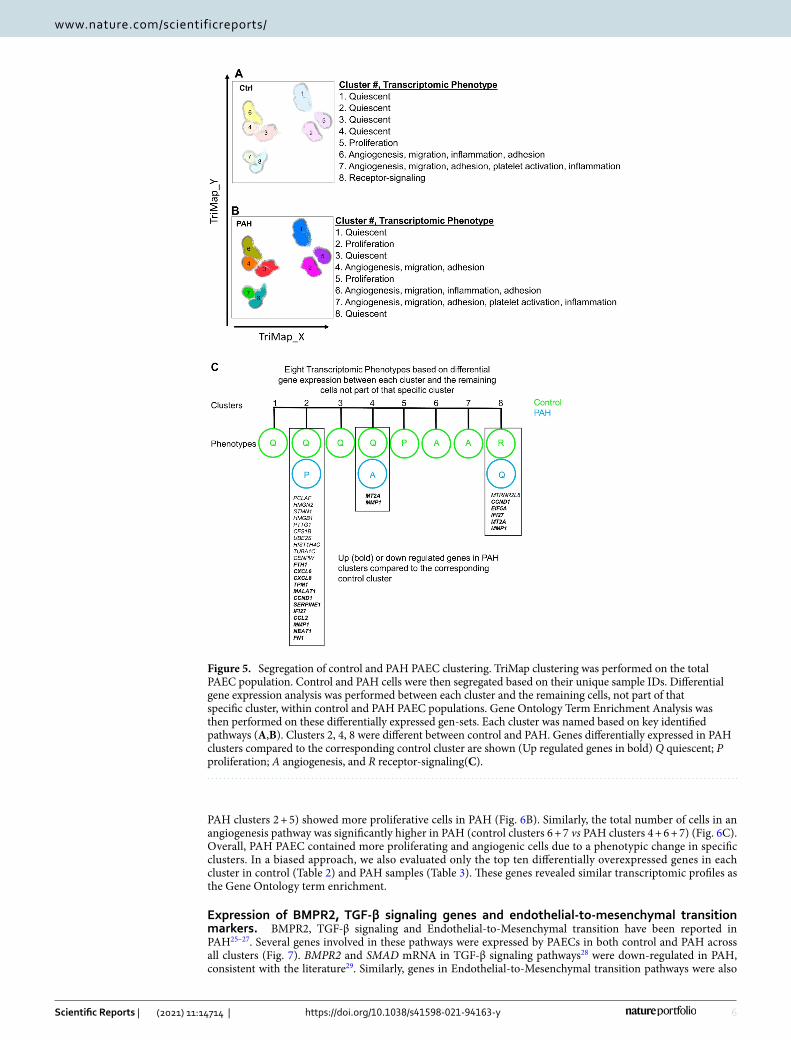
Differential gene expression analysis was subsequently performed to compare transcriptomic profiles of con-trol and PAH clusters (2, 4 and 8) (Fig. 5C). Genes down-regulated in PAH cluster 2 relative to control cluster 2 were involved in microtubules, spindle and centromere formation (tuba1b, tuba1c and cenp10). Upregulated genes regulate intracellular iron storage (fth1), chemoattractant of inflammatory cells know to have essential roles in PAH such as neutrophils, monocytes, T-cell and dendritic cells (cxcl6, cxcl8 and ccl2)20–22. In clusters 4 and 8, mt2a, a member of the metallothionein family controlling intracellular metabolism of essential metals23, and mmp1 (matrix metallopeptidase 1) were overexpressed. In cluster 8, humanin-like pepdide 8 (mtrnr2l8), a mitochondrial genome encoded gene with receptor activity regulator activity, was down-regulated24. Importantly, the majority of genes differentially expressed between corresponding control and PAH clusters were not identi-fied in the global differential gene expression analysis with the total control and PAH cells. Only HIST1H4C (downregulated) and FTH1, CXCL6, CCND1 IFI27 and CCL2 (upregulated) were found in the analysis of the total populations.
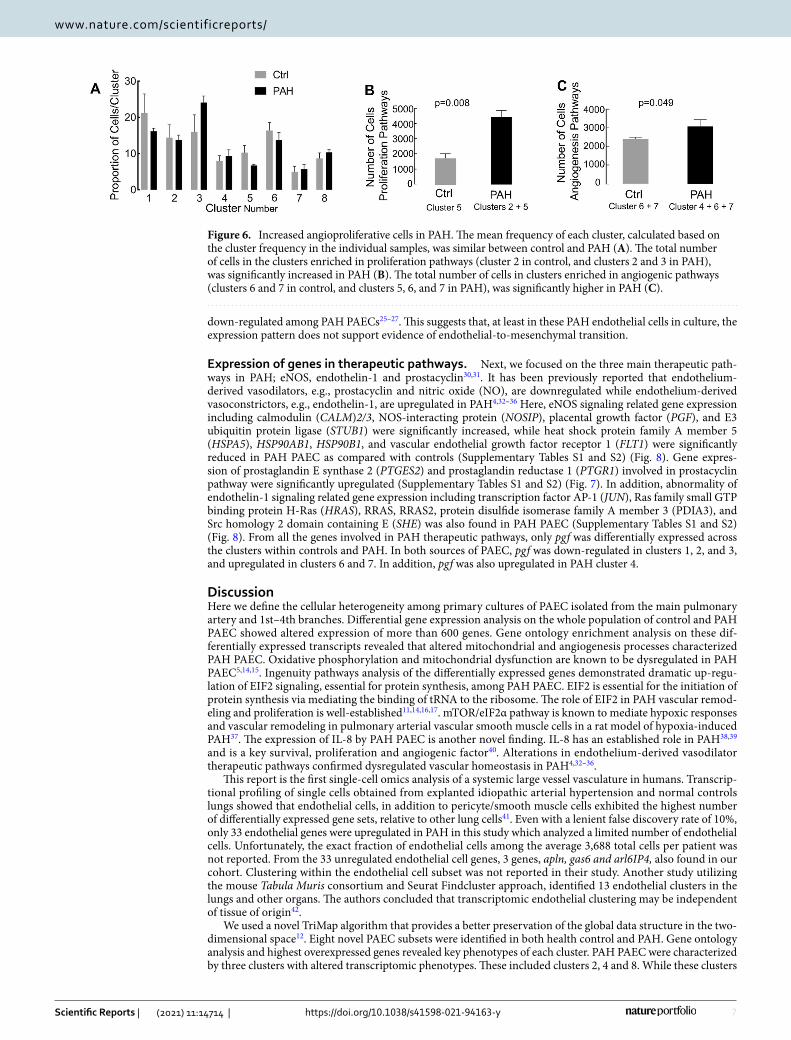
The proportion of cells in each individual cluster was similar between control and PAH (Fig. 6A). Compari-son of the total number of cells enriched in proliferation pathways between conditions, (control cluster 5 vs.
Figure 4. Distribution of the 629 differentially expressed genes across clusters. TriMap space showing genes down (left figure) and up (right figure) regulated in PAH. The differentially expressed genes did not localize in a single cluster, but were spread across all clusters.
6
Vol:.(1234567890)
Scientific Reports | (2021) 11:14714 | https://doi.org/10.1038/s41598-021-94163-y
www.nature.com/scientificreports/
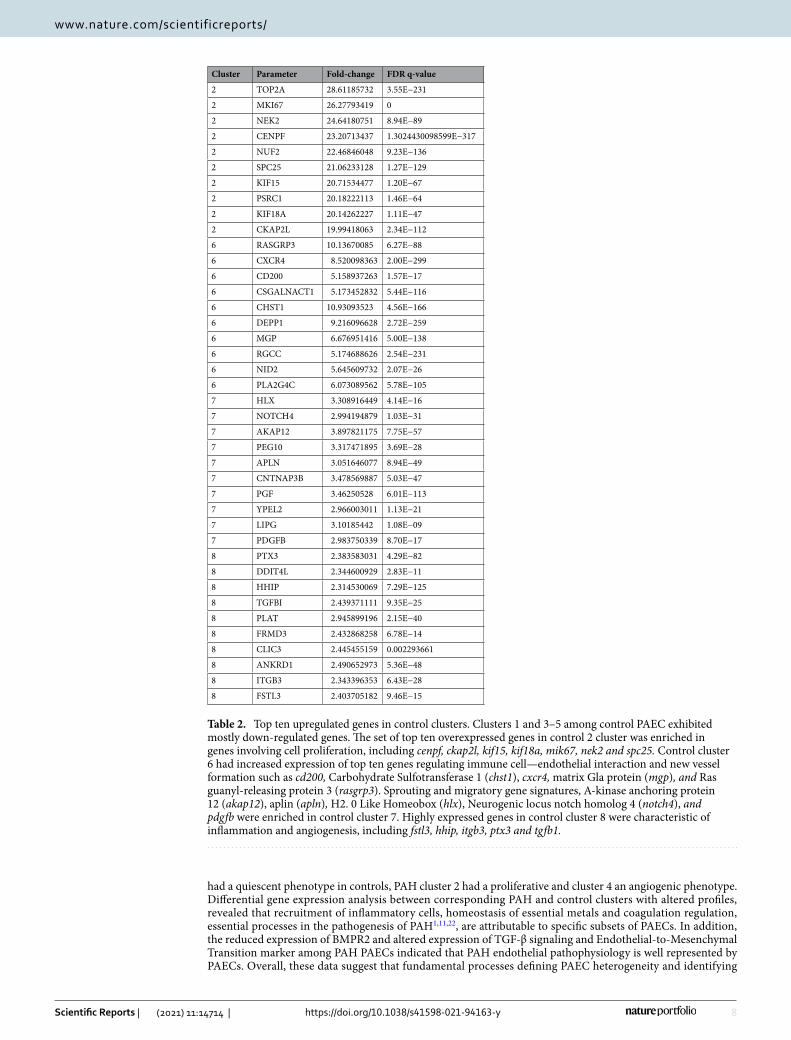
PAH clusters 2 + 5) showed more proliferative cells in PAH (Fig. 6B). Similarly, the total number of cells in an angiogenesis pathway was significantly higher in PAH (control clusters 6 + 7 vs PAH clusters 4 + 6 + 7) (Fig. 6C). Overall, PAH PAEC contained more proliferating and angiogenic cells due to a phenotypic change in specific clusters. In a biased approach, we also evaluated only the top ten differentially overexpressed genes in each cluster in control (Table 2) and PAH samples (Table 3). These genes revealed similar transcriptomic profiles as the Gene Ontology term enrichment.
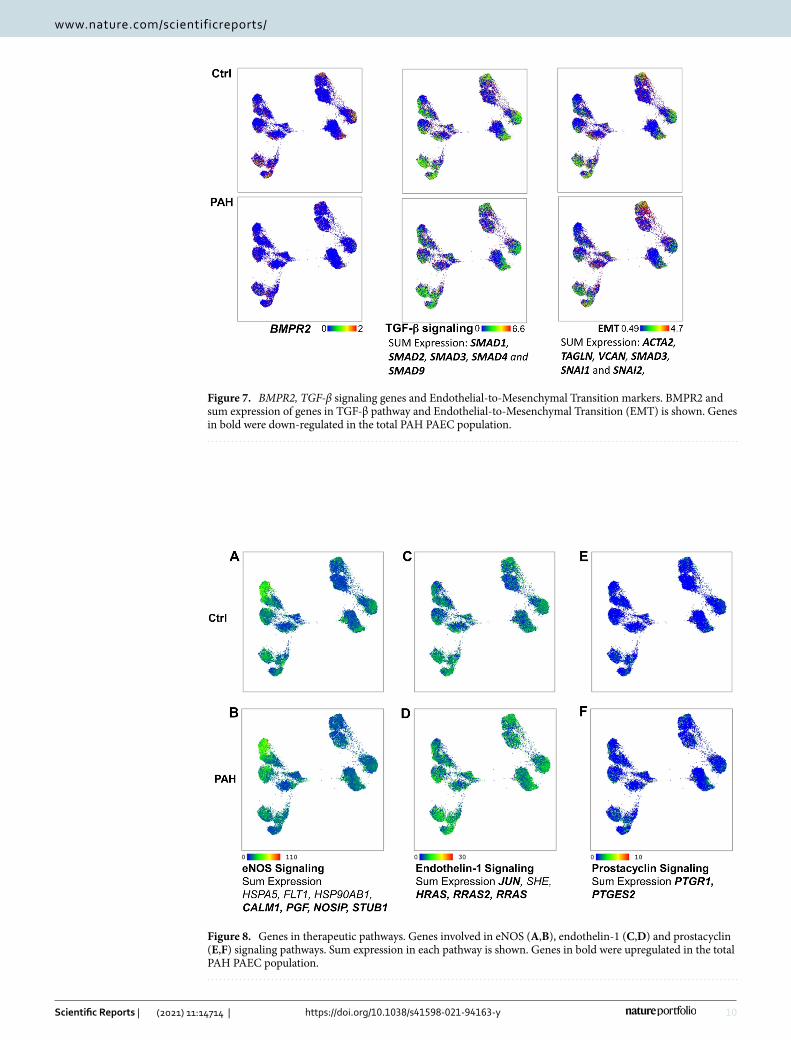
Expression of BMPR2, TGF‑β signaling genes and endothelial‑to‑mesenchymal transition markers. BMPR2, TGF-β signaling and Endothelial-to-Mesenchymal transition have been reported in PAH25–27. Several genes involved in these pathways were expressed by PAECs in both control and PAH across all clusters (Fig. 7). BMPR2 and SMAD mRNA in TGF-β signaling pathways28 were down-regulated in PAH, consistent with the literature29. Similarly, genes in Endothelial-to-Mesenchymal transition pathways were also
Figure 5. Segregation of control and PAH PAEC clustering. TriMap clustering was performed on the total PAEC population. Control and PAH cells were then segregated based on their unique sample IDs. Differential gene expression analysis was performed between each cluster and the remaining cells, not part of that specific cluster, within control and PAH PAEC populations. Gene Ontology Term Enrichment Analysis was then performed on these differentially expressed gen-sets. Each cluster was named based on key identified pathways (A,B). Clusters 2, 4, 8 were different between control and PAH. Genes differentially expressed in PAH clusters compared to the corresponding control cluster are shown (Up regulated genes in bold) Q quiescent; P proliferation; A angiogenesis, and R receptor-signaling(C).
7
Vol.:(0123456789)
Scientific Reports | (2021) 11:14714 | https://doi.org/10.1038/s41598-021-94163-y
www.nature.com/scientificreports/
down-regulated among PAH PAECs25–27. This suggests that, at least in these PAH endothelial cells in culture, the expression pattern does not support evidence of endothelial-to-mesenchymal transition.
Expression of genes in therapeutic pathways. Next, we focused on the three main therapeutic path-ways in PAH; eNOS, endothelin-1 and prostacyclin30,31. It has been previously reported that endothelium-derived vasodilators, e.g., prostacyclin and nitric oxide (NO), are downregulated while endothelium-derived vasoconstrictors, e.g., endothelin-1, are upregulated in PAH4,32–36 Here, eNOS signaling related gene expression including calmodulin (CALM)2/3, NOS-interacting protein (NOSIP), placental growth factor (PGF), and E3 ubiquitin protein ligase (STUB1) were significantly increased, while heat shock protein family A member 5 (HSPA5), HSP90AB1, HSP90B1, and vascular endothelial growth factor receptor 1 (FLT1) were significantly reduced in PAH PAEC as compared with controls (Supplementary Tables S1 and S2) (Fig. 8). Gene expres-sion of prostaglandin E synthase 2 (PTGES2) and prostaglandin reductase 1 (PTGR1) involved in prostacyclin pathway were significantly upregulated (Supplementary Tables S1 and S2) (Fig. 7). In addition, abnormality of endothelin-1 signaling related gene expression including transcription factor AP-1 (JUN), Ras family small GTP binding protein H-Ras (HRAS), RRAS, RRAS2, protein disulfide isomerase family A member 3 (PDIA3), and Src homology 2 domain containing E (SHE) was also found in PAH PAEC (Supplementary Tables S1 and S2) (Fig. 8). From all the genes involved in PAH therapeutic pathways, only pgf was differentially expressed across the clusters within controls and PAH. In both sources of PAEC, pgf was down-regulated in clusters 1, 2, and 3, and upregulated in clusters 6 and 7. In addition, pgf was also upregulated in PAH cluster 4.
DiscussionHere we define the cellular heterogeneity among primary cultures of PAEC isolated from the main pulmonary artery and 1st–4th branches. Differential gene expression analysis on the whole population of control and PAH PAEC showed altered expression of more than 600 genes. Gene ontology enrichment analysis on these dif-ferentially expressed transcripts revealed that altered mitochondrial and angiogenesis processes characterized PAH PAEC. Oxidative phosphorylation and mitochondrial dysfunction are known to be dysregulated in PAH PAEC5,14,15. Ingenuity pathways analysis of the differentially expressed genes demonstrated dramatic up-regu-lation of EIF2 signaling, essential for protein synthesis, among PAH PAEC. EIF2 is essential for the initiation of protein synthesis via mediating the binding of tRNA to the ribosome. The role of EIF2 in PAH vascular remod-eling and proliferation is well-established11,14,16,17. mTOR/eIF2α pathway is known to mediate hypoxic responses and vascular remodeling in pulmonary arterial vascular smooth muscle cells in a rat model of hypoxia-induced PAH37. The expression of IL-8 by PAH PAEC is another novel finding. IL-8 has an established role in PAH38,39 and is a key survival, proliferation and angiogenic factor40. Alterations in endothelium-derived vasodilator therapeutic pathways confirmed dysregulated vascular homeostasis in PAH4,32–36.
This report is the first single-cell omics analysis of a systemic large vessel vasculature in humans. Transcrip-tional profiling of single cells obtained from explanted idiopathic arterial hypertension and normal controls lungs showed that endothelial cells, in addition to pericyte/smooth muscle cells exhibited the highest number of differentially expressed gene sets, relative to other lung cells41. Even with a lenient false discovery rate of 10%, only 33 endothelial genes were upregulated in PAH in this study which analyzed a limited number of endothelial cells. Unfortunately, the exact fraction of endothelial cells among the average 3,688 total cells per patient was not reported. From the 33 unregulated endothelial cell genes, 3 genes, apln, gas6 and arl6IP4, also found in our cohort. Clustering within the endothelial cell subset was not reported in their study. Another study utilizing the mouse Tabula Muris consortium and Seurat Findcluster approach, identified 13 endothelial clusters in the lungs and other organs. The authors concluded that transcriptomic endothelial clustering may be independent of tissue of origin42.
We used a novel TriMap algorithm that provides a better preservation of the global data structure in the two-dimensional space12. Eight novel PAEC subsets were identified in both health control and PAH. Gene ontology analysis and highest overexpressed genes revealed key phenotypes of each cluster. PAH PAEC were characterized by three clusters with altered transcriptomic phenotypes. These included clusters 2, 4 and 8. While these clusters
Figure 6. Increased angioproliferative cells in PAH. The mean frequency of each cluster, calculated based on the cluster frequency in the individual samples, was similar between control and PAH (A). The total number of cells in the clusters enriched in proliferation pathways (cluster 2 in control, and clusters 2 and 3 in PAH), was significantly increased in PAH (B). The total number of cells in clusters enriched in angiogenic pathways (clusters 6 and 7 in control, and clusters 5, 6, and 7 in PAH), was significantly higher in PAH (C).
8
Vol:.(1234567890)
Scientific Reports | (2021) 11:14714 | https://doi.org/10.1038/s41598-021-94163-y
www.nature.com/scientificreports/
had a quiescent phenotype in controls, PAH cluster 2 had a proliferative and cluster 4 an angiogenic phenotype. Differential gene expression analysis between corresponding PAH and control clusters with altered profiles, revealed that recruitment of inflammatory cells, homeostasis of essential metals and coagulation regulation, essential processes in the pathogenesis of PAH1,11,22, are attributable to specific subsets of PAECs. In addition, the reduced expression of BMPR2 and altered expression of TGF-β signaling and Endothelial-to-Mesenchymal Transition marker among PAH PAECs indicated that PAH endothelial pathophysiology is well represented by PAECs. Overall, these data suggest that fundamental processes defining PAEC heterogeneity and identifying
Table 2. Top ten upregulated genes in control clusters. Clusters 1 and 3–5 among control PAEC exhibited mostly down-regulated genes. The set of top ten overexpressed genes in control 2 cluster was enriched in genes involving cell proliferation, including cenpf, ckap2l, kif15, kif18a, mik67, nek2 and spc25. Control cluster 6 had increased expression of top ten genes regulating immune cell—endothelial interaction and new vessel formation such as cd200, Carbohydrate Sulfotransferase 1 (chst1), cxcr4, matrix Gla protein (mgp), and Ras guanyl-releasing protein 3 (rasgrp3). Sprouting and migratory gene signatures, A-kinase anchoring protein 12 (akap12), aplin (apln), H2. 0 Like Homeobox (hlx), Neurogenic locus notch homolog 4 (notch4), and pdgfb were enriched in control cluster 7. Highly expressed genes in control cluster 8 were characteristic of inflammation and angiogenesis, including fstl3, hhip, itgb3, ptx3 and tgfb1.
Cluster Parameter Fold-change FDR q-value
2 TOP2A 28.61185732 3.55E−231
2 MKI67 26.27793419 0
2 NEK2 24.64180751 8.94E−89
2 CENPF 23.20713437 1.3024430098599E−317
2 NUF2 22.46846048 9.23E−136
2 SPC25 21.06233128 1.27E−129
2 KIF15 20.71534477 1.20E−67
2 PSRC1 20.18222113 1.46E−64
2 KIF18A 20.14262227 1.11E−47
2 CKAP2L 19.99418063 2.34E−112
6 RASGRP3 10.13670085 6.27E−88
6 CXCR4 8.520098363 2.00E−299
6 CD200 5.158937263 1.57E−17
6 CSGALNACT1 5.173452832 5.44E−116
6 CHST1 10.93093523 4.56E−166
6 DEPP1 9.216096628 2.72E−259
6 MGP 6.676951416 5.00E−138
6 RGCC 5.174688626 2.54E−231
6 NID2 5.645609732 2.07E−26
6 PLA2G4C 6.073089562 5.78E−105
7 HLX 3.308916449 4.14E−16
7 NOTCH4 2.994194879 1.03E−31
7 AKAP12 3.897821175 7.75E−57
7 PEG10 3.317471895 3.69E−28
7 APLN 3.051646077 8.94E−49
7 CNTNAP3B 3.478569887 5.03E−47
7 PGF 3.46250528 6.01E−113
7 YPEL2 2.966003011 1.13E−21
7 LIPG 3.10185442 1.08E−09
7 PDGFB 2.983750339 8.70E−17
8 PTX3 2.383583031 4.29E−82
8 DDIT4L 2.344600929 2.83E−11
8 HHIP 2.314530069 7.29E−125
8 TGFBI 2.439371111 9.35E−25
8 PLAT 2.945899196 2.15E−40
8 FRMD3 2.432868258 6.78E−14
8 CLIC3 2.445455159 0.002293661
8 ANKRD1 2.490652973 5.36E−48
8 ITGB3 2.343396353 6.43E−28
8 FSTL3 2.403705182 9.46E−15
9
Vol.:(0123456789)
Scientific Reports | (2021) 11:14714 | https://doi.org/10.1038/s41598-021-94163-y
www.nature.com/scientificreports/
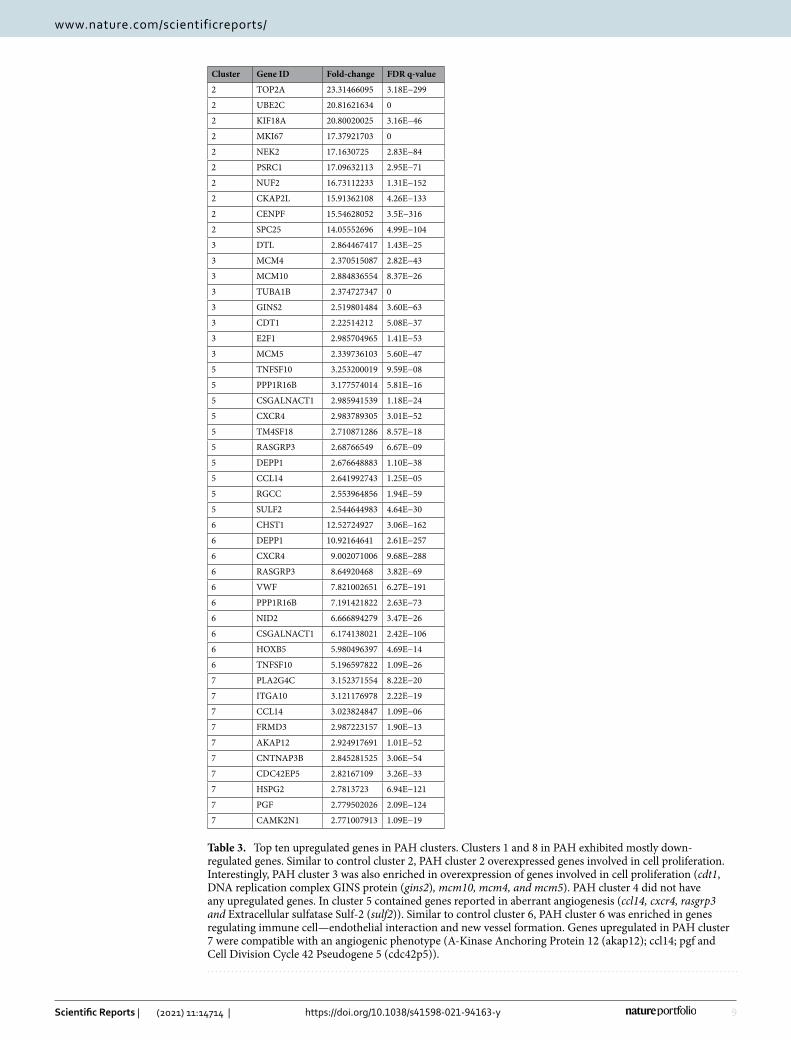
Table 3. Top ten upregulated genes in PAH clusters. Clusters 1 and 8 in PAH exhibited mostly down-regulated genes. Similar to control cluster 2, PAH cluster 2 overexpressed genes involved in cell proliferation. Interestingly, PAH cluster 3 was also enriched in overexpression of genes involved in cell proliferation (cdt1, DNA replication complex GINS protein (gins2), mcm10, mcm4, and mcm5). PAH cluster 4 did not have any upregulated genes. In cluster 5 contained genes reported in aberrant angiogenesis (ccl14, cxcr4, rasgrp3 and Extracellular sulfatase Sulf-2 (sulf2)). Similar to control cluster 6, PAH cluster 6 was enriched in genes regulating immune cell—endothelial interaction and new vessel formation. Genes upregulated in PAH cluster 7 were compatible with an angiogenic phenotype (A-Kinase Anchoring Protein 12 (akap12); ccl14; pgf and Cell Division Cycle 42 Pseudogene 5 (cdc42p5)).
Cluster Gene ID Fold-change FDR q-value
2 TOP2A 23.31466095 3.18E−299
2 UBE2C 20.81621634 0
2 KIF18A 20.80020025 3.16E−46
2 MKI67 17.37921703 0
2 NEK2 17.1630725 2.83E−84
2 PSRC1 17.09632113 2.95E−71
2 NUF2 16.73112233 1.31E−152
2 CKAP2L 15.91362108 4.26E−133
2 CENPF 15.54628052 3.5E−316
2 SPC25 14.05552696 4.99E−104
3 DTL 2.864467417 1.43E−25
3 MCM4 2.370515087 2.82E−43
3 MCM10 2.884836554 8.37E−26
3 TUBA1B 2.374727347 0
3 GINS2 2.519801484 3.60E−63
3 CDT1 2.22514212 5.08E−37
3 E2F1 2.985704965 1.41E−53
3 MCM5 2.339736103 5.60E−47
5 TNFSF10 3.253200019 9.59E−08
5 PPP1R16B 3.177574014 5.81E−16
5 CSGALNACT1 2.985941539 1.18E−24
5 CXCR4 2.983789305 3.01E−52
5 TM4SF18 2.710871286 8.57E−18
5 RASGRP3 2.68766549 6.67E−09
5 DEPP1 2.676648883 1.10E−38
5 CCL14 2.641992743 1.25E−05
5 RGCC 2.553964856 1.94E−59
5 SULF2 2.544644983 4.64E−30
6 CHST1 12.52724927 3.06E−162
6 DEPP1 10.92164641 2.61E−257
6 CXCR4 9.002071006 9.68E−288
6 RASGRP3 8.64920468 3.82E−69
6 VWF 7.821002651 6.27E−191
6 PPP1R16B 7.191421822 2.63E−73
6 NID2 6.666894279 3.47E−26
6 CSGALNACT1 6.174138021 2.42E−106
6 HOXB5 5.980496397 4.69E−14
6 TNFSF10 5.196597822 1.09E−26
7 PLA2G4C 3.152371554 8.22E−20
7 ITGA10 3.121176978 2.22E−19
7 CCL14 3.023824847 1.09E−06
7 FRMD3 2.987223157 1.90E−13
7 AKAP12 2.924917691 1.01E−52
7 CNTNAP3B 2.845281525 3.06E−54
7 CDC42EP5 2.82167109 3.26E−33
7 HSPG2 2.7813723 6.94E−121
7 PGF 2.779502026 2.09E−124
7 CAMK2N1 2.771007913 1.09E−19
10
Vol:.(1234567890)
Scientific Reports | (2021) 11:14714 | https://doi.org/10.1038/s41598-021-94163-y
www.nature.com/scientificreports/
Figure 7. BMPR2, TGF-β signaling genes and Endothelial-to-Mesenchymal Transition markers. BMPR2 and sum expression of genes in TGF-β pathway and Endothelial-to-Mesenchymal Transition (EMT) is shown. Genes in bold were down-regulated in the total PAH PAEC population.
Figure 8. Genes in therapeutic pathways. Genes involved in eNOS (A,B), endothelin-1 (C,D) and prostacyclin (E,F) signaling pathways. Sum expression in each pathway is shown. Genes in bold were upregulated in the total PAH PAEC population.
11
Vol.:(0123456789)
Scientific Reports | (2021) 11:14714 | https://doi.org/10.1038/s41598-021-94163-y
www.nature.com/scientificreports/
dysregulated endothelial cells in PAH originate from distinct subsets of cells. The findings of our study shed light on the transcriptomic diversity of PAEC. Identification of canonical dysregulated pathways demonstrate that PAH is characterized by an altered PAEC landscape in specific endothelial subsets. It should be kept in mind that these findings are in passaged cells. Further study is required to evaluate whether clusters vary among cells freshly harvested from PAH and control lungs. Nevertheless, the findings map transcriptomic heterogeneity among PAEC in health and vascular disease and serves as a comprehensive gene expression profile model to advance our understanding of endothelial dysfunction in PAH.
Materials and methodsIsolation of human PAEC. Human primary pulmonary arterial endothelial cells (PAEC) were collected either from unused explanted control donor lungs or explanted from PAH patients undergoing lung transplanta-tion. The study was approved by the Cleveland Clinic Institutional Review Board, and informed written consent was obtained from all participants or tissue was under an Cleveland Clinic IRB exempt protocol. All methods were performed in accordance with the relevant guidelines and regulations.
PAEC from explanted PAH lungs or donor lungs not used for transplantation were harvested and cultured as previously described43. Donors for PAH lungs included 2 women and were of average age 33 ± 7 years old. They were transplanted at 16, 7 and 2 years after their diagnoses with PAH. All patients were on sildenafil, two of the patients were also on treprostinil, and one patient was also treated with prostacyclin and bosentan. Hemodynamic measurements were available and the mean pulmonary artery pressures were 53 ± 8.7 mmHg; cardiac output 3.5 ± 0.18 L/min; cardiac index 2 ± 0.19 L/min/m2 (mean ± SD, n = 3). Briefly, excess fat and connective tissue were removed from the main artery and rinsed (3 times) with Hanks’ Balanced Salt Solution (Invitrogen, Grand Island, NY). The arterial endothelial cells were removed by placing the arteries in 10–15 ml PBS containing 2 mg/ml type II collagenase (Worthington Biochem, Lakewood, NJ) at 37 °C and 5% CO2 with 90% humidity for 20 min. After incubation the arteries were placed in into MCDB-107 medium containing 14.8 g/l MCDB-105 (Sigma, St Louis, MO), 90 mg/l heparin (Sigma, St Louis, MO), 115 mg Endothelial Cell Growth Supplement (ECGS) (Sigma, St Louis, MO), 15.1 mg/l Glycine, 149 mg/l Potassium chloride (KCl), 10% Heat Inactivated Fetal Bovine Serum (FBS) (Lonza, Walkersville, MA), 1% Penicillin/Streptomycin/ Fungizone Solution (Invitrogen, Grand Island, NY) with pH 7.3. The endothelial cells were detach by a gentle shake and the residual arteries were removed before centrifugation at 330 g for 7 min at room temperature. The cell pellet was re-suspended in MCDB-107 medium and seeded on fibronection (1 mg/cm2) (CalBiochem, La Jolla, CA) coated cell culture plates. The cells were incubated at 37 °C, 5% CO2 with 90% humidity followed by media changes at 24 h and every 3 days until confluence. At passage 5 we tested the purity of the cell culture by immunophenotyping for CD31. All cells used in this paper were more than 96% CD31 positive. The passage of cells used in experiments was passage 6. Venous44 and alveolar capillary45 gene signatures were dimly present among the cells (Supplemental Fig. S4), showing that we sampled the same endothelial cell populations in PAH and controls.
10 × Single‑cell RNA‑Seq. PAEC suspensions with viabilities between 96 and 98% were used on 10 × plat-form for single-cell partitioning. The Chromium 3’ Solution V2 chemistry was used as instructed by the manu-facturer.
Library Prep and sequencing. Concentration and quality of double-stranded cDNA was assessed using a high-sensitivity DNA assay on an Agilent 2100 Bioanalyzer. Library preparation for sequencing on an Illumina platform was accomplished for each sample following the manufacturer’s protocol (CG000183 Rev A). Quality of library construction was again assessed using the Bioanalyzer. Samples were fluorometrically quantified with a Qubit (Thermo Fisher Scientific), pooled, and quantified on a Quantabio Q cycler using Quantabio SparQ Fast Library Quant kit. Sequence data was generated on a NovaSeq 6000 using parameters recommended by 10x (CG000183 Rev A).
Cell ranger quality control and mapping. Raw sequencing data were processed with Cell Ranger (ver-sion 3.0.2), a proprietary package from 10 × Genomics. Reads QC and mapping were also performed within the Cell Ranger analysis pipeline. Reads were mapped to human reference genome, assembly GRCh38, using STAR aligner46. After obtaining mapped reads from the Cell Ranger pipeline, count matrices for the samples were produced using data in filtered_feature_bc_matrix directories and subsequently filtered to remove genes without any counts. Gene Ontology (GO) term enrichment analysis for Biological Processes was performed using a browser interface to MSigDB database v7.147–49 A list of differentially expressed genes was provided and the list was compared to gene sets in the GO database using the hypergeometric test. Canonical pathway analysis of differentially expressed genes was done using QIAGEN Ingenuity Pathway Analysis (QIAGEN IPA, Qiagen, Redwood City, CA).
SeqGeq Bioinformatics. Data was analyzed in the SeqGeq bioinformatics platform, from the makers of FlowJo50. Techniques applied were done so following recommended bioinformatics protocols developed by the scien-tific community and honed by experts in single-cell data exploration at FlowJo, LLC. All differential expression analysis defined genes as up or down regulated if features showed Fold-Change >|2.0| and Bonferroni adjusted p-Values < 0.05 relative to comparator populations. Data files were concatenated together and normalized to Counts per 10 k reads, for uniform analysis of all matrices together. This ensured that uniform treatment was given to each dataset and made results more easily comparable between samples and conditions downstream.
12
Vol:.(1234567890)
Scientific Reports | (2021) 11:14714 | https://doi.org/10.1038/s41598-021-94163-y
www.nature.com/scientificreports/
Data availabilityAll raw mRNA-seq data files are available on NCBI’s Gene Expression Omnibus (GEO), accessible using the following link https:// www. ncbi. nlm. nih. gov/ geo/ query/ acc. cgi? acc= GSE18 5479.
Received: 11 March 2021; Accepted: 16 June 2021
References 1. Rabinovitch, M. Molecular pathogenesis of pulmonary arterial hypertension. J. Clin. Invest. 118, 2372–2379. https:// doi. org/ 10.
1172/ JCI33 452 (2008). 2. Xu, W. et al. Increased arginase II and decreased NO synthesis in endothelial cells of patients with pulmonary arterial hyperten-
sion. FASEB J. 18, 1746–1748. https:// doi. org/ 10. 1096/ fj. 04- 2317fj e (2004). 3. Fijalkowska, I. et al. Hypoxia inducible-factor1alpha regulates the metabolic shift of pulmonary hypertensive endothelial cells.
Am. J. Pathol. 176, 1130–1138. https:// doi. org/ 10. 2353/ ajpath. 2010. 090832 (2010). 4. Xu, W. et al. Alterations of cellular bioenergetics in pulmonary artery endothelial cells. Proc. Natl. Acad. Sci. USA 104, 1342–1347.
https:// doi. org/ 10. 1073/ pnas. 06050 80104 (2007). 5. Xu, W. & Erzurum, S. C. Endothelial cell energy metabolism, proliferation, and apoptosis in pulmonary hypertension. Compr.
Physiol. 1, 357–372. https:// doi. org/ 10. 1002/ cphy. c0900 05 (2011). 6. Masri, F. A. et al. Hyperproliferative apoptosis-resistant endothelial cells in idiopathic pulmonary arterial hypertension. Am. J.
Physiol. Lung Cell. Mol. Physiol. 293, L548-554. https:// doi. org/ 10. 1152/ ajplu ng. 00428. 2006 (2007). 7. Aldred, M. A. et al. Somatic chromosome abnormalities in the lungs of patients with pulmonary arterial hypertension. Am. J.
Respir. Crit. Care Med. 182, 1153–1160. https:// doi. org/ 10. 1164/ rccm. 201003- 0491OC (2010). 8. Aird, W. C. Endothelial cell heterogeneity. Cold Spring Harb. Perspect. Med. 2, a006429. https:// doi. org/ 10. 1101/ cshpe rspect. a0064
29 (2012). 9. Aird, W. C. Phenotypic heterogeneity of the endothelium: I. Structure, function, and mechanisms. Circ. Res. 100, 158–173. https://
doi. org/ 10. 1161/ 01. RES. 00002 55691. 76142. 4a (2007). 10. Aird, W. C. Phenotypic heterogeneity of the endothelium: II. Representative vascular beds. Circ. Res. 100, 174–190. https:// doi.
org/ 10. 1161/ 01. RES. 00002 55690. 03436. ae (2007). 11. Eyries, M. et al. EIF2AK4 mutations cause pulmonary veno-occlusive disease, a recessive form of pulmonary hypertension. Nat.
Genet. 46, 65–69. https:// doi. org/ 10. 1038/ ng. 2844 (2014). 12. Amid, E. & Manfred, K. W. TriMap: Large-scale dimensionality reduction using triplets. arXiv preprint arXiv 1910.00204 (2019). 13. Haghverdi, L., Lun, A. T. L., Morgan, M. D. & Marioni, J. C. Batch effects in single-cell RNA-sequencing data are corrected by
matching mutual nearest neighbors. Nat. Biotechnol. 36, 421–427. https:// doi. org/ 10. 1038/ nbt. 4091 (2018). 14. Xu, W. et al. Integrative proteomics and phosphoproteomics in pulmonary arterial hypertension. Sci. Rep. 9, 18623. https:// doi.
org/ 10. 1038/ s41598- 019- 55053-6 (2019). 15. Asosingh, K. & Erzurum, S. Mechanisms of right heart disease in pulmonary hypertension (2017 Grover Conference Series). Pulm.
Circ. 8, 2045893217753121. https:// doi. org/ 10. 1177/ 20458 93217 753121 (2018). 16. Montani, D. et al. Clinical phenotypes and outcomes of heritable and sporadic pulmonary veno-occlusive disease: A population-
based study. Lancet Respir. Med. 5, 125–134. https:// doi. org/ 10. 1016/ S2213- 2600(16) 30438-6 (2017). 17. Hadinnapola, C. et al. Phenotypic characterization of EIF2AK4 mutation carriers in a large cohort of patients diagnosed clinically
with pulmonary arterial hypertension. Circulation 136, 2022–2033. https:// doi. org/ 10. 1161/ CIRCU LATIO NAHA. 117. 028351 (2017).
18. Gene Ontology, C. The Gene Ontology project in 2008. Nucleic Acids Res. 36, D440-444. https:// doi. org/ 10. 1093/ nar/ gkm883 (2008).
19. The Gene Ontology, C. The Gene Ontology Resource: 20 years and still GOing strong. Nucleic Acids Res. 47, D330–D338. https:// doi. org/ 10. 1093/ nar/ gky10 55 (2019).
20. Dorfmuller, P., Perros, F., Balabanian, K. & Humbert, M. Inflammation in pulmonary arterial hypertension. Eur. Respir. J. 22, 358–363. https:// doi. org/ 10. 1183/ 09031 936. 03. 00038 903 (2003).
21. Price, L. C. et al. Inflammation in pulmonary arterial hypertension. Chest 141, 210–221. https:// doi. org/ 10. 1378/ chest. 11- 0793 (2012).
22. Rabinovitch, M., Guignabert, C., Humbert, M. & Nicolls, M. R. Inflammation and immunity in the pathogenesis of pulmonary arterial hypertension. Circ. Res. 115, 165–175. https:// doi. org/ 10. 1161/ CIRCR ESAHA. 113. 301141 (2014).
23. Maarman, G. J. Pulmonary arterial hypertension and the potential roles of metallothioneins: A focused review. Life Sci. 214, 77–83. https:// doi. org/ 10. 1016/j. lfs. 2018. 10. 039 (2018).
24. Lee, C., Yen, K. & Cohen, P. Humanin: A harbinger of mitochondrial-derived peptides?. Trends Endocrinol. Metab. 24, 222–228. https:// doi. org/ 10. 1016/j. tem. 2013. 01. 005 (2013).
25. Kovacic, J. C., Mercader, N., Torres, M., Boehm, M. & Fuster, V. Epithelial-to-mesenchymal and endothelial-to-mesenchymal transition: From cardiovascular development to disease. Circulation 125, 1795–1808. https:// doi. org/ 10. 1161/ CIRCU LATIO NAHA. 111. 040352 (2012).
26. Stenmark, K. R., Frid, M. & Perros, F. Endothelial-to-mesenchymal transition: An evolving paradigm and a promising therapeutic target in PAH. Circulation 133, 1734–1737. https:// doi. org/ 10. 1161/ CIRCU LATIO NAHA. 116. 022479 (2016).
27. Ranchoux, B. et al. Endothelial-to-mesenchymal transition in pulmonary hypertension. Circulation 131, 1006–1018. https:// doi. org/ 10. 1161/ CIRCU LATIO NAHA. 114. 008750 (2015).
28. Weiss, A. & Attisano, L. The TGFbeta superfamily signaling pathway. Wiley Interdiscip. Rev. Dev. Biol. 2, 47–63. https:// doi. org/ 10. 1002/ wdev. 86 (2013).
29. Rol, N., Kurakula, K. B., Happe, C., Bogaard, H. J. & Goumans, M. J. TGF-beta and BMPR2 signaling in PAH: Two black sheep in one family. Int. J. Mol. Sci. 19, 25. https:// doi. org/ 10. 3390/ ijms1 90925 85 (2018).
30. Hirschtritt, T., Steiner, M. K. & Hill, N. S. Transitions and combination therapy for pulmonary arterial hypertension. In Contem-porary Cardiology: Pulmonary Hypertension (eds Hill, N. S. & Farber, H. W.) 337–362 (Springer, 2008).
31. Sitbon, O. & Morrell, N. Pathways in pulmonary arterial hypertension: The future is here. Eur. Respir. Rev. 21, 321–327. https:// doi. org/ 10. 1183/ 09059 180. 00004 812 (2012).
32. Kaneko, F. T. et al. Biochemical reaction products of nitric oxide as quantitative markers of primary pulmonary hypertension. Am. J. Respir. Crit. Care Med. 158, 917–923. https:// doi. org/ 10. 1164/ ajrccm. 158.3. 98020 66 (1998).
33. Machado, R. F. et al. Nitric oxide and pulmonary arterial pressures in pulmonary hypertension. Free Radic. Biol. Med. 37, 1010–1017. https:// doi. org/ 10. 1016/j. freer adbio med. 2004. 06. 039 (2004).
34. Girgis, R. E. et al. Decreased exhaled nitric oxide in pulmonary arterial hypertension: Response to bosentan therapy. Am. J. Respir. Crit. Care Med. 172, 352–357. https:// doi. org/ 10. 1164/ rccm. 200412- 1684OC (2005).
35. Christman, B. W. et al. An imbalance between the excretion of thromboxane and prostacyclin metabolites in pulmonary hyperten-sion. N. Engl. J. Med. 327, 70–75. https:// doi. org/ 10. 1056/ NEJM1 99207 09327 0202 (1992).
13
Vol.:(0123456789)
Scientific Reports | (2021) 11:14714 | https://doi.org/10.1038/s41598-021-94163-y
www.nature.com/scientificreports/
36. Giaid, A. et al. Expression of endothelin-1 in the lungs of patients with pulmonary hypertension. N. Engl. J. Med. 328, 1732–1739. https:// doi. org/ 10. 1056/ NEJM1 99306 17328 2402 (1993).
37. Wang, A. P. et al. A critical role of the mTOR/eIF2alpha pathway in hypoxia-induced pulmonary hypertension. PLoS ONE 10, e0130806. https:// doi. org/ 10. 1371/ journ al. pone. 01308 06 (2015).
38. Groth, A. et al. Inflammatory cytokines in pulmonary hypertension. Respir. Res. 15, 47. https:// doi. org/ 10. 1186/ 1465- 9921- 15- 47 (2014).
39. Soon, E. et al. Elevated levels of inflammatory cytokines predict survival in idiopathic and familial pulmonary arterial hyperten-sion. Circulation 122, 920–927. https:// doi. org/ 10. 1161/ CIRCU LATIO NAHA. 109. 933762 (2010).
40. Li, A., Dubey, S., Varney, M. L., Dave, B. J. & Singh, R. K. IL-8 directly enhanced endothelial cell survival, proliferation, and matrix metalloproteinases production and regulated angiogenesis. J. Immunol. 170, 3369–3376. https:// doi. org/ 10. 4049/ jimmu nol. 170.6. 3369 (2003).
41. Saygin, D. et al. Transcriptional profiling of lung cell populations in idiopathic pulmonary arterial hypertension. Pulm. Circ. 10, 15. https:// doi. org/ 10. 1177/ 20458 94020 908782 (2020).
42. Paik, D. T. et al. Single-cell RNA sequencing unveils unique transcriptomic signatures of organ-specific endothelial cells. Circula-tion 142, 1848–1862. https:// doi. org/ 10. 1161/ CIRCU LATIO NAHA. 119. 041433 (2020).
43. Comhair, S. A. et al. Human primary lung endothelial cells in culture. Am. J. Respir. Cell. Mol. Biol. 46, 723–730. https:// doi. org/ 10. 1165/ rcmb. 2011- 0416TE (2012).
44. Karlsson, M. B., Pirhonen, M., Saarilahti, H. T. & Palva, E. T. Molecular cloning of ompRS, a regulatory locus controlling produc-tion of outer membrane proteins in Erwinia carotovora subsp. carotovora. Mol. Gen. Genet. 226, 353–360. https:// doi. org/ 10. 1007/ BF002 60646 (1991).
45. Gillich, A. et al. Capillary cell-type specialization in the alveolus. Nature 586, 785–789. https:// doi. org/ 10. 1038/ s41586- 020- 2822-7 (2020).
46. Dobin, A. et al. STAR: Ultrafast universal RNA-seq aligner. Bioinformatics 29, 15–21. https:// doi. org/ 10. 1093/ bioin forma tics/ bts635 (2013).
47. Liberzon, A. et al. The Molecular Signatures Database (MSigDB) hallmark gene set collection. Cell. Syst. 1, 417–425. https:// doi. org/ 10. 1016/j. cels. 2015. 12. 004 (2015).
48. Liberzon, A. et al. Molecular signatures database (MSigDB) 30. Bioinformatics 27, 1739–1740. https:// doi. org/ 10. 1093/ bioin forma tics/ btr260 (2011).
49. Subramanian, A. et al. Gene set enrichment analysis: A knowledge-based approach for interpreting genome-wide expression profiles. Proc. Natl. Acad. Sci. USA 102, 15545–15550. https:// doi. org/ 10. 1073/ pnas. 05065 80102 (2005).
50. Eisenstein, M. Single-cell RNA-seq analysis software providers scramble to offer solutions. Nat. Biotechnol. 38, 254–257. https:// doi. org/ 10. 1038/ s41587- 020- 0449-8 (2020).
AcknowledgementsThanks to the Lerner Research Institute for 10x Single-Cell Omics services. This work was supported an award from the National Heart, Lung, and Blood Institute (HL060917). Erzurum is supported in part by the Alfred Lerner Chair for Biomedical Research.
Author contributionsK.A and S.C.E conceived the study. S.C., L.M. and D.H. performed the experiments. K.A., I.T., S.T. and B.H. per-formed data analysis. K.A., S.C., D.H., I.T, S.T. and S.C.E rote the manuscript, which was reviewed by all authors.
Competing interests The authors declare no competing interests.
Additional informationSupplementary Information The online version contains supplementary material available at https:// doi. org/ 10. 1038/ s41598- 021- 94163-y.
Correspondence and requests for materials should be addressed to K.A. or S.E.
Reprints and permissions information is available at www.nature.com/reprints.
Publisher’s note Springer Nature remains neutral with regard to jurisdictional claims in published maps and institutional affiliations.
Open Access This article is licensed under a Creative Commons Attribution 4.0 International License, which permits use, sharing, adaptation, distribution and reproduction in any medium or
format, as long as you give appropriate credit to the original author(s) and the source, provide a link to the Creative Commons licence, and indicate if changes were made. The images or other third party material in this article are included in the article’s Creative Commons licence, unless indicated otherwise in a credit line to the material. If material is not included in the article’s Creative Commons licence and your intended use is not permitted by statutory regulation or exceeds the permitted use, you will need to obtain permission directly from the copyright holder. To view a copy of this licence, visit http:// creat iveco mmons. org/ licen ses/ by/4. 0/.
© The Author(s) 2021, corrected publication 2021
Related Documents