Submitted 13 March 2014 Accepted 4 June 2014 Published 24 June 2014 Corresponding author Melissa L. Kemp, [email protected] Academic editor Shawn Gomez Additional Information and Declarations can be found on page 17 DOI 10.7717/peerj.452 Copyright 2014 Kippner et al. Distributed under Creative Commons CC-BY 4.0 OPEN ACCESS Single cell transcriptional analysis reveals novel innate immune cell types Linda E. Kippner 1,3 , Jinhee Kim 2,3 , Greg Gibson 2 and Melissa L. Kemp 1 1 The Wallace H. Coulter Department of Biomedical Engineering, Georgia Institute of Technology and Emory University, Atlanta, GA, USA 2 School of Biology, Georgia Institute of Technology, Atlanta, GA, USA 3 These authors contributed equally to this work. ABSTRACT Single-cell analysis has the potential to provide us with a host of new knowledge about biological systems, but it comes with the challenge of correctly interpreting the biological information. While emerging techniques have made it possible to measure inter-cellular variability at the transcriptome level, no consensus yet exists on the most appropriate method of data analysis of such single cell data. Methods for analysis of transcriptional data at the population level are well established but are not well suited to single cell analysis due to their dependence on population av- erages. In order to address this question, we have systematically tested combinations of methods for primary data analysis on single cell transcription data generated from two types of primary immune cells, neutrophils and T lymphocytes. Cells were obtained from healthy individuals, and single cell transcript expression data was obtained by a combination of single cell sorting and nanoscale quantitative real time PCR (qRT-PCR) for markers of cell type, intracellular signaling, and immune functionality. Gene expression analysis was focused on hierarchical clustering to determine the existence of cellular subgroups within the populations. Nine combi- nations of criteria for data exclusion and normalization were tested and evaluated. Bimodality in gene expression indicated the presence of cellular subgroups which were also revealed by data clustering. We observed evidence for two clearly defined cellular subtypes in the neutrophil populations and at least two in the T lymphocyte populations. When normalizing the data by different methods, we observed varying outcomes with corresponding interpretations of the biological characteristics of the cell populations. Normalization of the data by linear standardization taking into account technical effects such as plate effects, resulted in interpretations that most closely matched biological expectations. Single cell transcription profiling provides evidence of cellular subclasses in neutrophils and leukocytes that may be independent of traditional classifications based on cell surface markers. The choice of primary data analysis method had a substantial effect on the interpretation of the data. Adjustment for technical effects is critical to prevent misinterpretation of single cell transcript data. Subjects Bioinformatics, Immunology Keywords Single cell analysis, Data processing, Fluidigm, Gene expression How to cite this article Kippner et al. (2014), Single cell transcriptional analysis reveals novel innate immune cell types. PeerJ 2:e452; DOI 10.7717/peerj.452

Welcome message from author
This document is posted to help you gain knowledge. Please leave a comment to let me know what you think about it! Share it to your friends and learn new things together.
Transcript
Submitted 13 March 2014Accepted 4 June 2014Published 24 June 2014
Corresponding authorMelissa L. Kemp,[email protected]
Academic editorShawn Gomez
Additional Information andDeclarations can be found onpage 17
DOI 10.7717/peerj.452
Copyright2014 Kippner et al.
Distributed underCreative Commons CC-BY 4.0
OPEN ACCESS
Single cell transcriptional analysisreveals novel innate immune cell typesLinda E. Kippner1,3, Jinhee Kim2,3, Greg Gibson2 and Melissa L. Kemp1
1 The Wallace H. Coulter Department of Biomedical Engineering, Georgia Institute of Technologyand Emory University, Atlanta, GA, USA
2 School of Biology, Georgia Institute of Technology, Atlanta, GA, USA3 These authors contributed equally to this work.
ABSTRACTSingle-cell analysis has the potential to provide us with a host of new knowledgeabout biological systems, but it comes with the challenge of correctly interpretingthe biological information. While emerging techniques have made it possible tomeasure inter-cellular variability at the transcriptome level, no consensus yet existson the most appropriate method of data analysis of such single cell data. Methodsfor analysis of transcriptional data at the population level are well established butare not well suited to single cell analysis due to their dependence on population av-erages. In order to address this question, we have systematically tested combinationsof methods for primary data analysis on single cell transcription data generatedfrom two types of primary immune cells, neutrophils and T lymphocytes. Cellswere obtained from healthy individuals, and single cell transcript expression datawas obtained by a combination of single cell sorting and nanoscale quantitative realtime PCR (qRT-PCR) for markers of cell type, intracellular signaling, and immunefunctionality. Gene expression analysis was focused on hierarchical clustering todetermine the existence of cellular subgroups within the populations. Nine combi-nations of criteria for data exclusion and normalization were tested and evaluated.Bimodality in gene expression indicated the presence of cellular subgroups whichwere also revealed by data clustering. We observed evidence for two clearly definedcellular subtypes in the neutrophil populations and at least two in the T lymphocytepopulations. When normalizing the data by different methods, we observed varyingoutcomes with corresponding interpretations of the biological characteristics of thecell populations. Normalization of the data by linear standardization taking intoaccount technical effects such as plate effects, resulted in interpretations that mostclosely matched biological expectations. Single cell transcription profiling providesevidence of cellular subclasses in neutrophils and leukocytes that may be independentof traditional classifications based on cell surface markers. The choice of primary dataanalysis method had a substantial effect on the interpretation of the data. Adjustmentfor technical effects is critical to prevent misinterpretation of single cell transcriptdata.
Subjects Bioinformatics, ImmunologyKeywords Single cell analysis, Data processing, Fluidigm, Gene expression
How to cite this article Kippner et al. (2014), Single cell transcriptional analysis reveals novel innate immune cell types. PeerJ 2:e452;DOI 10.7717/peerj.452
INTRODUCTIONA growing body of evidence indicates that cell populations, even those comprised of
genetically identical cells, can be highly phenotypically heterogeneous (Enver et al., 2009;
Niepel, Spencer & Sorger, 2009; Spencer et al., 2009; Spencer & Sorger, 2011), and that these
differences between individual cells can have functional consequences (Feinerman et al.,
2010). Such non-genetic heterogeneity has been indicated in immune cell functionality
(Feinerman et al., 2010; Shalek et al., 2013) and has also been suggested as a driving force
of stem cell development and cell fate decisions, such as lineage choice in hematopoietic
stem cells (Chambers et al., 2007; Chang et al., 2008; Dietrich & Hiiragi, 2007; Kalmar
et al., 2009; Kobayashi et al., 2009; Singh et al., 2007; Stockholm et al., 2007). Cellular
heterogeneity is also an underlying source of the development of phenotypically different
subpopulations due to individual cell responses to changes in microenvironment within
genetically identical populations (Neildez-Nguyen et al., 2008). Such functional subgroups
can also have substantial pharmacological consequences, notably with regards to cancer
treatment, where partial drug resistance in tumor cell populations poses a significant
problem (Cohen et al., 2008; Gascoigne & Taylor, 2008; Niepel, Spencer & Sorger, 2009; Orth
et al., 2008; Sharma et al., 2010; Shi, Orth & Mitchison, 2008). For example, non-genetic
variations in response to pro-apoptotic stimuli have been found across several cell lines and
stimuli, resulting in phenotypically different subgroups even within clonal cell populations
(Cohen et al., 2008; Gascoigne & Taylor, 2008; Geva-Zatorsky et al., 2006; Huang, Mitchison
& Shi, 2010; Orth et al., 2008; Sharma et al., 2010; Shi, Orth & Mitchison, 2008; Spencer et
al., 2009). In light of this evidence, it is apparent that single cell resolution is needed in
order to achieve systems level understanding of functionality.
It is becoming evident that established methods, whereby averaging population
data essentially assumes that all cells within a population are equivalent, are vastly
oversimplifying cell functionality and obscuring the presence of cellular subtypes (Sachs
et al., 2005); however, a more detailed analysis has been hindered by technical limitations.
Previously, transcription analysis has been constrained to population averages, due to the
inability to quantify single cell levels of mRNA with existing techniques, such as such
as northern blotting or classical qRT-PCR (Flatz et al., 2011; Kalisky & Quake, 2011;
Kurimoto et al., 2007; Shi et al., 2011; White et al., 2011). Major technical advances in
single cell measurement systems have now enabled the investigation of such cell-level
information (Huang et al., 2014; Janes et al., 2010; Morris, Singh & Eberwine, 2011; Rajan et
al., 2011; Wang & Janes, 2013; Zhang et al., 2011). These advances include high-throughput
nanoscale real time PCR, which allows for mapping of transcriptional profiles by highly
parallelized assays enabled by microfluidics.
Standard methods for processing qRT-PCR data are well established; however these
methods are based on population averaged data and it cannot be taken for granted that the
same approaches are optimal for single cell data. Indeed, single cell gene transcripts have
been shown to follow log normal distribution curves (Bengtsson et al., 2005); thus, mean
population averages are heavily influenced by a few cells showing relatively high expression
levels. As single cell data is inherently noisy, this must be taken into account when choosing
Kippner et al. (2014), PeerJ, DOI 10.7717/peerj.452 2/21
analysis methods. For example, housekeeping genes show considerable variability of
expression at the single cell level such that standard methods of data normalization
based on such genes should not be used (McDavid et al., 2013). In addition, single cell
measurements exhibit noise due to technical variability and this must ideally be accounted
for without losing variability due to biological functionality, which is often at comparable
levels (Brennecke et al., 2013). A particularly important consideration is whether the
complete absence of signal is due to lack of expression or to stochastic technical failure.
All analytical approaches make assumptions regarding this issue that could have a major
impact on the conclusions derived from different modes of analysis (McDavid et al., 2013).
The biological motivation for the current study was to assess gene expression variability
among single leukocytes, and whether the prevalence of functional sub-types (as defined
by gene expression) varies among individuals. Neutrophils and T lymphocytes were
selected as representatives of the innate and adaptive branches of the immune system,
respectively. Recent studies have revealed a close correlation of functional phenotype to
transcriptional profile (Dalerba et al., 2011; Hoshida et al., 2008; Mucida et al., 2013), and
we hypothesized that our results would yield immune cell subclasses separated not only
by the traditional surface markers, but also by intracellular signaling components, as well
as other functional markers. As bimodality in expression of individual transcripts can be
an indicator of functional heterogeneity (Shalek et al., 2013), we further asked whether
cellular subclasses were defined by shared bimodality of multiple transcripts between cells.
To that end, we performed gene expression pattern analysis and hierarchical clustering of
our cell populations. We found that genes exhibiting bimodal distribution patterns were
preferentially assigned to the same cell clusters in our data sets.
In overcoming the technical challenges of analyzing single cell data, we found that the
decisions made in data processing can have dramatic consequences for the interpretation
of cellular subpopulations. We systematically explore and recommend approaches that can
be used in order to consistently analyze multiple single cells from multiple donor individ-
uals across multiple genes. Nine alternate methods of data exclusion and normalization
are considered, and their effect on secondary data analyses, such as hierarchical clustering,
is assessed. Our results show that analysis and correct interpretation of single cell gene
expression data is dependent on the method chosen for primary data analysis, specifically
on the method chosen for data normalization.
MATERIALS & METHODSA schematic diagram of the workflow for the experiment as well as the data analyses
described below is depicted in Fig. 1.
Primary cell extraction and single-cell sortingNeutrophils and T lymphocytes were extracted from 5 ml whole blood from 6 healthy
donors and isolated based on phenotype by negative selection using magnetic beads
(EasySep neutrophil extraction kit, Stem Cell Technologies, or Dynabeads untouched
T cells, Life Technologies). One donor’s neutrophil count was too low for further
processing, therefore all results presented for neutrophils consist of n = 5. Negative
Kippner et al. (2014), PeerJ, DOI 10.7717/peerj.452 3/21
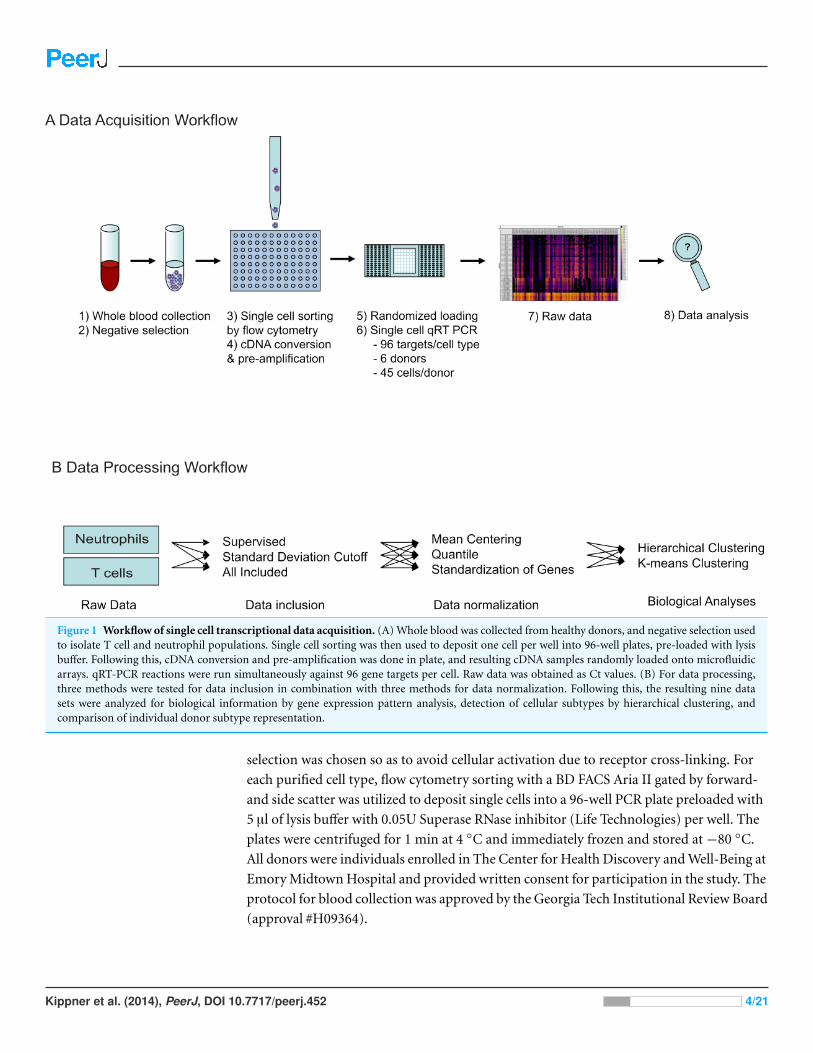
Figure 1 Workflow of single cell transcriptional data acquisition. (A) Whole blood was collected from healthy donors, and negative selection usedto isolate T cell and neutrophil populations. Single cell sorting was then used to deposit one cell per well into 96-well plates, pre-loaded with lysisbuffer. Following this, cDNA conversion and pre-amplification was done in plate, and resulting cDNA samples randomly loaded onto microfluidicarrays. qRT-PCR reactions were run simultaneously against 96 gene targets per cell. Raw data was obtained as Ct values. (B) For data processing,three methods were tested for data inclusion in combination with three methods for data normalization. Following this, the resulting nine datasets were analyzed for biological information by gene expression pattern analysis, detection of cellular subtypes by hierarchical clustering, andcomparison of individual donor subtype representation.
selection was chosen so as to avoid cellular activation due to receptor cross-linking. For
each purified cell type, flow cytometry sorting with a BD FACS Aria II gated by forward-
and side scatter was utilized to deposit single cells into a 96-well PCR plate preloaded with
5 µl of lysis buffer with 0.05U Superase RNase inhibitor (Life Technologies) per well. The
plates were centrifuged for 1 min at 4 ◦C and immediately frozen and stored at −80 ◦C.
All donors were individuals enrolled in The Center for Health Discovery and Well-Being at
Emory Midtown Hospital and provided written consent for participation in the study. The
protocol for blood collection was approved by the Georgia Tech Institutional Review Board
(approval #H09364).
Kippner et al. (2014), PeerJ, DOI 10.7717/peerj.452 4/21
Single cell qRT-PCRThe cellular lysates were converted to cDNA and 96 target genes per cell type were pre-
amplified with a pool of 96 primer pairs targeting genes representing pattern recognition,
cell-type markers, intracellular signaling, transcription, and immune response. For each
donor, amplified cDNA samples from 48 cells of each type were then randomized and
re-plated across 5 Fluidigm 96 × 96 microfluidic arrays, in order to avoid any plate effects
confounding the analysis of single donors. Gene-specific quantitative real-time PCR
reactions were performed using the Fluidigm BioMark I nano-scale platform. Negative
controls (without cDNA) and samples of 10 and 100 cells were used as controls for
single-cell loading. The mean difference in Ct value between 1 and 10 cells and between
10 and 100 cells per sample was determined in independent assays, providing a measurable
control for single cell loading of each sample.
To enable reproducible comparison of gene expression between qRT-PCR samples, data
is usually normalized with respect to data obtained for an internal or endogenous reference
gene. Housekeeping genes such as β-actin and glyceraldehyde 3-phosphate dehydrogenase
(GAPDH) are most often used because their expression levels are expected to remain con-
stant. Unfortunately, single cells exhibit large heterogeneity in housekeeping gene expres-
sion levels, and this method cannot be used as control for reproducible comparison of gene
expression between single cell samples (Liss et al., 2001; Suzuki, Higgins & Crawford, 2000).
Quality control and data exclusionIn order to control for single-cell sensitivity and consistency in sample loading, single
cell readings were compared to multi-cell controls. Mean expression levels from 10
randomly chosen single cell samples were calculated for each gene. The values obtained
were compared by regression to the mean expression levels for the corresponding genes
from the 10-cell samples, and R2 values above 0.65 were observed in all cases, indicating
good concordance between single cell and multicell measurements.
Raw data for gene expression were obtained as Ct values between 1 and 40, with lower
Ct value indicating higher abundance of gene-specific product. Missing data points were
coded as Ct values of 999; such values can either be due to null or very low expression of
the target gene in question or due to a failed reaction (truly missing data). Single missing
measures may indicate technical failures, but consistent absence of a similar set of lowly
expressed transcripts is more likely to imply coordinated loss of expression. Downstream
methods differ largely with respect to how the missing data is handled. Three different sets
of criteria were used for data exclusion for each of the two (neutrophil and T lymphocyte)
data sets.
(A) Supervised Data Exclusion. For the neutrophil data set, an empirical cutoff was set
to transcripts present in at least 70% of cells, and subsequently to cell samples expressing
at least 70% of these most uniformly expressed genes. We reasoned that the absence of
the same set of genes in a common set of cells would imply true absence of expression,
and used hierarchical clustering to provide a preliminary indication of such clusters of
Kippner et al. (2014), PeerJ, DOI 10.7717/peerj.452 5/21
non-expressed genes. 23 such co-regulated low-abundance genes were identified, for which
missing values were re-assigned a Ct value of 40 (the maximum number of cycles). Subse-
quently, for 36 genes, sporadic missing data was assumed to represent technical error and
these values were reassigned to the average Ct for the gene in question in the data set. 34
genes and 18 cells were excluded in their entirety. Expression was evaluated for 59 genes in
202 cells. Because the T lymphocyte data set did not contain a natural cutoff for transcript
presence, this method of analysis was not implemented for the T lymphocyte data.
(B) Data exclusion based on median standard deviation cutoff. All missing data values
were initially set to Ct 40, and the mean Ct and number of missing data points were
calculated for all genes. The second and third highest expressed genes in the data set were
selected and their mean Ct and standard deviation calculated. (The highest expressed gene
in both the neutrophil and T lymphocyte data set were treated as outliers and ignored
for the purposes of calculating mean Ct, due to expression levels far higher than all other
genes). Any gene whose average expression was within a cutoff of three standard deviations
of the mean Ct value for the two chosen genes was included. All cells expressing less than
half of these genes were then excluded. A plot of the maximum Ct across all cells for
all 96 genes in the neutrophil data set showed a bimodal distribution of maximum Ct
values, with a second peak starting at Ct 37 that corresponds to cells deemed not to express
the target gene. The limit of detection (LOD) was thus set to Ct 37 for neutrophils, and
the LOD Ct was set to 38 for T lymphocytes by the same methodology. All data values
above LOD Ct, including Ct 999, were replaced with 37, and the LOD Ct value was then
subtracted from all other Ct values, according to the Log2EX method (Log2EX = LOD
Ct–Ct (Abdel-Rahman et al., 2008)). Consequently, the adjusted expression measure
for this method is inverted and ranges from 0 to LOD Ct, with more highly expressed
transcripts having higher values, more in line with intuition and with microarray or
RNA-Seq data analysis. For the T cell data set, Ct values above LOD were interpreted
and analyzed in two alternate ways; either as representing no expression of the target gene,
with Ct values set to 0 or, alternatively, as missing data points due to technical error, with
missing values replaced with average Ct for the gene (analogous to the Supervised data
analysis method for neutrophils). Subsequently, entire cells were excluded, if the two gene
targets with highest expression in our data set were more than three standard deviation
units lower than the median. Additionally, any genes that were not expressed in any cell
sample were excluded from the data set. For the T lymphocyte data set, 2 genes that were
only expressed in one cell were also excluded from analysis. This resulted in the exclusion
of 12 neutrophils and 31 genes in the neutrophil data set, and 7 T lymphocytes and 63
genes in the T lymphocyte data set. Expression was evaluated for 62 genes in 208 cells in the
neutrophil data set and just 29 genes in 244 cells in the T lymphocyte data set.
(C) Inclusion of all data points. All data points were initially included in analysis, with
the exception of genes not expressed in any of the control samples (cDNA, tRNA, 10-cell
samples). This excluded 12 genes from analysis in the neutrophil data set and 13 in the
lymphocyte data set. In addition, any transcripts missing from all samples in an array
were excluded. This excluded 3 genes in the neutrophil set, for a total of 15 excluded
Kippner et al. (2014), PeerJ, DOI 10.7717/peerj.452 6/21
genes. No cells were excluded. LOD Ct was subtracted according to the Log2EX method as
described above. Expression was evaluated for 81 genes in 220 cells for the neutrophil data
set and 85 genes in 247 cells for the T lymphocyte data set.
Data normalizationThree different sets of criteria were used for data normalization for each of the data sets
generated from the three methods for data exclusion.
(1) Mean centering. The mean Ct value for each cell was calculated and subtracted from
each data point for the same cell. This approach removes the dependence of magnitudes,
allowing for easier visualization and comparison of relative differences in expression levels.
(2) Quantile normalization. Gene expression data for each cell was re-ordered by raw Ct
value, and mean Ct values for each cell were calculated. The original data was then replaced
by the average quantile, such that the highest value was replaced by the mean of the highest
values, the second highest value by the mean of the second highest values, and so on. This
method of rank-order analysis eliminates cell-to-cell differences in data density, by making
the data distributions identical.
(3) Standardization of the genes. Gene expression data were mean-centered for each
cell, and then the values for each gene were standardized (converted to z-scores) by
mean-centering and dividing by the standard deviation. Residuals from an ANOVA with
Plate as the main effect were extracted. This method adjusts the distribution only of targets
whose expression differs among plates. A further centering of residual expression values to
a mean of zero for each cell ensures that no cells have artificially low or high expression of
all genes.
Analysis of gene expression patternsThe single cell transcript abundance distribution for each gene was determined using
SAS JMP Pro 10 (Cary, NC). For each gene, several models, including Normal, Gamma,
Johnson Su, Johnson SI, Lognormal, and Weibull, were tested in order to find the
model best fitting the data. Modality was assessed for the two best fitting models by
Akaike information criteria (AIC) score and was further verified by calculating deltaAIC,
comparing scores of bimodality, trimodality and unimodality, as well as visual observation.
Genes exhibiting bimodality were tracked and cluster membership was determined in
the raw data set as well as after data exclusion and normalization methods deemed
most suitable, using the criteria above, namely exclusion by missing data cutoff and
normalization by standardization of the genes. In addition, the number of cells included
in each cluster was determined for each donor. Known gene product functionality was
obtained from three data bases: ToppFun (Chen et al., 2009), DAVID v6.7 (Huang da,
Sherman & Lempicki, 2009a; Huang da, Sherman & Lempicki, 2009b), and KEGG Pathway
(Nakao et al., 1999).
Analysis of donor-to-donor variabilityFor each donor, the cell count was determined for each of the cell clusters defined within
the population across all donors. Following this, the observed frequencies were compared
Kippner et al. (2014), PeerJ, DOI 10.7717/peerj.452 7/21
to expected frequency by Chi-square test comparison of the number of cells of each class in
each of the five individuals relative to the expectation assuming equivalent proportions.
Comparison of primary analysis methods by concordance of cellclustersCombining the methods for data exclusion and normalization generated nine alternate
sets of processed data for each of the two cell types. Each data set was organized by
hierarchical clustering as well as k-means clustering by cell, resulting in cell clusters
based on shared gene expression patterns. Concordance, defined as the percentage of cells
ascribed to the same cluster, was compared between all combinations of analysis methods
for both methods of clustering. For hierarchical clustering, data was clustered using
Ward’s minimum variance method (Ward, 1963), which minimizes the total within-cluster
variance using the total within-cluster sum of squares, under the assumption that distances
between individual objects are proportional to Euclidean distance. The k-means method of
clustering aims to sort data into a pre-defined number of clusters, k, with each data point
belonging to the cluster with the nearest mean (MacQueen, 1967). K-means clustering was
performed on all data sets with k values of 2 or 3 for both neutrophils and T lymphocytes.
The k values were evaluated using Cubic Clustering Criteria (CCC) with external cluster
validation. All computations were performed in SAS JMP-Genomics v5.0 (Cary, NC).
RESULTSGene expression pattern analysisGene expression analysis of the raw neutrophil data revealed the existence of different
expression patterns for genes, such as unimodal distribution of expression (Fig. 2A),
bimodal distribution with or without the existence of low expressors (Ct35–Ct39) (Figs.
2B and 2C), and trimodal distribution (Fig. 2D). The existence of non-expressing cells
poses the problem of how to define these data points. One approach is to assign all such
values the maximum Ct of 40, but this assumes that these data represent true missing
expression; they could also result from technical errors due to failed PCR reactions. If the
latter is the case, apparent bimodality with on/off expression patterns would in reality
represent unimodal distribution with missing data points being technical artifacts instead
of biologically relevant information. An alternative approach for addressing this issue is
to look at patterns of missing data within the sets. If missing data points from the same
genes tend to correlate within the cells, the cause is likely to be biological, suggesting that
the populations contain cellular subgroups. In order to determine whether the existence
of genes with bimodal expression patterns signaled the existence of cellular subclasses,
the data was clustered based on shared gene expression patterns. Clustering showed that
for neutrophils, bimodal genes exhibiting on/off pattern tended to be off in the same
cells, although they clustered together with unimodal genes implying that the differential
expression between cell types is not restricted to bimodality (Fig. 3A). Another potential
cause for missing data points is low initial concentration of RNA in the sample, owing
Kippner et al. (2014), PeerJ, DOI 10.7717/peerj.452 8/21
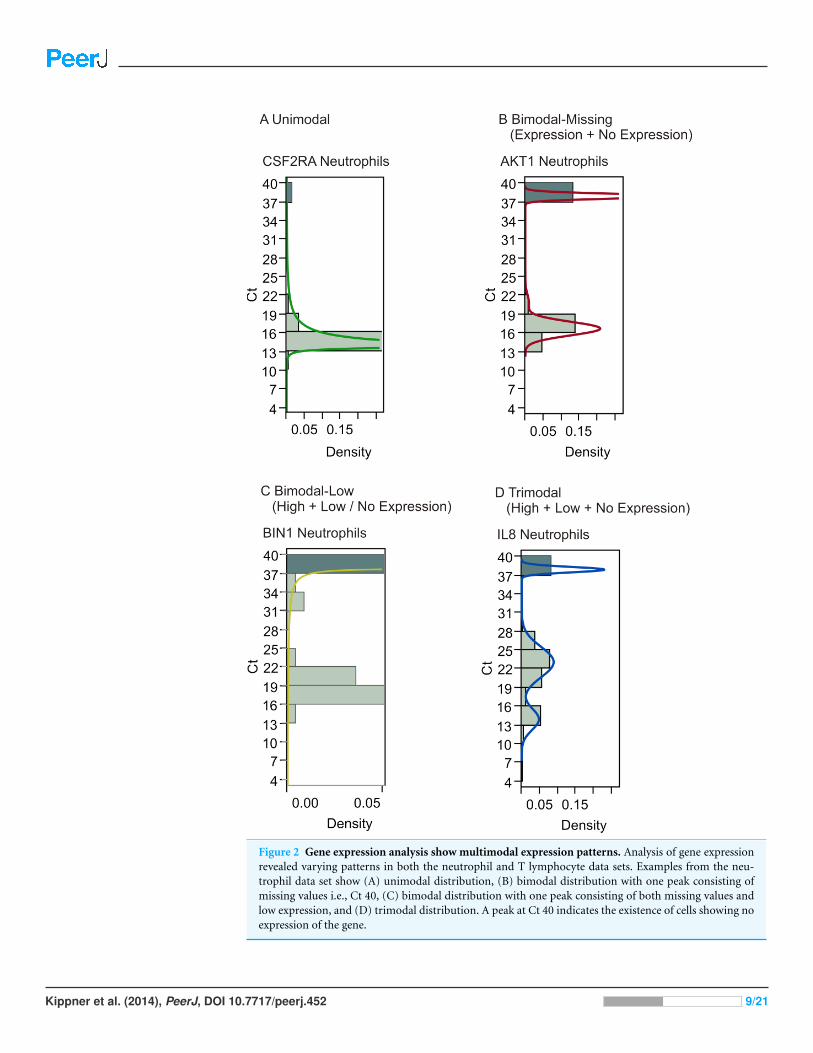
Figure 2 Gene expression analysis show multimodal expression patterns. Analysis of gene expressionrevealed varying patterns in both the neutrophil and T lymphocyte data sets. Examples from the neu-trophil data set show (A) unimodal distribution, (B) bimodal distribution with one peak consisting ofmissing values i.e., Ct 40, (C) bimodal distribution with one peak consisting of both missing values andlow expression, and (D) trimodal distribution. A peak at Ct 40 indicates the existence of cells showing noexpression of the gene.
Kippner et al. (2014), PeerJ, DOI 10.7717/peerj.452 9/21
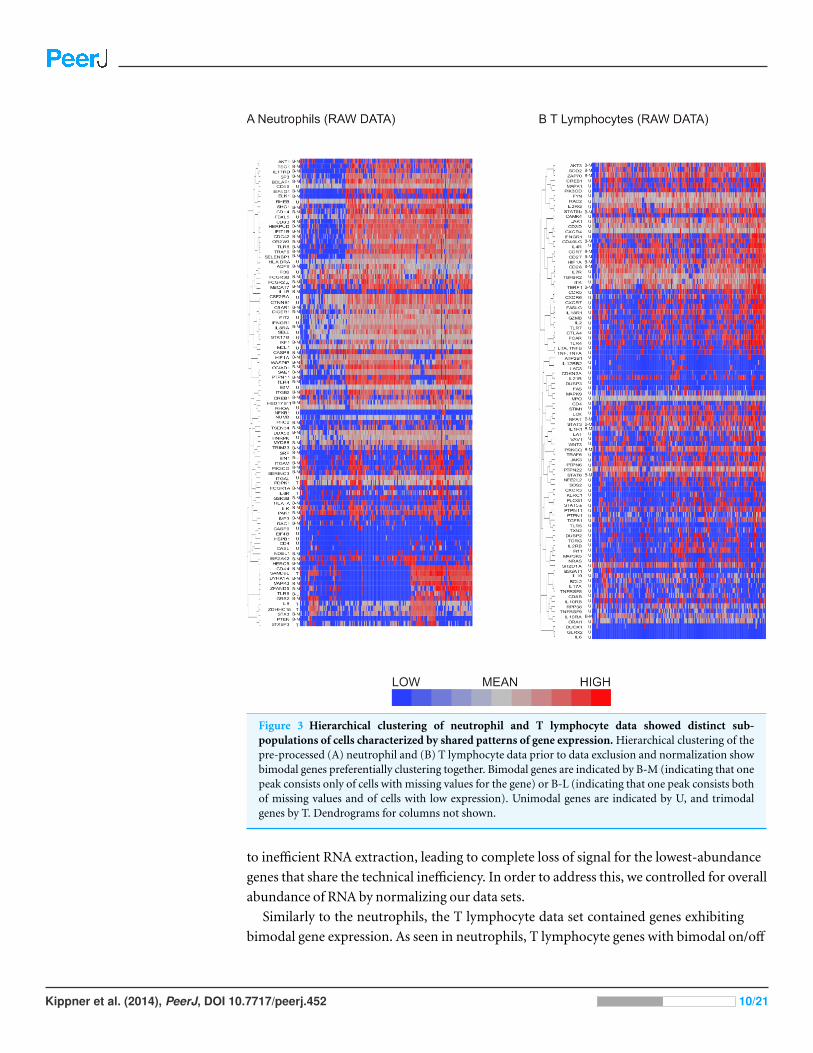
Figure 3 Hierarchical clustering of neutrophil and T lymphocyte data showed distinct sub-populations of cells characterized by shared patterns of gene expression. Hierarchical clustering of thepre-processed (A) neutrophil and (B) T lymphocyte data prior to data exclusion and normalization showbimodal genes preferentially clustering together. Bimodal genes are indicated by B-M (indicating that onepeak consists only of cells with missing values for the gene) or B-L (indicating that one peak consists bothof missing values and of cells with low expression). Unimodal genes are indicated by U, and trimodalgenes by T. Dendrograms for columns not shown.
to inefficient RNA extraction, leading to complete loss of signal for the lowest-abundance
genes that share the technical inefficiency. In order to address this, we controlled for overall
abundance of RNA by normalizing our data sets.
Similarly to the neutrophils, the T lymphocyte data set contained genes exhibiting
bimodal gene expression. As seen in neutrophils, T lymphocyte genes with bimodal on/off
Kippner et al. (2014), PeerJ, DOI 10.7717/peerj.452 10/21
expression patterns also tended to be interspersed with unimodally expressed transcripts
(Fig. 3B).
Detection of neutrophil subtypesHierarchical clustering was applied to the datasets using Ward’s method, which has
been shown to discriminate clusters efficiently on gene expression datasets (Ferreira &
Hitchcock, 2009; Ma & Zhang, 2012). Figure 4 shows the results of hierarchical clustering
with nine different methods combining the three methods for data exclusion and three
methods for data normalization. The color coding (purple, green and orange) shows
the degree of concordance of clustering relative to the method based on supervised
data removal with mean centering (top left). Employing exclusion with any of the three
methods, followed by either mean centering or quantile normalization, three clusters of
neutrophils were observed consistently, with notable separation of the orange, and most
of the green, clusters from the purple one. Concordance, defined as the percentage of
cells assigned to the same cluster, ranged from 75% to 100%, prima facie supporting the
presence of three cell types in our samples.
However, when a Fluidigm array plate effect was fit to the standardized gene expression
z-scores, only two major clusters were observed regardless of the data exclusion method
(Fig. 4G), and concordance of the two-way classification of orange versus green/purple
cells was perfect. This analysis implies that a plate effect caused the splitting of the large
purple/green clusters observed with the mean-centering and quantile normalization
methods. That is to say, very low abundance gene expression led to loss of signal on one
of the plates, generating an artificial signature of co-regulation of some cells. However,
the orange cluster remains robustly detected by all methods. We conclude that there are
two main clusters of cell types in neutrophils. There is also a hint of a sub-type within the
orange cells defined by differential expression of a half-dozen genes, but a larger sample
will be required to validate this inference.
Hierarchical clustering verified the existence of cellular subgroupsHaving compared methods for data exclusion and normalization, we opted to focus on the
analysis method using a two standard deviation cutoff for exclusion with normalization by
standardization of the genes (Fig. 4H). Hierarchical clustering revealed 2 major subclasses
in both neutrophils (Fig. 5A) and T lymphocytes (Fig. 5B). The more clear definition of
neutrophil subgroups, as compared to T lymphocytes, could be due to different levels of
bimodality in the gene sets, such that more bimodality in the neutrophil data set gives
rise to more distinct cellular subclasses. Alternatively, the two data sets could incorporate
the same level of overall bimodality but differ in the level of co-variation of bimodally
expressed genes. Since the expression of many genes on the T-cell array was too low to
detect consistently, the analysis is based on fewer genes which also reduces the power to
detect clusters.
More refined clustering of the T-cell data was also heavily impacted by the decision
as to how to handle missing data. Including genes in the analysis according to the
Kippner et al. (2014), PeerJ, DOI 10.7717/peerj.452 11/21
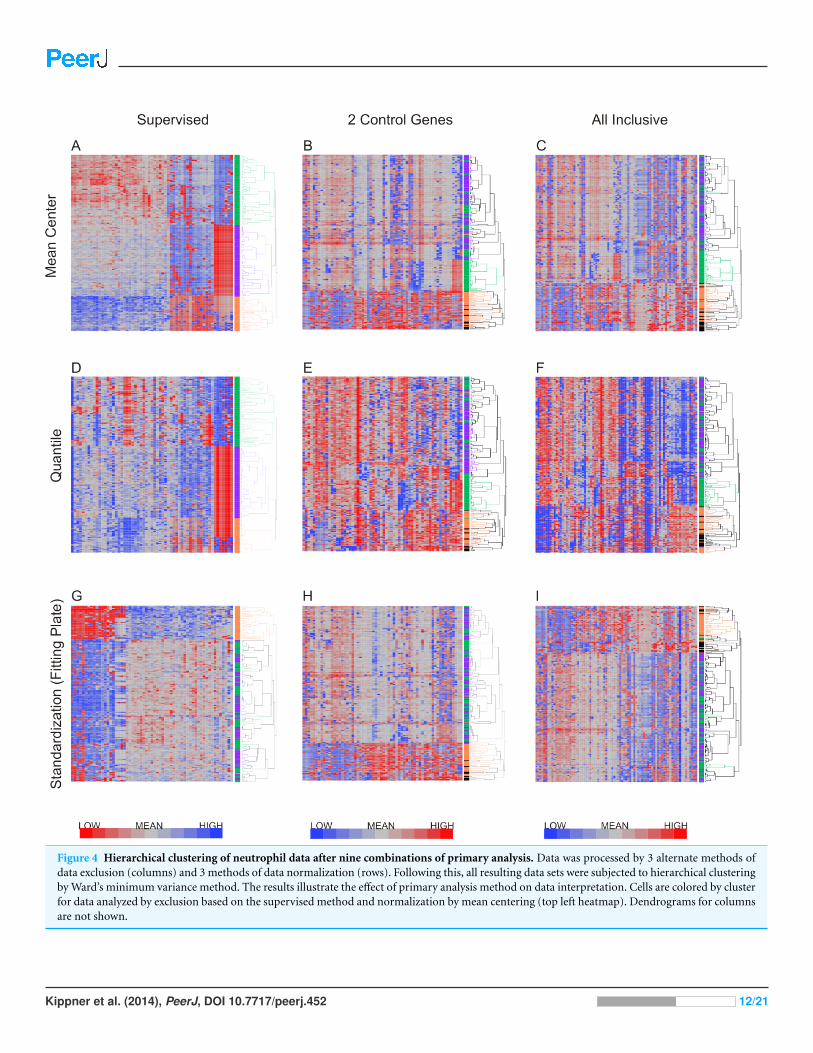
Figure 4 Hierarchical clustering of neutrophil data after nine combinations of primary analysis. Data was processed by 3 alternate methods ofdata exclusion (columns) and 3 methods of data normalization (rows). Following this, all resulting data sets were subjected to hierarchical clusteringby Ward’s minimum variance method. The results illustrate the effect of primary analysis method on data interpretation. Cells are colored by clusterfor data analyzed by exclusion based on the supervised method and normalization by mean centering (top left heatmap). Dendrograms for columnsare not shown.
Kippner et al. (2014), PeerJ, DOI 10.7717/peerj.452 12/21
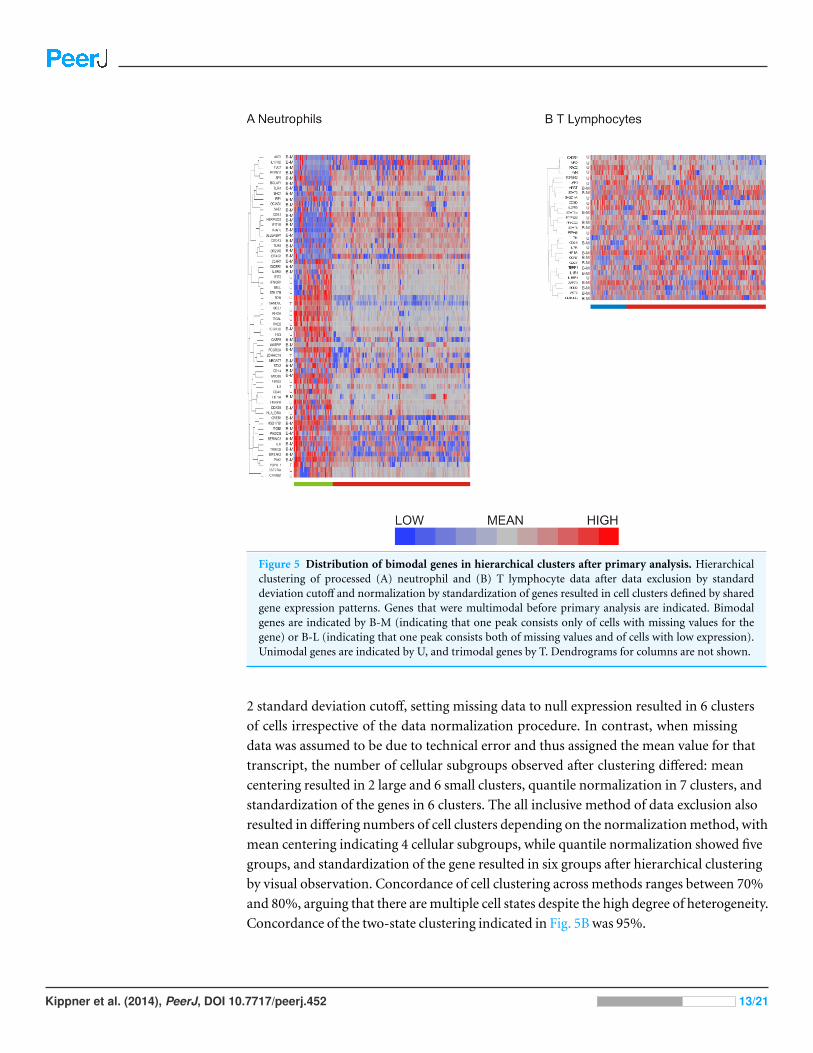
Figure 5 Distribution of bimodal genes in hierarchical clusters after primary analysis. Hierarchicalclustering of processed (A) neutrophil and (B) T lymphocyte data after data exclusion by standarddeviation cutoff and normalization by standardization of genes resulted in cell clusters defined by sharedgene expression patterns. Genes that were multimodal before primary analysis are indicated. Bimodalgenes are indicated by B-M (indicating that one peak consists only of cells with missing values for thegene) or B-L (indicating that one peak consists both of missing values and of cells with low expression).Unimodal genes are indicated by U, and trimodal genes by T. Dendrograms for columns are not shown.
2 standard deviation cutoff, setting missing data to null expression resulted in 6 clusters
of cells irrespective of the data normalization procedure. In contrast, when missing
data was assumed to be due to technical error and thus assigned the mean value for that
transcript, the number of cellular subgroups observed after clustering differed: mean
centering resulted in 2 large and 6 small clusters, quantile normalization in 7 clusters, and
standardization of the genes in 6 clusters. The all inclusive method of data exclusion also
resulted in differing numbers of cell clusters depending on the normalization method, with
mean centering indicating 4 cellular subgroups, while quantile normalization showed five
groups, and standardization of the gene resulted in six groups after hierarchical clustering
by visual observation. Concordance of cell clustering across methods ranges between 70%
and 80%, arguing that there are multiple cell states despite the high degree of heterogeneity.
Concordance of the two-state clustering indicated in Fig. 5B was 95%.
Kippner et al. (2014), PeerJ, DOI 10.7717/peerj.452 13/21
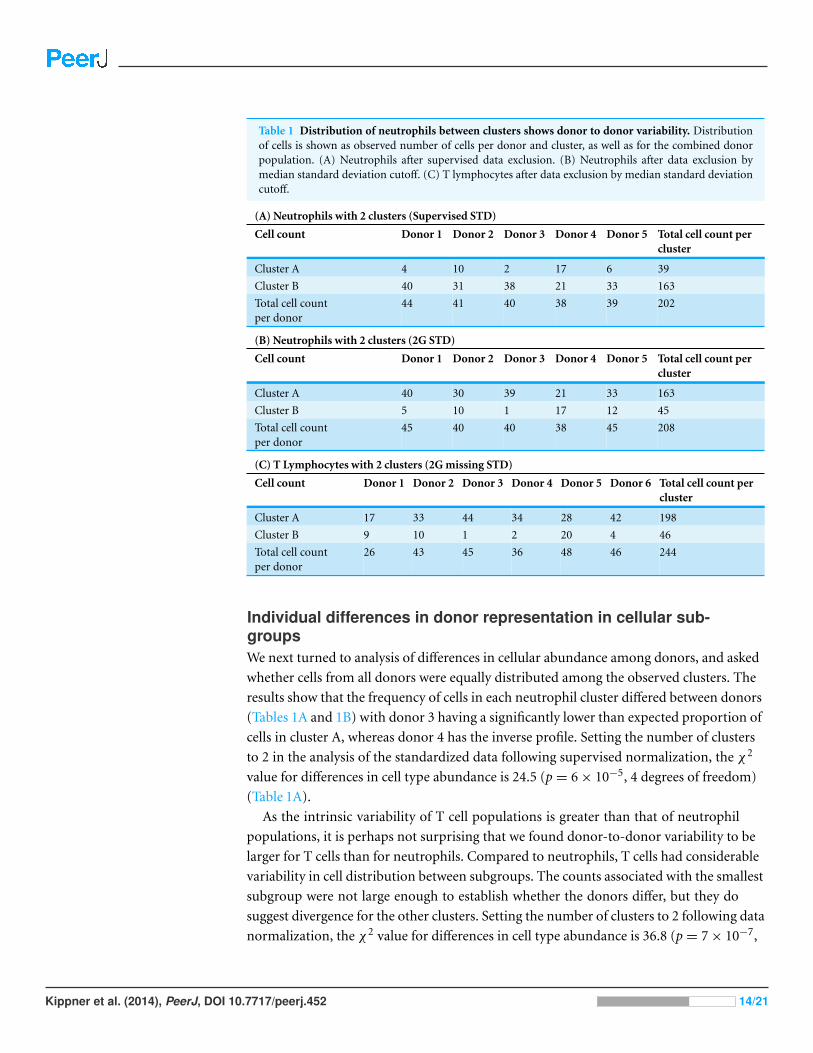
Table 1 Distribution of neutrophils between clusters shows donor to donor variability. Distributionof cells is shown as observed number of cells per donor and cluster, as well as for the combined donorpopulation. (A) Neutrophils after supervised data exclusion. (B) Neutrophils after data exclusion bymedian standard deviation cutoff. (C) T lymphocytes after data exclusion by median standard deviationcutoff.
(A) Neutrophils with 2 clusters (Supervised STD)
Cell count Donor 1 Donor 2 Donor 3 Donor 4 Donor 5 Total cell count percluster
Cluster A 4 10 2 17 6 39
Cluster B 40 31 38 21 33 163
Total cell countper donor
44 41 40 38 39 202
(B) Neutrophils with 2 clusters (2G STD)
Cell count Donor 1 Donor 2 Donor 3 Donor 4 Donor 5 Total cell count percluster
Cluster A 40 30 39 21 33 163
Cluster B 5 10 1 17 12 45
Total cell countper donor
45 40 40 38 45 208
(C) T Lymphocytes with 2 clusters (2G missing STD)
Cell count Donor 1 Donor 2 Donor 3 Donor 4 Donor 5 Donor 6 Total cell count percluster
Cluster A 17 33 44 34 28 42 198
Cluster B 9 10 1 2 20 4 46
Total cell countper donor
26 43 45 36 48 46 244
Individual differences in donor representation in cellular sub-groupsWe next turned to analysis of differences in cellular abundance among donors, and asked
whether cells from all donors were equally distributed among the observed clusters. The
results show that the frequency of cells in each neutrophil cluster differed between donors
(Tables 1A and 1B) with donor 3 having a significantly lower than expected proportion of
cells in cluster A, whereas donor 4 has the inverse profile. Setting the number of clusters
to 2 in the analysis of the standardized data following supervised normalization, the χ2
value for differences in cell type abundance is 24.5 (p = 6 × 10⁻⁵, 4 degrees of freedom)
(Table 1A).
As the intrinsic variability of T cell populations is greater than that of neutrophil
populations, it is perhaps not surprising that we found donor-to-donor variability to be
larger for T cells than for neutrophils. Compared to neutrophils, T cells had considerable
variability in cell distribution between subgroups. The counts associated with the smallest
subgroup were not large enough to establish whether the donors differ, but they do
suggest divergence for the other clusters. Setting the number of clusters to 2 following data
normalization, the χ2 value for differences in cell type abundance is 36.8 (p = 7 × 10⁻⁷,
Kippner et al. (2014), PeerJ, DOI 10.7717/peerj.452 14/21
5 degrees of freedom) (Table 1C). Sampling of more cells in more donors will be required
to establish whether these differences correlate with physiological and immunological
attributes of the individuals.
DISCUSSIONTo determine whether variation in gene expression correlated with variation in cellular
phenotype, gene expression data for all genes were analyzed across all cells for expression
patterns, such as unimodality and bimodality. Patterns differing from the prevalent,
long-tailed, log-normal distribution may reflect active processes that contribute to cell–cell
variation and thus functional subclasses of cells (Dalerba et al., 2011). Bimodality, in
particular, can be expected in immune cell populations, due to the possibility that cells
within such a population may be in states of either pre- or post-activation, with the
changes in gene expression that this would entail. While bimodal behavior is a potentially
important feature of gene expression in a population and can reflect true differences
between subpopulations (Shalek et al., 2013), not all bimodal distributions are likely to
reflect biological reality in an unprocessed single-cell data set. The risk of excluding true
bimodality by setting the cutoff too low must be weighed against the risk of including
artificial bimodality by inclusion of all data points and thus more measurement-derived
noise. In addition, it is desirable to differentiate between bimodality due to high versus low
expression of a given gene and bimodality due to a gene being expressed or not expressed.
Finally, technical artifacts such as plate effects can also induce apparent bimodality if
expression of low-abundance transcripts drops out completely in one plate.
The occurrence of bimodality of gene expression in both neutrophils and T cells leads us
to conclude that the cell populations tested contain specific cellular sub-types. The results
show unambiguous evidence for two cellular subtypes in both the neutrophil and T-cell
populations, possibly with additional subtypes that will require larger datasets to validate.
The nature of the bimodal genes involved, however, hint at the functional nature of the
cellular subgroups. For example, the neutrophil cluster represented by low TLR4/8, high
PAK1, high ITGB2 (subunit of LFA-1) profiles would likely occur when extravasation and
cell motility is more essential than direct microbial phagocytosis.
Methods for analyzing population level data are well established; however these are
not optimal for single cell data due to the high variability of gene expression between
individual cells and the intrinsic noise in single cell data sets. Gene expression levels, even
of housekeeping genes, can differ 1000-fold between individual cells (Bengtsson et al.,
2005), and analysis of individual single-cell PCR calibration curves do not produce reliable
values (Liss et al., 2001). In order to overcome this issue, independent measurements by
alternative methods such as RNA FISH (Bajikar et al., 2014; Shalek et al., 2013; Wang,
Brugge & Janes, 2011), smFISH (Rahman & Zenklusen, 2013), or immunochemistry
(Dalerba et al., 2011) can be used to verify select targets; however, these do not allow for
easy verification across large target sets at the individual cell level. Comparison of the
outputs from the different methods of primary analysis tested illustrates the impact of
analysis method on subsequent interpretation of biologically relevant information such
Kippner et al. (2014), PeerJ, DOI 10.7717/peerj.452 15/21
as cellular subtypes within a population. Our recommendation is to use standardization
methods that allow for fitting of technical effects, such as the plate effect that generated
two sub-types in the mean-centering and quantile normalization strategies. Data exclusion
should be aware of the possibility that missing data reflects technical failure, but for the
most part it seems to be due to very low and possibly missing expression. Replacement of
missing data with average expression did not unduly impact our clustering at the 2-cell
type level, and does not appear to be justified.
Cluster analysis is a natural choice for interpretation of qRT-PCR data. We employed
two hierarchical clustering methods in order to quantitatively assess the robustness of our
primary data processing methods. The results obtained by both methods of clustering
were then compared, and the concordance between clusters, as defined by shared cluster
assignment for cells, showed that k-means and hierarchical clustering approaches influence
the conclusions but to a lesser extent than the data normalization strategy. The two
approaches disagreed as more sub-types were added to the analysis, but were in good
agreement at k = 2 cell types for both neutrophils and T-cells.
An additional question we addressed was whether or not the type of cell would have
an effect on the concordance, in other words, whether different cell types would require
different methods of data exclusion and normalization for optimized analysis outcome. It
should be noted that although the trends are similar in both cell types, neutrophils show
an overall lower heterogeneity than T cells. The observed higher stability of concordance
of neutrophil clusters when compared to T cell clusters is likely affected by these inherent
properties of neutrophil and T cell populations. It is thus important to consider not only
cluster robustness when choosing analysis methods, particularly when data represents a
heterogeneous population, such as the T lymphocyte population investigated here.
CONCLUSIONOur study shows that using single cell analysis we can potentially detect functional
subclasses not previously appreciated within immune cell populations. Bimodal patterns
of gene expression within the cell populations suggested cellular subclasses, and this was
confirmed by hierarchical clustering of cells. Emerging techniques enabling the study of
single cell transcription levels have made clear the need for insight into the appropriate
methods of analyzing the data generated. Our systematic testing of different methods of
single cell data analysis clearly illustrates the differences in subsequent interpretation of
the processed data. Importantly, our results highlight the necessity of using a method that
adjusts for any defined technical effects, and that failure to do this will affect the inference
of biological properties.
List of abbreviations
AIC Akaike information criterionCt Cycle thresholdk cluster countLOD Limit of DetectionqRT-PCR Quantitative Real-Time PCR
Kippner et al. (2014), PeerJ, DOI 10.7717/peerj.452 16/21
ACKNOWLEDGEMENTSThe authors wish to thank Dr Dalia Arafat for help and advice with qRT-PCR data
acquisition, Marisa Casola for assistance in sample acquisition, and The Center for Health
Discovery and Well-Being at Emory Midtown Hospital in Atlanta for donor samples.
ADDITIONAL INFORMATION AND DECLARATIONS
FundingFunding for this work was provided to GG and MLK by the Petit Institute of Bioengineer-
ing and Bioscience at Georgia Institute of Technology and NIH award DP2OD006483 to
MLK. The funders had no role in study design, data collection and analysis, decision to
publish, or preparation of the manuscript.
Grant DisclosuresThe following grant information was disclosed by the authors:
Petit Institute of Bioengineering and Bioscience at Georgia Institute of Technology.
NIH: DP2OD006483.
Competing InterestsThe authors declare they have no competing interests.
Author Contributions• Linda E. Kippner and Jinhee Kim conceived and designed the experiments, performed
the experiments, analyzed the data, wrote the paper, prepared figures and/or tables,
reviewed drafts of the paper.
• Greg Gibson and Melissa L. Kemp conceived and designed the experiments, analyzed the
data, contributed reagents/materials/analysis tools, wrote the paper, reviewed drafts of
the paper.
Human EthicsThe following information was supplied relating to ethical approvals (i.e., approving body
and any reference numbers):
Georgia Institute of Technology Institutional Review Board: H09364.
Supplemental InformationSupplemental information for this article can be found online at http://dx.doi.org/
10.7717/peerj.452.
REFERENCESAbdel-Rahman WM, Kalinina J, Shoman S, Eissa S, Ollikainen M, Elomaa O, Eliseenkova AV,
Butzow R, Mohammadi M, Peltomaki P. 2008. Somatic FGF9 mutations in colorectaland endometrial carcinomas associated with membranous beta-catenin. Human Mutation29:390–397 DOI 10.1002/humu.20653.
Kippner et al. (2014), PeerJ, DOI 10.7717/peerj.452 17/21
Bajikar SS, Fuchs C, Roller A, Theis FJ, Janes KA. 2014. Parameterizing cell-to-cell regulatoryheterogeneities via stochastic transcriptional profiles. Proceedings of the National Academy ofSciences of the United States of America 111:E626–E635 DOI 10.1073/pnas.1311647111.
Bengtsson M, Stahlberg A, Rorsman P, Kubista M. 2005. Gene expression profiling in single cellsfrom the pancreatic islets of Langerhans reveals lognormal distribution of mRNA levels. GenomeResearch 15:1388–1392 DOI 10.1101/gr.3820805.
Brennecke P, Anders S, Kim JK, Kolodziejczyk AA, Zhang X, Proserpio V, Baying B, Benes V,Teichmann SA, Marioni JC, Heisler MG. 2013. Accounting for technical noise in single-cellRNA-seq experiments. Nature Methods 10:1093–1095 DOI 10.1038/nmeth.2645.
Chambers I, Silva J, Colby D, Nichols J, Nijmeijer B, Robertson M, Vrana J, Jones K,Grotewold L, Smith A. 2007. Nanog safeguards pluripotency and mediates germlinedevelopment. Nature 450:1230–1234 DOI 10.1038/nature06403.
Chang HH, Hemberg M, Barahona M, Ingber DE, Huang S. 2008. Transcriptome-wide noisecontrols lineage choice in mammalian progenitor cells. Nature 453:544–547DOI 10.1038/nature06965.
Chen J, Bardes EE, Aronow BJ, Jegga AG. 2009. ToppGene Suite for gene list enrichment analysisand candidate gene prioritization. Nucleic Acids Research 37:W305–W311DOI 10.1093/nar/gkp427.
Cohen AA, Geva-Zatorsky N, Eden E, Frenkel-Morgenstern M, Issaeva I, Sigal A, Milo R,Cohen-Saidon C, Liron Y, Kam Z, Cohen L, Danon T, Perzov N, Alon U. 2008. Dynamicproteomics of individual cancer cells in response to a drug. Science 322:1511–1516DOI 10.1126/science.1160165.
Dalerba P, Kalisky T, Sahoo D, Rajendran PS, Rothenberg ME, Leyrat AA, Sim S, Okamoto J,Johnston DM, Qian D, Zabala M, Bueno J, Neff NF, Wang J, Shelton AA, Visser B,Hisamori S, Shimono Y, van de Wetering M, Clevers H, Clarke MF, Quake SR. 2011.Single-cell dissection of transcriptional heterogeneity in human colon tumors. NatureBiotechnology 29:1120–1127 DOI 10.1038/nbt.2038.
Dietrich JE, Hiiragi T. 2007. Stochastic patterning in the mouse pre-implantation embryo.Development 134:4219–4231 DOI 10.1242/dev.003798.
Enver T, Pera M, Peterson C, Andrews PW. 2009. Stem cell states, fates, and the rules of attraction.Cell Stem Cell 4:387–397 DOI 10.1016/j.stem.2009.04.011.
Feinerman O, Jentsch G, Tkach KE, Coward JW, Hathorn MM, Sneddon MW, Emonet T,Smith KA, Altan-Bonnet G. 2010. Single-cell quantification of IL-2 response by effector andregulatory T cells reveals critical plasticity in immune response. Molecular Systems Biology6:Article 437 DOI 10.1038/msb.2010.90.
Ferreira L, Hitchcock D. 2009. A comparison of hierarchical methods for clustering functionaldata. Communications in Statistics: Simulation and Computation 38:1925–1949DOI 10.1080/03610910903168603.
Flatz L, Roychoudhuri R, Honda M, Filali-Mouhim A, Goulet JP, Kettaf N, Lin M, Roederer M,Haddad EK, Sekaly RP, Nabel GJ. 2011. Single-cell gene-expression profiling revealsqualitatively distinct CD8 T cells elicited by different gene-based vaccines. Proceedings of theNational Academy of Sciences of the United States of America 108:5724–5729DOI 10.1073/pnas.1013084108.
Gascoigne KE, Taylor SS. 2008. Cancer cells display profound intra- and interline variationfollowing prolonged exposure to antimitotic drugs. Cancer Cell 14:111–122DOI 10.1016/j.ccr.2008.07.002.
Kippner et al. (2014), PeerJ, DOI 10.7717/peerj.452 18/21
Geva-Zatorsky N, Rosenfeld N, Itzkovitz S, Milo R, Sigal A, Dekel E, Yarnitzky T, Liron Y,Polak P, Lahav G, Alon U. 2006. Oscillations and variability in the p53 system. MolecularSystems Biology 2:Article 2006.0033 DOI 10.1038/msb4100068.
Hoshida Y, Villanueva A, Kobayashi M, Peix J, Chiang DY, Camargo A, Gupta S, Moore J,Wrobel MJ, Lerner J, Reich M, Chan JA, Glickman JN, Ikeda K, Hashimoto M, Watanabe G,Daidone MG, Roayaie S, Schwartz M, Thung S, Salvesen HB, Gabriel S, Mazzaferro V,Bruix J, Friedman SL, Kumada H, Llovet JM, Golub TR. 2008. Gene expression in fixed tissuesand outcome in hepatocellular carcinoma. New England Journal of Medicine 359:1995–2004DOI 10.1056/NEJMoa0804525.
Huang da W, Sherman BT, Lempicki RA. 2009a. Bioinformatics enrichment tools: paths towardthe comprehensive functional analysis of large gene lists. Nucleic Acids Research 37:1–13DOI 10.1093/nar/gkn923.
Huang da W, Sherman BT, Lempicki RA. 2009b. Systematic and integrative analysis of large genelists using DAVID bioinformatics resources. Nature Protocols 4:44–57DOI 10.1038/nprot.2008.211.
Huang H, Goto M, Tsunoda H, Sun L, Taniguchi K, Matsunaga H, Kambara H. 2014. Non-biasedand efficient global amplification of a single-cell cDNA library. Nucleic Acids Research 42:e12DOI 10.1093/nar/gkt965.
Huang HC, Mitchison TJ, Shi J. 2010. Stochastic competition between mechanisticallyindependent slippage and death pathways determines cell fate during mitotic arrest.PLoS ONE 5:e15724 DOI 10.1371/journal.pone.0015724.
Janes KA, Wang CC, Holmberg KJ, Cabral K, Brugge JS. 2010. Identifying single-cell molecularprograms by stochastic profiling. Nature Methods 7:311–317 DOI 10.1038/nmeth.1442.
Kalisky T, Quake SR. 2011. Single-cell genomics. Nature Methods 8:311–314DOI 10.1038/nmeth0411-311.
Kalmar T, Lim C, Hayward P, Munoz-Descalzo S, Nichols J, Garcia-Ojalvo J, Martinez Arias A.2009. Regulated fluctuations in nanog expression mediate cell fate decisions in embryonic stemcells. PLoS Biology 7:e1000149 DOI 10.1371/journal.pbio.1000149.
Kobayashi T, Mizuno H, Imayoshi I, Furusawa C, Shirahige K, Kageyama R. 2009. The cyclicgene Hes1 contributes to diverse differentiation responses of embryonic stem cells. Genes andDevelopment 23:1870–1875 DOI 10.1101/gad.1823109.
Kurimoto K, Yabuta Y, Ohinata Y, Saitou M. 2007. Global single-cell cDNA amplification toprovide a template for representative high-density oligonucleotide microarray analysis. NatureProtocols 2:739–752 DOI 10.1038/nprot.2007.79.
Liss B, Franz O, Sewing S, Bruns R, Neuhoff H, Roeper J. 2001. Tuning pacemaker frequencyof individual dopaminergic neurons by Kv4.3L and KChip3.1 transcription. EMBO Journal20:5715–5724 DOI 10.1093/emboj/20.20.5715.
Ma N, Zhang ZG. 2012. Evaluation of clustering algorithms for gene expression data using geneontology annotations. Chinese Medical Journal (English Edition) 125:3048–3052.
MacQueen JC. 1967. Some methods for classification and analysis of multivariate observations.In: Fifth Berkeley symposium on mathematical statistics and probability. Berkeley: StatisticalLaboratory of the University of California, 281–297.
McDavid A, Finak G, Chattopadyay PK, Dominguez M, Lamoreaux L, Ma SS, Roederer M,Gottardo R. 2013. Data exploration, quality control and testing in single-cell qPCR-basedgene expression experiments. Bioinformatics 29:461–467 DOI 10.1093/bioinformatics/bts714.
Kippner et al. (2014), PeerJ, DOI 10.7717/peerj.452 19/21
Morris J, Singh JM, Eberwine JH. 2011. Transcriptome analysis of single cells. Journal ofVisualized Experiments 50:Article 2634 DOI 10.3791/2634.
Mucida D, Husain MM, Muroi S, van Wijk F, Shinnakasu R, Naoe Y, Reis BS, Huang Y,Lambolez F, Docherty M, Attinger A, Shui JW, Kim G, Lena CJ, Sakaguchi S, Miyamoto C,Wang P, Atarashi K, Park Y, Nakayama T, Honda K, Ellmeier W, Kronenberg M, Taniuchi I,Cheroutre H. 2013. Transcriptional reprogramming of mature CD4(+) helper T cells generatesdistinct MHC class II-restricted cytotoxic T lymphocytes. Nature Immunology 14:281–289DOI 10.1038/ni.2523.
Nakao M, Bono H, Kawashima S, Kamiya T, Sato K, Goto S, Kanehisa M. 1999. Genome-scalegene expression analysis and pathway reconstruction in KEGG. Genome Informatics. Workshopon Genome Informatics 10:94–103.
Neildez-Nguyen TM, Parisot A, Vignal C, Rameau P, Stockholm D, Picot J, Allo V, Le Bec C,Laplace C, Paldi A. 2008. Epigenetic gene expression noise and phenotypic diversification ofclonal cell populations. Differentiation 76:33–40.
Niepel M, Spencer SL, Sorger PK. 2009. Non-genetic cell-to-cell variability and the consequencesfor pharmacology. Current Opinion in Chemical Biology 13:556–561DOI 10.1016/j.cbpa.2009.09.015.
Orth JD, Tang Y, Shi J, Loy CT, Amendt C, Wilm C, Zenke FT, Mitchison TJ. 2008. Quantitativelive imaging of cancer and normal cells treated with Kinesin-5 inhibitors indicates significantdifferences in phenotypic responses and cell fate. Molecular Cancer Therapeutics 7:3480–3489DOI 10.1158/1535-7163.MCT-08-0684.
Rahman S, Zenklusen D. 2013. Single-molecule resolution fluorescent in situ hybridization(smFISH) in the yeast S. cerevisiae. Methods in Molecular Biology 1042:33–46.
Rajan S, Djambazian H, Dang HC, Sladek R, Hudson TJ. 2011. The living microarray: ahigh-throughput platform for measuring transcription dynamics in single cells. BMC Genomics12:115 DOI 10.1186/1471-2164-12-115.
Sachs K, Perez O, Pe’er D, Lauffenburger DA, Nolan GP. 2005. Causal protein-signaling networksderived from multiparameter single-cell data. Science 308:523–529DOI 10.1126/science.1105809.
Shalek AK, Satija R, Adiconis X, Gertner RS, Gaublomme JT, Raychowdhury R, Schwartz S,Yosef N, Malboeuf C, Lu D, Trombetta JJ, Gennert D, Gnirke A, Goren A, Hacohen N,Levin JZ, Park H, Regev A. 2013. Single-cell transcriptomics reveals bimodality in expressionand splicing in immune cells. Nature 498:236–240 DOI 10.1038/nature12172.
Sharma SV, Lee DY, Li B, Quinlan MP, Takahashi F, Maheswaran S, McDermott U, Azizian N,Zou L, Fischbach MA, Wong KK, Brandstetter K, Wittner B, Ramaswamy S, Classon M,Settleman J. 2010. A chromatin-mediated reversible drug-tolerant state in cancer cellsubpopulations. Cell 141:69–80 DOI 10.1016/j.cell.2010.02.027.
Shi X, Lin LI, Chen SY, Chao SH, Zhang W, Meldrum DR. 2011. Real-time PCR of singlebacterial cells on an array of adhering droplets. Lab on a Chip 11:2276–2281DOI 10.1039/c1lc20207c.
Shi J, Orth JD, Mitchison T. 2008. Cell type variation in responses to antimitotic drugs that targetmicrotubules and kinesin-5. Cancer Research 68:3269–3276DOI 10.1158/0008-5472.CAN-07-6699.
Singh AM, Hamazaki T, Hankowski KE, Terada N. 2007. A heterogeneous expression pattern forNanog in embryonic stem cells. Stem Cells 25:2534–2542 DOI 10.1634/stemcells.2007-0126.
Kippner et al. (2014), PeerJ, DOI 10.7717/peerj.452 20/21
Spencer SL, Gaudet S, Albeck JG, Burke JM, Sorger PK. 2009. Non-genetic origins of cell-to-cellvariability in TRAIL-induced apoptosis. Nature 459:428–432 DOI 10.1038/nature08012.
Spencer SL, Sorger PK. 2011. Measuring and modeling apoptosis in single cells. Cell 144:926–939DOI 10.1016/j.cell.2011.03.002.
Stockholm D, Benchaouir R, Picot J, Rameau P, Neildez TM, Landini G, Laplace-Builhe C,Paldi A. 2007. The origin of phenotypic heterogeneity in a clonal cell population in vitro.PLoS ONE 2:e394 DOI 10.1371/journal.pone.0000394.
Suzuki T, Higgins PJ, Crawford DR. 2000. Control selection for RNA quantitation. Biotechniques29:332–337.
Wang L, Brugge JS, Janes KA. 2011. Intersection of FOXO- and RUNX1-mediated gene expressionprograms in single breast epithelial cells during morphogenesis and tumor progression.Proceedings of the National Academy of Sciences of the United States of America 108:E803–E812DOI 10.1073/pnas.1103423108.
Wang L, Janes KA. 2013. Stochastic profiling of transcriptional regulatory heterogeneities intissues, tumors and cultured cells. Nature Protocols 8:282–301 DOI 10.1038/nprot.2012.158.
Ward Jr JH. 1963. Hierarchical grouping to optimize an objective function. Journal of the AmericanStatistical Association 58:236–244 DOI 10.1080/01621459.1963.10500845.
White AK, VanInsberghe M, Petriv OI, Hamidi M, Sikorski D, Marra MA, Piret J, Aparicio S,Hansen CL. 2011. High-throughput microfluidic single-cell RT-qPCR. Proceedings of theNational Academy of Sciences of the United States of America 108:13999–14004DOI 10.1073/pnas.1019446108.
Zhang Y, Zhu Y, Yao B, Fang Q. 2011. Nanolitre droplet array for real time reverse transcriptionpolymerase chain reaction. Lab on a Chip 11:1545–1549 DOI 10.1039/c0lc00502a.
Kippner et al. (2014), PeerJ, DOI 10.7717/peerj.452 21/21
Related Documents