Single-cell Proヲling of Immune cells After Neoadjuvant Pembrolizumab and Chemotherapy in A non-small cell lung cancer (NSCLC) Xiubao Ren ( [email protected] ) Tianjin Medical University Cancer Institute and Hospital, Tianjin Zhenzhen Hui Tianjin Medical University Cancer Institute and Hospital, Tianjin Jiali Zhang Tianjin Medical University Cancer Institute and Hospital, Tianjin Yulin Ren Tianjin Medical University Cancer Institute and Hospital, Tianjin XIAOLING LI University of Munich Cihui Yan Tianjin Medical University Cancer Institute & Hospital Lili Yang Tianjin Medical University Cancer Institute and Hospital, Tianjin Wenwen Yu Tianjin Medical University Cancer Institute and Hospital Tao Wang Department of Thoracic Surgery, Peking Union Medical College Hospital, Chinese Academy of Medical Sciences, Beijing 100730 Shanshan Xiao Hangzhou Repugene Technology Co., Ltd. Yulong Chen Tianjin Medical University Cancer Institute and Hospital, Tianjin Ran Zhang Tianjin Cancer Hospital Airport Hospital Lianmin Zhang Tianjin Medical University Cancer Institute and Hospital Feng Xu Tianjin Medical University Cancer Institute and Hospital, Tianjin Feng Wei Tianjin Medical University Cancer Institute and Hospital

Welcome message from author
This document is posted to help you gain knowledge. Please leave a comment to let me know what you think about it! Share it to your friends and learn new things together.
Transcript

Single-cell Pro�ling of Immune cells AfterNeoadjuvant Pembrolizumab and Chemotherapy inA non-small cell lung cancer (NSCLC)Xiubao Ren ( [email protected] )
Tianjin Medical University Cancer Institute and Hospital, TianjinZhenzhen Hui
Tianjin Medical University Cancer Institute and Hospital, TianjinJiali Zhang
Tianjin Medical University Cancer Institute and Hospital, TianjinYulin Ren
Tianjin Medical University Cancer Institute and Hospital, TianjinXIAOLING LI
University of MunichCihui Yan
Tianjin Medical University Cancer Institute & HospitalLili Yang
Tianjin Medical University Cancer Institute and Hospital, TianjinWenwen Yu
Tianjin Medical University Cancer Institute and HospitalTao Wang
Department of Thoracic Surgery, Peking Union Medical College Hospital, Chinese Academy of MedicalSciences, Beijing 100730Shanshan Xiao
Hangzhou Repugene Technology Co., Ltd.Yulong Chen
Tianjin Medical University Cancer Institute and Hospital, TianjinRan Zhang
Tianjin Cancer Hospital Airport HospitalLianmin Zhang
Tianjin Medical University Cancer Institute and HospitalFeng Xu
Tianjin Medical University Cancer Institute and Hospital, TianjinFeng Wei
Tianjin Medical University Cancer Institute and Hospital

Jian You Tianjin Medical University Cancer Institute and Hospital, Tianjin
Article
Keywords: neoadjuvant pembrolizumab and chemotherapy, IL 21, T cells, IgG, B cells
Posted Date: October 12th, 2021
DOI: https://doi.org/10.21203/rs.3.rs-952662/v1
License: This work is licensed under a Creative Commons Attribution 4.0 International License. Read Full License

1
Title page 1
Single-cell Profiling of Immune cells After Neoadjuvant Pembrolizumab and Chemotherapy 2
in ⅢA non-small cell lung cancer (NSCLC) 3
Running title: Neoadjuvant immune landscape revealed by single-cell sequencing 4
Zhenzhen Hui1,4,5,6,7,#
, Jiali Zhang1,4,5,6,7#
, Yulin Ren2,4,5,6,7#
, Xiaoling Li8, Cihui Yan
2,4,5,6,7, Lili 5
Yang2,4,5,6,7
, Wenwen Yu2,4,5,6,7
, Tao Wang9, Shanshan Xiao
9, Yulong Chen
3,4,5,6,7, Ran Zhang
10, 6
Lianmin Zhang3,4,5,6,7
, Feng Xu3,4,5,6,7
, Feng Wei2,4,5,6,7,*
, Jian You3,4,5,6,7,*
, Xiubao Ren1,2,4,5,6,7,*
7
1 Department of Biotherapy, Tianjin Medical University Cancer Institute and Hospital, Tianjin, 8
300060, China. 9
2 Department of Immunology, Tianjin Medical University Cancer Institute and Hospital, Tianjin, 10
300060, China. 11
3 Department of Lung Cancer, Tianjin Lung Cancer Center, Tianjin Medical University Cancer 12
Institute and Hospital 13
4 National Clinical Research Center for Cancer, Tianjin, 300060, China. 14
5 Key Laboratory of Cancer Prevention and Therapy, Tianjin, 300060, China. 15
6 Tianjin's Clinical Research Center for Cancer, Tianjin, 300060, China. 16
7 Key Laboratory of Cancer Immunology and Biotherapy, Tianjin, 300060, China. 17
8 Tianjin Cancer Hospital Airport Hospital, International Personalized Cancer Center, Tianjin 18
300308, China 19
9 Hangzhou Repugene Technology Co., Ltd., Hangzhou 311100, China 20
10 Tianjin Cancer Hospital Airport Hospital, Department of Minimally Invasive Surgery, Tianjin 21
300308, China 22
# These authors have contributed equally to this work: Zhenzhen Hui, Jiali Zhang, Yulin Ren. 23
*Corresponding author: Xiubao Ren, Jian You, Feng Wei 24
E-mail: [email protected] 25
Tel: +86-022-2353-7796 28
Fax: +86-022-2353-7796 29
Conflict of Interest Statement 30

2
The authors declare no potential conflicts of interest. 31
Author Contributions 32
X.B.R., J.Y. and F.W. conceived and guided the project; Z.Z.H. and W.W.Y. prepared single-cell 33
suspension; Y.L.C., L.M.Z., R. Z. and F.X. managed patients and collected tissues and blood; 34
Z.Z.H. and J.L.Z. performed flow cytometry, mIHC, ELISA and statistical analysis; T.W. and 35
S.S.X. analyzed single-cell data; Z.Z.H. wrote the manuscript; X.L.L. and X.B.R. revised the 36
manuscript; Y.L.R., C.H.Y. and L.L.Y. supported data interpretation. 37
Acknowledgments 38
The authors wish to thank Professor Raju Kucherlapati from Harvard Medical School for the 39
suggestion and revision of the manuscript. 40
Grant Support 41
This work was supported by grants from National Key R&D Program of China 42
(2018YFC1313400), the National Natural Science Foundation of China (U20A20375, 81974416, 43
81872166, 81972772 and 81802873). 44
45
46
47
48
49
50
51
52
53
54
55
56
57
58

3
Single-cell Profiling of Immune cells After Neoadjuvant Pembrolizumab and Chemotherapy 59
in ⅢA non-small cell lung cancer (NSCLC) 60
Abstract 61
The combination of immune checkpoint inhibitors (ICIs) with chemotherapy 62
(chemoimmunotherapy) in the neoadjuvant setting have achieved favorable clinical benefits in 63
non-small cell lung cancer (NSCLC), but the mechanism of clinical responses remain unclear. To 64
identify factors associated with the clinical outcome, we provide a rich resource of 186,477 65
individual immune cells from matched multiple immune-relevant tissue sites and peripheral blood 66
of four treatment-naïve and eight neoadjuvant chemoimmunotherapy treated ⅢA NSCLC patients 67
(responders versus non-responders) by single-cell RNA-seq and TCR-seq. We showed that the 68
synergistic increase of B cells and CD4+ T cells are associated with positive therapeutic response 69
of neoadjuvant chemoimmunotherapy. B cell IgG subclasses IgG1 and IgG3 play a critical role in 70
anti-tumor immune response in tumor lesion, and this process was driven by increased IL-21 71
protein secreted by infiltrated T follicular helper (Tfh) cells after neoadjuvant 72
chemoimmunotherapy. Furthermore, we uncovered several critical events for positive clinical 73
outcome, including the diminished activated TNFRSF4+
regulatory T cells (Tregs), increased 74
LAMP3+
dendritic cells (DCs), high pre-therapy peripheral blood T-cell diversity, and the 75
expansion of intratumoral CD4+ T clones and peripheral CD8
+ T clones. In total, our 76
comprehensive study of the single-cell profile of immune cells provide mechanistic insight of 77
clinical responses and identified novel predictive factors and potential therapeutic targets for 78
improving the efficiency of neoadjuvant chemoimmunotherapy in NSCLC. 79
80
Keywords: neoadjuvant pembrolizumab and chemotherapy; IL-21; T cells; IgG; B cells. 81
82
83
84
85
86
87
88

4
Introduction 89
Lung cancer continues to be the leading cause of cancer death worldwide. Approximately 20% 90
of patients with non-small cell lung cancer (NSCLC) are diagnosed with stage ⅢA (N2) disease 91
with poor outcome1, and neoadjuvant chemotherapy has been recommended to shrink the tumors
2. 92
However, neoadjuvant chemotherapy often causes immune cell toxicity, escape, and resistance 93
that are most frequently associated with tumor recurrence. Perioperative platinum-based 94
chemotherapy is associated with a survival rate that is only 5.4% higher than that with surgery 95
alone3. Even after curative resection, approximately 60% of patients with stage ⅢA disease still 96
develop recurrence after 3 years4. 97
Recently, neoadjuvant immunotherapy for resectable NSCLC has emerged as a powerful 98
treatment option for advanced NSCLC. Several studies have demonstrated the effectiveness and 99
feasibility of neoadjuvant therapy with immune checkpoint inhibitors (ICIs) in potentially 100
resectable melanoma, glioblastoma, and NSCLC5-7
. PD-1 blockage given prior to surgical removal 101
of NSCLC is safe and induced a major pathological response (MPR) in 45% of resected tumors, 102
according to the first neoadjuvant immunotherapy trial for patients with early-stage lung cancer5. 103
Preliminary research also found that higher levels of PD-L1 expression and T cell subsets 104
regulation in non-responders to platinum-based neoadjuvant chemotherapy, suggesting the benefit 105
for combined immunotherapy and chemotherapy (refer to chemoimmunotherapy) prior to surgical 106
resection of locally advanced NSCLC8. The synergistic effects of combining immunotherapy with 107
chemotherapy have been demonstrated in several clinical trials, thus providing the 108
proof-of-concept that neoadjuvant chemoimmunotherapy plays a significant role in the 109
multimodality therapy of early stage resectable NSCLC. Two major open-label, multicenter, 110
single-arm phase 2 trials have shown beneficial clinical responses of neoadjuvant 111
chemoimmunotherapy. One is NADIM, conducted at 18 hospitals in Spain demonstrated that 112
could increase the proportion of patients with resectable NSCLC who achieve a complete 113
pathological response (pCR), and that this approach would increase the number of patients that 114
can ultimately be cured9. The other one performed at three US hospitals showed that 115
Atezolizumab plus carboplatin and nab-paclitaxel could be a potential neoadjuvant regimen for 116
resectable NSCLC, with 57% of patients achieving major pathological response (MPR) and no 117
compromised surgical resection10
. In a single-center study of 35 patients with resectable stage 118

5
ⅢA/ⅢB NSCLC who received neoadjuvant embrolizumab and chemotherapy, 51.43% patients 119
achieved pCR and 74.29% patients achieved MPR, and PD-L1 expression (TPS with 50% 120
threshold) in biopsy tumor tissue prior to treatment was not associated with neoadjuvant 121
pathological response11
. Despite the favorable pathological response and clinical benefits of 122
neoadjuvant ICIs and chemotherapy, the underlying molecular mechanism has not been fully 123
elucidated and the differences in treatment efficacy has been connected to heterogeneity in the 124
immune cell composition of individual tumors, suggesting the reliable predictive biomarkers are 125
crucial for achieving better clinical efficacy. 126
To identify factors associated with success or failure of neoadjuvant ICIs and chemotherapy, 127
we performed single-cell transcriptome and TCR sequencing on CD45+ immune cells from 12 128
surgical resected ⅢA NSCLC patients after neoadjuvant pembrolizumab and chemotherapy. We 129
examined the tumor immune transcriptomic profiles and their association with the clinical 130
response to neoadjuvant chemoimmunotherapy, including the composition of immune cell, the 131
diversity, the expansion and dynamics of intratumoral and peripheral T-cell clonotypes. We 132
uncovered several critical events for positive clinical outcome, including the co-increase of CD4+ 133
T cells and B cells, B-cell isotype switching, the diminishment of TNFRSF4+
regulatory T cells 134
(Tregs), increased LAMP3+
dendritic cells (DCs), pre-therapy T-cell diversity in periphery, and the 135
expansion of intratumoral CD4+ T clones and peripheral CD8
+ T clones, etc. In total, our 136
comprehensive study of single cell profiling of immune cells reveals previously unrecognized 137
predictors, mechanisms and targets for enhancing the clinical responses of chemoimmunotherapy 138
and helps select the most suitable NSCLC patients who are more likely to benefit from this 139
neoadjuvant chemoimmunotherapy. 140
141
Results 142
Single cell profiling of immune cells of lung tumors and their association with response to 143
neoadjuvant chemoimmunotherapy 144
To analyze immune cells associated with the clinical efficacy of neoadjuvant 145
chemoimmunotherapy, we generated single-cell RNA sequencing profiles on CD45+ immune cells 146
isolated from lung cancer tumor tissues (T) and matched five immune-relevant sites (peripheral 147
blood mononuclear cells before and after neoadjuvant therapy (hereafter we called P0 and P1), 148

6
distal normal tissues (D), nearest non-cancer tissues (N), regional draining lymph nodes (LN)) of 149
12 ⅢA (N2) NSCLC patients, including 4 treatment-naïve and 8 neoadjuvant pembrolizumab and 150
chemotherapy patients (Fig. 1a). We acquired single-cell transcriptomes on a total of 186,477 151
immune cells, with 39,792 from tumor tissues, 34,042 from nearest non-cancer tissues, 18,577 152
from regional draining LNs, 27,786 from distal normal tissues, 19,509 from P0 and 46,741 from 153
P1 samples (Supplementary Fig. S1a). To explore the cellular composition in an unbiased manner, 154
we applied principle component analysis on variably expressed genes across all cells to generate 155
uniform manifold approximation and projection (UMAP) and identified 29 main clusters, 156
including 2 clusters enriched for NK/NKT cells (C0-NK/NKT-NKG7, C20-NK-XCL1), 3 clusters 157
for CD4+ T cells (C2-CD4-IL7R, C4-CD4-TCF7, C11-Treg-FoxP3), 6 clusters for CD8
+ T cells 158
(C3-CD8-KLRG1, C5-CD8-IL7R, C7-CD8-PDCD1, C8-CD8-GZMK, C21-CD8-MKI67, 159
C24-CD8-TCF7), 3 B and plasma cell clusters (C6-B cells-CD79A, C17-Plasma cells-IGHG1, 160
C22-B cells-MS4A1), 9 myeloid clusters (C1-TAM-CD81, C9-MDSC-like 161
macrophage-S100A8/A9, C10-Neotrophil-CXCL8, C15-Macrophage-CCL18, C16-DC-CD1C, 162
C18-Mast cells-TPSAB1, C19-Monocyte-FCGR3A, C25-pDC-IL3RA, 163
C26-Megakaryocyte-PPBP), as well as C23-Endothelial cells-VWF, C27-Epithelial cells-KRT17 164
and cycling cell clusters such as C14-MALAT1 and C28-STMN1 (Fig. 1b, Supplementary Fig. 165
S1b, Supplementary Table S1). 166
To address which immune cell type associates with therapeutic response of neoadjuvant 167
pembrolizumab and chemotherapy, we analyzed the tumor infiltrating immune cell composites in 168
treatment-naïve, neoadjuvant MPR, and non-MPR patients. MPR is an endpoint defined as ≤ 10% 169
of viable tumor cells in a surgically resected specimen. MPR has been adopted in post neoadjuvant 170
therapy and may predict recurrence-free survival (RFS) and overall survival (OS) in various 171
clinical trials12
. Therefore, we introduced MPR as the early surrogate endpoint in our analysis and 172
divided 8 neoadjuvant pembrolizumab and chemotherapy patients into MPR and non-MPR groups, 173
according to the pathologic response evaluated by two senior clinical pathologists, with 4 patients 174
in MPR and 4 patients in non-MPR groups (Fig. 1c). We identified significant changes in 175
lymphocyte and myeloid cell composition in neoadjuvant tumor lesions, with lymphocytes 176
constituted 47.55%, 65.81% and 64.82% in each treatment-naïve, neoadjuvant non-MPR and 177
MPR tumor lesions respectively, while myeloid cells constituted 42.54%, 23.25% and 24.61% 178

7
respectively. Compared with treatment-naïve tumor lesions, more intra-tumoral NK/NKT and 179
CD4+ T cells were found in both neoadjuvant non-MPR and MPR tumor lesions (NK/NKT: 2.36% 180
versus 5.71% versus 5.72%; CD4+ T cells: 7.23% versus 14.05% versus 13.24%). We also noted 181
that B cells were much more abundant in MPR tumor lesions than treatment-naïve and non-MPR 182
(12.69% versus 4.65% versus 7.00%), while Tregs were of relative higher number in non-MPR 183
tumor lesions than those in treatment-naïve and MPR tumor lesions (7.10% versus 3.38% versus 184
4.14%; Fig. 1d, e), suggesting differential anti-tumor response may exist in different clinical 185
outcome of neoadjuvant pembrolizumab and chemotherapy. 186
Given that the immune cells in the tumor may migrate from other tissues13
, we further 187
investigated the potential source of immune cells in the tumor and compared the expression 188
pattern of these cells in tumor and other matched relevant tissues of all 8 patients who received 189
neoadjuvant pembrolizumab and chemotherapy. We found that CD4+ and CD8
+ T cells resembled 190
cells from nearest non-cancer tissues (N) and P1, B and plasma cells significantly resembled cells 191
from nearest non-cancer tissues (N) and LN, NK/NKT most resembled cells from P1 and nearest 192
non-cancer tissues (N), whereas myeloid cells mainly mapped to cells of nearest non-cancer (N) 193
and distal normal tissues (D) and then P1 (Fig. 1f), indicating the possible cell migration 194
trajectories between different tissues during neoadjuvant pembrolizumab and chemotherapy. 195
Moreover, the immune cells in MPR tumor lesions shared more similarity with those in other 196
tissues than non-MPR patients, suggesting more active exchange activity between trans-tissue of 197
immune cells and this may promote anti-tumor immune response in responder group. 198
199
B cells class switched to IgG1 and IgG3 isotype and their association with neoadjuvant 200
chemoimmunotherapy response 201
Given B cells were remarkably enriched in neoadjuvant MPR tumor lesions compared to 202
treatment-naïve and non-MPR tumor lesions in our single-cell RNA profiles, we speculated that B 203
cells may be a key determinant of therapeutic response to neoadjuvant anti-PD-1 and 204
chemotherapy. To confirm this hypothesis, we performed flow cytometry (FCM) analysis and 205
identified a striking abundance of CD19+ B cells in tumor lesions of MPR patients compared with 206
treatment-naïve and non-MPR patients (Ordinary one-way ANOVA,p=0.0018,p=0.0474, Fig. 2a, 207
b, Supplementary Fig. S2a, b), and this proportion of CD19+ B cells were positively correlated 208

8
with therapy response, while there was no difference in nearest non-cancer tissues (N), LNs and 209
P1. 210
To gain deeper insight into the function of B cells, we compared the differentially expressed 211
genes of C17-plasma cells (Supplementary Fig. S2c) in treatment-naïve, neoadjuvant non-MPR 212
and MPR tumor lesions. We found IGHA1, IGHA2, and JCHAIN were significantly decreased in 213
neoadjuvant MPR tumor lesions than in non-MPR tumor lesion, while IGHG1 and IGHG3 were 214
significantly up-regulated in MPR tumor lesions (Welch t-test, p<0.05, Fig. 2c), indicating the B 215
cells switched to two dominant antibody isotype IgG1 and IgG3 during neoadjuvant 216
chemoimmunotherapy. To confirm this, we next assessed tumor samples histologically to gain 217
insights into the density and distribution of B cells isotypes by multiplex fluorescent IHC staining 218
(mIHC), and demonstrated that neoadjuvant chemoimmunotherapy promoted more intratumoral 219
CD20+ B cells infiltration (Mann-Whitney test, mean 7.59% versus 14.25%, p=0.0283, Fig. 2d, e). 220
And consistent with our scRNA findings, IgG1 and IgG3 positive cells showed an increasing trend 221
in MPR tumor lesions (mean IgG1: 2.13% versus 1.41% versus 2.92%;mean IgG3:0.32% versus 222
0.25% versus 0.52%), while IgA positive cells showed a decreasing trend in MPR tumor lesions 223
(mean 1.62% versus 1.51% versus 0.72%; Fig. 2d, f). These data indicated that neoadjuvant 224
chemoimmunotherapy induced B cells class switching to IgG subclasses and the dominant 225
antibody responses (increased IgG1 and IgG3, diminished IgA) to promote favorable anti-tumor 226
immune response. 227
228
IL-21 induced B cell isotype switching (IgG1 and IgG3) and its association with neoadjuvant 229
chemoimmunotherapy response 230
To explore the transcriptome characteristics in our single-cell profiles, we applied gene set 231
enrichment analysis (GSEA) to detect signatures in tumor tissues of different therapy groups, 232
including Tfh cell signature (a distinct subset of CD4+ helper T cells that regulate the development 233
of antigen-specific B cell immunity), CXCL13 signature (dominant chemokine for B cell and Tfh 234
cells chemotaxis and germinal center formation) and the 12-chemokine signature (for detection of 235
tertiary lymphoid structures (TLSs)14
. We found that Tfh cell signature was much abundant in 236
neoadjuvant tumor lesions, indicating their potential important role in anti-tumor immune 237
response of neoadjuvant chemoimmunotherapy. The CXCL13 signature and the 12-chemokine 238
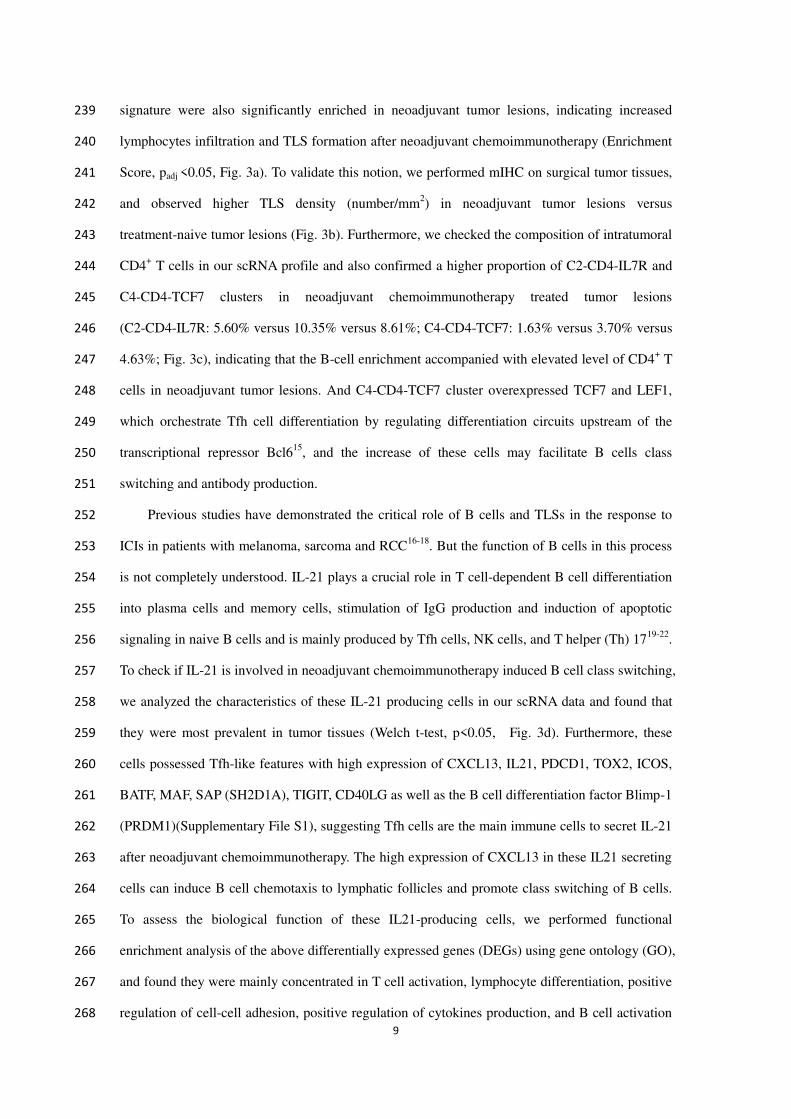
9
signature were also significantly enriched in neoadjuvant tumor lesions, indicating increased 239
lymphocytes infiltration and TLS formation after neoadjuvant chemoimmunotherapy (Enrichment 240
Score, padj <0.05, Fig. 3a). To validate this notion, we performed mIHC on surgical tumor tissues, 241
and observed higher TLS density (number/mm2) in neoadjuvant tumor lesions versus 242
treatment-naive tumor lesions (Fig. 3b). Furthermore, we checked the composition of intratumoral 243
CD4+ T cells in our scRNA profile and also confirmed a higher proportion of C2-CD4-IL7R and 244
C4-CD4-TCF7 clusters in neoadjuvant chemoimmunotherapy treated tumor lesions 245
(C2-CD4-IL7R: 5.60% versus 10.35% versus 8.61%; C4-CD4-TCF7: 1.63% versus 3.70% versus 246
4.63%; Fig. 3c), indicating that the B-cell enrichment accompanied with elevated level of CD4+ T 247
cells in neoadjuvant tumor lesions. And C4-CD4-TCF7 cluster overexpressed TCF7 and LEF1, 248
which orchestrate Tfh cell differentiation by regulating differentiation circuits upstream of the 249
transcriptional repressor Bcl615
, and the increase of these cells may facilitate B cells class 250
switching and antibody production. 251
Previous studies have demonstrated the critical role of B cells and TLSs in the response to 252
ICIs in patients with melanoma, sarcoma and RCC16-18
. But the function of B cells in this process 253
is not completely understood. IL-21 plays a crucial role in T cell-dependent B cell differentiation 254
into plasma cells and memory cells, stimulation of IgG production and induction of apoptotic 255
signaling in naive B cells and is mainly produced by Tfh cells, NK cells, and T helper (Th) 1719-22
. 256
To check if IL-21 is involved in neoadjuvant chemoimmunotherapy induced B cell class switching, 257
we analyzed the characteristics of these IL-21 producing cells in our scRNA data and found that 258
they were most prevalent in tumor tissues (Welch t-test, p<0.05, Fig. 3d). Furthermore, these 259
cells possessed Tfh-like features with high expression of CXCL13, IL21, PDCD1, TOX2, ICOS, 260
BATF, MAF, SAP (SH2D1A), TIGIT, CD40LG as well as the B cell differentiation factor Blimp-1 261
(PRDM1)(Supplementary File S1), suggesting Tfh cells are the main immune cells to secret IL-21 262
after neoadjuvant chemoimmunotherapy. The high expression of CXCL13 in these IL21 secreting 263
cells can induce B cell chemotaxis to lymphatic follicles and promote class switching of B cells. 264
To assess the biological function of these IL21-producing cells, we performed functional 265
enrichment analysis of the above differentially expressed genes (DEGs) using gene ontology (GO), 266
and found they were mainly concentrated in T cell activation, lymphocyte differentiation, positive 267
regulation of cell-cell adhesion, positive regulation of cytokines production, and B cell activation 268

10
and leukocyte proliferation (Fig. 3e). To further confirm the potential role of IL-21 in mediating 269
chemoimmunotherapy response, we used flow cytometry analysis and demonstrated that 270
CD4+IL21
+ cells were significantly higher in MPR tumor tissues than those in treatment-naive and 271
non-MPR tumor tissues (Kruskal-Wallis test, p=0.0186, p=0.0213, Fig. 3f). Collectively, 272
neoadjuvant pembrolizumab and chemotherapy increased Tfh cell infiltration and IL-21 secretion 273
within the tumor tissues to promote anti-tumor response. 274
In addition to the increased level of IL-21 in MPR tumor tissue, we found that plasma IL-21 275
level was significantly elevated after neoadjuvant anti-PD-1 and chemotherapy in our single-cell 276
study cohort, and higher IL-21 concentration was consistent with less residual viable tumor cells 277
(RVT) (Wilcoxon test, p=0.0313, Fig. 3g). Next, to investigate the expression and distribution 278
characteristics of IL-21, IgG and TLS in tumor microenvironment, we performed mIHC on 279
surgical tumor tissues and identified more CD4+IL21
+ and IgG-positive cells in MPR tumor 280
tissues (Ordinary one-way ANOVA, CD4+IL21
+: p=0.0408, p=0.0385; IgG: p=0.2383, p=0.0471, 281
Fig. 3h, i, Supplementary Fig. S3), while there was no difference in nearest non-cancer tissues (N), 282
and LNs. Taken all together, these data suggested B cells switched to IgG subclass to mediate 283
anti-tumor immune response in neoadjuvant pembrolizumab and chemotherapy, and increased 284
IL-21 secreted by CD4+ T cells was the driving force in tumor lesion. 285
286
Peripheral TCR diversity at baseline and CD8+ T clonal expansion induced by positive 287
neoadjuvant chemoimmunotherapy 288
In addition to increased T/B lymphocytes infiltration, T cell clonotypes were relative diverse 289
in non-MPR and MPR tumor lesions (Kruskal-Wallis, p=0.31, Fig. 4a, Supplementary Fig. S4a), 290
suggesting new T clones with new TCR repertoires may influx into tumor lesions after the 291
treatment. To understand the functional status of T cells in different treatment groups, we 292
compared the DEGs of T cells in treatment-naïve, non-MPR and MPR tumor lesions. The data 293
revealed that the exhaustion status of CD8+ T cells was significantly improved in MPR tumor 294
lesions, with reduced expression of exhausted markers, such as PDCD1, CTLA4, LAG3 and 295
TIGIT. In addition, memory and survival marker IL7R, tissue-resident marker CD69, and 296
lymphocyte chemokine CXCL13 were also up-regulated in MPR (all padj<0.0001, Fig. 4b). The 297
high expression of CXCL13 in CD8+ T cells may promote lymphocyte chemotaxis across high 298

11
endothelial venule into tumor lesions to support TLS formation23,24
. As pre-existing tumor specific 299
T cells have limited reinvigoration capacity25
, we speculated the clonal replacement of T cells 300
from periphery may contribute to the improvement of the CD8+ T cell exhausted state. To verify 301
this idea, we compared shared T clones between tumors and P1 and found that the shared T clones 302
with P1 were significantly increased in neoadjuvant tumor lesions (Mann-Whitney test, p=0.0444, 303
Supplementary Fig. S4b). Next, we compared the DEGs between tumor and P1 shared T clones 304
and tumor-resident only T clones in tumor lesions and identified an abundant expression of CD8A 305
and CD8B in shared T clones. The result showed that the shared CD8+ T clones up-regulated 306
cytotoxic genes such as NKG7, GZMH, GZMA, GZMK, KLRD1, GNLY, GZMB, PRF1, CTSW, 307
CST7, GZMK, and GZMM, while tumor-resident only CD8+ T clones were highly expressed 308
CTLA4, ICOS, TIGIT, CD161 (KLRB1), CCR7 and PDCD1, consistent with the notion that 309
intrinsic tumor-resident T cell repertoire may likely to be exhausted and dysfunctional with low 310
tumor reactivity (Fig. 4c) 25
. Thus, neoadjuvant anti-PD-1 and chemotherapy promotes clonal 311
replenishment of T cell clones from peripheral blood to improve the exhausted and dysfunctional 312
state of intratumoral CD8+ T cells in responders. 313
To address the potential migration trajectories of T cells, we analyzed the clonotypes sharing 314
among five related samples including tumor tissues, nearest non-cancer tissues, LN, distal normal 315
tissues and P1, and identified more shared CD8+ T clones between different tissues than CD4
+ T 316
clones (Fig. 4d). Overall, we noted more CD8+ T clones were shared between tumor lesions with 317
P1 (7.64% of the total intratumoral CD8+ T clones), then nearest non-cancer tissues (7.14% of the 318
total intratumoral CD8+ T clones), whereas tumor infiltrating CD4
+ T cells shared more clones 319
with distal normal tissues (only 1.26% of the total intratumoral CD4+ T clones). The high degree 320
of inter-tissue TCR distribution implied that these T cells with same ancestors may migrate 321
between different tissues, and the migration of CD8+ T cells between different tissues was more 322
active than in CD4+ T cells. Next, we explored the clonal expansion of CD4
+ and CD8
+ T cells in 323
different tissue types separately and found obvious discrepancy (Kruskal-Wallis test, CD4+ T 324
clones: p=0.0051; CD8+ T clones: p=1e
-04, Fig. 4e, Supplementary Fig. S4c, d). The CD8
+ T-cell 325
clones were widely expanded in various tissues and were more obvious in P1 than P0 and other 326
tissues, suggesting CD8+ T clones has been activated and expanded in the periphery following 327
neoadjuvant pembrolizumab and chemotherapy. However, CD4+ T clones were slightly expanded 328

12
in tumor tissues (T), nearest non-cancer tissues (N) and distal normal tissues (D), reflecting the 329
local activation and expansion of intra-tissues CD4+ T clones happened during neoadjuvant 330
pembrolizumab and chemotherapy. Collectively, these data indicated that neoadjuvant 331
pembrolizumab and chemotherapy evokes the expansion of intra-tissue CD4+ T clones and 332
peripheral CD8+ T clones to promote anti-tumor immune response. 333
Next, to validate the potential role of peripheral blood during chemoimmunotherapy, we 334
explored the changes in the main immune cell composition of paired P0 and P1 before and after 335
neoadjuvant chemoimmunotherapy, and found NK/NKT and CD8+ T cells increased, CD4
+ T cells 336
decreased after neoadjuvant chemoimmunotherapy. Further analysis of different CD8+ T cell 337
clusters confirmed a remarkable increase of C3-Cytotoxic CD8+ T cells after neoadjuvant 338
chemoimmunotherapy (Fig. 4f). To track clonal cell fates during chemoimmunotherapy, we 339
matched clonotypes between P0 and P1 based on TCR sequence, and demonstrated that the 340
majority of matched T clones between P0 and P1 were CD8+ T cells, and the matched CD8
+ T 341
clones were more expanded in P1 than P0 (Supplementary Fig. S4e, f). The dynamic of these 342
matched clonotypes supported our notion that chemoimmunotherapy could reinvigorate the clonal 343
expansion of peripheral CD8+ T cells. Previous study have identified stem-like T cells that express 344
the transcription factor TCF7 that proliferate after PD-1 blockade26
. In our scRNA profiles, we 345
also identified that intratumoral TCF7+CD8
+ T cells elevated in neoadjuvant tumor lesions 346
(Mann-Whitney test, p=0.0061, Supplementary Fig. S4g). We then compared the proportion of 347
TCF7+CD8
+ T cells in non-MPR and MPR patients with different tissue types, and found that 348
stem-like TCF7+CD8
+ T cells striking increased in P1 sample of MPR patients compared with 349
non-MPR patients, which contribute to tumor control in response to chemoimmunotherapy 350
(Mann-Whitney test, p=0.0159, Supplementary Fig. S4h). These results demonstrated that the 351
reinvigoration and clonal expansion of peripheral CD8+ T-cell clones is a key factor affecting the 352
immunotherapy response. 353
We further explore the relationship between TCR diversity of peripheral T cells and 354
therapeutic response and checked TCR diversity in matched P0 and P1 samples. The data 355
demonstrated that patients with high TCR diversity in P0 showed greater therapy response to the 356
treatment. Specifically, all patients with higher CD4+ and CD8
+ TCR diversity in P0 achieved 357
MPR after receiving neoadjuvant pembrolizumab and chemotherapy, while patients with lower 358

13
TCR diversity were less responsive to neoadjuvant anti-PD-1 and chemotherapy. However, the 359
CD4+ and CD8
+ TCR diversity of P1 displayed inconsistency with neoadjuvant therapeutic 360
response, higher CD8+ TCR diversity of P1 was positively correlated with MPR rate, while the 361
lower CD4+ TCR diversity was relevant to better therapy response (Fig. 4g, h). These results 362
suggested that the preliminary peripheral blood T cell diversity is a potential predictor for the 363
clinical response to neoadjuvant chemoimmunotherapy, and that patients with higher TCR 364
diversity are more likely to benefit from chemoimmunontherapy. Taken all these together, 365
neoadjuvant chemoimmunotherapy reinvigorated peripheral CD8+ T clones expansion and 366
promoted clonal replenishment of CD8+ T cells from periphery to improve the exhausted state in 367
MPR tumor lesions. Monitoring TCR diversity and T clones expansion in the peripheral blood 368
may be an early predictor of anti-tumor T cell response in neoadjuvant chemoimmunotherapy. 369
370
Diminished TNFRSF4+
Tregs in tumor lesion and their association with the positive therapy 371
response 372
Regulatory T cells (Tregs) play a critical role in mediating immune tolerance and tumor 373
escape 27
. One interesting phenomenon we noticed is that C11-Tregs-FoxP3 cluster were more 374
abundant in non-MPR tumor lesions, indicating their aggregation suppressed the immune response 375
induced by neoadjuvant chemoimmunotherapy in non-responder patients (Fig. 1e). Flow 376
cytometry analysis also confirmed a decreased proportion of CD4+CD25
+CD127
- Treg cells in 377
MPR tumor lesions, consistent with the negative association of Tregs to the clinical response to 378
neoadjuvant chemoimmunotherapy (ordinary one-way ANOVA, p=0.0003, p=0.0297, Fig. 5a). 379
Moreover, the costimulatory molecule TNFRSF4 (OX40), one of the marker genes of C11-Tregs- 380
FoxP3 cluster in our scRNA profiles, was found in significantly lower level in MPR patients than 381
in treatment-naive and non-MPR patients (Fig. 5b). 382
To further evaluate the immunosuppression of Tregs in different treatment groups, we 383
generated the DEGs of C11-Tregs-FoxP3 in treatment-naïve, non-MPR and MPR patients. We 384
found that besides TNFRSF4, Treg functional signature genes such as FoxP3, CTLA4, TIGIT, 385
TNFRSF18 (GIRT), CCR8, LAYN and MAGEH1 were also overexpressed in C11-Tregs-FoxP3 386
of treatment-naïve and non-MPR tumor lesions, but not for MPR tumor lesions (all padj<0.05, Fig. 387
5c). To explore the functional differences between TNFRSF4+ and TNFRSF4
- Treg cells, we 388

14
compared TNFRSF4+ and TNFRSF4
- Treg cells in the C11-Tregs-FoxP3 cluster. The volcanic map 389
of DEGs showed that TNFRSF4+ Tregs were more activated and immunosuppressive with high 390
expression of Treg functional signatures such as GITR (TNFRSF18), CCR8, LAYN, TNFRSF9, 391
CTLA4, REL, FoxP3, MAGEH1, and IL2RA (Fig. 5d), which was correlated with poor prognosis 392
in NSCLC, colorectal (CRC) and breast cancer (BC) patients28-32
. To validate their association 393
with therapeutic response, we made a comparison of TNFRSF4 expression among 394
C11-Tregs-FoxP3 of different tissue types of neoadjuvant non-MPR and MPR patients, and 395
demonstrated that the expression of TNFRSF4 was significantly lower in P1, nearest non-tumor 396
tissue (N), tumor tissue (T) and LNs in MPR than non-MPR patients, which was strikingly lower 397
in MPR tumor tissues compared with non-MPR tumor lesions (Welch t-test, p=0.0048, p=0.0445, 398
p< 2e-16
, p=1.2e-12
, respectively, Fig. 5e). Therefore, neoadjuvant chemoimmunotherapy could 399
eliminate the activated immunosuppressive TNFRSF4+
Tregs, and the diminished levels of 400
TNFRSF4+ Tregs could be used as a positive predictor of neoadjuvant chemoimmunotherapy 401
response. 402
403
LAMP3+ DCs participated in the recruitment and regulation of lymphocytes during 404
neoadjuvant chemoimmunotherapy 405
Dendritic cells (DCs) are central regulators of adaptive immune responses and are necessary 406
for T/B cell-mediated cancer immunity 33
. We detected 3,671 dendritic cells in our scRNA analysis, 407
and four distinct subtypes were revealed by sub-clustering analysis (Fig. 6a), including 408
DC-C0-FCER1A, DC-C1-C1QA, DC-C2-CLEC9A, and DC-C3-LAMP3. We next attempted to 409
identify marker genes for these four clusters. DC-C0-FCER1A expressed high level of FCER1A, 410
CD1C and CLEC4A, corresponding to cDC2, whereas DC-C3-CLEC9A expressed high level of 411
TACSTD2, CLEC9A, and CADM1, representing cDC1. Cells in DC-C3-LAMP3 were highly 412
expressed the maturation markers LAMP3, CD83, and CD80; the migration marker CCR7; and 413
the lymphocyte recirculation chemokine CCL19, CCL22 and CCL17, suggesting that 414
DC-C3-LAMP3 was a group of mature DCs originate from other clusters and possess the potential 415
of migrating from tumors to LNs (Fig. 6b). We observed a higher proportion of cDC2s than 416
cDC1s in multiple tissues. Particularly, DC-C3-LAMP3 was mainly distributed in tumors, LNs 417
and nearest or distal normal tissues, but was rarely seen in P0 and P1 (Fig. 6c). Then, in order to 418

15
explore the role of LAMP3+DCs in neoadjuvant chemoimmunotherapy, we compared the 419
expression of LAMP3 in different treatment groups and found the expression of LAMP3 was 420
significantly higher in neoadjuvant patients than in treatment-naïve patients (Welch t-test, 421
p<0.0001, Fig. 6d). Flow cytometry analysis also demonstrated that the ratio of LAMP3+DCs in 422
neoadjuvant MPR tumor lesions was significantly higher than that in treatment-naive tumor 423
tissues, and displayed an increasing trend in MPR than non-MPR tumor tissues (Kruskal-Wallis 424
test, p=0.0440, p=0.3447, Fig. 6e). These results indicate that LAMP3+ DCs are involved in and 425
positively modulate the therapeutic response to neoadjuvant chemoimmunotherapy. 426
To further investigate the interactions between LAMP3+
DCs and lymphocytes, we utilized a 427
set of immune-related ligand-receptor (L-R) pair analysis to gain insights into the regulatory 428
relationships among cell clusters. DC-C3-LAMP3 was predicted to interact with C2-CD4-IL7R, 429
C11-CD4-Treg and C7-CD8-PDCD1 clusters via the CCL22/CCR4 and CCL17-CCR4 axes, and 430
interact with the CD4+ T cells, CD8
+ T cells and B cells through CCL19-CCR7 axes, indicating a 431
potential role of LAMP3+ DCs for lymphocytes recruitment during neoadjuvant 432
chemoimmunotherapy (Fig. 6f). In addition, a pluripotent cytokine-interleukin (IL)-15, 433
overexpressed by LAMP3+ DCs, has been reported as an immunotherapeutic agent for the 434
treatment of cancer 34
. IL-15 plays multiple roles in activating T cells, B cells, NK cells, but not 435
for Tregs 35
. LAMP3+DCs were predicted to interact with C17-plasma cells through IL15/IL15R 436
pathway to support B cells proliferation and differentiation in our L-R analysis (Fig. 6f). 437
Furthermore, we found that LAMP3+
DCs exhibit the regulation activity towards B cells, Tregs, 438
CD4+ and CD8
+ T lymphocytes through PD1/PD-L1 and PD1/PD-L2 signaling pathways, as well 439
as NK/NKT cells via CD226/NECTIN2 and TIGIT/NECTIN2 pathways, and macrophage and 440
DCs cells via CD80 interacted with PD-L1 to disrupt PD-L1/PD-1 binding to promote anti-tumor 441
T cell response 36
(Fig. 6f, Supplementary Fig. S5, Fig. S6). Altogether, our data suggested that 442
LAMP3+ DCs are involved in the recruitment and regulation of multiple lymphocyte subsets via 443
L-R interactions, and are more likely associated with the abundant intratumoral lymphocyte 444
infiltration and the clinical response to neoadjuvant pembrolizumab and chemotherapy. 445
446
Increased B cell subclass (IgG1 and IgG3) and CD4+ T cells in TLSs and their association 447
with positive clinical effect in validation cohort 448

16
To validate factors identified in our study that affect the therapeutic response to neoadjuvant 449
chemoimmunotherapy, we performed mIHC staining on different treatment groups with antibody 450
CD20, IgG1, IgG3, IgA, CD4, IL-21, including 26 treatment-naïve ⅢA NSCLC tumor tissues and 451
30 surgical tumor specimens from patients diagnosed with ⅢA/ⅢB NSCLC and received 452
neoadjuvant pembrolizumab and chemotherapy before surgery (Validation cohort, Fig. 7a). The 453
results demonstrated neoadjuvant chemoimmunotherapy promoted more TLSs formation in both 454
non-MPR and MPR tumor lesions in our validation cohort, compared to treatment-naïve patients 455
(Ordinary one-way ANOVA, p=0.0006, p=0.0147, Fig. 7b). Specifically, compared with 456
treatment-naïve and non-MPR patients, neoadjuvant MPR patients had more CD20+ B cell 457
infiltration (Ordinary one-way ANOVA, p=0.0001, p=0.0179) and a significantly higher 458
proportion of B-cell subcalsses IgG1 and IgG3 positive cells (Ordinary one-way ANOVA, IgG1: 459
p=0.0006, p=0.0325; IgG3: p=0.0022, p=0.0076), and the ratio of IgA positive cells was 460
significantly lower than that in treatment-naïve and non-MPR tumor tissues (Ordinary one-way 461
ANOVA, p<0.0001, p=0.0343). The proportion of CD4 and IL-21 positive cells in MPR tumor 462
tissues was also significantly higher than that in treatment-naïve and non-MPR tumor tissues 463
(Ordinary one-way ANOVA, CD4: p=0.0006, P=0.0045; IL-21: p=0.0116, p=0.0042) (Fig. 7c, d, 464
Supplementary Fig. S7). Furthermore, the number of IgG1 and IgG3 positive cells were positively 465
correlated with the number of IL-21 positive cells within tumor lesions (Pearson correlation 466
coefficient, R=0.6713, p<0.0001; R=0.3685, p=0.0056, Fig. 7e). The data indicated the relative 467
abundance of distinct antibody subclasses in the tumor microenvironment is an important 468
predictor of chemoimmunotherapy response. Taken together, we confirmed that the increased 469
number of B cell subclass IgG1 and IgG3 and CD4+ T cells, and increased level of IL-21 in 470
responder tumor lesions, play critical roles in shaping anti-tumor immune responses and the 471
positive therapeutic response of neoadjuvant chemoimmunotherapy in clinic. 472
To verify whether the level of IL-21 in peripheral blood plasma can reflect the changes of 473
local tumor microenvironment and whether it is related to the clinical response of neoadjuvant 474
pembrolizumab and chemotherapy, we checked the concentration of plasma IL-21 by ELISA 475
collected from 17 treatment-naïve patients and 13 neoadjuvant pembrolizumab and chemotherapy 476
patients in our validation cohort. Our results demonstrated that plasma IL-21 was significantly 477
higher in MPR patients than that in treatment-naïve and non-MPR patients (Ordinary one-way 478

17
ANOVA, p=0.0407, p=0.0208, Fig. 7f). Taken all together, our result provided the possibility of 479
plasma IL-21 as a novel potential factor for predicting patients who are most likely to benefit from 480
chemoimmunotherapy and monitoring therapeutic response in dynamic. 481
482
Discussion 483
To our knowledge, our study is the first published immune landscape to explore the 484
molecular and cellular mechanism of neoadjuvant pembrolizumab and chemotherapy at single cell 485
resolution in patients with resectable NSCLC. Combining immunotherapy and chemotherapy has 486
a proven synergistic effect, since chemotherapy aids in fast tumor regression, reduction of tumor 487
burden and prevention cases of hyperprogression upon exposure to immunotherapy, while 488
immunotherapy may prolong this effect inducing a durable anti-tumor response9,10
. 489
Based on our finding, we proposed a hypothesis that several critical anti-tumor events 490
happened during neoadjuvant chemoimmunotherapy (Fig. 8). A central finding in our study is 491
that B cell subclasses IgG1 and IgG3 play a critical role in anti-tumor response to neoadjuvant 492
chemoimmunotherapy, and IL-21 (secreted by Tfh cells) is the driving force to induce B cell 493
isotype switching to IgG1 and IgG3, not IgA in tumor lesion. Neoadjuvant chemoimmunotherapy 494
promoted more TLSs formation in surgical NSCLC tumor tissues, and the synergistic increase of 495
B cells and CD4+ T cells in TLSs are associated with positive therapeutic response. B cells and T 496
cells interact and undergo cooperative selection, specialization and clonal expansion in tumor 497
associated TLSs, and B cells as antigen presenting cells can present tumor antigen to activate T 498
cells23
. The isotype and subclasses of the antibodies produced by plasma cells in tumor 499
microenvironment can drive distinct immune responses. Among the four subclasses of human IgG 500
(IgG1, IgG2, IgG3, IgG4), IgG1 has the highest FcγR binding affinity, followed by IgG3, IgG2, 501
IgG4. The dominant IgG1 and IgG3 antibodies can bind to Fcγ receptor (FcγR) and trigger ADCC 502
and antibody-mediated phagocytosis and mediate complement-based cytotoxicity to kill tumor 503
cells37
. Furthermore, the dying tumor cells released neoantigens, FcγR expressed on dendritic cells 504
and macrophages may capture IgG-bound tumor antigens and present peptides derived from these 505
neoantigens to T cells, and anti-PD-1 therapy activate the clonal expansion of these tumor 506
neoantigen specific T cells. In contrary, the reduced IgA isotype has an immunosuppressive effect 507
and promotes the transition and expansion of Treg cells, which reciprocally produce transforming 508

18
growth factor-β (TGFβ) mediating B cells class switching to IgA38
. Published studies has 509
confirmed that IL-21 can induce class switching of naive B cells to IgG, and IL-21 stimulation 510
up-regulated STAT3 phosphorylation, increased Blimp-1 expression in B cells, and promoted 511
plasma cell differentiation 39,40
. Thus, modulation of IL-21/STAT3/Blimp-1 signaling pathway, 512
such as combined IL-21 with immunotherapy, may be one of the strategies to boost anti-tumor 513
immune response. 514
The vast majority of NSCLC tumor cells are typically killed by the activation of cytotoxic T 515
lymphocytes (CTL) response. Yost et al.25
have demonstrated that pre-existing tumors specific T 516
cells may have limited reinvigoration capacity, and that the T cell response to ICIs derives from a 517
distinct repertoire of T cell clones that may have just recently entered the tumor from periphery. 518
Although PD-1 blockage has been reported to reinvigorate peripheral T cell clones that are 519
dynamic exchanged with the tumor by a TCR Vβ complementarity-determining region 3 (CDR3) 520
sequencing study 41
, they did not really distinguish whether it was primarily CD4+ or CD8
+ T 521
clones that were relevant to the pathologic responses of PD-1 blockage. In our scRNA profiles, we 522
investigated the cellular connection of tumor and other tissues based on expression similarity 523
analysis and confirmed a possibility of cell migration between tumor tissue and P1 among 524
different tissues. Furthermore, we innovatively analyzed the expansion, diversity and trafficking 525
of CD4+ and CD8
+ T cells separately based on our scTCR profile, demonstrating that baseline 526
pre-therapy peripheral TCR diversity and the reinvigoration of CD8+ T clones following 527
chemoimmunotherapy, in particular the expansion of C3-Cytotoxic CD8+ T cells in P1 were 528
associated with improved immunological responses. We also demonstrated that neoadjuvant 529
chemoimmunotherapy significantly improved the exhaustion status of intratumoral CD8+ T cells 530
in MPR tumor lesions compared with that in treatment-naïve and non-MPR tumor lesions. Based 531
on these findings, we hypothesized that tumor-resident T clones may dynamically exchange with 532
peripheral blood, anti-PD-1 therapy reinvigorates neoantigen-specific CD8+ T clones in peripheral 533
blood, and peripherally-expanded CD8+ T cells migrated to tumor lesions to produce the 534
anti-tumor response. Taken together, these data suggested that the peripheral CD8+ T clones may 535
be a key factor affecting chemoimmunotherapy response. Our conclusion was partially supported 536
by Professor Han and his colleagues’ study which sequenced the (CDR3) of PD-1+CD8
+ TCR Vβ 537
in peripheral blood before and after ICIs therapy42
, suggesting that pretreatment peripheral 538
19
PD-1+CD8
+ TCR diversity could predict clinical benefits of anti PD-1/PD-L1 therapy. Collectively, 539
the TCR diversity which reflects the probability of neoantigen recognition, as well as the clonality 540
of CD8+ T cells in peripheral blood may serve as noninvasive predictors of patient response to 541
chemoimmunotherapy and survival outcomes in NSCLC. The dynamic monitoring of CD8+ T 542
cells and their TCR repertoire may be an early biological correlation of anti-tumor T cell 543
recognition. 544
Regulatory T cells (Tregs) are master immunoregulatory cells in tumor microenvironments 43
. 545
Our study demonstrated that one Treg subset TNFRSF4+ Tregs were inversely correlated with 546
neoadjuvant chemoimmunotherapy response. TNFRSF4+ Tregs featured with high expression of 547
Treg functional signature genes and exhibited the strongest immune-suppressive function 548
compared to TNFRSF4- Tregs. Consistently, it has been reported that Treg cells with the 549
expression of TNFRSF4 was more immunosuppressive and facilitated tumor immune evasion and 550
promote tumor development in nasopharyngeal carcinoma and cutaneous squamous cell 551
carcinoma44,45
. Anti-TNFRSF4 antibody augmented antitumor immunity in animal models with 552
several types of cancers, and the anti-tumor effects were mainly dependent on the reduction of 553
Treg cells in tumors. In mice, the combination of anti-PD-1 inhibitory and anti-TNFRSF4 agonist 554
antibodies reduces the proportion of Tregs and exhausted T cells in pancreatic tumors and 555
increases numbers of memory CD4+ and CD8
+ T cells, eradicating all detectable tumor, which can 556
be used in development of immune-based combination therapy46
. Thus, the diminished activated 557
TNFRSF4+ Tregs in tumor lesions are associated with the positive clinical outcome and could be 558
used as potential predictors and therapeutic target for neoadjuvant chemoimmunotherapy. 559
DCs are a diverse group of professional antigen-presenting cells that play a key role in the 560
initiation and regulation of innate and adaptive immune response33
. Garris et al. demonstrated that 561
the successful anti-tumor immune response of PD-1 inhibitors depends on the interaction between 562
T cells and DCs47
. LAMP3+ DCs are a subset of mature DCs derived from cDC1 and cDC2, which 563
can migrate from tumor to LNs and initiate antigen-specific immune response48
. Mature LAMP3+ 564
DCs were also reported to be existed in multiple tumor types and associated with increasing tumor 565
infiltrating lymphocytes in the local tumor lesion49
. A pan-cancer single-cell transcriptome 566
analysis of myeloid cells confirmed that although the proportion of cDC2 was much higher in 567
tumor tissues, cDC1-derived LAMP3+ cDCs were more abundant than cDC2-derived ones. 568

20
LAMP3+ DCs from different origins maintain specific transcriptome characteristics and might 569
exhibit different functions50
. Our study demonstrated a remarkable increase of intratumoral 570
LAMP3+ DCs aggregation in tumor lesion in neoadjuvant MPR tumor lesions, suggesting 571
LAMP3+ DCs may contribute to the anti-tumor immune response of neoadjuvant 572
chemoimmunotherapy. We also explored the possible mechanisms by which LAMP3+ DCs 573
regulates lymphocytes through multi-pair L-R interaction analysis, and predicted that LAMP3+ 574
DCs may participate in the recruitment, activation and regulation of B cells, Tregs, CD4+ and 575
CD8+ T cells through the CCL22/CCR4, CCL19/CCR7, PD1/PD-L1, and PD1/PD-L2 axes, and 576
exhibit regulation ability towards NK/NKT cells via CD226/NECTIN2 and TIGIT/NECTIN2 577
pathways, illustrating a potential role for LAMP3+
DCs in immunotherapy. However, due to the 578
complex co-expression of activated and inhibitory molecules, further studies are needed to 579
validate these findings. 580
Taken together, our extensive immune single-cell RNA-seq and TCR-seq landscape provide 581
novel insights into the cellular mechanisms of underlying the synergistic interaction in clinical 582
responses to neoadjuvant chemoimmunotherapy. Of note, our study predicted a potential role for 583
IL-21 in B cells activation and class switching to anti-tumor IgG1 and IgG3 isotype. Based on this 584
discovery, IL-21 combined with ICIs may enhance antitumor immunity. Moreover, the detection 585
of IL-21 in peripheral blood plasma is non-invasive, convenient and feasible, and can be used as a 586
potential predictor of clinical response to neoadjuvant chemoimmunotherapy, or even to monitor 587
the efficacy of chemoimmunotherapy in advanced NSCLC. Pre-therapy peripheral blood T cell 588
diversity is also a good predictor of clinical response, and detection of TCR diversity before 589
treatment can help identify patients who will respond to chemoimmunotherapy. Given that 590
anti-PD-1 therapy could promote clonal replenishment from periphery to improve the exhausted 591
and dysfunctional state of intratumoral CD8+ T cells, the combination of adoptive cell transfer 592
therapy (ACT) with anti-PD-1 therapy could be used to improve overall immunocompetence and 593
tumor immune responsiveness. Our published randomized, multicenter, open-label trial of ACT 594
plus chemotherapy in patients with untreated advanced squamous NSCLC has showed that the 595
addition of ACT to standard chemotherapy significantly prolonged PFS and OS compared with 596
chemotherapy alone51
. Furthermore, clearance or inhibition of activated immunosuppressive 597
TNFRSF4+
Tregs in tumors can also improve the therapeutic response. Limitations of this study 598

21
include, but are not limited to, the relatively small number of patients enrolled, incomplete 599
samples for some patients and not reached longer follow-up for OS and PFS benefit. Further 600
studies are needed to verify the potential predictive factors and strategy for enhancing the clinical 601
outcome of combination immunotherapy and chemotherapy. 602
603
Methods 604
Patient cohorts. 605
Twelve patients who were diagnosed with stage ⅢA NSCLC were enrolled in the scRNA-seq 606
analysis, including four treatment-naïve and eight neoadjuvant pembrolizumab and chemotherapy 607
patients, with five adenocarcinoma and seven squamous cell carcinoma patients. The basic 608
clinicopathological characteristics of these patients are summarized in Supplementary Table S2. 609
Surgical tumor tissues and paired adjacent non-cancer tissues and LNs from an additional 26 610
treatment-naïve ⅢA NSCLC and 30 neoadjuvant pembrolizumab and chemotherapy ⅢA/ⅢB 611
NSCLC patients were used to perform mIHC to validate the findings identified in the scRNA-seq 612
profiles (Validation cohorts). This study was approved by the Ethics Committee of Tianjin 613
Medical University Cancer Institutes and Hospital (NO.: bc2020060), and conformed to the 614
Declaration of Helsinki and Good Clinical Practice guidelines. Informed consent was obtained 615
from all patients. 616
For the patients included in the neoadjuvant pembrolizumab and chemotherapy group, none 617
of the patients had autoimmune disease, interstitial lung disease or prior cancer history. No 618
ongoing glucocorticoid or immunosuppressant usage. No previous treatment of checkpoint 619
inhibitors or other drug that target T-cell co-stimulation or immune checkpoint pathways. Patients 620
with acute or chronic hepatitis virus infection or active tuberculosis were also excluded. The 621
included patients received neoadjuvant treatment with intravenous pembrolizumab (at a dose of 2 622
mg per kilogram of body weight) on day 1, paclitaxel 175mg/m2 for squamous cell carcinoma, or 623
pemetrexed 500 mg/m2
for adenocarcinoma plus carboplatin (area under curve 5; 5 mg/mL per 624
min) on day 1, 21 days each cycle, for two cycles before surgical resection, and then followed by 625
two cycles after surgical resection. 626
Clinical sample collection and preparation. 627
The fresh NSCLC tumors and matched adjacent non-cancer tissues, regional draining lymph 628

22
nodes and distal normal lung tissues, as well as pre- and post-treatment peripheral blood, were 629
obtained for subsequent CD45+ immune cells isolation. The adjacent non-cancer tissues were 630
defined as 1-2 cm from the matched tumor tissues. Distal normal lung tissues were sampled 10–15 631
cm from tumor margin of surgically-resected specimens. Post-treatment venous blood was taken 632
prior to surgery and other tissues were collected in 1640 medium (Gibco, Cat# 11875085) within 5 633
minutes after bulk tumor resection and placed on ice. 634
Peripheral blood mononuclear cells (PBMCs) were isolated by ficoll density separation using 635
HISTOPAQUE-1077 (Sigma-Aldrich, Cat# 10771) solution according to the manufacturer 636
instructions. Specifically, 10ml pre- and post-treatment were collected in EDTA anticoagulant 637
tubes, centrifuged at 2000 rpm/min for 10 min. The upper plasma was partitioned and stored at 638
-80℃, lower cell precipitates were diluted with DPBS (no calcium, no magnesium, Gibco, Cat# 639
14190-136) and subsequently layered onto HISTOPAQUE-1077. After centrifugation, immune 640
cells remaining at the DPBS-HISTOPAQUE-1077 interface were carefully transferred to a new 641
tube and washed twice with 1× DPBS. Then, these immune cells were diluted with 10 volumes of 642
1× red blood cell lysis solution (Miltenyi, Cat# 130-094-183), vortex for 5 seconds and incubate 643
for 10 minutes at room temperature. Centrifuged at 300g for 10 minutes, aspirated supernatant 644
completely and the cell pellet were resuspended in sorting buffer (DPBS supplemented with 0.5% 645
BSA) and proceeded to 10× Genomics. 646
Fresh tumor, adjacent non-cancer tissues, regional draining lymph nodes, and distal normal 647
lung tissues were cut into approximately 1-3mm³ pieces and in the RPMI-1640 medium (Gibco, 648
Cat# 11875085) with 10% fetal bovine serum (FBS; Gibco, Cat# 12484028). The pieces were 649
transferred to the gentle MACS C Tubes (Miltenyi Biotec, Cat# 130-096-334), with 5 mL of 650
digestive enzyme included in Tumor Dissociation Kit (Miltenyi Biotec, Cat# 130-095-929). Then 651
the tissues were made into single-cell suspension using the gentleMACS Dissociator (Miltenyi 652
Biotec, Cat# 130096427) for 60 min on a rotor at 37℃ according to the manufacturer’s 653
instructions. After filtered by 70 um Cell-Strainer (BD Falcon, Cat# 352350) in the RPMI-1640 654
medium, the suspended cells were centrifuged at 300 g for 10 min. After removing the supernatant, 655
the pelleted cells were suspended in 1× red blood cell lysis solution (Miltenyi, Cat# 130-094-183), 656
votex for 5 seconds and incubated at room temperature for 2 min to lyse red blood cells. Dead cell 657
and cellular debris were magnetic removed using Dead Cell Removal Kit (Miltenyi Biotec, Cat# 658

23
130-090-101). The effluent live cell fraction was centrifuged at 300 g for 10 min. The cell pellets 659
were re-suspended in sorting buffer (DPBS supplemented with 0.5% BSA) after washing twice 660
with DPBS. CD45+ immune cells were obtained by positive magnetic cell sorting using CD45
+ 661
cell isolation beads (CD45 MicroBeads, human, Miltenyi Biotec, Cat# 130-045-801) according to 662
the manufacturer’s instructions. CD45+ immune cells were centrifuged at 300 g for 10 min, 663
resuspended and stained with 0.4% Trypan blue (Gibco, Cat# 15250061) to check the viability, 664
adjusted cell concentration to 700-1200 cells/μL for 10× Genomics single cell sequencing. 665
Library construction for single-cell RNA sequencing and TCR profiling. 666
Cell suspensions (700-1200 living cells/μL determined by trypan blue staining) were loaded on 667
a 10x Genomics ChromiumTM Single Cell Controller Instrument (10x Genomics, Pleasanton, CA, 668
USA) to generate single-cell gel beads in emulsions (GEMs) by using Chromium Single Cell 5' 669
Library & Gel Bead Kit v1.0 (10x Genomics, Cat# 1000006) and Single Cell A Chip Kit (10x 670
Genomics, Cat# 1000152). Captured cells were lysed and the released RNA was barcoded through 671
reverse transcription in individual GEM. Barcoded cDNAs were pooled and cleanup by using 672
DynaBeads MyOne Silane Beads (Thermo Fisher, Cat# 37002D), and then amplified and cleanup 673
for further next generation library construction. Single-cell RNA-seq libraries were prepared using 674
Chromium Single Cell 5' Library & Gel Bead Kit v1.0 (10x Genomics, Cat# 1000006) and i7 675
Multiplex Kit (10x Genomics, Cat# 120262), following the manufacturer’s instructions. 676
TCR libraries were prepared using Chromium Single Cell V(D)J Enrichment Kit, Human T 677
Cell (10x Genomics, Cat# 1000005), Chromium Single Cell 5′ Library Construction Kit (10x 678
Genomics, Cat# 1000020) and i7 Multiplex Kit (10x Genomics, Cat# 120262), following the 679
manufacturer’s instructions. Sequencing was performed on an Illumina HiSeq X Ten (Illumina, 680
San Diego, CA, USA) with pair end 150bp (PE150). 681
scRNA analysing 682
When we completed libraries sequencing by using HiSeq X, Cell Ranger 3.1.0 was used to 683
generate the gene expression matrix, and then Seurat (version 3.2.1) was used to identify major 684
cell types and their subtypes. We extracted valid barcodes and valid UMIs, mapping reads to the 685
reference (HG38),and estimated the number of cells, mean reads per cell, median genes per cell. 686
After generating the gene expression matrix, we filtered the cell-identifying barcodes to avoid 687
dead cells and other artifacts with Seurat. Briefly, we filter out cells with less than 200 or more 688

24
than 6000 genes detected per cell, or with less than 1000 UMI, or with more than 10% 689
mitochondrial genes. We used the FindIntegrationAnchors (MNN algorithm) function in the 690
Seurat package to correct the batching effect between samples52
. The final expression table 691
contained 186,477 cells. 692
Unsupervised clustering, DEGs and pathway analysis. 693
We used the Seurat package for unsupervised clustering of cells based on gene expression 694
profiles and passed it to UMAP for cluster visualization53
. Specifically, the method embeds cells 695
into a graph structure, such as a K-nearest neighbor graph (KNN), draws edges between cells with 696
similar patterns of feature expression, and then attempts to divide this graph into highly 697
interconnected 'communities'. Similar to the PhenoGraph, the KNN graph was firstly constructed 698
based on Euclidean distance in PCA space, and the edge weights between any two cells were 699
refined based on the Jaccard similarity shared by local neighborhood. To cluster these cells, we 700
then apply modular optimization techniques such as the Louvain algorithm or SLM54
to iteratively 701
group the units together with the goal of optimizing standard modular functions. Cells were 702
displayed on a two-dimensional UMAP plane, and clusters were identified and annotated 703
according to the marker genes. We used 'FindMarkers' and 'FindAllMarkers' functions in Seurat to 704
identify DEGs. Go analysis was performed for the biological process enrichment of DEGs in each 705
cluster or subset. 706
Cell similarity analysis between tumors and other tissues 707
To investigate the potential source of tumor infiltrating immune cells, we used Circos-0.69-9 708
software to project the matching cell types between tumors and other relevant tissues as well as 709
the cell composition across tissues. First, we calculated the percentage of each cell type in each 710
tissue according to the cell number of seven major immune cell types (including NK/NKT, CD4, 711
CD8, Tregs, B cells, plasma cells and myeloid cells) in tumors and five relevant tissues. This 712
percentage was represented by sectors in the graph. Then, matching cell types is connected with a 713
cord, and the color of the cord represents the different cell types. The different colors of the outer 714
ring indicate the six different tissues. 715
Gene signatures 716
The CXCL13, Tfh, TLS signatures were derived from a review recently published by 717
Sautes-Fridman et al23
. Genes included in the Tfh signature are CXCL13, CD200, FBLN7, ICOS, 718

25
SGPP2, SH2D1A, TIGIT, and PDCD1. Genes included in the 12-chemokine signature for 719
detection of TLS are CCL2, CCL3, CCL4, CCL5, CCL8, CCL18, CCL19, CCL21, CXCL9, 720
CXCL10, CXCL11, and CXCL13. According to the therapeutic response, the samples were 721
divided into naive, non-MPR and MPR groups. The differentially expressed genes of each group 722
in tumor and non-tumor cells were calculated to get the list of differentially expressed genes. The 723
list of differentially expressed genes was sorted in descending order according to the avg_logFC 724
value to form the sorted gene list. The predefined gene set (signature) was selected for GESA 725
analysis using R packet clusterProfiler. The result was the enrichment of the signature in the sorted 726
Genelist. The result indicators included: ES: enrichment score; When ES value is greater than 0, it 727
means that a certain functional gene is enriched in the front of the sorted Genelist; if ES value is 728
less than 0, it means that a certain functional gene is enriched in the back of the sorted Genelist. 729
The higher ES value is, the more enriched these genes are in the pathway. NES: Enrichment score 730
after correction, P value was smaller, indicating better gene enrichment. GSEA analysis was 731
performed on the 3 signature gene sets in different therapeutic groups, and heat maps were drawn 732
according to the enrichment score results (NES). Padj > 0.05 in the enrichment pathway was 733
adjusted to 0 to draw the heat map. 734
Putative interactions between cell clusters. 735
CellPhoneDB (Version 2.0) was used to perform systematic analysis of cell-cell 736
communications55
. It scores L-R pairs based on p-values of the mean score. Briefly, we looked for 737
the cell-type specific L-R interactions to identify the most relevant interactions between cell types. 738
Only receptors and ligands expressed in more than 10% of the cells in the specific cluster were 739
considered significant. We did pairwise comparisons for all cell types. First, we randomly 740
arranged the cluster genes of all cells 1000 times to determine the mean receptor expression level 741
of a cluster and the mean ligand expression level of the interacting cluster. For multimeric 742
receptors and/or ligands, we required that all subunits of the complex are expressed, and we used 743
the minimum average expression member of the complex to perform the random shuffling. This 744
produces a null distribution for each ligand -receptor pair in each pairwise comparison between 745
two clusters. By calculating the proportion of means that were equal to or above the actual mean, 746
we obtained a p-value for the likelihood of cell type specificity for a given receptor-ligand 747
complex. We then prioritized the interactions based on the number of important L-R pairings 748

26
between clusters, and manually selected the biologically relevant ones. 749
Shared clonotypes between tissues 750
TCR clone data were collected according to CD4 and CD8 clusters, respectively. We obtained 751
33,907 CD4+ T cells and 59,174 CD8
+ T cells, of which 73.76% of CD4
+ T cells and 52.16% of 752
CD8+ T cells had TCR sequenced, respectively. Shared TCR clonotypes between tissues were 753
defined as TCRs with the same complementarity-determining region 3 (CDR3) nucleotide 754
sequences. The TCR clone data were divided into P0, P1, D, N, T, and LN groups according to the 755
sample tissue type, and we used the R package VennDiagram to draw the Venn diagram and see 756
the overlap between different tissue types. 757
Diversity and clonality of CD4+ and CD8
+ T cells 758
The diversity of the TCR repertoire was calculated based on the Shannon–Wiener index 759
(Shannon index), which is a function of both the relative number of clonotypes present and the 760
relative abundance or distribution of each clonotype. The Shannon index is calculated as follows. 761
Shannon index = − ∑ 𝑛𝑖𝑁 𝑙𝑔 𝑛𝑖𝑁𝑖 762
In the Shannon index, ni is the clonal size of the ith clonotype (i.e., the number of copies of a 763
specific clonotype), and N is the total number of TCR receptor sequences analyzed. 764
The clonality is calculated according to the formula: 765
Clonality = 1 − − ∑ 𝑝𝑖𝑙𝑜𝑔2(𝑝𝑖)𝑁𝑖=1𝑙𝑜𝑔2(𝑁) 766
Where pi is the proportional abundance of the rearrangement i, and N is the total number of TCR 767
receptor sequences analyzed. 768
Multiplex immunohistochemistry staining and TLS quantification 769
Multiplex fluorescent staining was obtained using Opal 7-Color Manual IHC Kit 770
(PerkinElmer, Cat# NEL811001KT) according to manufacturer’s instruction. The primary 771
antibodies and IHC metrics were: rabbit monoclonal anti-human CD4 antibody (Abcam, Cat# 772
ab133616, diluted at 1:1000), rabbit monoclonal anti-human CD20 antibody (Abcam, Cat# 773
ab78237, diluted at 1:2000), mouse monoclonal anti-human IgG antibody (Abcam, Cat# ab200699, 774
diluted at 1:800), rabbit polyclonal anti-human IL-21 antibody (Invitrogen, Cat# PA5-34801, 775
diluted at 1:2000), mouse monoclonal anti-human CD21 antibody (Invitrogen, Cat# MA5-11417, 776
diluted at 1:200), mouse monoclonal anti-human FoxP3 antibody (Abcam, Cat# ab20034, diluted 777

27
at 1:500), rabbit monoclonal anti-human IgG1 antibody (Abcam, Cat# ab108969, diluted at 778
1:1000), rabbit monoclonal anti-human IgG3 antibody (Abcam, Cat# ab193172, diluted at 1:800), 779
recombinant rabbit monoclonal anti-human IgA antibody (Invitrogen, Cat# MA5-32575, diluted at 780
1:800). The slides were microwave heat-treated after each tyramide signal amplification operation. 781
Nuclei were stained with DAPI after all the antigens above had been labeled. To obtain 782
multispectral images, the stained slides were scanned using t the Mantra System (PerkinElmer) 783
following the manufacturer’s instructions to generate .im3 image cubes for downstream analysis. 784
To analyze the spectra for all fluorophores included, inForm image analysis software (v2.4.4; 785
PerkinElmer) was used. For each slide, 10 fields of immune cell enriched area were selected for 786
image capture. 787
For TLS quantification, the stained slides were panoramic scanned and visualized using the 788
TissueFAXSi-plus imaging system (TissueGnostics, Vienna, Austria; acquisition software: 789
TissueFAXS v7.0.6245) equipped with a digital Pixelink colour camera (PCO AG). Multispectral 790
images were analyzed with StrataQuest software v7.0.1.165 (TissueGnostics). Structures were 791
identified as aggregates of lymphocytes having histological features with analogous structures to 792
that of lymphoid tissue with germinal centers (including B cells (CD20), T cells (CD4/CD8), and 793
follicular dendritic cells (CD21), appearing in the tumor area. TLS density is defined as the total 794
number of structures identified either within the tumoral area or in direct contact with the tumoral 795
cells on the margin of the tumors (numbers of TLS per mm2 area). 796
Plasma IL-21 ELISA 797
Plasma IL-21 levels were detected by Human IL-21 Uncoated ELISA kits with standard 798
curve range 8-1000 pg/ml (Invitrogen, Cat# 88-8218-22) following the manufacturer’s 799
instructions. Optical densities were measured at 450 nm. Statistical analysis was performed by 800
Excel and GraphPad Prism (Version 8.0.1, GraphPad Software, La Jolla, California). 801
Flow cytometry. 802
Human PBMC and single cell suspensions prepared from fresh tumor and matched tissues 803
were used for flow cytometry analysis. We took two parts of cells from PBMC and single cell 804
suspensions, with one being used to detect the expression of IL-21 and Tregs and the other being 805
used to detect LAMP3+
DCs. Then, one part (1-2 million) cells were co-culture with Leukocyte 806
Activation Cocktail, with BD GolgiPlug™(BD Biosciences, Cat# 550583) in a 37°C humidified 807

28
CO2 incubator for 4-6 hr according to the manual. Following activation, cells were harvested and 808
washed with FACS Buffer. Then cell surface staining was performed in FACS buffer containing 809
antibody cocktails (Brilliant Violet 510 anti-human CD45, Biolegend, Cat# 304035; FITC 810
anti-human CD4, Biolegend, Cat# 317408; PE-Cy7 anti-human CD8, BD Biosciences, Cat# 811
557654; PE anti-human CD25, Biolegend, Cat# 302606; PerCP/Cy5.5 anti-human 812
CD127(IL-7Rα), Biolegend, Cat# 351322; APC-Cy7 anti-human CD19, Biolegend, Cat# 302217) 813
at room temperature for 30 min. After washing twice with FACS buffer, the cells were fixed using 814
a FoxP3/Transcription Staining Buffer Set (eBioscience™ Foxp3/Transcription Factor Staining 815
Buffer Set, Cat# 00-5523) according to the manufacturer’s instructions. Cells were washed twice 816
with 1 x permeabilization buffer (eBioscience, Cat# 00-8333), and then intracellularly stained with 817
FoxP3 (Alexa Fluor 647 anti-human FOXP3, Biolegend, Cat# 320114) and IL-21 (Brilliant Violet 818
421 anti-human IL-21, BD Biosciences, Cat# 564755). Another part (1 million) cells were stained 819
with Brilliant Violet 510 anti-human CD45 (Biolegend, Cat# 304035), PE anti-human LAMP3 820
(BD Biosciences, Cat# 556020), PE-DazzleTM
594 anti-human CD11c (Biolegend, Cat# 301641). 821
Cells were washed twice with wash buffer and then analyzed on the BD-Aria II flow cytometer 822
(BD Biosciences, San Diego, CA, USA) and analyzed using FlowJo software (Version 10.1, 823
FlowJo LLC, Ashland, OR, USA). 824
825
826
827
828
829
830
831
832
833
834
835
836
837

29
References 838
1. Siegel, R.L., Miller, K.D. & Jemal, A. Cancer statistics, 2020. CA: a cancer journal for 839
clinicians 70, 7-30 (2020). 840
2. Ramnath, N., et al. Treatment of stage III non-small cell lung cancer: Diagnosis and 841
management of lung cancer, 3rd ed: American College of Chest Physicians 842
evidence-based clinical practice guidelines. Chest 143, e314S-e340S (2013). 843
3. Pignon, J.P., et al. Lung adjuvant cisplatin evaluation: a pooled analysis by the LACE 844
Collaborative Group. Journal of clinical oncology : official journal of the American 845
Society of Clinical Oncology 26, 3552-3559 (2008). 846
4. Wakelee, H.A., et al. Adjuvant chemotherapy with or without bevacizumab in patients 847
with resected non-small-cell lung cancer (E1505): an open-label, multicentre, randomised, 848
phase 3 trial. The Lancet. Oncology 18, 1610-1623 (2017). 849
5. Forde, P.M., et al. Neoadjuvant PD-1 Blockade in Resectable Lung Cancer. The New 850
England journal of medicine 378, 1976-1986 (2018). 851
6. Cloughesy, T.F., et al. Neoadjuvant anti-PD-1 immunotherapy promotes a survival benefit 852
with intratumoral and systemic immune responses in recurrent glioblastoma. Nat Med 25, 853
477-486 (2019). 854
7. Huang, A.C., et al. A single dose of neoadjuvant PD-1 blockade predicts clinical 855
outcomes in resectable melanoma. Nat Med 25, 454-461 (2019). 856
8. Parra, E.R., et al. Effect of neoadjuvant chemotherapy on the immune microenvironment 857
in non-small cell lung carcinomas as determined by multiplex immunofluorescence and 858
image analysis approaches. Journal for immunotherapy of cancer 6, 48 (2018). 859
9. Provencio, M., et al. Neoadjuvant chemotherapy and nivolumab in resectable 860
non-small-cell lung cancer (NADIM): an open-label, multicentre, single-arm, phase 2 861
trial. The Lancet. Oncology 21, 1413-1422 (2020). 862
10. Shu, C.A., et al. Neoadjuvant atezolizumab and chemotherapy in patients with resectable 863
non-small-cell lung cancer: an open-label, multicentre, single-arm, phase 2 trial. The 864
Lancet. Oncology 21, 786-795 (2020). 865
11. Chen, Y., et al. Neoadjuvant chemoimmunotherapy in resectable stage IIIA/IIIB 866
non-small cell lung cancer. Translational lung cancer research 10, 2193-2204 (2021). 867

30
12. Travis, W.D., et al. IASLC Multidisciplinary Recommendations for Pathologic 868
Assessment of Lung Cancer Resection Specimens After Neoadjuvant Therapy. Journal of 869
thoracic oncology : official publication of the International Association for the Study of 870
Lung Cancer 15, 709-740 (2020). 871
13. van der Woude, L.L., Gorris, M.A.J., Halilovic, A., Figdor, C.G. & de Vries, I.J.M. 872
Migrating into the Tumor: a Roadmap for T Cells. Trends in cancer 3, 797-808 (2017). 873
14. Tokunaga, R., et al. 12-Chemokine signature, a predictor of tumor recurrence in 874
colorectal cancer. International journal of cancer 147, 532-541 (2020). 875
15. Choi, Y.S., et al. LEF-1 and TCF-1 orchestrate T(FH) differentiation by regulating 876
differentiation circuits upstream of the transcriptional repressor Bcl6. Nature immunology 877
16, 980-990 (2015). 878
16. Cabrita, R., et al. Tertiary lymphoid structures improve immunotherapy and survival in 879
melanoma. Nature 577, 561-565 (2020). 880
17. Helmink, B.A., et al. B cells and tertiary lymphoid structures promote immunotherapy 881
response. Nature 577, 549-555 (2020). 882
18. Petitprez, F., et al. B cells are associated with survival and immunotherapy response in 883
sarcoma. Nature 577, 556-560 (2020). 884
19. Ricard, L., et al. Circulating follicular helper T cells are increased in systemic sclerosis 885
and promote plasmablast differentiation through the IL-21 pathway which can be 886
inhibited by ruxolitinib. Annals of the rheumatic diseases 78, 539-550 (2019). 887
20. Long, D., Chen, Y., Wu, H., Zhao, M. & Lu, Q. Clinical significance and immunobiology 888
of IL-21 in autoimmunity. Journal of autoimmunity 99, 1-14 (2019). 889
21. Hollern, D.P., et al. B Cells and T Follicular Helper Cells Mediate Response to 890
Checkpoint Inhibitors in High Mutation Burden Mouse Models of Breast Cancer. Cell 891
179, 1191-1206.e1121 (2019). 892
22. Yang, Z., Wu, C.M., Targ, S. & Allen, C.D.C. IL-21 is a broad negative regulator of IgE 893
class switch recombination in mouse and human B cells. The Journal of experimental 894
medicine 217(2020). 895
23. Sautès-Fridman, C., Petitprez, F., Calderaro, J. & Fridman, W.H. Tertiary lymphoid 896
structures in the era of cancer immunotherapy. Nature reviews. Cancer 19, 307-325 897

31
(2019). 898
24. Siliņa, K., et al. Germinal Centers Determine the Prognostic Relevance of Tertiary 899
Lymphoid Structures and Are Impaired by Corticosteroids in Lung Squamous Cell 900
Carcinoma. Cancer research 78, 1308-1320 (2018). 901
25. Yost, K.E., et al. Clonal replacement of tumor-specific T cells following PD-1 blockade. 902
Nat Med 25, 1251-1259 (2019). 903
26. Siddiqui, I., et al. Intratumoral Tcf1(+)PD-1(+)CD8(+) T Cells with Stem-like Properties 904
Promote Tumor Control in Response to Vaccination and Checkpoint Blockade 905
Immunotherapy. Immunity 50, 195-211.e110 (2019). 906
27. Yano, H., Andrews, L.P., Workman, C.J. & Vignali, D.A.A. Intratumoral regulatory T 907
cells: markers, subsets and their impact on anti-tumor immunity. Immunology 157, 908
232-247 (2019). 909
28. Guo, X., et al. Global characterization of T cells in non-small-cell lung cancer by 910
single-cell sequencing. Nat Med 24, 978-985 (2018). 911
29. Plitas, G., et al. Regulatory T Cells Exhibit Distinct Features in Human Breast Cancer. 912
Immunity 45, 1122-1134 (2016). 913
30. Bhairavabhotla, R., et al. Transcriptome profiling of human FoxP3+ regulatory T cells. 914
Human immunology 77, 201-213 (2016). 915
31. Grinberg-Bleyer, Y., et al. NF-κB c-Rel Is Crucial for the Regulatory T Cell Immune 916
Checkpoint in Cancer. Cell 170, 1096-1108.e1013 (2017). 917
32. van Beek, A.A., et al. GITR ligation enhances functionality of tumor-infiltrating T cells in 918
hepatocellular carcinoma. International journal of cancer 145, 1111-1124 (2019). 919
33. Gardner, A. & Ruffell, B. Dendritic Cells and Cancer Immunity. Trends in immunology 37, 920
855-865 (2016). 921
34. Patidar, M., Yadav, N. & Dalai, S.K. Interleukin 15: A key cytokine for immunotherapy. 922
Cytokine & growth factor reviews 31, 49-59 (2016). 923
35. Bergamaschi, C., et al. Heterodimeric IL-15 delays tumor growth and promotes 924
intratumoral CTL and dendritic cell accumulation by a cytokine network involving XCL1, 925
IFN-γ, CXCL9 and CXCL10. Journal for immunotherapy of cancer 8(2020). 926
36. Sugiura, D., et al. Restriction of PD-1 function by cis-PD-L1/CD80 interactions is 927

32
required for optimal T cell responses. Science 364, 558-566 (2019). 928
37. Sharonov, G.V., Serebrovskaya, E.O., Yuzhakova, D.V., Britanova, O.V. & Chudakov, 929
D.M. B cells, plasma cells and antibody repertoires in the tumour microenvironment. 930
Nature reviews. Immunology 20, 294-307 (2020). 931
38. Park, K.H., Seo, G.Y., Jang, Y.S. & Kim, P.H. TGF-β and BAFF derived from 932
CD4+CD25+Foxp3+ T cells mediate mouse IgA isotype switching. Genes & genomics 34, 933
619-625 (2012). 934
39. Xu, Y., et al. IL-21 enhances STAT3/Blimp-1 signaling pathway in B cells and contributes 935
to plasma cell differentiation in newly diagnosed patients with myasthenia gravis. 936
Immunologic research 69, 59-70 (2021). 937
40. Avery, D.T., Bryant, V.L., Ma, C.S., de Waal Malefyt, R. & Tangye, S.G. IL-21-induced 938
isotype switching to IgG and IgA by human naive B cells is differentially regulated by 939
IL-4. Journal of immunology (Baltimore, Md. : 1950) 181, 1767-1779 (2008). 940
41. Zhang, J., et al. Compartmental Analysis of T-cell Clonal Dynamics as a Function of 941
Pathologic Response to Neoadjuvant PD-1 Blockade in Resectable Non-Small Cell Lung 942
Cancer. Clinical cancer research : an official journal of the American Association for 943
Cancer Research 26, 1327-1337 (2020). 944
42. Han, J., et al. TCR Repertoire Diversity of Peripheral PD-1(+)CD8(+) T Cells Predicts 945
Clinical Outcomes after Immunotherapy in Patients with Non-Small Cell Lung Cancer. 946
Cancer immunology research 8, 146-154 (2020). 947
43. Ohue, Y. & Nishikawa, H. Regulatory T (Treg) cells in cancer: Can Treg cells be a new 948
therapeutic target? Cancer science 110, 2080-2089 (2019). 949
44. Liu, Y., et al. Tumour heterogeneity and intercellular networks of nasopharyngeal 950
carcinoma at single cell resolution. Nature communications 12, 741 (2021). 951
45. Lai, C., et al. OX40+ Regulatory T Cells in Cutaneous Squamous Cell Carcinoma 952
Suppress Effector T-Cell Responses and Associate with Metastatic Potential. Clinical 953
cancer research : an official journal of the American Association for Cancer Research 22, 954
4236-4248 (2016). 955
46. Ma, Y., et al. Combination of PD-1 Inhibitor and OX40 Agonist Induces Tumor Rejection 956
and Immune Memory in Mouse Models of Pancreatic Cancer. Gastroenterology 159, 957

33
306-319.e312 (2020). 958
47. Garris, C.S., et al. Successful Anti-PD-1 Cancer Immunotherapy Requires T 959
Cell-Dendritic Cell Crosstalk Involving the Cytokines IFN-γ and IL-12. Immunity 49, 960
1148-1161.e1147 (2018). 961
48. Zhang, Q., et al. Landscape and Dynamics of Single Immune Cells in Hepatocellular 962
Carcinoma. Cell 179, 829-845.e820 (2019). 963
49. Nishimura, J., et al. Impact of tumor-infiltrating LAMP-3 dendritic cells on the prognosis 964
of esophageal squamous cell carcinoma. Esophagus : official journal of the Japan 965
Esophageal Society 16, 333-344 (2019). 966
50. Cheng, S., et al. A pan-cancer single-cell transcriptional atlas of tumor infiltrating 967
myeloid cells. Cell 184, 792-809.e723 (2021). 968
51. Liu, L., et al. Randomized, multicenter, open-label trial of autologous cytokine-induced 969
killer cell immunotherapy plus chemotherapy for squamous non-small-cell lung cancer: 970
NCT01631357. Signal transduction and targeted therapy 5, 244 (2020). 971
52. Stuart, T., et al. Comprehensive Integration of Single-Cell Data. Cell 177, 972
1888-1902.e1821 (2019). 973
53. Satija, R., Farrell, J.A., Gennert, D., Schier, A.F. & Regev, A. Spatial reconstruction of 974
single-cell gene expression data. Nature biotechnology 33, 495-502 (2015). 975
54. Blondel, V.D., Guillaume, J.L., Lambiotte, R. & Lefebvre, E. Fast unfolding of 976
communities in large networks. Journal of Statistical Mechanics Theory & Experiment 977
(2008). 978
55. Efremova, M., Vento-Tormo, M., Teichmann, S.A. & Vento-Tormo, R. CellPhoneDB: 979
inferring cell-cell communication from combined expression of multi-subunit 980
ligand-receptor complexes. Nature protocols 15, 1484-1506 (2020). 981
982
983
984
985
986
987

34
Figures and Figure legends 988
989
Figure 1. Clustering and dominant immune cells associated with neoadjuvant response. 990
a, Flow chart of the overall study design (Figure created with biorender.com.). CD45+
immune 991
cells derived from tumor tissues (T) and five immune-relevant sites (peripheral blood 992

35
mononuclear cells before and after neoadjuvant therapy (hereafter we called P0 and P1), distal 993
normal tissues (D), nearest non-cancer tissues (N), regional draining lymph nodes (LN)) were 994
applied to Single-cell transcriptome/TCR sequencing. b. The UMAP projection of 186,477 cells 995
from 12 patients, showing the formation of 29 main clusters, including 2 for NK/NKT cells, 3 for 996
B cells and plasma cells, 3 for CD4+
T cells, 6 for CD8+ T cells, 8 for myeloid clusters and 2 997
cycling cells. Each dot corresponds to one single cell, colored according to cell cluster. c. 998
Neoadjuvant patient categories according to their pathologic response, with 4 patients in MPR and 999
4 patients in non-MPR groups. d. UMAP displaying of the immune cell composition in 1000
treatment-naïve, non-MPR and MPR tumor tissues. e. Comparison of major immune cell 1001
proportions in treatment-naïve, non-MPR and MPR tumor tissues. f. Circos showing cell 1002
similarity analysis between tumor and other tissues of 8 neoadjuvant patients. The immune cells in 1003
MPR tumor lesions were more similar to those in other tissues than non-MPR. * p<0.05; *** 1004
p<0.001; ns: not significant. UMAP, uniform manifold approximation and projection; MPR, major 1005
pathological response. 1006

36
1007
Figure 2. B cells and their class switching to IgG mediated neoadjuvant response. 1008
a, b. Comparison of CD19+ B cells in tumor, nearest non-cancer tissues (N), LNs and P1 in 1009
different treatment group by Flow cytometry. CD19+ B cells were much abundant in tumor lesions 1010
of MPR patients, but there was no statistically significant difference in P1, nearest non-cancer 1011
tissues (N), and LNs. c. The violin plot showing increased IGHG1 and IGHG3, decreased IGHA 1012
expression by C17-plasma cells in neoadjuvant responder tumor lesions. d-f. Multiplex 1013

37
fluorescent IHC (mIHC) staining of surgical tumor tissues showed the density and distribution of 1014
B cells isotypes. Neoadjuvant chemoimmunotherapy promoted more CD20+ B cells infiltration in 1015
tumor tissues. IgG1 and IgG3 were much higher, while IgA was striking reduced in MPR tumor 1016
lesions. * p<0.05; ** p<0.01; *** p<0.001; **** p<0.0001; ns: not significant. 1017
1018
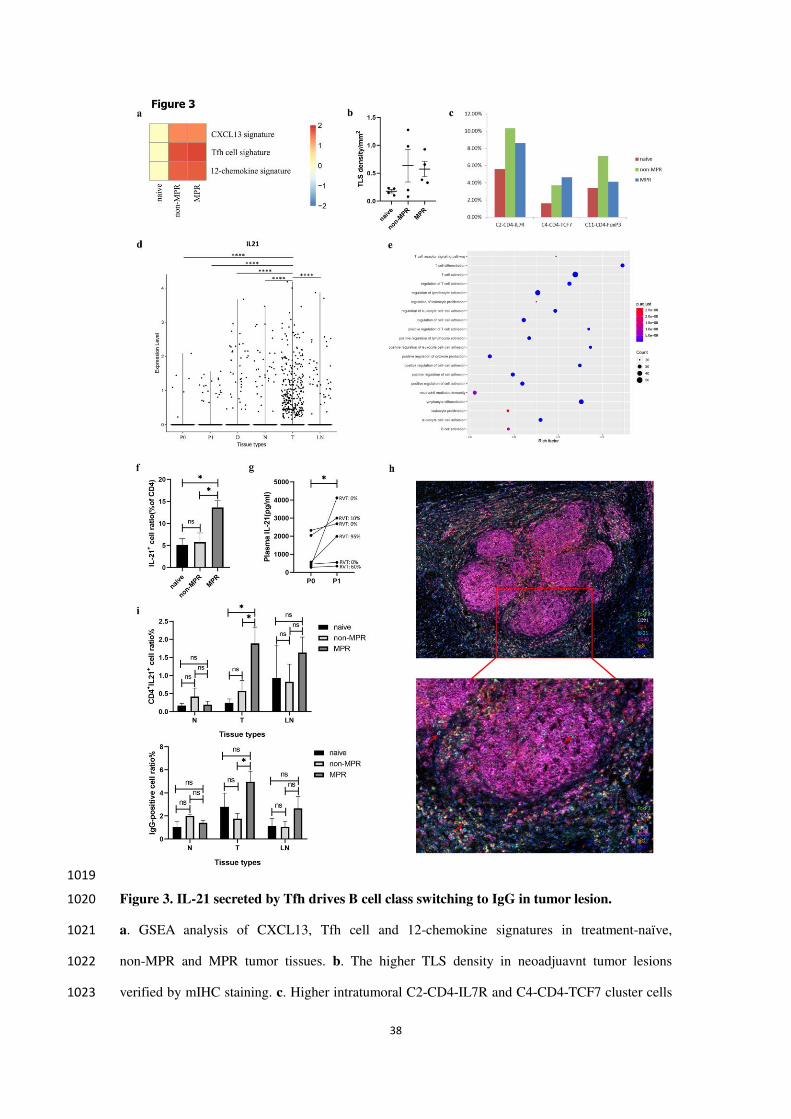
38
1019
Figure 3. IL-21 secreted by Tfh drives B cell class switching to IgG in tumor lesion. 1020
a. GSEA analysis of CXCL13, Tfh cell and 12-chemokine signatures in treatment-naïve, 1021
non-MPR and MPR tumor tissues. b. The higher TLS density in neoadjuavnt tumor lesions 1022
verified by mIHC staining. c. Higher intratumoral C2-CD4-IL7R and C4-CD4-TCF7 cluster cells 1023

39
in neoadjuvant tumor lesions. d. IL21 expression in different tissue types in scRNA profiles 1024
showing that IL21 was most prevalent in tumor tissues. e. Go biological function analysis of the 1025
IL21 expression cells in scRNA profiles. f. Flow cytometry of IL-21 in CD4+ T cells in tumor 1026
tissues. IL-21 was significantly higher in MPR tumor tissues than those in treatment-naive and 1027
non-MPR tumor tissues. g. Comparison of paired plasma IL-21 before and after neoadjuvant 1028
chemoimmunotherapy. Higher IL-21 level was correlated with less residual viable tumor cells 1029
(RVT). h, i. MIHC staining on tumor tissues of the 8 neoadjuvant patients in our study cohort 1030
(image under 10X and 20X), CD4+IL21
+ and IgG-positive cells were much abundant in MPR 1031
tumor tissues. * p<0.05; **** p<0.0001; ns: not significant. GSEA, gene set enrichment analysis; 1032
Tfh, T follicular helper (Tfh) cells; TLS, tertiary lymphoid structure. 1033

40
1034
Figure 4. Pre-therapy peripheral blood TCR diversity and CD8+
T clonal expansion and 1035
their association with neoadjuvant response. 1036
a. Intratumoral TCR diversity analysis by shannon index showing T clonotypes were more diverse 1037
in tumor lesions after neoadjuvant chemoimmunotherapy. b. Heatmap showing the DEGs of CD8+ 1038

41
T cells in treatment-naïve, non-MPR and MPR tumor tissues. The exhausted state of CD8+ T cells 1039
were greatly improved in MPR tumor lesions. c. The volcano map showing the comparison of 1040
DEGs between tumor-resident only T clones and shared T clones with P1 in tumor lesions, the 1041
shared T clones were more cytotoxic, while tumor-resident only T clones were more exhausted. d. 1042
Venn diagram showing the shared clonotype between different tissues, there are more shared 1043
CD8+
T clones than CD4+
T clones between tissues. e. Comparison of the clonality of CD4+
and 1044
CD8+
T cells in different tissue types. The CD8+
T clones were widely expanded in various tissues, 1045
and were more obvious in P1 than P0. f. The line chart showing the changes of the main immune 1046
cell composition in paired P0 and P1 during neoadjuvant chemoimmunotherapy. CD8+ T cells, 1047
especially C3-Cytotoxic CD8+
T cells increased significantly in periphery after neoadjuvant 1048
therapy. g, h. Correlation of peripheral blood TCR diversity before and after therapy and 1049
neoadjuvant therapuetic response. Patients with high TCR diversity at baseline had a favarable 1050
therapy response. DEGs, differentially expressed genes. 1051
1052

42
1053
Figure 5. Diminished TNFRSF4+
Tregs in tumor lesion predict positive therapy response. 1054
a. Comparison of CD4+CD25
+CD127
- Treg cells in different tissue types of treatment-naïve, 1055
non-MPR and MPR groups by flow cytometry. The ratio of CD4+CD25
+CD127
- cells was striking 1056
reduced in MPR tumor lesions. b. The violin of TNFRSF4 expression in C11-Treg cluster of 1057

43
treatment-naïve, non-MPR and MPR patients in scRNA profiles. c. Heatmap showing the DEGs of 1058
C11-Tregs-FoxP3 in treatment-naïve, non-MPR and MPR tumor tissues. d. The volcano map 1059
showing the comparison of DEGs in TNFRSF4+
and TNFRSF4- Treg cells, the TNFRSF4
+ Tregs 1060
were more activated and immunosuppressive. e. Comparison of TNFRSF4 expression in 1061
C11-Tregs-FoxP3 of different tissues showing that the expression of TNFRSF4 was significantly 1062
decreased in P1, the nearest non-tumor tissue (N), tumor tissue (T) and LNs in MPR than 1063
non-MPR patients, and was especially lower in MPR tumor tissues compared with non-MPR 1064
tumor lesions. * p<0.05; ** p<0.01; *** p<0.001; **** p<0.0001; ns: not significant. 1065
1066

44
1067
Figure 6. Characteristics and L-R interactions of DCs and Lymphocytes and their 1068
association with clinical outcome. 1069
a. UMAP plot showing the clusters of DC subsets. Each dot represents a single cell. Color 1070
represents cluster. b. Heatmap showing the DEGs of DC subsets. The maturation markers LAMP3, 1071

45
chemokine and chemokine receptor CCL19, CCR7, and CCL22 were highly expressed in 1072
DC-C3-LAMP3. c. Tissue distribution analysis of the four DC clusters, DC-C3-LAMP3 was 1073
mainly distributed in tumors, LNs and nearest or distal normal tissues, and was rarely seen in 1074
peripheral blood. d. The violin plot showing LAMP3 expression level in treatment-naïve, 1075
non-MPR and MPR patients. e. LAMP3+
DC ratio in tumor tissues detected by flow cytometry. 1076
The proportion of LAMP3+
DC cells was significantly higher in neoadjuvant MPR tumor lesions. f. 1077
L-R based interaction of LAMP3+ DCs and lymphocytes predicted by CellPhone DB. * p<0.05; 1078
**** p<0.0001; ns: not significant. DC, dendritic cell; L-R, ligand-receptor. 1079
1080

46
1081
Figure 7. Increased B cell subclass (IgG1 and IgG3) and CD4+T cells in TLSs and their 1082
association with positive clinical effect in validation cohort 1083
a. Validation cohort: Surgical resected tumor tissues from 26 treatment-naïve ⅢA NSCLC and 30 1084
resectable ⅢA/ⅢB NSCLC who have received two cycles of neoadjuvant pembrolizumab and 1085

47
chemotherapy before surgery. b. Neoadjuvant chemoimmunotherapy promoted more TLSs 1086
formation in non-MPR and MPR tumor lesions in our validation cohort. c, d. MIHC staining of B 1087
cell isotypes, CD4 and IL-21 showing that CD20, IgG1, IgG3, CD4 and IL-21 were significantly 1088
higher in MPR tumor lesions, whereas IgA were much lower in MPR tumor lesions. e. IgG1 and 1089
IgG3 were positively correlated with IL-21 within tumor lesions. f. Plasma IL-21 was significantly 1090
higher in MPR patients than that in treatment-naïve and non-MPR patients in our validation cohort. 1091
* p<0.05; ** p<0.01; *** p<0.001; **** p<0.0001; ns: not significant. 1092
1093

48
1094
Figure 8. Summary of key anti-tumor events occurring during neoadjuvant 1095
chemoimmunotherapy 1096
Neoadjuvant chemoimmunotherapy promotes LAMP3+ DCs aggregation in tumor lesion, and 1097
the increased LAMP3+ DCs acquire tumor antigen, migrate and interact with lymphocytes, and 1098
participate in the activation, recruitment and regulation of T/B lymphocytes through L-R 1099
interactions. Anti-PD-1 therapy reinvigorates the expansion of intratumoral CD4+ T cells and 1100
peripheral cytotoxic CD8+ T clones and promoted CD8
+ T cells migration to tumor tissues to exert 1101
anti-tumor effect. Neoadjuvant chemoimmunotherapy promotes more TLSs formation in NSCLC 1102
tumor tissues. In tumor associated TLSs, IL-21 secreted by Tfh cells promotes B cells class 1103
switching to IgG1 and IgG3 but not IgA to mediate anti-tumor response. IgG1 and IgG3 1104
antibodies bind to Fcγ receptor (FcγR) and trigger ADCC and antibody-mediated phagocytosis 1105
and mediate complement-based cytotoxicity. In addition, the decrease of immunosuppressive IgA+ 1106
B cells and TNFRSF4+ Tregs lead to the repression of immunosuppression during 1107
chemoimmunotherapy. 1108
1109

49
Supplementary Figure legends 1110
Supplementary Figure S1. Single cell profiling of immune cells of lung tumors and relevant 1111
tissues 1112
a. UMAP projection cells from different tissue types. We acquired single-cell transcriptomes on a 1113
total of 186,477 immune cells, with 39,792 from tumor tissues, 34,042 from nearest non-cancer 1114
tissues, 18,577 from regional draining LNs, 27,786 from distal normal tissues, 19,509 from P0 and 1115
46,741 from P1 samples. b. Cluster marker gene showing in UMAP. 1116
Supplementary Figure S2. B cells and their isotypes with therapy response 1117
a, b. Comparison of CD19+ B cell ratio in different tissue types of treatment-naïve, non-MPR and 1118
MPR patients by flow cytometry. c. The Violin plot showing immunoglobulin (Ig) isotypes 1119
expression in C17-plasma cluster in scRNA profiles. * p<0.05; ** p<0.01; **** p<0.0001; ns: not 1120
significant. 1121
Supplementary Figure S3. Comparison of single channel and merged images of multiplex 1122
fluorescent IHC staining of TLS, IgG and IL-21 on tumor tissues of treatment-naïve, non-MPR 1123
and MPR patients (image under 20X). 1124
Supplementary Figure S4. Peripheral CD8+ T clones are more expanded after neoadjuvant 1125
chemoimmunotherapy. 1126
a. The clonality analysis of intratumoral T cells in treatment-naïve, non-MPR and MPR patients. 1127
b. Comparison of shared T clone between Tumor and P1 in treatment-naïve and neoadjuvant 1128
tumor lesions. There are more shared T clones between tumors and P1 in neoadjuavnt tumor 1129
lesions. c, d. Neoadjuvant chemoimmunotherapy evokes the expansion of intra-tissue CD4+ T 1130
clones and peripheral CD8+
T clones. e. The majority of matched T clones between P0 and P1 1131
were CD8+ T cells. f. The matched CD8
+ T clones were more expanded in P1 than P0. g. 1132
Intratumoral stem-like TCF7+CD8
+ T cells elevated after neoadjuvant chemoimmunotherapy. h. 1133
The proportion of stem-like TCF7+CD8
+ T cells was significantly higher in P1 of MPR than 1134
non-MPR patients after neoadjuvant chemoimmunotherapy. * p<0.05; ** p<0.01; ns: not 1135
significant. 1136
Supplementary Figure S5. Selected L-R interactions of LAMP3+ DCs with NK/NKT, T, B and 1137
myeloid clusters. 1138
Supplementary Figure S6. Selected L-R interactions of NK/NKT, T, B and myeloid clusters with 1139
50
LAMP3+ DCs. 1140
Supplementary Figure S7. Comparison of single channel and merged images of multiplex 1141
fluorescent IHC staining of CD20, IgG1, IgG3, IgA, CD4, IL-21 and DAPI on tumor tissues of 1142
treatment-naïve, non-MPR and MPR patients in our validation cohort (image under 20X). 1143
1144
1145

Supplementary Files
This is a list of supplementary �les associated with this preprint. Click to download.
SupplementaryFileS1.xlsx
SupplementaryTableS1.docx
SupplementaryTableS2.docx
SupplementaryFigureS1.pdf
SupplementaryFigureS2.pdf
SupplementaryFigureS3.pdf
SupplementaryFigureS4.pdf
SupplementaryFigureS5.pdf
SupplementaryFigureS6.pdf
SupplementaryFigureS7.pdf
Related Documents


