1 SINGIDUNUM UNIVERSITY Department for Postgraduate Studies PhD DOCTORAL ACADEMIC STUDY PROGRAM TOURISM MANAGEMENT Thesis for the Degree of Doctor of Philosophy THE IMPACT OF SUSTAINABILITY ON DESTINATION BRAND EQUITY Milivoj Teodorović Supervisor: Professor Jovan Popesku, PhD Belgrade, Serbia 2020

Welcome message from author
This document is posted to help you gain knowledge. Please leave a comment to let me know what you think about it! Share it to your friends and learn new things together.
Transcript

1
SINGIDUNUM UNIVERSITY
Department for Postgraduate Studies
PhD DOCTORAL ACADEMIC STUDY PROGRAM
TOURISM MANAGEMENT
Thesis for the Degree of Doctor of Philosophy
THE IMPACT OF SUSTAINABILITY ON DESTINATION BRAND EQUITY
Milivoj Teodorović
Supervisor:
Professor Jovan Popesku, PhD
Belgrade, Serbia 2020

2
ABSTRACT
The subject of the thesis is an exploratory research on the impact that sustainability has
on a tourism destination brand equity. As increasing development of tourism destinations
around the globe becomes a significant source of wealth, prosperity, cultural exchange,
innovation, human interactions and activities, there is a growing interest to use modern
marketing and branding strategies, traditionally used in businesses. However, at the same time
there is a growing concern how to balance the increasing demand for tourism resources with
the limited carrying capacity of the environment and host population. Moreover, the literature
on the tourism destination brand development shows deficiency in understanding the
multifaceted and multidimensional relationships between the tourism destination brand
development and the elements of destination sustainability.
In that regard, this thesis addresses the existing gap in tourism literature by introducing a
model that highlights impact of the elements of destination sustainability: economic, social and
environmental on the elements of destination brand equity awareness, image, quality and
loyalty.
Tourism destination brand equity and destination sustainability are well-studied themes
by the research community. To better understand these two seemingly different concepts this
thesis proposes a possible single common model that can serve as a platform for analyzing the
relationships between the concepts. Since destinations cannot be placed or sold on the market,
the value of the destination brand equity must be tied to the proxy indicators. The universality
of the model is empirically confirmed by the global cross-national and multi-country indexes
from (N=124) countries, obtained from nineteen global databases. The robustness of the model
is further tested using the empirical survey data (N=368) from a case of Serbia
The results of the multivariate analysis show that social and environmental elements are
the most dominant in a sustainable destination brand equity development, suggesting an area of
focus for investors and developers. Also, the results show that the social part has a significant
impact on the brand equity dimensions as well as on the other elements of destination
sustainability.
The major goal of the thesis is to explore a) relationships between the elements of tourism
destination sustainable development effort and the elements of the destination brand equity, b)
impact that the elements of sustainability have on the elements of destination brand equity and
c) specific outcomes because of the interaction of the elements.
Therefore, based on the findings, the thesis suggests that both sustainability and
destination brand equity developments are tied together and should be done in parallel as one
common process in the long run. Moreover, the strong impact of the social sustainability
element on all aspects of the brand equity development confirms the influence of sustainability
on the tourism destination development. Hence, the proposed model provides destination
developers and authorities with a tool for evaluating, analyzing and implementing
comprehensive destination development strategies that will fulfill destination promise and, at
the same time, preserve resources and enhance the local way of living.
.
Keywords: tourism destination brand equity; sustainable development; Serbia;
multivariate analysis; impact of sustainability on brand equity.

3
ACKNOWLEDGEMENT
I would like to send my gratefulness to all who contributed with their patience, advice,
knowledge, ability and support during my work on this doctoral thesis.
First, I would like to express great appreciation and gratitude to my mentor Professor
Jovan Popesku (Singidunum University) for his tremendous contribution, patience, knowledge,
guidance, time, encouragements, advice and support without which this endeavor would not be
possible. I have learned much from him as a research partner. Our many discussions on
different marketing and branding topics have enriched my appreciation for the challenges of
creating, measuring, and building successful tourism destination brand equity strategies. I will
always be grateful to him for giving me this unique opportunity and inspiring me to enter the
exciting and challenging world of tourism destination marketing.
Also, I am grateful on the important suggestions, corrections and encouragement from
Assistant Professor Danijel Pavlović (Singidunum University) and on his practical research
advices and overall contribution in developing and reviewing research projects and thesis.
I would like to thank faculty of the Singidunum University for their support, advices and
valuable instructions. In particular, I would like to express my sincere thanks to Professor
Slobodan Čerović (Dean at Singidunum University) on his valuable suggestions and support. I
would also like to thank Professor Verka Jovanović (Singidunum University) on her comments
and feedback as well as Professor Dejan Živković (Singidunum University) on his
encouragement and advice in the first stages of the thesis development.
Special thanks go to Professor Angelina Njeguš (Singidunum University) for her advice
and support with IT and internet-based research tools.
For making the administrative tasks smooth and painless my special regards go to Diana
Orlić who was there to help me navigate with the processes, regulations and procedures
associated with the academic requirements.
Finally, special thanks go to my family and friends for their patience and support and to
my loving children Dimitrij, Ana, Dejan Dusan, Vuk, stepdaughter Jovana and spouse Irena for
their love, never-ending patience, understanding and support.
Milivoj Teodorovic
Belgrade, Serbia, June 2020

4
TABLE OF CONTENTS
ABSTRACT……………………………………………………………………………………2
ACKNOWLEDGEMENT………………………………… …………….……...…………….4
LIST OF TABLES ……………………………………………………….……...…………….6
LIST OF FIGURES……………………………………………………….……...…………….8
1. INTRODUCTION ................................................................................................................ 9 1.1. Background and Problem Area ....................................................................................... 9
1.1.1. Tourism and Brand Equity ..................................................................................... 10 1.1.2. Tourism and Sustainability ..................................................................................... 13
1.2. Research Goals .............................................................................................................. 18
1.3. Research Purpose .......................................................................................................... 19 1.4. Hypotheses and Adopted Methodology ........................................................................ 21
1.5. Research Methodology .................................................................................................. 22 1.6. Structure of the Thesis ................................................................................................... 25
2. SUSTAINABILITY AS A PREMISE FOR DESTINATION BRAND EQUITY .............. 27 2.1. Evolvement of the Sustainable Tourism Research ........................................................ 27
2.2. Sustainable Development of Tourism Destinations ...................................................... 34 2.3. Valuation of Sustainable Tourism Destination ............................................................. 37
2.4. Economic Impact on Tourism Destinations .................................................................. 48 2.5. Social Impact on Tourism Destination .......................................................................... 52 2.6. Environmental Impact on Tourism Destination ............................................................ 57
3. DESTINATION BRAND EQUITY .................................................................................... 61 3.1. Brand Equity Concept: Evolution and Measurement .................................................... 61
3.2. Destination Brand Equity: Historical Perspective ......................................................... 64 3.2.1. Destination Brand Awareness ................................................................................ 66
3.2.2. Destination Brand Image ........................................................................................ 68 3.2.3. Destination Brand Quality ...................................................................................... 70
3.2.4. Destination Brand Loyalty ..................................................................................... 71
4. CONCEPTUAL FRAMEWORK......................................................................................... 73 4.1. Theoretical Foundation .................................................................................................. 73
4.3. Country as a Destination ............................................................................................... 81 4.4. Country Destination Brand Equity ................................................................................ 83 4.5. Measuring Country Destination Brand Equity .............................................................. 83
5. METHODOLOGY ............................................................................................................... 85 5.1. Developing Research Instrument .................................................................................. 88 5.2. Data Collection and Preparation .................................................................................... 89 5.3. Multivariate Modelling .................................................................................................. 90 5.4. Structural Equation Modelling ...................................................................................... 90
5.5. Structural Equation Modeling Process .......................................................................... 93
5.6. Stage 1: Defining Individual Constructs ....................................................................... 93
5.7. Stage 2: Developing and Specifying Measurement Model ........................................... 96 5.8. Stage 3: Testing for Reliability and Validity ................................................................. 97
5.9. Stage 4: Defining Structural Model ............................................................................. 100 5.10. Stage 5: Assessing Structural Model Validity ........................................................... 100
6. GLOBAL DESTINATION CASE ..................................................................................... 102 6.1. Global Case ................................................................................................................. 102 6.2. Scale Development: Operationalization of the Model ................................................ 102

5
6.3. Research Instrument .................................................................................................... 105
6.4. Data Analysis .............................................................................................................. 107 6.5. Exploratory Factor Analysis ........................................................................................ 111 6.6. Measurement Model .................................................................................................... 114
6.7. Structure Equation Modeling -Path Analysis .............................................................. 116 6.7.1. Scenario 1: Social Sustainability Construct as Predictor ..................................... 117 6.7.2. Scenario 2: Environmental Construct as Predictor ............................................... 119 6.7.3. Scenario 3: Economic Construct as Predictor ...................................................... 122
6.8. Second-Order Structural Equation Model Analysis .................................................... 124
6.8.1. Impact of Destination Sustainability on Elements of Destination Brand Equity . 124 6.8.2. Impact of Destination Sustainability on Destination Brand Equity ..................... 126
7. CASE OF SERBIA ............................................................................................................ 130 7.1. Case of Serbia .............................................................................................................. 130 7.2. Scale Development: Operationalization of the Model ................................................ 131
7.3. Research Instrument .................................................................................................... 135
7.4. Data Collection ............................................................................................................ 137
7.5. Data Analysis .............................................................................................................. 138 7.6. Multivariate Analysis .................................................................................................. 142 7.7. Measurement Model Analysis ..................................................................................... 145 7.8. Structural Equation Modeling ..................................................................................... 147
7.8.1. Scenario 1: Socio-Economic Construct as Predictor ............................................ 147 7.8.2. Scenario 2: Environmental Construct as Predictor ............................................... 150
7.9. Hypotheses Analysis Summary .................................................................................. 158 7.10. Results Summary ...................................................................................................... 158
8. DISCUSSIONS AND FUTURE RESEARCH .................................................................. 163
8.1. Evaluation of Research Outcomes .............................................................................. 163 8.2. Theoretical Implications .............................................................................................. 166
8.3. Managerial Implications .............................................................................................. 169 8.4. Research Limitations ................................................................................................... 170
8.5. Proposal for Future Research ...................................................................................... 172 9. REFERENCES ................................................................................................................... 175
APPENDIX A ………………………………………………………………………………200
APPENDIX B ………………………………………………………………………………206

6
LIST OF TABLES
No. Table Name Page
2.1 Evolvement of the Sustainable Tourism Research 30
2.2 Theoretical Foundation for Sustainable Development of Tourism
Destination
42
3.1 Evolution of Tourism Destination Brand Equity 64
4.1 Theoretical Foundation 74
5.1 Structural Weight Estimates Benchmarks 98
6.1 Global Research Instrument 105
6.2 Descriptive Statistics 107
6.3 Missing Data 109
6.4 Global Databases 110
6.5 Measurement Model 111
6.6 Goodness-of-Fit Statistics 114
6.7 Component Correlation Matrix 115
6.8 Reliability, Convergent and Discriminatory Validity Matrix 116
6.9 Goodness-of-Fit Statistics Global Case 117
6.10 Structural Weight Estimates for Social Case 119
6.11 Goodness-of-Fit Statistics Global Case 120
6.12 Structural Weight Estimates for Environmental Case 121
6.13 Goodness-of-Fit Statistics Global Case 123
6.14 Structural Weight Estimates for Economic Case 123
6.15 Goodness-of-Fit Statistics 125
6.16 Component Correlation Matrix 126
6.17 Reliability, Convergent and Discriminatory Validity Matrix 126
6.18 Goodness-of-Fit Statistics 128
6.19 Structural Weight Estimates for H1 and H2 128
7.1 Items for the Research Instrument 134
7.2 Demographic Characteristics 139
7.3 Descriptive Statistics (n=368) 141
7.4 Measurement model 142
7.5 Component Correlation Matrix 145
7.6 Reliability, Convergent and Discriminatory Validity Matrix 145
7.7 Goodness-of-Fit Statistics 146
7.8 Goodness-of-Fit Statistics Case of Serbia 148
7.9 Structural Weight Estimates for Case of Serbia 150
7.10 Goodness-of-Fit Statistics Case of Serbia 152
7.11 Structural Weight Estimates for Global Case 153
7.12 Second-Order Goodness-of-Fit Statistics 154
7.13 Structural Weight Estimates for Second-Order Path Analysis 155
7.14 Component Correlation Matrix 155

7
7.15 Reliability, Convergent and Discriminatory Validity Matrix 156
7.16 Second-Order Goodness-of-Fit Statistics 156
7.17 Structural Weight Estimates for Second-Order Path Analysis 157
7.18 Confirmation of the Hypotheses 158

8
LIST OF FIGURES
No. Figure Name Page
1.1 Analysis and Data Acquisition Process 24
2.1 Conceptual Model (Iniesta-Bonillo, et al., 2016) 38
2.2 Conceptual Model (Cottrell et al., 2013) 39
2.3 Structural Model (Kim & Lee, 2017) 40
2.4 Conceptual Model (Kim et al., 2017) 41
2.5 Sustainable Destination Development Concept 44
2.6 Sustainable Development Concept 46
2.7 Proposed Model Theoretical Concept 47
2.8 Economic Impact on Tourism Destination 51
2.9 Social Impact on Tourism Destination 55
2.10 Environmental Impact on Tourism Destination Brand Equity (Based on
Partanen-Hertel et al., 1999)
58
4.1 Proposed Model: Conceptual Framework 78
4.2 Proposed Model: Hypothesized Framework 80
5.1 Structural Equation Modelling Overview (Hair et al., 2010) 94
6.1 Scale Development for the Global Case 104
6.2 Measurement Model Global Case (AMOS, v.23) 114
6.3 Social Sustainability Construct as Predictor 117
6.4 Environmental Construct as Predictor 120
6.5 Economic Construct as Predictor 122
6.6 Second-Order Path Analysis: Sustainability 124
6.7 Two Second-Order Factors: Sustainability and Brand Equity 127
7.1 Scale Development for the Case of Serbia 134
7.2 Measurement Model of the Case of Serbia (AMOS, v.23) 146
7.3 Social Construct as Predictor 148
7.4 Environmental Construct as Predictor 151
7.5 Second-Order Standardized Path Estimates: Destination Brand Equity 154
7.6 Two Second-Order Estimates: Brand Equity and Sustainability 157

9
1. INTRODUCTION
1.1. Background and Problem Area
The growing interest in tourism is a global phenomenon that all over the word is causing
tourism destinations continents, regions, countries, cities, islands, and etc., to engage in
developing branding activities that will strategically make them attractive to the ever-growing
number of tourists. These activities are putting a pressure on the authorities to expand capacities
of current destinations and create or discover the new ones. As the number of tourists increases
there is a growing threat from overtourism which would seriously challenge destinations’ ability
to satisfy the demand and, at the same time, preserve the natural environment and the way of
life in the local communities.
On the good side, tourism brings employment, economic wealth, development, cultural
exchange, vision for future development, and knowledge. However, tourism puts pressure on
the natural, cultural, and created resources with the consequence of deteriorating the everyday
life of the residents as well as the quality of experience of tourists. On the downside, tourism
brings crime, drugs, noise, pollution, water shortages, and overcrowding. Going overboard with
the consumption of a destination resources could permanently deteriorate attractiveness of a
destination and downgrade its brand equity. Tourism destinations, unlike products, have their
value only if there is a reasonable expectation that they will be there in the future and still be
able to attract visitors by offering their resources for consumption (Crouch, 2010). In other
words, for a destination to sustain its brand equity in the future, even at the times of global
economic instabilities, it is mandatory to preserve their long-term health. This must pertain to
the socio and environmental factors of the destination (Gartner, 2014).
Recently, sustainable destination development practices have become more complex
because of the increasing number of destination stakeholders and their diverse interests (Qiu,
Fan, Lyu, Lin, & Jenkins, 2019). Consequently, sustainable development of tourism
destinations, in the today’s global marketplace, requires development of a destination brand
equity under the umbrella of preserving or increasing the value of tangible and intangible
destination resources to the future generations. Only recently, this topic has started to gain
attention to the scholars and researches.
Furthermore, the concept of brand has been around for as long as the market-driven
practices existed. Marketers throughout the centuries always tried to make the process more
efficient. Brands, offering multiple features, become quickly popular and remain the
mainstream of marketing until today. However, branding a destination is a new concept.
Adopting the Kotler’s (1991, p. 442) definition that brand is a symbol, name, term, sign to
identify the goods or services of one seller or group of sellers and to differentiate them from
those of competitors’, reveals that branding has been the concept marketers used for a very long
time. Consequently, the brand name concept, as a pillar of branding, is a historical concept.
The purpose for differentiating destinations is to strengthen expectations of the unique
experience and attractiveness of a destination. Destination branding strategies are adopted by
tourism destinations as means to increase destination attractiveness, articulate destination
identity through uniqueness of the destination’s tangible and intangible attributes, to convey an
original value proposition of a destination, attract new visitors, stimulate positive world-of-
mouth, increase repeated visitation and to invigorate tourists to pay premium price.
10
In the traditional product-based marketing, the brand equity emerged as the most
important marketing concept in the late 1980s, causing a proliferation of ideas on how to
conceptualize and operationalize the brand equity concept (Aaker, 1991, 1996; Erdem, Swait,
& Valenzuela, 2006; Keller 1993). However, because of different methods and concepts, there
was no common scientific view on how to explain dimensions of brand equity, important
factors, study aspects and measuring methodologies. The only agreement was on the
multidimensionality concept of the customers’ perceptions of the brand’s value (Aaker, 1991;
Erdem et al., 2006; Gartner, 2014; Keller 1993, 2013; Konecnik & Gartner, 2007).
Nevertheless, brand equity became a well-defined concept in the research and academic
community. Brands obtain their value in the marketplace as a difference between the sale of a
product with a brand name or symbol and the same or similar no-name product (Simon &
Sullivan, 1990; Keller, 1993). This difference in value becomes obvious and pronounced when
a company franchises its products to another company. What sells the product is its customer
base, product features, supply, know-how, potential earning and reputation in the marketplace
all encapsulated into the brand name along with the associated brand elements. The added
values create a chain of identity vision that leads to a formation of the brand image (Gartner,
2014). The brand receives its value from the customers’ perception of the performance,
relevance, stability and quality of the brand, enhanced by the response to the marketing strategy
(Keller, 1993).
Adding greater value to the firm is considered a major asset behind brand equity, followed
by commanding higher margins, increasing competitive advantage and improving trade
leverage and brand extensions. Besides, brands increase value to the firm because of the
augmenting loyalty caused by brand equity dimensions, such as awareness, image and perceived
quality (Kladou, Giannopoulos, & Mavragani, 2015). Benefits of brands with high brand equity
are that they create competitive advantage in the marketplace, resist promotional pressure from
the competition, impose barriers for competitors to enter the market, and create opportunities
for brand development. Aaker (1991, 1996), defined brand equity as a set of assets and
liabilities linked to a brand. Aaker proposed a model that captures image, assets, quality,
awareness and loyalty as the main elements. Consequently, the customer-based brand equity
(CBBE) model, conceptualized by Aaker’s (1991, 1996) and Keller’s (1993) quickly became
the most recognized and commonly used paradigm by the research community (Konecnik &
Gartner, 2007; Myagmarsuren & Chen, 2011; Pike, Bianchi, Kerr, & Patti, 2010), and is used
in this thesis.
1.1.1. Tourism and Brand Equity
Since its introduction in the late 1990’s destination branding, as a new concept, quickly
captured the interest and attention of the destination marketing research community (Morgan,
Pritchard, & Pride, 2002; Cai, 2002; De Chernatony & Dall’ Olmo Riley, 1999)..
Measuring and tracking destination brand equity soon became the mainstream of the
research effort. Another view is that the value generated by the marketing effort and the future
destination functioning remain insufficiently covered in the research literature. Since inception
of the initial concepts and methodologies on the general tourism destination marketing an ample
body of scientific literature proliferated on the topic (e.g., Aaker, 1991, 1996; Keller, 1993;
Berry, 2000). The “brand equity” remains the elusive and in completed area with disagreements

11
on definitions and proliferations of methodologies with the only consensus that the concept is
multidimensional and that it represents added value empowered by the brand (Gartner, 2014;
Christodoulides & de Chernatony, 2009; Kladou, Kavaratzis, Rigopoulou, & Salonika, 2017)).
Eventually, the CBBE concept became the most popular model for evaluation of the
destination brands (i.e., Bianchi, Pike, & Lang, 2014;; Chen & Myagmarsuren, 2010; Gartner
& Konecnik Ruzzier, 2011; Horng, Liu, ; Kladou & Kehagias, 2014; Pike et al., 2010). Soon,
Keller’s (1993) and Aaker’s (1991,1996) formulation of the customer-based brand equity model
became the most popular.
According to Gartner (2014) the CBBE model is based on the Boulding’s (1956)
publication of image theory based on multidimensional memory structures such as loyalty,
awareness, image and quality. Likewise, alternative conceptualizations of the CBBE models
were offered by Evangelista & Dioko (2011), and García, Gómez, & Molina, 2012).
The benefits of the destination brand equity are that it makes destinations different by
means of name and brand symbols, associates unique positive experiences to tourism
destinations, reinforces emotional relations between visitors and tourism destinations, and
reduces research expenses and visitors’ perceptions of risk (Blain, Levy, & Ritchie, 2005).
Aaker’s (1991, 1996) and Keller’s (1993, 2013) concepts of the CBBE offer to destination
marketers a set of tools for performance evaluation and positioning in the marketplace (Pike, et
al., 2010). However, the study of destination branding strategy has been overshadowed by the
spread of the literature on destination image, causing a proliferation of studies on destination
image in comparison to a few that are concerned with destination brand equity (Kladou et al.,
2015). Nevertheless, the Aaker’s model further expands the notion of brand equity by
indicating the importance of awareness, perceived quality and loyalty (Blain et al., 2005; Gnoth,
2002; Morgan, et al., 2002). Initially, loyalty and quality were considered as isolated subjects
while awareness was the outcome of Boulding’s cognitive element of image (Keller, 1993;
Milman & Pizam, 1995; Oppermann, 2000; Weiermair & Fuchs, 1999).
The review of the relevant literature reveals that tourism marketing researchers adopted
the term ‘destination brand equity’ borrowed from the product and corporate brand literature
(Aaker, 1991; Keller 1993). Keller (1993) suggests that CBBE happens when customers are
aware of the brand and exhibit strong, favorable and unique associations that can lead to repeat
buying behavior that positively impacts brand loyalty. Likewise, high levels of brand equity
may result in higher sales, increase in attitudinal loyalty reflected in the willingness to pay price
premiums, lower cost, purchase intent and customer loyalty (Aaker, 1991, 1996; Keller, 1993).
The intricate nature of tourism destination brands makes evaluation of a tourism destination
brand equity complex. Each destination has its own unique set of tangible and intangible
features that are perceived by tourists as a combination of emotional and functional components
of the brand equity (Aaker, 1991; Boo, et al., 2009; Konecnik & Gartner, 2007). Depending on
what tourists perceive as attractive and important features differentiates a destination and
creates its unique position in the tourism marketplace. Measurement methods and the
composition of a tourism destination brand equity are new to researchers and are still subject to
debate (Ferns & Walls, 2012). On the other hand, Boo et al. (2009), Pike (2009), and Gartner
(2009) agree that measuring destination brand equity in the tourism context is an intricate
process, additionally complicated by the multidimensionality and complexity of the constituting
elements. Since CBBE theory offers some alleviation of the complexities in measuring, its

12
absence could result in the proliferation of the CBBE equity concepts and disagreements on the
CBBE model structures and selected scales.
Similarly, tourism destination brands share many of the same features with the product
brands but differ in several critical aspects. Destinations are dynamic entities that constantly
change and are subject of seasonal and cyclical fluctuations. It is the change that makes
destination significantly different from traditional products. Similarly, destinations are
multidimensional constructs and mean different things to different people. Also, destinations
have different shareholders with different interests, levels of ownership and points of view.
Unlike products, destinations are experiential entities that cannot be returned if not satisfied.
Other significant difference is that a destination cannot be sold in the marketplace which a priori
makes them one of a kind. It is unlikely or impossible, to find a destination that will serve as a
reference point for measuring brand equity of another destination. Consequently, measurement
of the destination brand equity cannot be readily obtained. Therefore, the destination value
must be deduced from other variables such as receipts, visitation, taxes, spending, consumption
etc., all of which make a destination a very risky subject. Similarly, many scholars are raising
questions if the destinations are in fact marketing entity (Gartner, 2014, Konecnik & Gartner,
2007).
Therefore, direct use of the product-based CBBE without adjustment to the specific
dimensions that are more tourism specific or destination specific will cause leaving behind the
point that is relevant to the tourism destination research resulting in missing managerial
pertinence of the model (Gartner, 2014).
Konecnik & Gartner (2007) where the first to conceptualize brand equity of a tourism
destination. The authors applied the elements of the image theory, developed by Gartner
(1993), better known as cognitive, affective and conative components to the Aaker’s (1991,
1996) brand equity model. According to Konecnik & Gartner (2007), the cognitive image is
related to the destination awareness or the strength of a person’s knowledge about the
destination. The affective part points to the emotional experience of a destination while
conative part makes a person act based on the knowledge and emotions about the place.
Pike (2007) researched the success levels of the destination branding campaigns
conceptualizing the customer-based brand equity CBBE, based on Aaker’s (1991, 1996), and
Keller’s (1993, 2013) models, using brand salience, brand associations, brand resonance, and
brand loyalty. Further direction for conceptualizing brand equity was to link the desires and
expectations of the tourists with the attributes of the destinations and to successfully deliver the
brand promise (Lim & Weaver, 2014; Nam, Ekinci, & Whyatt, 2011; Pike, 2007; Usakli &
Baloglu, 2011).
Konecnik & Gartner (2007) where the first to apply CBBE model on tourism destination.
The authors evaluated Slovenia based on the empirical survey of the population in Germany
and Croatia and suggested that besides similarities in many areas there are significant
differences in the others. Konecnik & Gartner (2007) found that Germans have high regard for
Slovenia as tourism destination. The strong image of Slovenia is based on the perception of
small tranquil and peaceful cities and villages surrounded by a beautiful landscape, mountains,
seashore, historical points and pleasant people. On the other hand, in the minds of the Croatian
visitors, image, quality and loyalty are influenced by the same factors, however, with different
outcome. The time since the last visit, which was highly pronounced in the German survey,

13
proved irrelevant in the Croatian case. Also, awareness of the Slovenia was very high and
important for German market, but not in the Croatian market which placed more emphasis on
the image part. In the case of Slovenia, we see that it means different things to different markets
and market segments. In this case, Slovenia was positively perceived by both German and
Croatian tourists but with different outcomes in the critical areas such as behavioral and
attitudinal loyalty. Besides obstructions in evaluating tourism destination brand equity there
are possibilities to explore further the underlying components of the destination brand equity
(Gartner, 2014). Consequently, the perception of the destination value requires paying attention
to the multi-dimensional framework of the associations involved.
1.1.2. Tourism and Sustainability
In 1987, UN Brundtland Report, issued by the World Commission on Environment and
Development (WCED, 1987), has formally introduced sustainability in the global development
agenda including tourism. The report gave priority to resource management and conservation
over unrestricted economic growth and profit-based economic strategies (Espiner, Orchiston,
& Higham, 2017; Mitchell, Wooliscroft, & Higham, 2013; Young, Markham, Reis, & Higham,
2015). The basic principle outlined in the sustainable development is “development that meets
the needs of the present without compromising the ability of future generations to meet their
own needs” (WCED, 1987). Despite its global attractiveness this definition posed an ample of
challenging issues that were further mystified by the fast pacing and everchanging global world
(McCool, Butler, Buckley, Weaver, & Wheeller, 2013). Among many concerns, the most
important ones are what is sustained, and how to make development sustainable. The three
most important pillars of the principles of sustainability are economic, social and environmental
elements to form the bases for evaluations of sustainable tourism.
Initial studies on sustainable tourism were focused on local impacts of tourism (Hall &
Page, 1999). Soon after, the focus shifted to more critical evaluation of the environmental
impacts and social issues. In the following years, the sustainable tourism has been concerned
with questions about spatial (local-to-global) and temporal (longevity) measurements (Hall,
2007).
Next, McCool et al. (2013, p 217), argue that the sustainability models at the end of the
20th century were based on the premises that the world was stable, predictable and
understandable. However, accelerating climate change mostly altered the old thinking, causing
the shift in the spatial-temporal understanding of the sustainable practices. Also, climate
change has imposed new frames of reference for the sustainable tourism scientific community
to adopt a new way of thinking based on the global environmental and social change (Higham,
Cohen, Peeters, & Gössling, 2013).
To better understand how tourism destination industry has developed it became a
paramount to understand the environment as well as the economic and social forces required
for any growth and development. In that regard, we must consider brand equity of a tourism
destination or its long-term value and attractiveness in the same way that we look at the
development of sustainability (Gartner, 2014; Buckley, 2012, Crouch 2010, Iniesta-Bonillo,
Sánchez-Fernández, & Jiménez-Castillo., 2016; Cottrell, Vaske & Roemer, 2013).

14
Buckley (2012) points to about 5000 relevant papers that deal with the global tourism
but argues that very little consider global research in sustainability development as a guideline.
His conclusion is that the tourism destination industry at the end of the first decade of the 21st
century was not sustainable. Further, the same author believes that the sustainability in the
tourism industry was driven by the regulations and less by marketing scenarios. Besides, there
was a significant lobbying by different parties to tap into the untouched natural resources to
accommodate the global growth of tourism. Consequently, there was a growing problem how
to accommodate the expanding and popular industry such as tourism, and at the same time,
protect the growing number of tourism destinations from exceeding their capacity.
Because of the complexity of the tourism systems some sudden and incremental chaotic
events can swiftly cause disintegration of the tourism environment because of their vulnerability
to the outward threats that include social, political and economic background.
On the demand side, there are shifts in tourists’ preferences, desires, buying power,
interests, demographics and perceptual levels that could either reduce or increase the interest in
and expectations of a tourism destination. Showing and dealing with such complex,
heterogeneous issues could represent a major challenge to both tourism practitioners and
academics (Espiner et al., 2017). Therefore, it is a paramount for the development of tourism
destinations to recognize and incorporate these complexities into their development paradigms.
Gartner (2014) states that since destinations are unique and cannot be purchased in the
marketplace there is no other destination that can serve as a “generic” reference point for
destination brand equity valuation. Consequently, the same author suggests that the value of a
destination from tourists’ perception must be determined indirectly by other means, such as
repeat versus first visit rates, expenditures and arrivals of tourists. Gartner argues that in the
long-run context destination brand equity must be measurable to confirm the desired outcome.
He points that destination economic variables such as receipts, arrivals, wages, taxes to
governments and profits can be considered in quantitative form. In the same way,
environmental variables such as water and air quality can be measured in similar fashion.
However, for social variables, because of the difficulties in measurement, some variables must
use proxy indicators such as life longevity, overall health, and standard of living inter alia.
Buckley (2012) states that different impacts on tourism must be measured and managed
and suggests indicators for economic (regional economies, poverty), social (net gains, welfare,
equity) and environmental (accounting measures) domains. Because of the on-going
environmental and social changes which affect tourism, there is an ongoing effort to develop
observable sustainability indicators for monitoring and managing tourism (Butler, 1991, 1999).
(Buckley, 2012)
Simkins & Peterson (2015;) state that researchers and practitioners should take advantage
of the increasing availability of the secondary data. However, a caution should be given to
reliability and validity of such data since there is a limitation in quality which is innate to
secondary sources (Malhotra, 1996). Houston (2004) argues that supporting and initial
evaluation of “theories” using secondary data proxy and corresponding indicators is feasable.
Similarly, Peterson & Malhotra (1997) point to analysis on how societies distribute costs and
benefits by applying structural equation modeling on International Living’s Quality of Life
Index .
15
However, for a destination to have a future, it first needs to be there. The underlying
framework is that sustainability is essential for the long-term existence and survival of the
humanity and the ecosystem services it depends on. The competitive consumption and
biological reproduction, both driven by the evolutionary pressures of survival are the main
reasons behind the impact on natural resources (Buckley, 2012). Sustainability assumes
changes that societies need to make to reduce the impact on the resources and to balance out
the regenerative capability with the demand.
Liu (2006) considers tourism as a suitable way of economic development for its efficient
and straightforward way for entrepreneurial ventures, income and employment opportunities
Wilson, Fesenmaier, Fesenmaier & Van Es (2001) state that local tourism has advantage over
manufacturing and other business strategies because it has direct relationship with the
customers (tourists) and do not depend on large companies. However increased visitation,
urbanization, and commercialization can bring prosperity to the local population but also can
negatively impact the local way of life (Madrigal, 1993). According to McGehee & Andereck
(2004) factoring in the local residents’ input into the development can reduce the negative
impact of the tourism.
Tourism development is a dynamic process which goes through several stages as defined by the
destination cycle model as proposed by Butler (1980). According to Butler (1980), destination
development process moves through five stages: exploration, involvement, development,
consolidation, and stagnation. The changes, either positive or negative, happen in every stage
of the stated process. Over time, these changes accumulated and initiated activation of the post
stagnation steps to remedy negative impacts of the tourism development. Besides criticism,
Buttler’s (1980) concept emerged as the most reputable tool for monitoring and tracking tourism
development.
According to Allen, Hafer, Long, & Perdue (1993) evaluation of the residents’ attitude
towards tourism development must include overall tourism development activity in a
destination including the level of economic prosperity as major factors. As development of
tourism in destinations progress, theories based on the social science are implemented to explain
the change for evaluation of the exchange process between hosts and tourists.
The social exchange theory (SET) emerged as the most popular framework for examining,
evaluating and monitoring of the perceptions’ of the local residents towards tourism
development (Nunkoo & Gursoy, 2012; Wang & Pfister, 2008; Diedrich & Garcίa-Buades,
2009; Vargas-Sánches, de los Ángeles Plaza-Mejίa, & Porras-Bueno, 2009; Nunkoo, 2016).
According to SET, residents are willing to accept tourism development if perceived benefit
overcomes the perceived cost from doing it (Ap, 1992; Nunkoo, 2016). In other words,
residents are willing to exchange potential sacrifices for the perceived future gains. In the
context of tourism, if residents of a destination perceive that economic, social and
environmental benefits of making their community “tourism friendly” exceeds the cost related
to tourism they will approve development and will be open to accept the changes caused by the
impacts from tourism traffic, infrastructure development, pollution, noise, crowdedness, crime,
drugs, alcohol, commercialization of their environment as well as inappropriate management
of a destination.
The economic impact of a destination is a measure of resource consumption (Buckley,
2012). Traditionally, economic influence is reported as the number of visitors and tourism

16
spending. The popular measure of prosperity is per-capita spending on tourism goods and
services, and the contribution to taxes from tourism activities (Dwyer, 2018). In the long-run,
economic development is a result of the growth at the expense of the environment (Buckley,
2012). The economic impact of a destination is the value a destination gets from receipts from
the consumption of the destination resources which is related to both attitudinal and behavioral
loyalty (Gartner, 2014; Dwyer, 2018).
The social impact of a tourism destination can be positive and negative. On the positive
side tourism brings prosperity, employment, wealth, cultural exchange, knowledge, education,
better health system, and higher standard of living, while on the negative side tourism causes
increase of vandalism, change of local culture, pressure on local services, overcrowding, traffic
congestion, increase in prostitution, crime and use of narcotics, destroying the local way of life
and traditional values (Buckley, 2012) To counter these impacts local communities rely on
either government regulations or individual policies of the social organizations with objectives
to improve, healthcare, education, standard of living, human rights, legal environment,
preservation of natural resources, heritage, safety, peace efforts, and emphasis on the holistic
global solutions (Gursoy, Chi, & Dyer, 2010; Nunkoo & Ramkissoon, 2011; Latkova & Vogt,
2012).
Furthermore, the environmental impact of a tourism destination comes from
environmental pollution, habitat destruction, litter, increased water usage, increased noise and
smell, quality of air, destruction of wildlife and etc. Environmental conscious tourists and local
residents perceive care for the environment, water consumption management, clean air, zero
pollution, a hundred percent clean energy as a major effort in protection of ecosystems. The
policy of reducing, used in the last decades, is rapidly becoming zero-usage or 100% clean. The
tourists expect for environmental policies to be given, a standard, and part of the regulation, as
opposed to differential factors in selecting one destination over another.
Technological, political and individual actions can change the economic, social and
environmental elements. The actions can result in the increase or decrease of the destination
brand equity. The policy makers can introduce laws, incentives, initiatives and innovation that
can increase protection of the ecosystem, overuse of resources or pollution. Marketing activities
can either increase individual consumption, further deteriorate environment or they can promote
usage of more environmentally friendly products. Technology can open new markets for
environmentally safer products and supply solutions that will reduce consumption. On the other
hand, organizations can implement social responsibility programs and other green policies on
their own with intention to cut the green advocates and circumvent or hinder the regulations.
All these actions may result in predictable as well as in unpredictable outcomes that make any
planning of the desired consequence very difficult.
A few studies have conducted deeper interest into the subject of social sustainability of
a tourism destination (Qiu Zhang, Fan, Tse, & King, 2016). Several authors suggest that there
has been a plethora of studies on the effects on tourism destinations but few concerning
sustainability aspects of destinations. (Nunkoo & Ramkissoon, 2011; Andereck & Nyaupane,
2011; Ward & Berno, 2011; Latkova & Vogt, 2012; Nunkoo & Gurso, 2012).
Connection between tourism and environmental issues became clear as both areas started
to gain momentum in the research in the twenty first century. However, there are both on the
collision path with each other since more tourism creates more impact on the environment and

17
the host population. On the other hand, protection of the resources reduces the potential for
tourism expansion. However, researchers and scholars agree that the long-term value of a
tourism destination depends on the sustainable use of resources that allows for the destination’s
resources to be inherited by a future generation in the same or better condition (Crouch, 2010;
Gartner, 2014; Qiu Zhang et al., 2016). Further, the holistic marketing recognizes this concept
as a mix of social, environmental and economic elements incorporated into the long-term value
of a destination which is known as destination brand equity (Iniesta-Bonillo et al., 2016; Cottrell
et al., 2013; Font & McCabe, 2017; Kim, Thapa, & Kim, 2017; Moise, Gil-Saura, Šerić,
Eugenia, & Molina, 2019; Crouch, 2010). Also, Buckley (2012) proposes the evaluation
framework for mainstream tourism industry. First, the framework is defined under five
subjects: population, peace, prosperity, pollution and protection, and then it is used for the
analysis of the tourism research literature. The rational for the framework is that the overall
human impact on the ecosystem activities and the survival of the humans is the major focus and
concern of sustainability (Pereira, Leadley, Proenca, Alkemade, & Scharlemann, 2010; Persha,
Agrawal, & Chhatre, 2011). As Buckley (2012) points global population is a major indicator
of the ongoing and future impact of humans on the planet while peace is a global indicator of
the governance and social structure. The author states that prosperity is a substitute for per-
capita consumption of Earth’s resources and that pollution is a measure of the environmental
impact. Dwyer (2018) questions how tourism can make sincere contribution to industry
development on planet Earth considering the adverse effects it imposes due to its continuing
growth. Higgins-Desbiolles (2018) states that tourism has a problem, pointing that tourism is
addicted to growth which is antagonistic to the sustainable objectives. As the focus of the
tourism industry shifts on how to prosper with adverse growth Pollock (2012) argues that the
effects of tourism growth reduce capability of the tourism industry to strengthen socio-cultural
prosperity for hosts and the quality of tourism experience of tourists.
In her 2009 article Higgins-Desbiolles argues that despite being the most prominent topic
in tourism research, sustainability in the industry remains as undefined as ever. The interest in
sustainability was initiated by the concern for how to make global tourism industry more
sustainable. The overall conclusion is that most of the tourism industry is unsustainable in the
times when the human and natural resources are depleting.
Even though environmental and social changes are affecting the landscape of tourism
industry globally, there is a limited interest to systematically track, evaluate and analyze the
new paradigms of sustainability in the tourism research. Even less, there is a lack of interest to
lookup beyond tourism literature on sustainability, in the multi-disciplinary environmental,
social and economic publications.
On the other hand, the long-term value of a tourism destination is considered to have a
destination brand equity value only if there is a reasonable chance that it will be there, for the
future generations, offering the same or better resource capacity. From the supply side, those
resources are natural, social and economic capital offered for consumption to tourists. At some
point, there would be an equilibrium with the demand side or the image capital of a destination
and the destination resources. On the other hand, tourism destination brand equity is created in
the minds of visitors who because of the tourism destinations’ resource capital have altered its
image capital such as beliefs, feelings, ideas, and experiences of a destination (Crompton,
1979). Consequently, perceived value of a destination brand equity affects all the choices

18
tourists make about tourism destinations including willingness to visit, recommend and pay
premium.
On the other hand, to avoid deteriorating marketing position, a destination must support,
preserve or even enhance its’ carrying capacity (Crouch, 2010). Going overboard with the
consumption of resources increases pressure on the destination’s long-term health and,
eventually, deteriorates the image capital with the consequence of lowering the value of
destination brand equity.
The scientific thought that tourism and environment can affect each other is not new to
the research community. For the last forty years, the environmental and social issues have
slowly started to gain interest among academics, scholars, researchers and the public. The term
sustainability as a concept and direction for development is a recent subject. Sustainability
started to contribute to the topic as the development and publications on frameworks, concepts,
theories and management began to pick up. What followed was the discussion in literature
about viability of the pragmatic side of the sustainability concept, its role, focus, areas of
implementation, management and the overall applicability in the tourism industry. The
argument is made that both sustainability and tourism are phenomena. This leads to the notion
that the fundamentals of sustainability are applicable to tourism with an outcome that can be
used for the future research as well as the substance of the value of a tourism destination
(Buckley 2012).
1.2. Research Goals
The major research question of this thesis is outlined as follows:
“Would it be possible to develop a measurement instrument that will evaluate the impact
of the universally accepted, multidimensional, deterministic and comprehensive elements of the
sustainable development represented by the economic, social and environmental factors on the
highly complex, heterogeneous, dynamic, unique and perceptual tourism destination brand
equity based on the proposed model and to prove that in the long run they become the parallel
development process.“
Therefore, the intention of the research in this thesis is to explore the interaction and
impact that elements of sustainable destination development have on tourism destination brand
equity. Specifically, the study intends to prove that prolonged expanding economic activity may
cause deterioration of the destination brand equity elements such as destination awareness,
destination image, perceived destination quality and destination loyalty which in turn can make
a destination less attractive in minds of potential tourists.
Also, as unbalanced social and environmental policies could further deteriorate tangible
and intangible resources of a destination causing temporary or permanent damage to a
destination (Buckley, 2012). Specifically, one of the major goals of the thesis is to confirm the
Gartner’s (2014) and Van der Zwan & Bhamra’s (2003) notion that the process with the long-
term focus on destination brand development is the same as the sustainable development one.
Moreover, this thesis tries to prove that destination loyalty is influenced by the
effectiveness and efficiency of the social and environmental policies. Moreover, the aim is to

19
show that social, environmental and economic policies can significantly alter the outcome of
the destination brand equity value either by enhancing, preserving or deteriorating its value.
In particular, the focus of the study is in understanding the mechanism of interplay among
the elements of sustainability and the elements of brand equity in the context of destination
brand equity development. Also, the focus of the study is to highlight deployment of the causal
relationships of the components and the characterization of the proposed model. The study
aims to explain how the elements of sustainability affect the individual as well as the overall
relationships among the elements of the destination brand equity.
Also, the study tries to confirm the social element as the core dimension of the proposed
theoretical model as well as to indicate that the environmental dimension is a significant one in
the sustainability context. Finally, one of the goals of the study is to show causal relationships
between functional, emotional and symbolic values coupled with the benefits that visitors are
promised to receive and resources that are offered for sustainable consumption.
1.3. Research Purpose
The main purpose of this thesis is to expand research effort and wider scientific
knowledge on the influence of the elements of destination sustainability on the elements of
destination brand equity as well as on the value of destination brand equity. In more practical
terms, the thesis will equip scientific, research, academic, marketing and management
communities with a tool for researching, testing, teaching, analyzing, tracking, measuring,
evaluating and developing tourism destinations.
From the scientific point of view, the thesis provides bases for establishing a theoretical
model by conceptualizing elements of destination brand equity: awareness, image, quality and
loyalty as well as the elements of the destination sustainability: economic, social and
environmental into one model.
In a theoretical sense, the purpose of the thesis is to contribute to the research literature
with more knowledge that will address the gap, that currently exists in the research papers on
the subject. In the last two decades, there is plenty of literature on the sustainable destination
development, but very little on the impact of sustainability on destination brand equity.
However, there are few attempts to evaluate the relations between sustainability and satisfaction
of a tourism destination (Iniesta-Bonillo et al., 2016; Cottrell et al., 2013).
From the research point of view, the thesis offers a conceptual model for valuation of the
model in different destination scenarios. Also, it provides a theoretical background for the
multivariate analysis for establishing dependent and independent constructs for exploratory
factor analysis, confirmatory factor analysis and structural equation modeling. In exploratory
factor analysis a set of factors or groups of observable variables are extracted from the data and
will serve as the basis for defining unobservable variables also known as latent variables or
constructs. In the next step, which is confirmatory factor analysis, the elements of the proposed
model are evaluated against the constructs (factors) extracted by the exploratory factor analysis
for the model fit. This is explained in more detail in section 5 (Methodology).
In confirmatory factor analysis, the proposed model will be used as the theoretical
background for testing the model fit. In structural equation modeling or path analysis the

20
proposed model will prove structural relations that will be evaluated for causality and
hypotheses testing as suggested by Hair, Anderson, Babin, & Black (2010).
Practical application and value of the thesis to destination DMOs (Destination
management organizations) and destination stakeholders will be in defining direction for
development and positioning strategies. Using the outcomes of the thesis tourism destinations
will be able to increase their competitive position and focus on the profitable tourism niche
markets. Also, applying the findings in the thesis, tourism destinations will stay on the top of
current trends and be able to track changes into the marketplace as well as their marketing
position relative to their competitors. By exposing that sustainability plays a significant role in
the development of tourism destination brand equity, in the practical sense, it will open the door
for the benchmark tools for managing, monitoring, tracking and forecasting a destination
performance.
The significant effort of the study is directed towards creating and proposing a universally
accepted, multi-country, cross-national, and multi-regional sustainable destination brand equity
model. The overall significance of the proposed model is expected to come from its universality
and robustness. Because of its global nature and multi-country reliability, there will be a
tremendous possibility for implementing relationships from the model into the number of tools
for planning, developing, measuring, managing and monitoring tourism destinations by various
developed and developing countries, regional and local institutions, as well as emerging and
developing tourism markets.
Moreover, the significance of the thesis is in offering empowerment tool to the host
population, with an emphasis on developing power and trust to local, regional and state
institutions and stakeholders. Specifically, attention will be given to overtourism, the optimal
number of visitors, retention of the wealth, and the capacity of the local resources. The research
will support the notion that going overboard with consumption of resources, will cause more
crime, drugs, traffic, noise, alcoholism, pollution, loss of habitat and species, and deterioration
of natural and created resources which will, eventually, result in decrease of the destination
attractiveness, the image capital and ultimately the destination brand equity.
Furthermore, the significance will be in developing tools for managing the existing
destinations as well as for developing the new ones. It will offer local and state level
stakeholders, governments, DMO’s and investors way to optimize their investments and make
decisions that will encourage destination development under the umbrella of preserving or
enhancing the destination tangible and intangible resources.
This study introduces proposed theoretical model, that considers sustainability as a
destination promise in the context of tourism destination. Specifically, the study supports
Aaker’s (1991, 1996) CBBE model. In this thesis, an important fact is that the proposed model
merges the three elements of sustainability: economic, social and environmental and the four
elements of the destination brand equity(destination awareness, destination image, destination
perceived quality and destination loyalty), as defined in the original Aaker’s (1991, 1996)
model, into the single model.
The research encourages merging the economic, social and environmental sustainability
elements with the elements of destination brand equity: awareness, image, quality and loyalty
into the single model. The newly formed model combines functional, emotional and symbolic

21
values with the benefits that visitors are promised to receive and resources that are offered for
sustainable consumption.
Finally, the purpose of the thesis is to develop a comprehensive, practical and reliable
management tool for destination managers to produce valuable data for the destination
stakeholders for tracing, analyzing and monitoring tourism destination development process
under the umbrella of sustainable development practices.
1.4. Hypotheses and Adopted Methodology
The research process selected in this thesis consists of the several steps designed to deliver
research effort in the most efficient and effective way towards desired outcome. The research
starts with defining a research topic followed by the critical literature review and formulation
of the research gap. What follows is the formulation of the research questions along with more
specific research objective. After defining the research purpose two major and twelve
supporting hypotheses are identified from the theory.
The research in the thesis implements descriptive research method for describing
characteristics and behavior of the sample population. The method closely follows the
observational method that utilizes surveys as a way to collect population data. The thesis
supports philosophy of post-positivism and uses both inductive and deductive approaches. The
strategy of the research evolves around survey-based techniques utilizing mostly close-end
questions as a single-method to collect data. The research falls into the cross-sectional study
category. Collected data are analyzed and interpreted against theoretical domains. Data
collected in the survey are analyzed using multivariate analysis and used to test the outlined
hypotheses.
The primary hypotheses that capture the essence of the thesis are:
H1: There is a significant positive impact of tourism destination sustainability on tourism
destination brand equity.
H2: Tourism destination sustainability development and tourism destination brand equity
development are two parallel processes that merge to become one process in the long run.
The supporting hypotheses addressed in this thesis are:
H3: Economic sustainability has a positive impact on the destination awareness.
H4: Social sustainability has a positive impact on the destination awareness.
H5: Environmental sustainability has a positive impact on the destination awareness.
H6: Economic sustainability has a positive impact on the destination image.
H7: Social sustainability has a positive impact on the destination image.
22
H8: Environmental sustainability has a positive impact on the destination image.
H9: Economic sustainability has a positive impact on the destination quality.
H10: Social sustainability has a positive impact on the destination quality.
H11: Environmental sustainability has a positive impact on the destination quality.
H12: Economic sustainability has a positive impact on the destination loyalty.
H13: Social sustainability has a positive impact on the destination loyalty.
H14: Environmental sustainability has a positive impact on the destination loyalty.
1.5. Research Methodology
Following the research philosophy and selection of the acceptable methods within the
realm of marketing research and tourism analysis, the thesis considers positivism and
constructivism as the two possible candidates (Hanson & Grimmer, 2007, Franke & Mazanec,
2006; Jennings, 2009). Both tourism research and marketing studies fall into the consideration
of research philosophy on the two opposite sides of the spectrum.
Positivism, which follows ideas of the Vienna Circle, falls into empiricism under the
realism choice. The positivism method or approach is widely accepted by the social and natural
research community as philosophical view (Bloomberg, Cooper, & Schindler, 2008).
Positivism supports the ontological view that the truth (world) exists outside of us and is
objective. In other words, the world is external and is defined outside of our intervention.
Following the positivistic paradigm, a researcher has an independent role in collecting
quantitative facts in objective manner and interpreting facts by reducing the amount of
information (Bloomberg, et al., 2008).
On the other hand, constructivism belongs to the Kahn’s interpretation of the world, as a
part of the unrealism school of thought (Hanson & Grammar, 2007). As the same authors state,
constructivism, opposite of positivism, rejects objectivist epistemology and adopts relativist
ontology, supporting stand that an individual decides what the truth is. The major point of the
constructivism research is that individual viewpoint matters and that it serves as an example to
others). Constructionist research uses primarily qualitative research and rely on interpretation
and understanding. Because constructivism heavily dependents on interpretation, (Bloomberg
et al.,2008) the research paradigm is known as “interpretivism”. Interpretivist highly question
notion of generalization which is, along with reliability, validity and statistical significance, a
key concept in positivistic research (Bloomberg et al., 2008, Hanson & Grimmer,2007).
To avoid both extreme approaches (e.g., Yeganeh & Su, 2005) caused that the research
effort in this thesis settles for the middle-way. Hence, a “moderate” version of the positivism,
known as post-positivism, is adopted. Hanson and Grimmer (2007) elaborates that post-
positivism, which has different epistemological assumptions from positivism, suggest

23
methodology that supports probabilistic insights and the “viewpoint of the observer must be
borne in mind at all times in describing any part of the world”.
Demeritt, (2001) used heterogenous constructivism to examine global warming. The
author’s conclusion is that the subject must be viewed as mutual construction of nature, science
and society. However, this thesis also supports the heterogenous constructivism in evaluating
the elements of the tourism destination brand equity.
The classical empiricism and realist ontology introduced the concept of “impact”, a
metaphor that is commonly used with the respect to tourism and sustainability. World Tourism
Organization (UNWTO) and United Nations Development Programme (UNDP) report that
countries, as tourism destinations, lack capacity, structure and framework, to absorb the full
impact of sustainability on tourism, in reference to enhancing performance, by assessing the
impact and sharing knowledge (UNWTO & UNDP, 2017, p.12). As a result, tourism
businesses must gradually improve their performance, measure their progress and compare
themselves with other businesses. The same report defines sustainable tourism in relation to
the current and future social, economic and environmental impacts elaborating on enhancing
value to visitors, local communities, environment and the industry (UNWTO & UNDP, 2017,
p. 15).
Hall (2019) suggested that human impact is in the center of sustainable tourism research
which molds the thinking of how the term is explained. On the other hand, Head (2008) argues
that human impact on the environment and its features has increased over time in both scale and
intensity. The same author points that humans, who for centuries have pervasively occupied
the Earths’ ecosystem found themselves separated from the nature in the scientific research.
The study shows how entangled tourism and environmental domains are (Rutty, Gössling,
Scott, & Hall, 2015). Therefore, Hall (2019) argues that it is ironic that the term “tourism
impacts” or “tourist impacts” ontologically position tourism outside of the context of the
research or the subject that has been impacted. Yet the metaphor historically stays in
widespread use in tourism research, and it is used in this thesis as well.
The thesis adopts, the post-positivistic methodology since it follows the common
approach in the social scientific empirical research, including tourism and the holistic marketing
and branding studies. In other words, the prior theoretical considerations and conclusions are
the bases for the hypothesis. The causal relationship between multi-dimensional model
constructs are operationalized using multivariate statistics (Hair et al., 2010).
Based on Steenkamp & Bumgartner (2000), the main focus of the research methodology
applied in this thesis is consistent with the research analysis. Based on the earlier considerations
the research is divided in the five stages:
1. Literature review and development of the theoretical model for evaluation of the
causal relationship between the elements of sustainability and tourism destination
brand equity.
2. Development of the tourism destination-specific sustainability measurement scale
(Konecnik & Gartner 2007; Mihalič, Šegota, Knežević Cvelbar, & Kir, 2016; Iniesta-
Bonillo et al., 2016).

24
3. Development of the tourism destination-specific brand equity measurement scale
(Konecnik & Gartner, 2007; Yang, Liu, & Li, 2015; Bose, Roy, & Tiwari, 2016; Im,
Kim, Elliot, & Han, 2012)).
4. Establishing composite reliability and discriminatory validity of the measurement
model (Brown, 2006).
5. Establishing causal relations between the constructs of the proposed utilizing
multivariate statistical technique (Hair et al., 2010; Bartholomew, Steele, Moustaki,
& Galbraith, 208; Byrne, 2001;)
The research design and process for data collection is illustrated in Figure 1.1.
Figure 1.1. Analysis and Data Acquisition Process
Moreover, the study in the thesis uses the results of the proposed model validation for
both global indicators and the case of Serbia. The global indicators are used for the period of
2015-2018 as proxies of the constructs of the measurement model. On the other hand, to
increase robustness of the proposed model cross-validated on a survey data of a case Serbia is
analyzed. The survey in Serbia, was conducted, using the Google Form application-based
research instrument, on international visitors during the period between September of 2018 and
March of 2019 in Belgrade, Serbia.
Belgrade, the capital and the largest city in Serbia, is chosen since it is the most popular
destination for international tourists (57% in 2018) who are visiting Serbia (Statistical
Yearbook, 2019). Cross-validation of the model is done using the two different sets of data is
intended to show the empirical robustness, validity and reliability of the proposed model. The
thesis makes distinction among the framework, theory and model. 1.6. Structure of the Thesis
Global Study
Proxy Indicators Selection
Scale Develop.
Database in Excel
Model Testing
EFA, CFA SEM
Serbia Study
Scale Develop.
Data Collection
Model Testing
EFA
Model Fit Testing CFA & SEM
L
i
t
e
r
a
t
u
r
e
R
e
v
i
e
w
C
o
n
c
e
p
t
u
a
l
F
r
a
m
e
w
o
r
k
D
e
v
e
l
o
p
m
e
n
t

25
1.6. Structure of the Thesis
The Chapter 1 introduces the basis for the research goals by elaborating on the pragmatic
and theoretical gaps, that will serve as the background for the research study implemented in
the thesis.
Chapter 2 discusses the theoretical background of sustainability of tourism destinations
and shows theoretical connection with the destination brand equity development and destination
sustainability development. Also, the chapter offers historical overview of the development of
sustainable destination brand equity in the research literature. Most importantly, the chapter
provides a theoretical background of the impact of tourism destination sustainability on tourism
destination brand equity.
The chapter discusses the sustainable development literature review considering social,
economic and environmental aspects as the most important pillars of the sustainable
development model. The chapter evaluates the individual contribution of the social, economic
and environmental elements on the tourism destination brand equity. It formally evaluates
impacts of the social and environmental pillars on destination’s attractiveness. Next, the chapter
analyzes the significance of the balance between costs and benefits in the destination brand
equity context.
Moreover, the chapter introduces the concept of social exchange based on power and
trust. The social exchange theory is presented in the context of tourism destination attractiveness
based on the resident-visitor conflict and implications. Finally, the chapter outlines historical
overview of the research literature on how social dimensions impact development of
destinations and destination brand equity. Further, the chapter analyzes importance of the
power, trust, benefits and cost structure in tourism destination development. Moreover, the
chapter presents relationship between social exchange theory, tourism destination, power and
trust.
Chapter 3 outlines the historical overview of the brand equity concept and its application
in tourism destination development. Each element of the destination brand equity model:
awareness, image, quality and loyalty is separately evaluated. Finally, the chapter formally
introduces the theoretical model that captures the causal relationships between the elements of
destination sustainability model and destination brand equity model.
Chapter 4 formally presents the theoretical framework behind the formation of the model
by introducing the theoretical structure of the model and corresponding dimensions. Also, the
chapter outlines development of the literature-based hypothesis and reviews the development
of the tourism destination brand equity from the country perspective. The theoretical concept
behind the country as a brand is discussed as well as the framework for the country brand equity
in the destination context. Finally, the chapter contributes with the theoretical background of
the sustainable destination development concept by proposing the model based on the Aaker’s
(1991, 1996) and Keller’s (1993) CBBE models
The statistical methodology for the analysis is elaborated in the Chapter 5. In this chapter
the strategy for the development of research instruments is presented, and data collection and
26
preparations are explained. In addition, multivariate statistics is introduced and structural
equation modeling (SEM) technique is explained in detail.
In Chapter 6 the global case is tested based on quantitative proxy indicators and valuated
using exploratory factor analysis and confirmatory factor analysis. The causal relationships are
confirmed using structural equation modeling technique (SEM).
Chapter 7 tests the case of Serbia based on the survey data of foreign tourists visiting
Serbia. The results are presented and are tested for threshold values. Next, composite
reliability (CR), convergent and discriminatory validity is established. Also, causal or
hypothesized relationships among the elements of the proposed model are measured, tested,
evaluated and confirmed using structural equation modelling (SEM).
Finally, Chapter 8 discusses the future research initiatives as well as research limitations,
results of the study and the practical, managerial and theoretical significance of the work
presented in this thesis.

27
2. SUSTAINABILITY AS A PREMISE FOR DESTINATION BRAND EQUITY
This chapter introduces several important concepts behind the logic of using principles of
sustainability into the tourism destination development. It offers insights into the theoretical
aspects of the sustainability in the tourism destination context with evaluation of the general
concept of sustainability.
Next, the section sets up a comprehensive setting for the theoretical evaluation of the
impact of the sustainable development of tourism destinations, issues, and outcomes. The
section offers a review of the historical evolvement of the research literature and topics. Also,
the section introduces the concepts of sustainable destination brand equity development model
in a tourism destination context.
Furthermore, it evaluates interrelation among the dimensions such as economic,
environmental, social, value co-creation, trust, power, visitation, seasonality, and length-of-
stay. The chapter evaluates the theoretical framework for integration of tourism destination
brand equity development model with the concept of destination sustainable development is
presented.
Importance of the balance between the cost and benefits is analyzed in the context of the
sustainable destination development and the modern concept of social impact based on power
and trust as the way for parties to get the most of their relationship is highlighted.
Social exchange theory is evaluated from the perspective of tourism destination. The
section highlights the relations and causes of the resident-visitor conflict and the emerging
implications because of the interaction. Also, overtourism is highlighted as an emerging force
of destruction of tourism destinations as well as the concept of degrowth, as an emerging trend
in the scientific literature as a reaction and solution to overtourism.
Finally, the chapter introduces historical overview of the research literature on how social
dimensions impact development of a tourism destination and destination brand equity, the
importance of the power, trust, benefits and cost structure in tourism destination development.
Moreover, the relationships between social exchange theory, tourism destination, power and
trust are considered.
2.1. Evolvement of the Sustainable Tourism Research
Martínez, Martín, Fernández, and Mogorrón-Guerrero (2019) suggest that sustainable
tourism models must balance the environmental, social and economic interests while at the same
time tourism industry must use social and economic tools for development. Therefore, the
concept of sustainable tourism, must first be examined through the lens of sustainable
development which is a broader concept. In its general format, the concept refers to the ability
of the constructive activities to produce satisfactory outcomes for today’s requirements without
compromising the resources of the future generations). Besides the notions that the
preservation of resources upon which the activities rely on, must not affect the future outcomes,
the activities must satisfy the necessities of both the tourists and the local communities of
destinations World Tourism Organization (WTO, 1993). In this context, tourism industry is
considered multi-dimensional with respect to economic, social and environmental interests.
The balance between the three dimensions is not given and assured (Park, Lee, Choi, & Yoon,
2012).

28
In 2015, the United Nations Member States adopted the framework for peace and
prosperity for the people and planet called the 2030 Agenda for Sustainable Development. At
its core are the 17 Sustainable Development Goals (SDGs)(United Nations Sustainable
Development Goals [UNSDG 2030], 2019).
The sustainable development goals (SDGs) which are addressing how to evaporate
poverty, ensure prosperity and guard the planet quickly became focal point for the studies on
sustainable development tourism. In spite of the critics on how to achieve the SDGs (Scheyvens,
Banks, & Hughes, 2016), the dominant direction, as suggested by UNWTO & UNDP (2017,
p. 31), demands that tourism needs to be well managed, otherwise it can have negative impact
on people, planet, prosperity and peace. The critical factors for the success of the 2030 SDGs
are increased competitiveness, improved management, increased visibility of the private and
corporate domains, technology and efficiency (Herrera-Cano & Herrera-Cano, 2016; Henriques
& Brilha, 2017; Imon, 2017). However, Hall (2019) raises a concern on relying on business
ways and growth to achieve the SDGs and giving less importance to social and environmental
issues. The author says that solutions for achieving SDGs must be more reflexive and use
knowledge and management to better understand sustainability. There is a need to reformulate
human-environment relations in the light of mistaken belief that greater effort and efficiency
alone is enough to solve the problem (Hall, 2019).
Reviewing the state of tourism sustainability research of the first decade of the 21st
century, Buckley (2012) states that sustainability was viewed as a shorthand for human and
planetary future and that tourism research regarded it as a sideline subdiscipline. The same
author suggests that the large-scale environmental and social changes were affecting the world
in which tourism works, but few researchers were trying to deal with those changes.
In the subsequent article, Buckley (2015) argues that sustainability of tourism can be
evaluated through its impact on the five globally recognized social aspects defined as:
protection, population, peace, prosperity and pollution. His point was that the technical side of
the tourism sustainability at the level of tourism enterprises is all about managing environmental
impacts including pollution. The author states that at the global level, economic growth has
always been related to the worsening of sustainability. Historically, only in the times of global
recession the impacts on the resources were reduced. The author’s overall conclusion is that
applying efficient-waste and resource-lowering technologies can further reduce impacts
suggesting that tourism industry is taking actions to reduce negative impacts on both human
and natural resources and creating positive results by supporting the conservation and protection
of the endangered species and natural habitat (Buckely & Pegas, 2012; Buckley et al., 2012).
However, the authors agree that tourism industry, as a whole, remains oriented towards growth
and, therefore, not sustainable.
Higgins-Desbiolles (2018) states that tourism today is devoted to growth, distancing itself
from the sustainable goals. Despite the social and ecological boundaries of the life on the planet
with finite resources which has generated numerous initiatives for development of sustainable
tourism for the last thirty years, tourism industry continues to promote tourism growth. The
author advocates creating a global Tourism Wealth Fund to support variety of initiatives to
tourism strategies for regulating and developing better methods for measuring human benefits,
ecological limits and tracking sustainable achievements. The argument is made that sustainable
tourism is more about sustaining tourism and less about sustainable development.

29
Butler (1999, p. 35) formulated definition of destination sustainable tourism as a viable
concept that can exist in a destination for indefinite period of time only if it doesn’t deteriorate
or alter the environment (physical and human) in which it exists to the extent that it limits the
successful development and prosperity of other processes and activities.
Tourism environment is a subject of intricate interactions caused by the tourists’ activities
on the environment known as tourism impact. The impact could produce either positive or
negative outcome categorized as economic, environmental and socio-cultural (Hall, 2019;
Fennell, 2007). Positive effects of the tourism activities are in creating jobs, local prosperity,
improvement of the public image of the destination, region and country, preservation of cultural
heritage, and improvement of the business network (Andereck, Valentine, Knopf, & Vogt,
2005). Collateral effects to the residents include increase of leisure time, cultural interaction,
increase in global knowledge and trends, more focus on the natural environment, improvements
in infrastructure and public transportations, among others (Almeida, Peláez, Balbuena, &
Cortés, 2016).
However, from another standpoint, the negative effects are quite many and include
disruption of the local lifestyle, overcrowding of public spaces, increase in property prices,
personal safety, environmental damage, increase in waste-pollution and overuse of resources
(Almeida et al., 2016). Martínez et al. (2019) argue that the cause of the tourism impact is
significantly related to the number of tourist arrivals and the magnitude of the tourist
concentration during certain periods of the year. Also, the other authors consider seasonality
as one of the key factors that influence sustainability (Altinay, 2000; Shen, Luo, & Zhao, 2017;
Martin, Salinas, & Rodriguez, 2018).
Furthermore, when there are too many tourists visiting a destination and cause overuse of
its social and environmental capacity, we have overtourism (Insch, 2019). The same author
states that there is a need at the local level to ensure sustainable development and better
management of the tourism influx. The author further states that all levels of government,
including tourism industry, and participation of residents are needed to implement sustainable
market strategy for tourism development that will ensure satisfaction of the needs of present
and future generations. According to Seraphin, Sheeran, & Pilato (2018) a balanced, higly
skilled management approach should be implemented to deal with overtourism.
Overtourism is a modern, rapidly emerging and growing concept in the sustainable
tourism development. Overtourism is a global phenomenon that is affecting the mainstream
tourism, propelled by the negative effects such as environmental and cultural degradation,
crowdedness, gentrification and residential dissatisfaction. Insch (2019) states that analysis of
big data could aid managers and policy makers in obtaining insights in tourism behavior which
can be used to aid management policies for infrastructure development, and to develop
innovative ways to reduce adverse effects of seasonality and redirect tourists to less crowded
areas. The author suggested that is necessary to maintain high level of tourism experience but
not at the expense of the host population and environment. This could be achieved by proactive
monitoring and evaluation of destinations’ capacity, infrastructure gaps and residents’ attitude
towards tourism.
Overtourism is being felt by many developing and developed countries as well as highly
urban destinations such as Venice, Barcelona, Reykjavik, Amsterdam, Bali, and Dubrovnik
(Insch, 2019; Seraphin, Sheeran, & Pilato, 2018).
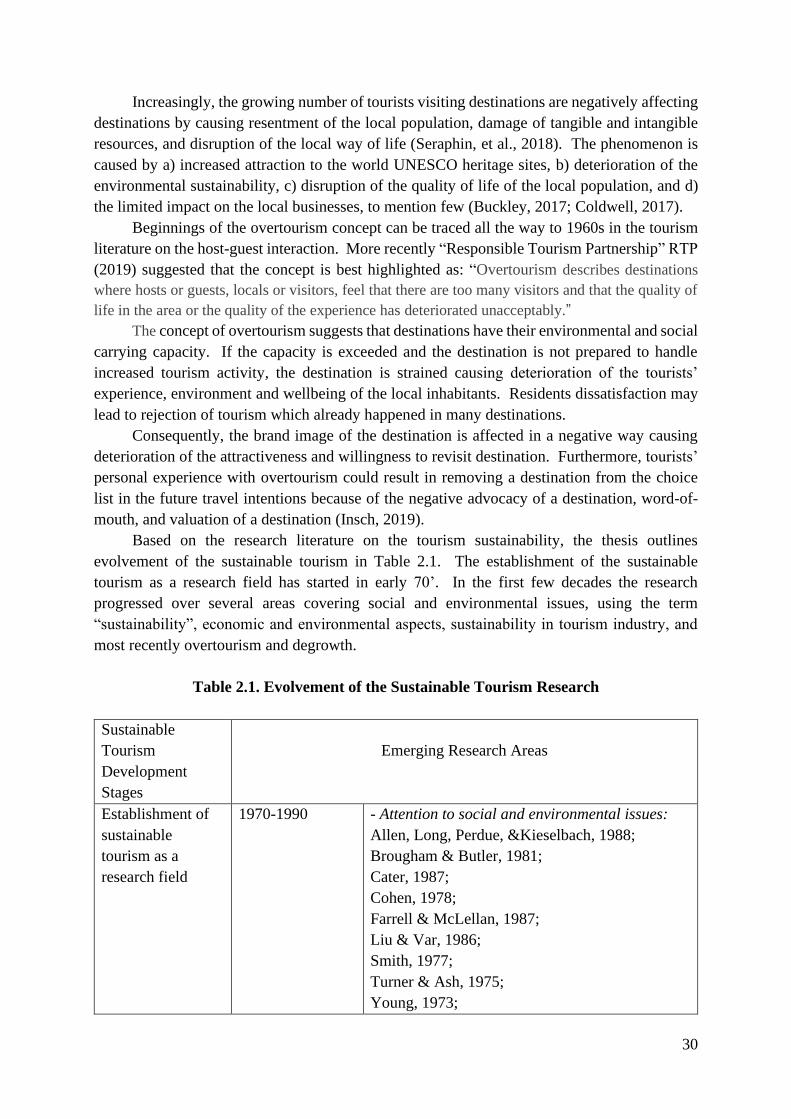
30
Increasingly, the growing number of tourists visiting destinations are negatively affecting
destinations by causing resentment of the local population, damage of tangible and intangible
resources, and disruption of the local way of life (Seraphin, et al., 2018). The phenomenon is
caused by a) increased attraction to the world UNESCO heritage sites, b) deterioration of the
environmental sustainability, c) disruption of the quality of life of the local population, and d)
the limited impact on the local businesses, to mention few (Buckley, 2017; Coldwell, 2017).
Beginnings of the overtourism concept can be traced all the way to 1960s in the tourism
literature on the host-guest interaction. More recently “Responsible Tourism Partnership” RTP
(2019) suggested that the concept is best highlighted as: “Overtourism describes destinations
where hosts or guests, locals or visitors, feel that there are too many visitors and that the quality of
life in the area or the quality of the experience has deteriorated unacceptably.”
The concept of overtourism suggests that destinations have their environmental and social
carrying capacity. If the capacity is exceeded and the destination is not prepared to handle
increased tourism activity, the destination is strained causing deterioration of the tourists’
experience, environment and wellbeing of the local inhabitants. Residents dissatisfaction may
lead to rejection of tourism which already happened in many destinations.
Consequently, the brand image of the destination is affected in a negative way causing
deterioration of the attractiveness and willingness to revisit destination. Furthermore, tourists’
personal experience with overtourism could result in removing a destination from the choice
list in the future travel intentions because of the negative advocacy of a destination, word-of-
mouth, and valuation of a destination (Insch, 2019).
Based on the research literature on the tourism sustainability, the thesis outlines
evolvement of the sustainable tourism in Table 2.1. The establishment of the sustainable
tourism as a research field has started in early 70’. In the first few decades the research
progressed over several areas covering social and environmental issues, using the term
“sustainability”, economic and environmental aspects, sustainability in tourism industry, and
most recently overtourism and degrowth.
Table 2.1. Evolvement of the Sustainable Tourism Research
Sustainable
Tourism
Development
Stages
Emerging Research Areas
Establishment of
sustainable
tourism as a
research field
1970-1990 - Attention to social and environmental issues:
Allen, Long, Perdue, &Kieselbach, 1988;
Brougham & Butler, 1981;
Cater, 1987;
Cohen, 1978;
Farrell & McLellan, 1987;
Liu & Var, 1986;
Smith, 1977;
Turner & Ash, 1975;
Young, 1973;
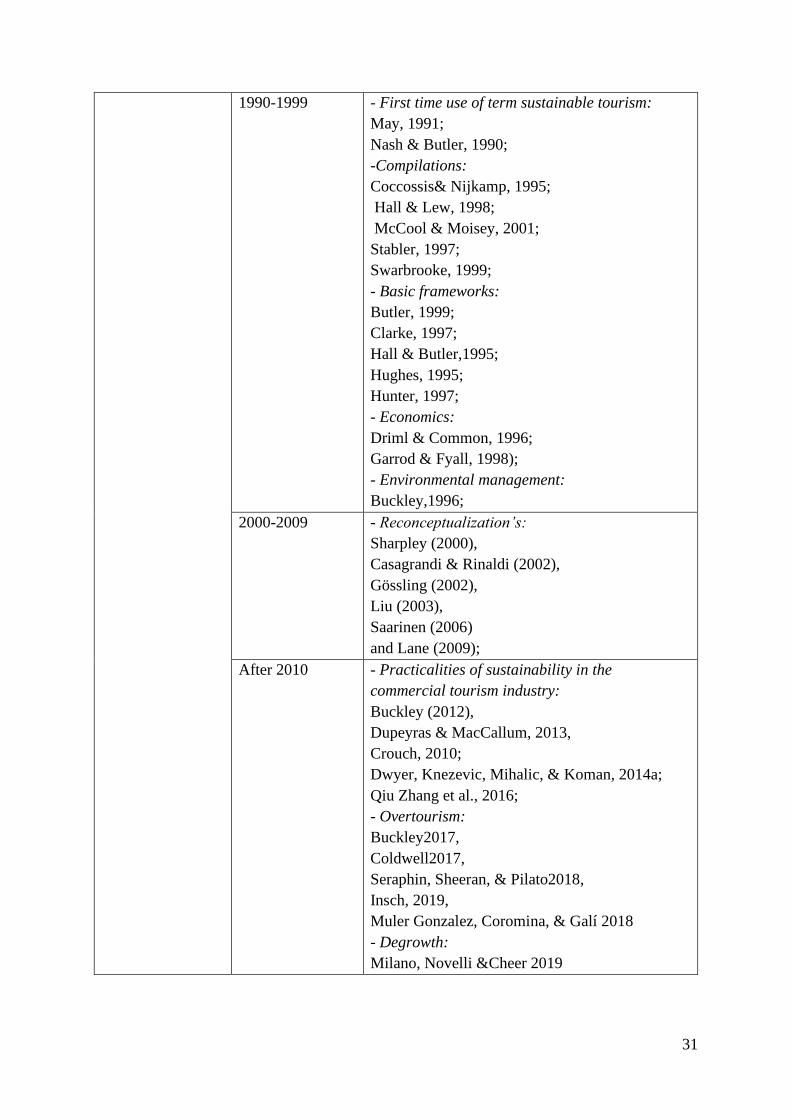
31
1990-1999 - First time use of term sustainable tourism:
May, 1991;
Nash & Butler, 1990;
-Compilations:
Coccossis& Nijkamp, 1995;
Hall & Lew, 1998;
McCool & Moisey, 2001;
Stabler, 1997;
Swarbrooke, 1999;
- Basic frameworks:
Butler, 1999;
Clarke, 1997;
Hall & Butler,1995;
Hughes, 1995;
Hunter, 1997;
- Economics:
Driml & Common, 1996;
Garrod & Fyall, 1998);
- Environmental management:
Buckley,1996;
2000-2009 - Reconceptualization’s:
Sharpley (2000),
Casagrandi & Rinaldi (2002),
Gössling (2002),
Liu (2003),
Saarinen (2006)
and Lane (2009);
After 2010 - Practicalities of sustainability in the
commercial tourism industry:
Buckley (2012),
Dupeyras & MacCallum, 2013,
Crouch, 2010;
Dwyer, Knezevic, Mihalic, & Koman, 2014a;
Qiu Zhang et al., 2016;
- Overtourism:
Buckley2017,
Coldwell2017,
Seraphin, Sheeran, & Pilato2018,
Insch, 2019,
Muler Gonzalez, Coromina, & Galí 2018
- Degrowth:
Milano, Novelli &Cheer 2019
32
In the sustainable tourism destination development scenario, the rapidly emerging
concepts of overtourism is usually followed by a new, contemporary and rapidly emerging
concept of degrowth. In incidents where popular destinations become a subject of uncontrolled
and unregulated consumption of its resources by tourists, the degrowth has emerged as a top
agenda of the protest movements led mostly by the social groups. Those groups advocate that
direction of tourism development models should take a shift from “tourism growth” to “tourism
degrowth” (Milano, Novelli, & Cheer, 2019). Advocates of degrowth find the arguments in
tourism growth that has caused adverse, marginalizing and disruptive effects on tourism
destinations.
As some cities and island destinations experienced exponential growth in tourist arrivals,
and corresponding increase in economic activity, the agenda of degrowth has emerged,
supported by the political agenda of social groups. In the last decade, the Philippine island of
Boracay and Thailand’s Maya Bay beach at Phi Phi Leh island became visible symbols of the
overtourism and subject to “degrowth” agenda of the social movements (Milano, et al., 2019).
Despite the fact that literature on tourism degrowth is rather scarce (Andriotis, 2014;
Hall C. M.,2009; Canavan, 2014), there is an increased activity in tourism research associated
with social movements, overcrowding effects and degrowth support (Demaria, Schneider,
Sekulova, & Martinez-Alier, 2013; Milano C. , 2018). According to Kallis, et al. (2018)
degrowth is a reaction to economic prosperity, where production and consumption are not in
sync and where supply side overuses the resources to collect the benefits while the costs are left
to local communities to bear. The same authors suggest that it is important to evaluate how can
reduced consumption and production coexist without tapering prosperity and standards of
living. In other words, the question is if the shift from “growth for development” to “degrowth
for livability” is a step towards more sustainable and just outcomes?
Another factor that is increasingly attracting researchers’ attention is the concept of a
destination’s seasonality. It is quite common that seasonal sensitive destinations, during the
peak periods, exceed their carrying capacity causing destination resources to go overboard with
their ability to meet tourists’ demands.
Impact of sustainability in the destination context can be analyzed by a paradigm that
comprehensively tests influence of the building elements of sustainability and destination brand
equity ( Kim & Lee, 2017; Kim, Thapa, & Kim, 2017; Cottrell, et al., 2013; Iniesta-Bonillo, et
al. , 2016; Andereck & Vogt , 2000; Byrd, Bosley & Dronberger, 2009; Chen & Chen , 2010;
Kao, Huang, & Wu 2002; Qiu Zhang et al., 2016).
Social domain, is playing an important role in developing and measuring destination
brand equity (Choi & Sirakaya, 2005; Stronza & Gordillo, 2008; Hung, Sirakaya-Turk &
Ingram, 2011). Also, tourism businesses with adaptive and innovating capacities are
considered more resilient (Dahles & Susilowati, 2015).
There is no single method of measurement that completely evaluates sustainability for
each global scenario (Evans, Srezov, & Evans, 2015; Gartner, 2014). Also, measuring
sustainable development which is not possible by traditional economic models cannot be based
only on growth per capita income or gross domestic product (GDP) since they provide a
distorted picture about reality. Therefore, different approaches for the valuation and
quantification of sustainability are needed (Evans et al., 2015).

33
Rather, the measurement model must include social variables (Evans et al., 2015).
Gartner (2014) and Evans et al. (2015) argue that significant attention should be on to natural,
human and social capital.
Sustainable development of tourism became a major focus of tourism policy officials,
destination marketing organizations (DMOs), and related industries and tourism researchers.
The World Tourism Organization (UNWTO) places tourism sustainability as a key issue in all
its publications besides social responsibility, ethics, tourism and development, competitiveness
and knowledge.
The importance of sustainable tourism is shown when United Nations (UN) proclaimed
the 2017 as the official Year of Sustainable Tourism for Development. Despite such attention
and interest, empirical research suggests that the global tourism is in fact less sustainable then
ever (Hall, 2011; Hall, Gössling & Scott, 2015). Global concerns about impacts that tourism
development has on sustainability are further evident at the local communities1.
Taylor (1995, 1999) coined the term “heterogeneous constructionism” to address the
problem of sustainable tourism by emphasizing the significance of heterogeneity of resources
and to distinguish the common views of social elements that support notion that researchers’
views are determined by their social culture. Sustainability is an environmental issue requiring
that we view the environment from the personal, economic, management and policy terms (Hall,
2019).Therefore, sustainable tourism development questions biophysical process for tourism
production systems and needs to address the dualistic nature of the socio-economic processes.
Demeritt, (2001) used heterogenous constructionism to examine the construction of
global warming and the politics of science. The author’s conclusion is that the subject must be
viewed as mutual construction of nature, science and society. This thesis supports the
heterogenous constructionism in evaluating the elements of the tourism destination brand
equity.
The classical empiricism and realist ontology introduced the concept of “impact”, a
metaphor that is commonly used with respect to tourism and sustainability. Hall (2019)
suggested that the metaphor of human impact is a major focus of sustainable tourism which
molds the thinking of how the term is explained (Head, 2008). The research on the global
environmental change shows just how extremely entangled tourism and environmental systems
are (Rutty, et al., 2015). Therefore, it is ironic that the term “tourism impacts” or “tourist
impacts” ontologically position tourism outside of the context of the research or the subject that
has been impacted. Yet the metaphor historically stays in widespread use in tourism research
and is considered as a critical term for the title of this thesis.
Next, Head (2008, p. 374) argue that fewer number of assumptions makes model simpler
to explain. However, the stand that relationship is “simple” takes many more assumptions than
the view that it is complex. Furthermore, Demeritt (2001, p. 308-309) points out that science
and cultural politics are undervalued in knowledge studies.
However, little attention has been given to the cultural politics of the scientific practice
and its role in influencing, and consequently, framing knowledge. Also, the same author
disputes the construction of research questions, standards of proof, choice of methods, and the
definition of other aspects of what constitutes “fine” scientific exercise demands relying on
1 Negative reactions on overtourism, as mentioned earlier, are growing in destinations. Those concerns are
further elaborated in the distinctive study by (Dichter & Manzo, 2017).

34
policy relevance. Therefore, there is an argument that interpretation by heterogenous
constructionist interpretation, on society-environment-technology, brings up questions about
the consequences of the interaction between tourism and long-term sustainable goals (Demeritt,
2001).
2.2. Sustainable Development of Tourism Destinations
As we enter the 21st century, sustainable development of tourism destinations and
sustainability become a paramount model for long term strategies that include planning,
development and marketing effort by government institutions, private sector, destination
planners, and other stakeholders. In the meantime, the word “sustainable development” became
very popular as a construct used for depicting political programs (Dymond, 1997). As
development of tourism destinations forced the destinations’ stakeholders to understand
changes in the environment and society, the sustainable development became a dynamic
process.
United Nations (2008, p. 21) proposed an integrated view of sustainable development
stating that the goal of the sustainable development is to insure well-being of the present
population and the potential for the well-being of the future generations. The main point of the
integrated view is to reconcile the needs of the present generations with the opportunities of the
future ones. Consequently, the view supports the measurements of sustainable development
must equally focus on the options of both present and future parties.
In the beginning, the focus was more on the environmental and economic issues.
However, the impact of justice, local community empowerment, equality and reduction of
poverty proved too important to be ignored. Very soon, the social elements became the
foundation of the sustainable development of tourism destinations (Ahn, Lee, & Shafer, 2002).
Contemporary view on sustainable development includes a complex bundle of development
schemes including development of tourism destinations (Brida, Osti, & Barquet, 2010). One
of the main principles of sustainable tourism development is that benefits should also go to the
local community to strengthen the local economy, employ local people, and use local resources.
The policies and the laws should be developed to empower the destination community in
economic, social and environmental aspects. The major objectives of the sustainable tourism
development are maximization of benefits and minimization of costs, engagement of local
community and enhancing the tourism experience (Cottrell et al., 2013). The unprecedented
growth of tourism worldwide demands importance of applying the sustainable development
principles in every facet of the tourism destination development including tourism businesses,
tourists and host destination.
Cottrell et al., (2013) supports an argument that the basic tourism sustainability
development paradigm besides its three basic components: economic, social and environmental,
should include institutional aspects. The argument advocates the importance of the institutional
support in implementing social, economic and environmental policies. Therefore, the authors
propose the prism of sustainability concept, a paradigm theorized by Spangenberg (2002). The
paradigm is conceptualized and operationalized around four interrelated dimensions: economic
sustainability, social sustainability, environmental sustainability and institutional sustainability.
The model’s economic sustainability relates to the employment, livelihood, material wellbeing

35
as well as the infrastructures such as roads, buildings, airports, etc. Environmental
sustainability relates to renewable and non-renewable resources and natural environment. On
the other hand, issues of social sustainability include, besides the basic human rights, skills,
knowledge, awareness, behavior and experience. Finally, the institutional sustainability
denotes power, trust, planning, partnerships, implementation, government institutions etc.
(Keiner, 2000; Spangenberg, 2002).
Iniesta-Bonillo et al., (2016) state that perceived sustainability of a tourism destination
increases perception of the tourism destination value. The authors developed the model to prove
that perceived sustainability foretells the perceived value of a tourism destination from the
marketing perspective. This thesis considers sustainability as multidisciplinary construct that
consists of social, cultural, economic and environmental elements. Also, the thesis places
tourists’ experience as the key construct of the model by empirically evaluating the perceptual
elements of destination sustainability (economic, social and environmental) and destination
brand equity elements (awareness, image, quality and loyalty).
The lack of agreement how to measure sustainability is still present (Buckley, 2012; Ko,
2005). One group of authors suggest indicators based on the geography (Cernat & Gourdon,
2012; Ko, 2005). The other authors apply three and four-element multidimensional models
utilizing economic, social, environmental and institutional approach (Cottrell, et al., 2013), or
seven–element paradigm with environmental, cultural, political, economic, social, managerial
and governmental dimensions(Bramwell, et al., 1996).
Sustainable development of a tourism destination influences value-creation, management,
processes, operation, practices and supports the need for market-based practices. Iniesta-Bonillo
et al. (2016) suggest that besides support from the institutional and stakeholder theory, which
supports social structure and stakeholders’ demands respectively, the accent should be given to
increasing the tourists’ perceived value. The research literature considers perceived value as a
conceptualization between “give” and “get” trade-offs. More precisely, the related research
literature views the value of a destination as process of organizing, selecting, receiving and
interpreting information related to different tourists’ experiences at a destination to create a
meaningful picture of the value of destination experience (Prebensen, Woo, Chen, & Uysal,
2012). The destination brand equity theory recognizes this as a formation of image, quality,
awareness and, consequently as a creation of attitudinal loyalty.
Keller (2013) recognizes that human mind influences the value of the brand equity which
in this case supports notion that the human mind is the bond between perceived destination
sustainability and the destination brand equity. Further author states that the strength of the
attachment to a destination lies in what humans think, feel, associate, perceive, imagine, expect,
experience and love about the brand (destination). So, feeling of the mind, in combination with
the voice of the heart, leads to an extensive feeling of loyalty, resonance and strong attachment
to a brand (Keller, 2013).
Based on the above, the two major hypotheses will be defined below while twelve
supporting hypotheses will be formulated in reference to the four elements of destination brand
equity in chapter 3. Separate formulation is required to better capture the context and
relationship between the elements of destination sustainability represented by economic, social
and environmental sustainability with the elements of destination brand equity represented by
destination awareness, image, quality and loyalty. The thesis formulates the basic hypothesis:

36
H1: There is a significant positive impact of tourism destination sustainability on tourism
destination brand equity.
The significant positive impact means that sustainability element in each occurrence (p
= 0.001) loads on destination brand equity with the same value of the regression loading factor.
The causal relationship between the tourism destination sustainability and tourism destination
brand equity suggests that in the implementation of the elements of sustainable destination
development triggers the change in tourism destination brand equity. Iniesta-Bonillo et al.
(2016) and Prebensen et al. (2012) suggest that sustainable development influences, over the
long period of time, wide range of destination characteristics that affect tourists’ experience at
the destination.
Tourism destinations are living, dynamic, lively, unique and specific actuality wrapped
in the residential heritage and culture, natural environment and economic reality. Therefore, it
is easy to lose sight of the value of a destination brand equity if only outcomes from the
marketing results are used. Besides economic factors such as visitation, receipts, employment
and so on, it is necessary to consider the overall long-term health of a destination from the
perspective of the environment and residents’ socio-cultural well-being. Consequently, using
service marketing approach to determine the destination brand equity is the same development
path as one used for the long-term sustainable development (Gartner, 2014; Van der Zwan &
Bhamra, 2003). However, only recently tourism general development effort has begun to
recognized sustainability as a part of the process. This forms the bases for the formulation of
the following hypothesis:
H2: Tourism destination sustainability development and tourism destination brand
equity development are two parallel processes that merge to become one process in the long
run.
The 1992 Rio Earth Summit produced the service guide for more sustainable future
development that included the concept of eco-efficiency which meant “achieving more for less”
which entailed offering customers added value while reducing impact on environment. A
decade later, the concept became a foundation for sustainable development and the bridge
between service marketing literature and sustainable development (Meijkamp, 2000). Initially,
the focus was on the impact of marketing services on environmental sustainability.
Consequently, the pressure to reduce environmental impact, resulting from manufacturing and
consumption of products and services, resulted in the development of the concepts such as
sustainable product design and sustainable technology development. The social, economic and
organizational advancements quickly followed (Roy, 2000).
Mitchell et al., (2010) introduced the sustainable marketing orientation concept which is
based on economic, social and environmental objectives and inclusion of the brand
management. Zouganeli, Trihas, Antonaki and Kladou (2012) state that features such as holistic
management, long-term development and stakeholders’ participation are equally important in
sustainable development and branding of a tourism destination. Consequently, sustainable
development and destination branding can be one process if there is a simultaneous agreement

37
between tourism demand, policy objectives and residents. Moreover, the authors state that only
if residents agree with the projected image of their destination, should they be expected to “live
the brand”.
Dinnie (2009) argues that brand identity is multifaced construct made out of emotional
and functional benefits and represent the core dimension around which all brand development
should take place. The identity consists of attributes such as recreation, sports, safety, comfort,
climate, infrastructure, natural resources, shopping, scenery, culinary attractions, architecture,
easy of communication and friendliness of residents, tradition, heritage, music, literature,
history, landmarks, atmosphere and tradition.
Therefore, Gartner’s (2014) and Van der Zwan and Bhamra, (2003) suggest that
sustainable development and brand equity development of a destination are almost identical in
terms of objectives, outcomes and implications, so that both processes can be considered as one.
Gartner (2014) goes further to explain that a traditional approach of measuring brand equity as
an economic return from marketing strategies does not produce the exact output when analyzing
the destination brand equity. He points that it would be the same as using only the economic
equation and ignoring the impact of the other two elements: the social and environmental. Even
thought, economic profit makes a lot of sense when analyzing consumer products, it creates
narrow-mindedness when it comes to measuring a destination brand equity.
2.3. Valuation of Sustainable Tourism Destination
In this section, the thesis formally introduces the theoretical framework for evaluating
and measuring sustainability of tourism destinations. The concept of measurement of
sustainable development is surrounded by many challenges from conceptual and empirical
domain. Hamilton & Atkinson (2006) state that sustainability needs to be measurable if it is to
mean anything at all. The authors support that proper proxy indicators are important to provide
valuable direction for policy makers. Further, the authors state that errors made by the improper
selection of indicators will have impact not only on the well-being of the current population,
but also on those living in the future.
Gartner (2014), United Nations (2008) and Hamilton & Atkinson, (2006) further support
this notion arguing that sustainable development of tourism destination to have a long-term
perspective has to be tracked, monitored, analyzed and therefore measured. In that regard, this
thesis adopts the concept that for any valid development of sustainable tourism destination a
practical set of meaningful indicators needs to be selected.
Perceived sustainability of a tourism destination and its perceived value has been a subject
of the significant research effort. The flexible definition of the concept allows diverse
interpretations and formulations of the concept (Iniesta-Bonillo, et al., 2016; Cernat & Gourdon,
2012; Higgins-Desbiolles, 2010). Consequently, because of the multivariate nature of
sustainability and difficulties in collecting large amount of information required, there is no
agreement on the widely accepted list of indicators. Further, Iniesta-Bonillo, et al. (2016) states
that measurement of sustainability of tourism destinations is even more intricate because the
effort includes measurement of the tourists’ perception and the market.

38
Figure 2.1 Conceptual Model (Iniesta-Bonillo, et al., 2016)
On the other hand, Hult (2011) argues that viewing the sustainability from the marketing
point of view involves customers. In that sense, sustainability can be used as a strategic asset
for achieving competitive advantage (Dwyer, Edwards, Mistilis, Roman, & Scott, 2009).
The next few examples from the research literature will shed more light into the
relationships between the elements of destination sustainability on the elements of destination
brand equity. To analyze how sustainability affects perception of a tourism destination, Iniesta-
Bonillo, et al. (2016) proposed the model that supports multidimensional construct that includes
economic, socio-cultural, environmental sustainability, perceived sustainability, perceived
value and satisfaction dimensions. The model is presented in Figure 2.1., p. 36)
The corresponding survey measures data for elements: economic sustainability, cultural
sustainability, environmental sustainability, perceived value and satisfaction while perceived
sustainability is evaluated as a second-order construct (Iniesta-Bonillo, et al., 2016). The
authors measured the three suggested sustainability dimensions by modifying the scale based
on economic sustainability, cultural sustainability and environmental sustainability adopted
from Andereck & Vogt (2000) and Byrd, Bosley, & Dronberger (2009), perceived value
adopted the scale based on “worth visiting a destination” adopted from Chen & Chen (2010),
and satisfaction adjusting the four-item scale of Kao, Huang, & Wu (2002).
The multivariate analysis of the conceptual model in Figure 2.1, page 38, proves
significant relation between the perceived elements of sustainability and the second-order
element of sustainability, positive and significant relation between perceived sustainability and
perceived value, and positive significant relation between perceived value and satisfaction. The
Environmental
Sustainability
Perceived
Sustainability (2nd order)
Satisfaction
Perceived
Value
Economic
Sustainability
Cultural
Sustainability

39
robustness of the model was cross-validated on the data from two tourism destinations (Iniesta-
Bonillo, et al., 2016).
Figure 2.2. Conceptual Model (Cottrell et al., 2013)
According to Cottrell et al., (2013) sustainable tourism valuation, besides three standard
elements: economic, socio-cultural and environmental should include institutional dimension.
The authors are pointing that it would be difficult to measure sustainable tourism without
including institutional perspective and role in supporting and mediating growth. Satisfaction
element is defined by 5 observable variables: I can influence tourism development, tourism
benefits me, importance of having sustainable tourism, tourism improves attractiveness of the
area, and my quality of life has improved because of tourism.
The conceptual model, shown in Figure 2.2 on page 39, confirms that all four
sustainability elements have positive significant impact on the satisfaction of the local residents
with the sustainable tourism development.
Satisfaction
with
Tourism
Economic
Socio-cultural
Environmental
Institutional

40
Figure 2.3. Conceptual Model (Kim et al., 2017)
In another study, authors Kim, Thapa, & Kim (2017) proposed the model in Figure 2.3
on page 40, to analyze the causal relations between the elements of perceived sustainability of
tourism destination Jeju Island, South Korea and the group of dimensions consisting of positive
word-of-mouth, behavioral intention and environmentally responsible behavior. The model
supports conceptualization of the perceived destination sustainability as a multi-dimensional
construct comprised of economic, cultural and environmental dimensions. The model’s
individual constructs use scale between two to four observable variables.
The authors suggest that word-of-mouth and revisit intentions are positively and
significantly influenced by the three dimensions of perceived sustainability. In other words,
study confirms that both aspects of destination loyalty, behavioral (word-of-mouth) and
attitudinal (intention), are positively influenced by the elements of destination sustainability.
Another group of authors, Kim & Lee (2017) proposed the model in Figure 2.4 that
captures indirect impact of price, advertisement, publicity and world of mouth on destination
loyalty. The study considers destination brand quality, awareness and image as mediators. The
survey is based on the data of the Chinese tourists visiting Seoul, South Korea. The study finds
that price, advertisement, publicity and world-of-mouth have significant effect on the
destination perceived quality, destination awareness and destination image.
Also, the study shows that destination awareness impacts perceived quality and
destination brand image. Also, the study confirms impact of the perceived quality and
destination image on destination brand loyalty. The findings in the four studies from the
Positive
Word-of-Mouth
Communication
Revisit
Intentions
Environmentally
Responsible
Behavior
Economic
Cultural
Environmental

41
research literature shown above, support the concept of the impact of the elements of
sustainability on the elements of destination brand equity as a valuable research concept.
Figure 2.4. Structural Model (Kim & Lee, 2017)
Since the previous research on destination brand equity regards loyalty and image as the
most influential elements to destination brand equity (Konecnik & Garnter, 2007), further
implications are that if destination loyalty is positively influenced by destination sustainability
then the same can be said for destination brand equity.
On the other hand, the environmentally responsible behavior is negatively influenced by
environmental sustainability and positively impacted by cultural sustainability dimension. The
negative influence of environmental sustainability is regarded to visitors not being aware of
their harmful behavior on the natural resources (Kim et al., 2017).
Gartner (2014) and Buckley (2012) both agree that besides economic factors such as
visitation, receipts, employment and other indicators, it is necessary to consider the overall long-
term health of a destination from the perspective of the environment and residents’ well-being.
Brand
Perceived
Quality
Advertisement
Price
Publicity
Word of mouth
Loyalty Brand
Awareness
Brand Image

42
To build a theoretical foundation for valuation of the sustainable tourism destinations the
thesis considers theories from sustainability, social, holistic, and environmental domains, as
shown in Table 2.2.
Table 2.2 Theoretical Foundation for Sustainable Development of Tourism Destination
Theory Domain Description Constructs Source
Measuring
Sustainable
Development
Sustainable
Development
Economic,
Social,
Environmental
United Nations (2008)
Original Form
of Integration
Sustainability Three separate
equations for
measuring impact
on sustainable
destination brand
equity
Economic,
Social,
Environmental
Lee & Kirkpatrick.
1997; Gartner, 2014
Social
Exchange
Theory
Social Exchange Process Power, Trust,
Benefits, Cost
Ward & Berno, 2011;
Nunkoo & Gursoy, 2012
Holistic
Framework
Economic,
Consumer
Aspirational,
Co-creation,
Eco-centric,
Transformational,
Shared Value,
Optimization
Expenditure,
Length of Stay,
Seasonality
Porter et al., 2011;
Scharmer et al., 2013;
Dwyer et al., 2017;
Dwyer et al., 2014;
Barros et al., 2010;
Weaver et al., 2000
Integrated
Theoretical
Framework
Environmental Environmental
Awareness,
Pro-
environmental
Behavior
Motivation,
Skill,
Knowledge
Steg, et al., 2014
As mentioned above, the long-term focus of sustainable development must be measurable
in order to verify whether it has been achieved. The same applies for the development of the
destination brand equity. Since, the economic domain offers only arrivals and receipts to
measure the value of the destinations, development literature on measuring sustainable
development offers the answer (Atkinson, et al., 1997, p. 16).
The works of Lee and Kirkpatrick (1997, pp. 11-13) proposes an approach in measuring
sustainable development called original form of integration. The model comes in two flavors:
strong and weak and consists of the three regression equations: economic, social and
environmental, as shown on page 42.
The equations of the original form of integration concept are operationalized by selecting
the proxy variables that are believed important for the evaluation of a destination. In its
operational format the equations of the original form of integration are presented below (Lee &

43
Kirkpatrick, 1997, pp.11-13). The proposed format corresponds to the concept of multivariate
and structural equation modeling analysis.
S1= aE1+…. +nEn;
S2= aL1+…. +nLn;
S3= aN1+…. +nNn;
S = S1+S2+S3
S1 = economic equation
S2 = social equation
S3 = environmental equation
S = output of the sustainable destination brand equity development
a-n = weights associated to each variable
E’s = economic variables
L’s = social variables
N’s = environmental variables
Other works such as United Nations (2008, p.61) report suggests that besides the flows
of goods and services, the well-being is created by non-market assets such as accomplishing
self-fulfillment, radiating positive energy, and enjoying scenery. The non-economic values, as
indicators of sustainable development that capture those assets must be also measured otherwise
gains in revenue from the market would be inaccurate and misleading in isolation.
The point was made that the economic indicators alone are not sufficient and, therefore,
have to be supplemented with indicators from the choice of non-monetary measures. The report
states that besides economic indicators, the attention should be given to environmental and
social ones. The report encourages use of environmental indicators related to natural landscape,
pollution, water quality, air and climate. However, the report goes further to suggest that using
only economic and environmental indicators without the social ones, will provide distorted
picture of the sustainable development. Thus, proxy social indicators, that relate to collective
action, trust and devotion to norms, membership to groups or associations, and collective
actions must be considered (United Nations; 2008, p. 8).
Also, Gnoth (2007) indicates that traditionally, destination brands are conceptualized via
functional, emotional and intangible values of a destination.
This position is consistent with the perceived quality of a destination (Chekalina, Fuchs,
& Lexhagen, 2016). A destination sells its resources in different formats to the visitors with
intention to match and satisfy visitors’ expectations. Hence, destinations are promised to
transform visitors’ experience and fulfill their expectations.
Therefore, the destination promise, must include (1) evaluations of human, environmental
and economic resources provided by a destination, (2) sustainability value from using the
destination resources, (3) and the cost-benefit value for using those resources. Based on the
proposed theoretical framework in Table 2.2., page 42, the thesis evaluates the concept of the
sustainable destination development as shown in Figure 2.5. on page 44.
According to the concept presented in Figure 2.5., on page 44, the social equation is
conceptualized based on the social exchange theory and includes power, trust, cost and benefits

44
as variables. Power is the ability of the local community to achieve the best possible outcomes
for the well-being of its residents as well as tourists.
.
Figure 2.5 Sustainable Destination Development Concept
Therefore, the destination promise, must include (1) evaluations of human, environmental
and economic resources provided by a destination, (2) sustainability value from using the
destination resources, (3) and the cost-benefit value for using those resources. Based on the
proposed theoretical framework in Table 2.2., page 42, the thesis evaluates the concept of the
sustainable destination development as shown in Figure 2.5. on page 44.
According to the concept presented in Figure 2.5., on page 44, the social equation is
conceptualized based on the social exchange theory and includes power, trust, cost and benefits
as variables. Power is the ability of the local community to achieve the best possible outcomes
for the well-being of its residents as well as tourists.
On the other hand, trust is a promise of a destination as a brand, co-created by a
destination and tourists and considered by tourists. Trust is a change-of-state because of
Destination Sustainability
Economic Sustainability
Expenditure Length of Stay Seasonality
Cost Power Trust Benefit
Aw
aren
ess B
ehavio
r C
on
cern
Mo
tiva
tion
K
now
ledge
Sk
ill
Integ
rated
Th
eoretica
l Fra
mew
ork
Social Sustainability
Environmental Sustainability
Social Exchange Theory
Economic Framework
Pro
-enviro
nm
enta
l
Arrivals

45
interactions between residents and the tourists. This relationship is in line with the works of
Grönroos (2000, 2009) and Lindberg‐Repo & Grönroos (2004) who suggest that products,
services customers, competitors and media contribute to the promise of the destination brand.
Tourism brings both prosperity and destruction to the local community of any
destination. Therefore, the cost-benefit scenarios as perceived by the local population must be
factored in into any destination development equation (Davis, Allen, & Cosenza, 1988; Hung,
et al., 2011). For the local community to endorse tourism it must have trust in the authorities
who have the power to implement the benefits and minimize the cost (Nunkoo & Ramkissoon,
2011).
The economic framework outlined in the Figure 2.5, p. 44, supports expenditure,
seasonality, length of stay and arrivals, a popular view among many scholars and academics
(Dwyer, Duc Pham, Forsyth, & Spurr, 2014; Alen, Nicolu, Losada, & Dominguez, 2014.
Finally, operationalization of the environmental equation focuses on the integrated theoretical
framework which recognizes environmental awareness as an important step towards the pro-
environmental behavior. According to Partanen-Hertell, Harju-Autt, Kreft-Burman, &
Pemberton (1999) the environmental awareness, which as a higher-order entity, is a mix of the
elements of motivation, skill and knowledge. Since sustainability of destinations is difficult to
measure directly it would require a set of measurable indicators or suitable proxies (Evans et al,
2015; Simkins & Peterson, 2015).
Other authors also suggest that sustainability of destinations is difficult to measure
directly (Fernández & Rivero, 2007; Buckely, 2001, p. 388). Therefore, to validate
sustainability elements it would require a set of measurable indicators or suitable proxies from
secondary databases (Houston, 2004, p161; Simpkins & Peterson, 2015; Evans et al., 2015;
Busse, 2010).
The basic concept is shown in Figure 2.5, page 44. In the economic domain those
indicators are receipts, visitation, taxes, profits, and length of stay. In the social domain, we are
looking for the measures of the resident-visitor interaction such as benefits, costs, trust and
power while from the environmental angle we use pro-environmental indictors that measure
environmental awareness and pro-environmental behavior such as motivation, knowledge and
skill (Nunkoo & Ramkissoon, 2011; Nicolau & Mas, 2005; Alegre, Mateo, & Pou, 2010; Ram
& Hall, 2015). The marginal increase in sustainability is tied to the gains in the value of the
selected indicators. Traditionally, marketing campaign increases economic outcomes,
measured through gains in profits, receipts, visitation, expenditure, employment and taxes.
However, the modern sustainability approach suggests the need to look for the long-term
prosperity of destinations (Buckley, 2012; Crouch, 2010; Zouganeli, et al., 2012; United
Nations, 2008). The value of a destination brand equity must be measurable if it is to have a
long-term perspective. This is also true for the destination sustainability. Iniesta-Bonillo et al.
(2016), Gartner and Konecnik (2010), Bojanic and Lo (2016), Budeanu, Miller, Moscardo, and
Ooi (2015), Lind, Hanks, and Miao (2018), Grössling, Ring, Dwyer, Andersson, and Hall
(2015), Uysal, Sirgy, Woo, and Kim (2015), Kristjánsdóttir, Ólafsdóttir, and Ragnarsdóttir
(2017) state similarities, transformative changes, and causality between destination
sustainability and brand equity development. Further impacts are highlighted by inputs from
sharing economy (Cheng, 2016), economic sustainability (Pratt, 2015), sustainable dimension

46
on tourists behavior (Mihanyar, Rahman & Aminudin, 2015), host-guest interaction (Bimonte
& Punzo, 2016), and sustainability messaging (Hanks, Zhang, Linea, & McGinley, 2016).
S output of the sustainable destination brand equity development; a-n weights associated to each
variable; E economic variables; L social variables; N environmental variables.
Figure 2.6. Sustainability Development Concept (Based on Lee & Kirkpatrick,
1997)
As mentioned earlier, this is not a problem for the consumer products where markets and
marketing strategies determine the overall value. However, for measuring brand equity of a
destination we need to go a step further and implement proxy indicators.
Theoretical works by Gartner (2014), Crouch (2010) and Buckley (2012), and studies on
the conceptual models proposed in the works of Iniesta-Bonillo et al. (2016), Lee & Kirkpatrick
(1997) and Cottrell, et al. (2013) open the door for using a set of regression equations for
measuring the impact of destination sustainable development on destination brand equity
development.
This thesis supports a model that includes three equations of sustainability: social,
economic and environmental and four equations of the destination brand equity: awareness,
image, quality and loyalty. The proposed model combines sustainability model and the Aaker’s
(1991, 1996), destination brand equity model into one. The proposed merging is also supported
by the works of Iniesta-Bonillo et al. (2016), Cottrell, et al. (2013), Crouch (2010), Konecnik
& Gartner (2007) and Chekalina, et al. (2016).
.
.
.
.
.
.
Destination
Sustainability
Economic
S= aE1+…. +nEn
Environmental
S= aN1+…. +nNn
Social
S= aL1+…. +nLn
E1
E2
En
N1
N2
L1
L2
Ln
Nn
.
.

47
S output of the sustainable destination brand equity development; a-n weights associated to each
variable; E economic variables; L social variables; N environmental variables; A awareness
variables; I image variables; Q quality variables; Y loyalty variables.
Figure 2.7 Proposed Model: Theoretical Framework
Economic Sustainability
S1= aE1+…. +nEn
Environmental
Sustainability
S3= aN1+…. +nNn
Destination Awareness
S4= aA1+…. +nAn
Social Sustainability
S2= aL1+…. +nLn
Destination Image
S5= aI1+…. +nIn
Destination Quality
S6= aQ1+…. +nQn
DestinationLoyalty
S7= aY1+…. +nYn
Destination
Sustainability
S1= aE1+…. +nEn
Destination Brand
Equity
S4= aA1+…. +nAn
E1
E2
En
N1
N2
L1
L2
Ln
Nn
A1
A2
An
I1
I2
In
Q1
Q2
Qn
Y1
Y2
Yn
2nd Order 2nd Order
Correlational
Relationship

48
The concept that depicts merging the two models, is shown in Figure 2.7., page 47. In its
operational format the equations of the extended form of integration are:
S1= aE1+…. +nEn;
S2= aL1+…. +nLn;
S3= aN1+…. +nNn;
S4= aA1+…. +nAn;
S5= aI1 +…. +nIn;
S6= aQ1+…. +nQn;
S7= aY1+…. +nYn;
S= S1+S2+S3+S4+S5+S6+S7
S1= economic destination sustainability
S2= social destination sustainability
S3= environmental destination sustainability
S4= awareness destination brand equity
S5= image destination brand equity
S6= quality destination brand equity
S7= loyalty destination brand equity
S = output of the sustainable destination brand equity development
a-n = weights associated to each variable
E’s = economic variables
L’s = social variables
N’s = environmental variables
A’s = awareness variables
I’s = image variables
Q’s= quality variables
Y’s= loyalty variables
2.4. Economic Impact on Tourism Destinations
Economic contribution to the destination brand equity comes from the monetary benefits
that arise from consumption of the destination’s resources. Destination arrivals and receipts are
the most common indicators of a tourism destination economic activity in the traditional supply
side economy. The traditional view of tourism suggests that the more financial outcome from
visiting a destination, the higher the brand equity or value of a destination from the stakeholders’
perspective. That view has been challenged by many scholars and researchers (Reisinger, 2013;
Wijkman & Rockström, 2012).
Measuring tourism economic impact is a challenge since tourism doesn’t fall into the
well-known economic model based on input-output production scheme. Most of the literature
on the tourism economy supports the traditional assumption that the benefits come from the
growth and profitability (Dwyer et al., 2014). This unopposed view has entrenched its roots in
the views of the traditional economy as well as in the lack of more serious interest by scholars
in the recent time. The norm behind the view is the more is better. The fact is that uncontrolled
consumption is deteriorating the resources of a destination (Lean, 2009; Reisinger, 2013;
Pollock, 2015).

49
On the other hand, travel and tourism are a demand driven activities, that depend on the
perception, experience and consumption of multiple destination resources (Dwyer,
Tomljenović, & Čorak, 2017). Most of the countries generate anywhere from 1% to 10% of
their GDP from tourism related activities. However, for small and island countries such as
Maldives, Aruba, Seychelles, Macao, Bahamas, Cayman Islands and others, tourism is a major
part of their GDP and the sole provider of the economic wellbeing of their citizens and
economies.
Szmigin, Carrigan, & McEachern (2009) argue that a new profound demographic change
is under way that promotes an aspirational consumer. The aspirational category of consumers
is concerned about the total value not just the price. In its purchasing behavior, an aspirational
consumer considers the total value from the purchase rather than from a single item. The full
view becomes the norm. It is a type of high-involvement participation into the buyers’ decision
where new breed of tourists consider sustainability as the guideline. This segment of tourists is
looking to actively co-create experiences, offerings and creative substance and take a proactive
role. Consequently, they are more inclined to pay premium for the destinations’ resources that
have adopted and implanted the similar philosophy and practice. The new approach is to
migrate from the era of consumption and indulgence to the era of responsibility and
consequence. Increasingly, recent literature confirms that visitors follow the trend of changing
their own lives and, at the same time, engage in transforming and co-creating changes at the
destination (Lean, 2009; Reisinger, 2013; Pollock, 2015).
Economic brand equity of a destination comes from the economic value of the tangible
and intangible destination resources that visitors have at their disposal for consumption. The
more efficient consumption environment, the more exchange of the economic value. However,
efficiency is not enough to produce the best levels of value. In the last decades, the norms of
consumption have changed. Accumulation is replaced by the meaning, context, participation,
substance, purpose and consequence (Lean, 2009; Reisinger, 2013; Pollock, 2015) 2.
According to the European Travel Commission (ETC, 2017) the number of socially
responsible travelers is on the rise. This new market segment has an impact on the value of the
destination’s brand equity. Tourists are more aware of their buying behavior and are altering
their choices to better fit into the segment’s expectations. Deville & Wearing (2013) argue that
today’s tourism destination, if it wants to build brand equity, needs to go a step further. It needs
to engulf and engage motivational elements such as authenticity and empathy and put them into
the perspective of the meaning, change and purpose of human lives (Dwyer et al., 2017; Porter
& Kramer, 2011; Scharmer & Kaufer, 2013).
There is a body of literature suggesting that these new trends are profoundly changing
destinations (Szmigin et al., 2009; Lean, 2009; Reisinger, 2013; Pollock, 2015; Porter &
Kramer, 2011; Scharmer & Kaufer, 2013; Dwyer et al., 2017). Traditional models of growth,
based on more visitors and profits from consumption, are coming to a shaky ground. There
more voices coming from stakeholders, academic, research and professional communities that
favor replacing the ego-centric approach with the more eco-centric behavior which favors
social, cultural, environmental aspects of a destination (Porter & Kramer, 2011; Scharmer &
Kaufer, 2013; Dwyer et al., 2017). The same authors suggest that the move is necessary if a
2 In Australia alone the consumer spending on products and services associated with the more sustainable and
healthy lifestyle choices reached $26 billion in 2017 “Lifestyles of Health and Sustainability” (LOHAS, 2017).
50
destination is to enter this new paradigm of creating, enhancing and supporting brand equity.
Dwyer et al., (2017) argue that every destination economy needs to replace greed, corruption,
power of interest groups and self-interests with co-creative, collaborative, responsible and
holistic practices. Porter & Kramer (2011) call this new phenomenon “creating a shared value”
which basically means that a destination needs to include social, cultural and hereditary factors
into its visitors’ segmentation equation prior to developing products and services.
Growth and profitability maximization paradigm, that carbonizes the atmosphere and puts
pressure on material and non-material resources, dominates the tourism industry (Buckley,
2012). However, there are growing trends to replace the maximization strategy models with
the optimization development practices. The optimization in tourism management assumes that
favorable elements are maximized, and the undesirable ones are marginalized (Hall, 2019;
Sheldon & Dwyer, 2010). Many scholars and researches are suggesting that the focus should
be on expenditure and the length of stay rather than on arrivals maximization (Dwyer, et al.,
2014). The optimal practices will focus on increasing economic benefits by improving the
existing systems. It would require staying away from maximizing arrival numbers and creating
more resilient economies by reducing fluctuations in finances, oil prices, prices of commodities,
foreign exchange rates and other factors of instability.
Historically, many research efforts have evolved around showing characteristics of the
profitable destinations, ways to increase length of stay, visiting a destination during different
periods of the year and destination affordability (Alen, Nicolu et al., 2014). Tourist expenditure
is considered by many as a major economic response to the tourism demand. The topic of
tourism expenditure has been a subject of the intensive research and analysis since it is
historically a major interest to the destination stakeholders. The focus on tourism expenditure
exceeds the focus on the cost to the local community, region and the overall global cost.
Therefore, substantial academic scrutiny has been devoted to the returns of transportation
providers, lodging, entertainment, local governments, destination marketing organizations
(DMOs) and others (Dwyer et al., 2014). Deciding where to go and how much to spend has
always involved a significant time and effort on behalf of visitors, more than in any other buying
activity.
Alegre et al. (2010) argue that future tourists go through a complex decision-making
process evaluating their travelling budget from different angles. The future income situation,
job security, savings, credit crunch expectations are all taken seriously. Each of these factors
is considered to have an impact on the perception of what the budget constrains should be and
how much money is available for expenditure while at the tourism destination, (see Figure 2.8,
on page 51. Further, Wang, Rompf, Severt, & Peerapatdit (2006) argue that several
psychographic profiles such as innovators, thinkers, achievers and experiencers influence the
amount of expenditure. People who are looking for excitement tend to spend more than those
who prefer more tranquil experience on travel holidays. Also, people who are singles tend to
spend more on accommodation than those who have families (Alen, et al., 2014; Kotler &
Keller, 2016, p117-118). Other research elaborates that ego enhancement travelers and those
who travel with the strong motives tend to spend more than the travelers with other motives
(Mehmetoglu, 2007). To somewhat lesser degree, the travel motives, if combined with trip
length, trip purpose, household income and age impact tourists’ daily travel expenditure. In
addition to psychographic characteristics non-financial demographic factors of a household

51
such as family structure, life cycle stage of the family or individuals, disposable income, level
of education and vacation length influence spending at the destination.
However, the research on budget flexibilities and dynamics of change in budget limits is
still unexplored topics in comparison to the psychological and social bases of the tourism
expenditure behavior (Nicolau & Mas, 2005; Alegre, et al., 2010; Ram & Hall, 2015).
Figure 2.8 Economic Impact on Tourism Destination
On the other hand, average time of stay effects positively expenditure and lowers the cost
and expenses at the local level, contributing to the overall brand equity value of a destination.
Sociodemographic variables such as age, income, education, occupation, season and
preferences make relationship between tourism revenue and the length of stay complex (Alen,
et al., 2014). Nevertheless, there is a considerable interest on the subject and agreement among
scholars that the average stay has fallen in the recent years (Thrane & Farstad, 2011). Staying
in one place over the longer period reduces the operating and variable cost and creates higher
economic contribution and therefore, has a positive impact on the destination brand equity
(Barros & Machado, 2010).
The shorter lengths of stay not only reduce the variable cost but also have negative
implication on sustainability which in turn reduces destination brand equity. Consequently, if
destination is to keep the same number of nights, the number of arrivals needs to increase
causing higher transportation expenses and increase in the greenhouse gasses with an overall
negative impact on the destination sustainability. Wang et al. (2006) and Alen, et al. (2014)
point that elderly visitors tend to stay longer while Barros, Butler, & Correia (2010) suggest
that extensions of stay are more pronounced during the summer because of the warmer weather.
Economic Impact on
Tourist
Destination
Length of
Stay Expenditure
Seasonality

52
However, to understand the average length of stay and its strategic implications it is necessary
to understand the motivation for the visit and factors that influence the timeframe and the
motivation behind its adjustments (Gössling, Ring, Dwyer, C, & Hall, 2015). Researchers
understand well that length of stay depends on the given traveling budget and the number of
days. However, they are few literature papers that clarify how those days are selected from the
visitors’ point of view.
There are several studies that emphasize visitation in off peak periods highlighting effects
of pricing, special events and activities and advantages of having summer vacations in the fall.
However, seasonality stays an unexplored topic by the research community on visitors’ habit
of avoiding travel during certain parts of the year and having preference to spend holidays
during specific time periods of the year.
Butler (2001) defines seasonality as a break in traveling during certain periods of the year
that occur regularly and coincide between the times of regular migration by tourists. The
reasons are associated with natural elements such as climate, school holidays as well as for the
various social and economic reasons. In cases when seasonality doesn’t follow an assumed or
predictable path it creates problem by lowering the value of a destination with less arrivals and
decreased income. Most researchers and academics agree that managing seasonality require
either increasing demand or supply or both, as well as by designing new attractions and features
(Weaver & Oppermann, 2000).
Measuring the overall economic impact on the destination brand equity is a complex
issue. The traditional view that supports the concepts of growth and profitability are
increasingly coming under the scrutiny of academics and scholars. The focus is shifting towards
the more aspirational behavior which emphasizes efficiency and the full package of interactions.
Therefore, the more universal approach to the economic impact on the destination brand equity
is leading to the concept of expenditure, length of stay and seasonality.
On the other hand, Qiu et al. (2019) proposed a concept for tourism economic
sustainability that include individual welfare, development control and economic positivity.
The authors suggest that there is an absence of the sufficient evaluation on tourism economic
sustainability, in spite of the growing worry about the negative economic influence of the
tourism destination communities. As the global tourism industry is approaching its maturity it
is facing complex challenges because of its negative impact on destination communities and the
rapid deterioration of the environment and biosphere. However, the current focus of the
sustainability assessing activity are focused on the social, economic and environmental aspects
(Buckley, 2012). Qui et al. (2018) state that economic sustainability is mainly focused on macro
level indicators such as GDP, employment, arrivals and investments, which fail to include a
number of indicators that would be useful for economic interpretations of sustainability in
tourism destinations.
2.5. Social Impact on Tourism Destination
Visiting destinations creates vast possibilities for the residents-visitors conflict causing
an increasing uncertainty of the destinations’ future from the tourism perspective. Recognizing
this problem, researchers and academics have proposed different approaches to create a viable
model that can deliver results in practice (Boley, McGehee, Perdue, & Long., 2014; Latkova &
53
Vogt, 2012; Yu, Chancellor & Cole, 2011).
Social sustainability, which is the element of the proposed model, has attracted the
attention of many researchers, scholars and practitioners worldwide because of the impact the
visitors can have on the local culture, crime rate, overcrowding, traditional way of living, and
the overall health and prosperity of the local communities (Choi & Sirakaya, 2005; Stronza &
Gordillo, 2008; Hung et al., 2011). The interest has produced studies which confirmed that
increased visitations can indeed have an impact on the social resources of destinations, causing
resentment of the residents towards visitors (Yu et al., 2011; Hao, Long, & Kleckley, 2011).
Consequently, the cognition of the knowingness of a destination by both visitors and residents,
if negative, lowers and impairs the brand equity value of a destination. As a result, the value of
a destination is weakened when articulation is placed on the economic aspect, while the cultural,
social and hereditary values of both residents and visitors are ignored (Yu, et al., 2011; Qiu
Zhang et al., 2016). A plethora of studies on the effects of tourism on local destination
communities were proposed by the research community but few pointed to the social aspects
(Nunkoo & Ramkinssoon, 2011; Andereck et al., 2011; Ward & Berno, 2011; Latkova & Vogt,
2012).
The increase in role of the social element of a destination brand equity intends to minimize
the effects of the destructive elements on the residents of a destination by the visitors’ behavior,
their numbers and the overall consumption. The phenomenon, known as overtourism, has
impacted tourism destinations in the last decade. Too many tourists, can cause a destination
going overboard when its caring capacity gets overloaded (Ritchie & Crouch, 2010), causing
deterioration of the social structures of a tourism destination, consequently lowering
attractiveness and destination brand equity (Seraphin et al., 2018).
The negative impacts are manifested as deterioration of local culture, way of life, personal
security, distribution of benefits and life supporting systems (Qiu Zhang et al., 2016).
According to Nunkoo, Smith, & Ramkissoon, (2013) the social sustainability points to drugs,
crime, traffic and alcoholism as major destructive forces on destinations.
Conversely, positive aspects of the increase in the destination’s social value are
contribution of economic benefits, such as increase in income, tax-base growth, employment
possibilities, and standard of living (Nunkoo & Gursoy, 2012). On the other hand, non-
economic benefits include increased global knowledge of the residents, following modern
trends, quality of life, hospitality to foreigners and interest in the other cultures and places
(King, et al., 1993).
The most important paradigm of social impact is presented in the social exchange theory
which promotes the exchange of resources in social settings between individuals or groups
(Ward & Berno, 2011; Nunkoo & Gursoy, 2012). The theory supports position that human
conative behavior is a transformation of actions between the actors in the exchange process,
which is mostly related to the tangible and intangible costs and rewards, see Figure 2.9, page
55. The pillars of the exchange process are the cost, benefit, trust and power elements on which
the social exchange theory (SET) is based on. However, Nunkoo & Ramkissoon (2011) argue
that in many studies the concepts of power and trust where not considered simultaneously.
Further, the same authors suggest using the SET as the theoretical basis and argue that the
residential support is based on the perceived cost-benefit structure. Nunkoo & Ramkissoon

54
(2011) suggest that the trust is determinable and depends on the levels of power associated to
the benefits and costs.
According to Yang, Ryan, & Zhang (2014) the social effects are common in almost all
stages of the tourism destination cycle but become a growing problem that causes social
conflicts with residents during periods of consolidation and restructuring. Diedrich & Garcia-
Buades (2009) argue that negative social effects may reduce carrying capacity of a destination
as well as its overall value in the marketplace. According to Ritchie & Crouch (2010),
destinations have a carrying capacity which indicates the implicit and explicit limitations of the
resources for withstanding, supporting and satisfying the various visitors’ demands.
The balance between costs and benefits of tourism needs to be addressed as an important
element of any successful sustainable tourism development (Hung et al., 2011). Several studies
concluded that positive attitudes towards tourism development and visitors are likely to occur
when the views and interests of the local population are factored into the sustainable
development equation (Hung et al., 2011; Davis et al., 1988; Aledo & Mazon, 2004; Diedrich
& Garcia-Buades, 2009; Ward & Berno, 2011; Nunkoo & Ramkissoon, 2011; Qiu Zhang et al.,
2016; Choi & Sirakaya, 2005; Stronza & Gordillo, 2008) . The perceived benefits, combined
with perceptions of power to achieve them, will result in trust and community endorsements
that will influence tourism policies (Yu, et al., 2011; Nunkoo & Gursoy, 2012).
The modern concept, introduced by Foucault (1978), supported by the social exchange
theory, considers power to be an intrinsic part of every social relation, a concept supported by
the force association that exists because the parties want to get the best outcome from their
relation. The contemporary approach to power suggests that one group of social relations is
influenced by the behavior and positions of the other groups in the social context. Power alone
can only bring the lack of trust among those with the less perceived power. Trust is considered
a key ingredient for avoiding conflicts in the tourism sustainability development (Nunkoo &
Ramkisson., 2011; Fredline & Faulkner, 2000).
The social exchange model (Figure 2.9, p. 55) further suggests that the attractiveness of
a destination and its value in the marketplace increases with the residents’ power to influence
tourism (Ward & Berno, 2011; Nunkoo & Ramkissoon, 2011). Consequently, residential
support for tourism is based on the expected costs and benefits from tourism. Other research
shows that residents can receive help from the new ideas and cultural exchange by hosting
cultural entertainment events (Dyer, Gursoy, Sharma, & Carter, 2007; Andereck et al., 2011).
Nevertheless, a few studies have conducted deeper interest into the subject of social
sustainability of a tourism destination (Qiu Zhang et al., 2016).
As tourism destinations become increasingly popular among potential tourists the
resources of destinations become under growing pressure to meet the consumption demands of
tourists (Yu, Chancellor, & Cole, 2011; Hao et al., 2011). The situation creates vast possibilities
for the residents-visitors conflict. Eventually, the residents, visitors and stakeholders become
concerned of the increasing uncertainty of the destinations’ future from the tourism perspective.
Yu et al. (2011) and Hao et al. (2011) pointed out that tourism can indeed have negative impacts
on the social resources of destinations causing resentment of the residents’ population towards
visitors. Consequently, the perception of the attractiveness of a destination in the eyes of both
visitors and residents could deteriorate and reduce the brand equity value of a destination. On
the other hand, tourists do not go to the places where they are not welcome.

55
Also, over-crowding is by many residents perceived as a basis for developing animosity
towards tourism development. The most obvious reasons are traffic congestion, pollution,
littering, noise, pressure on local services, vandalism, change in the tranquility and image of the
place, increase in crime as well as price hikes of goods, services, properties and land (Insch,
2019; Seraphin et al., 2018). Brougham & Butler (1991) suggested that the behavior of the
residents towards visitors is influenced by age, language, type of contact with the visitors, length
of stay as well as personal and cultural traits. Similarly, Buckley (2012) argues that in
developing countries income from tourism buys guns, appliances, cars, labor and real estate
while in the developed nations the tourism revenue contributes to the urban infrastructure,
consumption and imposes pressures on the protected areas.
Many world’s famous destinations are under the threat from overtourism for exceeding
their carrying capacity (Seraphin et al., 2018). However, limitations have positive and
sometimes stunning effect on increasing brand equity (Simkins & Peterson, 2015). Rapid
growth of tourism infrastructure combined with the high visitation can result in dissatisfaction
and revolt among residents at both individual and organizational levels.
Figure 2.9 Social Impact on Tourism Destination
Tourism increases knowledge about other cultures, increases understanding between
people of different backgrounds, sparks interest in foreign languages, increases
communications, develops tolerance, respect and increases sharing of experiences and habits.
Tourism creates trust between hosts and visitors and rely on government institutions to provide
safe environment. Therefore, the host residents and their voices are recognized as an important
element of any successful sustainable tourism development (Choi & Sirakaya, 2005; Stronza &
Gordillo, 2008; Hung, Sirakaya-Turk & Ingram, 2011).
Social
Impact on Tourist
Destination
Benefits
Power Trust
Cost

56
The omnipresent nature of power in tourism has attracted interest of researchers. Ap
(1992) points that power is not an authoritarian concept but a part of the social exchange process
with aim to provide a mechanism to the partners to take the best possible options in the exchange
setting. Foucault (1978, pp. 92-93) stated that:
“power is everywhere not because it embraces everything, but because it comes from
everywhere … it is produced from one moment to the next, at the very point, or rather in every
relation from one point to another”.
With this notion, Foucault has turned the traditional view on power upside down.
Similarly, Foucault (1978) has proved connection between the power and the truth, saying that
the truth is a construct of the economic and political forces inclusive to the social network.
Otherwise, in the traditional perspective, the power is the ability of one or group of persons to
impose behavior on the other person or a group.
Leonidou, Talias, & Leonidou (2008) and Nguyne & Rose (2009) argue that trust
increases confidence that promised outcome will indeed be performed by the other party in the
social exchange context. Consequently, trust is recognized as the vehicle for maximizing
society interests, economic development and government institutions which explains why
governments are heavily involved in tourism (Nyaupane & Timothy, 2010).
Following the Ap’s (1992) work, many academics and researchers did not include trust
as a main social variable when researching the destination residents and the tourism industry
(Gursoy et al., 2010; Nunkoo & Gursoy, 2012; Nunkoo & Ramkissoon, 2011; Ward & Berno,
2011). Instead, some of them used local power of residents; however, no progress was made
(Qiu Zhang et al., 2016). Further, trust and power are key variables in the social exchange
theory and, therefore, should be considered simultaneously in any research. Both concepts are
considered vital in predicting and determining behavior of the parties involved in different
situations and contexts in their social relationship. Bachmann, Knights, & Sydow (2001) made
an interesting point that power is a precondition rather than an alternative to trust.
Also, some researchers consider power as an alternative to trust, however, with different
effects on the outcome (Walker, Bisset, & Adam, 2007). According to Farrell (2004) power
influences trust because it influences the other party’s evaluation process by examining the
worth of the relationship of the social exchange and cooperation. Further, Farrell (2004) argues
that such a relationship between power and trust can exist if there is balance of power between
the parties. Also, several studies suggest that power has positive influence on trust and creates
positive ground in the social exchange scenario (Oberg & Svensson, 2010).
Consequently, support for the tourism by the residents is based on the perceived cost and
benefits from the tourism. Research shows that residents benefit from the new ideas and
cultural exchange (Besculides, Lee, & McCormick, 2002), by hosting cultural events (Dyer,
Gursoy, Sharma, & Carter, 2007 and entertainment events (Andereck & Nyaupane, 2011). The
cost from tourism comes from overcrowding, increase in traffic, noise, pollution, drugs, alcohol,
prostitution, invasion of privacy and way of life.
Besides the fact that there are many inconclusive studies on the negative impact of cost
on the overall brand equity value of destinations (Dyer, Gursoy, Sharma, & Carter, 2007) there
are both theoretical and empirical data from the literature that shows otherwise (Yoon, Gursoy,

57
& Chen, 2001; Gursoy & Rutherford, 2004). Also, the position among academics and scholars
that tourism development comes with a cost to destinations is not the new one (Gursoy, Chi, &
Dyer, 2010; Nunkoo & Ramkissoon, 2011; Latkova & Vogt, 2012).
2.6. Environmental Impact on Tourism Destination
Environmental impact on the brand equity of a destination comes from the visitors’,
stakeholders’and hosts perception that the bio-capacity, one in which a destination resides will
remain constant and even flourish. Despite a significant body of literature on the environmental
issues and their influence on the metabolic health of destinations around the globe, defining the
environmental brand equity of a destination is still a challenging task. Ritchie & Crouch (2010)
and Simkins & Peterson (2015) suggest that every destination has its own carrying capacity.
According to Harju-Autti & Kokkinen (2014) the current literature recognizes that the reasons
behind these challenges are, among other things, inconsistencies and unclear definitions, no
consensus on the common model, conceptual complexities, most studies only cover developed
countries, and the elements of the image theory (cognitive, affective and conative) are not
clearly identifiable (Konecnik & Gartner, 2007). To overcome the above challenges, the thesis
proposes the concept of environmental awareness which combines the elements of motivation,
skill and knowledge into the higher-end entity (Partanen-Hertellet et al., 1999). However, it is
still a challenge how to conceptualize the environmental awareness since there is no universal
method for measuring and evaluating (Harju-Autti & Kokkinen, 2014).
Pro-environmental education, which precedes the pro-environmental behavior, is
recognized as an important step in defining solutions for solving the bio-spherical
environmental problems (Stapp, et al., 1969). In other words, producing knowledgeable
citizens who are aware of the problem, motivate them to do something about it and equip them
with the skills how to come up with solutions, is the framework of environmental awareness as
proposed by (Partanen-Hertell, et al., 1999). In other words, increasing environmental
awareness among the citizens would require relevant problem-solving skills, increased
motivation and problem-recognition skills (Partanen-Hertell et al., 1999), see Figure. 4.3, page
58.
The social psychology considers motivation to engage in the pro-environmental behavior
as a set of attitudes, values and environmental concerns. The values are overshadowing goals
that are of a significant importance and which remain stable in substance and meaning over
time as opposed to goals which are motivational factors in each situation depending on the
values as well as situational clues. Values are desirable goals that are guiding principles in our
lives which incorporate elements of norms, believes, intentions, behaviors and attitudes
(Schwartz, 1992; Gardner, 2002). Literature shows that collective and individual interests are
strongly guided by the environmental believes, norms, attitudes and actions (Steg, De Groot,
Dreijerink, Abrahamse, & Siero, 2011). The research studies show four types of values:
hedonic, egoistic, altruistic and bio spherical. The former two, hedonic and egoistic are also
known as self-enhancement goals while the latter two, altruistic and bio-spherical, are classified
as self-transcendence goals (Steg, Perlaviciute, Van der Werff, & Lurvink, 2014).

58
Figure 2.10 Environmental Impact on Tourism Destination (Based on Partanen-Hertel et
al., 1999)
Research literature suggests that all four types of values have a significant influence on
the pro-environmental behavior and therefore on the brand equity value of a destination (Steg,
et al., 2014). Hedonic values manifest concern for bringing down effort and enhancing a
person’s feelings while egoistic values reveal tendencies of one person to get and preserve
wealth. On the other hand, altruistic values are focusing on the wellbeing of others while bio-
spherical values are related to the state of the nature and environment as an own interest (Steg,
Bolderdijk, Keizer, & Goda, 2014).
Also, researchers view the environmental concern as the third important ingredient of
motivation. Dunlap & Jones (2002) state that the environmental concern stands for willingness
to solve environmental problem and the level of the individual awareness of the environmental
problems as well as the support of effort to pursue the potential solution. Next, Dietz,
Fitzgerald, & Shwom (2005) reveal dualistic nature of the environmental concern suggesting
existence of a belief that something is at risk and the feeling that something is important. Also,
Franzen & Meyer (2010) point out that the state of the environmental concern of a society has
an impact on the pro-environmental behavior.
Motivation
Knowledge
Skill
Environmental Awareness
Pro-environmental Behavior
Environmental
Impact on Tourism
Destination

59
On the other hand, knowledge, as an element of the environmental awareness is a
collection of information, facts, opinions, positions, beliefs, and norms people have about
environment they live in and one they intend to visit, (see Figure 4.3, page XX). Worthy (2008)
argues that more than just a knowledge, which is often abstracted and intellectualized, is needed
to produce the desired effect on the environmental awareness. However, Harju-Auttiand
Kokkinen (2014) agree that the knowledge is a vital ingredient in understanding the
environmental awareness.
Finally, the third element of the environmental awareness is the skill or know-how to
improve the environment once we develop necessary level of motivation and knowledge, see
Figure 2.9, page 55. In general, learning skills such as recycling, reusing and reducing take
some time to master before they are used to enhance the environmental awareness.
If the perception of the environment is positive, which is the case with well-managed, not
overused, attractive, authentic and flourishing environment, the brand equity of a destination
increases and will result in more interest to visit. On the other hand, negative perception about
a destination’s environment will cause lower interest for visiting, spending as well as spreading
the negative world-of-mouth and considering switching options. All of this will cause
deterioration of the visitors’ perception of the value of a destination and impact the destination’s
economic capacity. Eventually, a destination will become less visited and economically
unattractive to the local population and stakeholders. Unless there is another industry around,
to keep the destination going, a destination will deteriorate economically. Harju-Auttiand
Kokkinen (2014) argue that the overall state of the global environment is deteriorating. Along
those lines of research, the expected outcome would be a reduction in the number of visitors on
a global level. On the contrary, year after year, the number of visitors is continuing to grow
suggesting that pro-environmental behavior is not catching up with the state of the environment.
Thus, the focus is on the ways how to change human behavior to encourage pro-environmental
behavior and reduce overtourism.
So far, most of the research was done in the developed and industrialized countries.
However, there is a growing tendency to expend the research to developing countries to improve
validity and the global acceptance of the common environmental procedures and models (Chiu,
2009). On the other hand, Klöckner (2013) proposes a meta-model that includes elements such
as social norms, personal norms, attitudes, behavioral control that all together contribute to the
intention to act. Further, Steg et al. (2014) contributed with their integrated theoretical
framework that proposes two routes how to encourage into pro-environmental behavior. First
one is to strengthen the normative goals and the second one is to reduce the cost of
environmental options. According to the proposed theory many of the pro-environmental
actions are result of the conflict between normative goals (e.g., protecting the environment) on
one hand, and the hedonic (e.g., enjoyable) and gain goals (e.g., saving money) on the other
hand (Lindenberg & Steg, 2007; Steg & Nordlund, 2012).
According to the relevant studies, the problem lies in the human behavior, which is
governed by different motivations or goals which, in turn, can be influenced and directed in a
desired way (DuNann Winter & Koger, 2004; Vlek & Steg, 2007). Even though significant
body of literature exists on this topic there is a very little literature on how to cluster the factors
that influence the behavior in a theoretical context.

60
Further, the argument is made on what motives or goals are needed to influence the best
pro-environmental behavior. Steg et al. (2014) have come up with the integrated framework
for encouraging a pro-environmental behavior as an attempt to highlight the roles of relevant
variables and treatments affecting the pro-environmental behavior. Lindenberg & Steg (2007),
in its goal framing theory, state that normative, hedonic and gain goals or motivations have the
most influence on the pro-environmental behavior in each situational setting.
Normative goals motivate people to adopt behavior that is proper for supporting and
improving the health of the environment such as preserving unpolluted water sources, taking
only pictures and leaving everything else behind, keeping the environment clean and protecting
the wildlife. Hedonic goals, on the other hand, influence human feelings towards seeking
pleasure or excitement. Finally, the gain goals motivate people who praise economic and status
benefits. According to the goal framing theory, the strongest goal will set the course on the
dominant behavior and cognitive process, causing the other motives to either increase or
decrease.
Regardless which goals motivates people to act in a pro-environmental manner it is
usually result of the conflicts between the hedonic and gain motives on one hand and normative
goals on the other hand (Lindenberg & Steg, 2007; Steg & Nordlund, 2012). Even though, the
environment-damaging actions are less suitable they are very often less expensive, more
pleasurable, more exciting, less time-consuming, less labor-intensive than pro-environmental
options. For instance, public transportation is less damaging for environment and climate but
is less enjoyable, exciting and flexible than taking the personal car. Organic food is less
damaging for the environment, but it costs more.
Therefore, Steg et al. (2014) are raising question of how can we promote pro-
environmental choices despite the conflicts among the motivational elements? The integrated
framework theory offers two possible solutions. First one is that the perceived results of the
pro-environmental behavior can be altered so the costs and enjoyment (comfort, expense,
convenience, effort, money) of the pro-environmental behavior can be reduced and the benefits
increased. Second solution, one that is gaining more attention with the research community, is
to put emphasis on the behavioral choices that favor pro-environmental outcomes by increasing
normative motives and reducing hedonic and gain options. Idea is to focus on environmental
outcomes regardless the cost and inconveniences.

61
3. DESTINATION BRAND EQUITY
In the first part, the chapter presents the general review of the brand equity concept,
evolution and measurement. The origins, development and interest for brands and brand equity
concept is highlighted in the historical context that dates back to the growing popularity of
mergers and acquisitions in the late 1980’s related to the outsourcing corporate strategy.
The phenomenon of brand is explained and the reasons behind growing marketers’
interest in intangible value of companies’ assets. The chapter exposes development efforts for
defining the model and its dimensions for measuring brand equity. Different school of thoughts
on measuring destination brand equity are explained.
Next, historical perspective of the destination brand equity is presented, its origins in the
tourism destination literature, development and formulation of the measurement models. The
significance of the destination brand equity is highlighted for different tourism settings with
emergence of the common model.
The chapter elaborates on the differences between products and destinations, explains
why destinations are so unique and provides answers behind the fact that non-branded
destinations do not exist.
Further, the thesis offers in-depth analysis of the destination brand equity elements used
in the proposed model: destination awareness, destination image, destination quality and
destination loyalty. The contribution and internal structure of each element of the destination
brand equity is highlighted.
Finally, the remaining twelve hypotheses are formulated in reference to the four elements
of destination brand equity. Separate formulation is required to better capture the context and
relationship between the elements of destination sustainability represented by economic, social
and environmental sustainability with the elements of destination brand equity represented by
destination awareness, image, quality and loyalty.
3.1. Brand Equity Concept: Evolution and Measurement
A brand is a resource that generates future economic benefit to the company (Sinclair &
Keller, 2014). Also, a brand reflects substance (Chigora, 2015; Chiu & Ho, 2015), a projection
of value, a bridge from the past to the future (Keller, 2013). A brand, stands out, stands for,
promises, characterizes, inspires, informs, makes distinctive and memorable, fulfills, satisfies
and above everything it makes a person’s aspirations and reality come together. It is a
phenomenon, which for a long period of time has gained marketers’ attention as a mean of
capturing consumers’ share of interest in marketing offerings (Mariutti & Tench 2015).
As the process of mergers and acquisitions intensified during the 1980s, companies
started to show an interest in the intangible value of its assets. As a result, the concept of brand
equity was born (Keller, 2013). Besides all the controversies that followed its start as a concept,
many agreed that the concept of brand equity, as a reflection of the brand value, is a good
starting point in many marketing analysis (Aaker, 1991,1996); Keller, 1993, 2013). The same
idea still prevails today (Keller, 2013; Chigora, 2015; Simkins & Peterson, 2015; Lopesi, 2011;
Mariutti & Tench, 2015; Chiu & Ho, 2015).
62
To be able to manage brands, marketers need to measure brand’s value or brand equity.
However, measuring brand equity proved to be somewhat of a controversy (Keller, 2013).
Since introduction of the brand equity concept it meant different things to different people. One
school of thought considers brand equity as a differential effect of brand knowledge on a
customer response (Keller, 2013).The other school of thought defines brand equity as a set of
assets connected to the brand’s elements, such as symbol, name, color, etc. that creates either
positive or negative value contribution by product or service to an organization or an individual
(Aaker, 1996). Yoo and Donthy (2001) define brand equity as a difference in response to
branded and unbranded version of the same product with the same marketing activity.
Similarly, Srinivasan, Park, and Chang (2005) defines brand equity as an incremental value
obtained by the brand in comparison to the underlying unbranded product.
In addition to differences in defining the concept of brand equity, same problem exists in
defining dimensions or the elements of the brand equity suitable for measurement. Keller
(2013) proposes brand awareness and brand image as the two major building pillars of brand
equity. Other suggest attribute and non-attribute dimensions (Srinivasan, et al., 2005). There
was an attempt to use actual consumer purchase behavior and market behavior to define the
brand equity (Kamakura & Russell 1993). Another interesting model proposes brand loyalty,
perceived quality, associations, quality and market behavior (Aaker, 1996). Yoo and Donthy,
(2001) proposed a scale for measuring brand equity that included brand loyalty, quality,
awareness and associations. Since the scale was based on both Keller’s and Aaker’s models,
the scale inherited unknowns and uncertainties related to those models. One concern was lack
of explanation on how those elements are contributing to brand equity and if they are, in fact,
an exhaustive set. In most cases, only indications exist (Gill & Dawra, 2010).
Since there is no consensus on how to define the brand equity, so, there is no consensus
on how to measure it (Kamakura & Russell1993). The same authors propose two brand value
perspectives: one to the firm and the other to the consumers. Unlike brands and branding,
which belong to the realm of organizations, the value of the brand equity is in the minds of
those who are using it (Keller, 2013). More precisely, human mind influences the value of the
brand equity (Keller, 2013). The strength of the brand equity lies in what humans think, feel,
associate, perceive, imagine, expect, experience and love about the brand (Keller, 2013). So,
feeling of the mind, in combination with the voice of the heart, leads to an extensive feeling of
loyalty, resonance and strong attachment to a brand (Keller, 2013).
If we look the Keller’s model, it seems that if we can measure brand awareness and brand
image than we can have enough data to explain and measure brand equity (Keller, 2013). The
same model defines brand awareness as the ability to recognize and recall the brand (Keller,
2013). On the other hand, Keller’s model defines image as a set of attributes and benefits
coming from the brand (Keller, 2013). On the other hand, Gill and Dawra (2010) suggest that
indirect measurement can explain relationship between recall and recognition with the brand
knowledge. However, indirect approach does not measure strength, favorability and
uniqueness. Therefore, there is a need for a set of more direct measures.
On the other hand, Aaker’s model proposes five dimensions that constitute the brand
equity: loyalty, perceived quality/leadership, associations/differentiations, awareness and
market behavior (Aaker, 1996). However, the author has not given any clue what indicators to
use to measure it (Gill & Dawra, 2010). Brand loyalty relates to satisfaction, attitudinal and

63
behavioral loyalty and price premium. Perceived quality and leadership explain the second
dimension. Third dimension, associations and differentiation measures superiority and the
reason to buy. Awareness captures top-of-mind awareness, recognition, recall, dominance,
knowledge and opinion, while market behavior is associated with market share and distribution
depth (Aaker, 1996). Nevertheless, the model does not introduce these elements as the
exhaustive set that defines the brand equity. Rather, the proposed set stays at the framework
level (Gill & Dawra, 2010).
Next attempt to measure brand equity was made by (Yoo & Donthy, 2001) who borrowed
perceptual dimensions from Keller (2013) and Aaker (1996) such as loyalty, perceived quality
and awareness/associations to construct multidimensional scale to measure brand equity.
However, there is no strong explanation if the proposed scale has captured and explained brand
equity sufficiently. Also, Park & Srinivasan (1994) introduced attribute and non-attribute-based
concept of brand equity which considered brand equity as the sum of the attribute and non-
attribute-based components. The difference between subjectively and objectively measured
attribute-based preference is attribute based while non-attribute-based element is a difference
between brand preference and its attribute-based element. Besides its promising concept, the
expert’s opinion on subjectivity is in question since it would be hard to consider it as objective
(Dwyer, et al., 2014).
Erdem (1998) makes interesting point about the benefit of the brand equity as a signaling
element of a brand’s market position. The signal stresses out the credibility in the imperfect
and asymmetric market, driven by dynamic interactions between organizations and customers.
The insights offered by the brand equity signal reduces information cost, increases perceived
quality and decreases customer perceived risk (Erdem, 1998). Today, reputable brands face a
fierce competition in the global environment (Popescu, 2007). The same brand equity rules
apply to a tourism destination market where less reputable destinations have even more
difficulties competing for visitors.
Next, Kamakura & Russell (1993) proposed measuring brand equity using purchase
behavior of consumers. The measurement instrument used scanner panel data to obtain the
actual purchase behavior which in this case was regular market conditions in which buying
occurred. The same authors consider brand equity as the value attached by consumers to the
brand after discounting the current price and advertising exposure. Next, the model considers
tangible and non-tangible brand values. Tangible value is one arising from the physical
properties of the brand while intangible values are the non-physical functions and the associated
values. Limitations of this measure are competition and availability. The method is more exact
and reliable in the developed markets.
The country-of-origin of a tourism destination serves as a cognitive cue for visitors to
make their selections (Sharma, 2011). The cue is often an intangible attribute that consumers
resort to when data about a product is not available or hard to find. The country-of-origin
concept helps consumers develop perception about a destination based on the country’s image
(Sharma, 2011). Country brands based on may have emotional and symbolic meaning to the
national identity. Brands are in general better received if they come from the countries with
favorable images (Sharma, 2011). In other words, reputation of the country influences
attractiveness of a tourism destination (Parkvithee & Miranda, 2012).

64
3.2. Destination Brand Equity: Historical Perspective
Destination brand equity has its origins in the destination image (Chi & Qu, 2008;
Konecnik & Gartner, 2007). Historically, destination branding evolved from destination image,
which owns its popularity to a Boulding’s (1956) publication “The Image: Knowledge in Life
and Society”. Boulding argues that image is a pre-existing stereotype or a perception of the
world that surrounds us and help us in interpreting world traits, developing opinions about the
world and interacting with the world. Boulding went further to introduce the model with
cognitive, affectionate and conative elements.
Ever since the introduction of destination branding in tourism in a scientific and research
format by Richie & Richie (1998) destinations have been viewed as brands. However, the slow
progress on the further development of destination brand concept was attributed to the lack of
foundational theories. Scholars and academics relied mostly on the marketing concepts behind
the consumer product brands, however, the works of Cai (2002) started to change this. His
argument was that destination image is an important dimension of the destination brand equity
but not the only one. The effort shifted towards setting up the theoretical foundations for better
understanding the destination brands. The works of Blain et al. (2005) confirmed that image is
a main dimension of destination brand, but added differentiation, consistency and recognition.
Literature that followed, introduced the concepts of loyalty, quality and awareness to the
destination brand equity (Milman & Pizam, 1995; Oppermann, 2000; Konecnik & Gartner,
2007).
Brand equity of a product is a well-defined concept in the marketing literature. It refers
to a value of a product based on returns generated from the product’s marketing strategy. In
other words, brand equity is a value of a product associated with a specific name, appearance,
logo and theme. The value of the equity concept is derived from what the sale of a branded
product can achieve in the marketplace above and over the sale of a similar or same commodity
or no-name product (Keller, 1993; Gartner, 2014). The brand equity, which stands for added
value, may not be obvious in a day-to-day purchase. However, when it comes to selling
franchise rights, distribution agreements and promotional rights the brand equity of a product
comes to life in a full view.
Table 3.1. Evolution of Tourism Destination Brand Equity
Tourism
Destination
Brand Equity
Development
Stages
Emerging Research Areas
Establishment of
tourism
destination brand
equity as a
research field.
Before 90 - Image period: Boulding’s (1956);
- perceived quality: Parasuraman et al. (1985, 1988)
1990-99 -Destinations as brands: Richie & Richie
(1998);
-Introduction of loyalty, awareness, and quality:
Milman & Pizam, 1995;

65
Oppermann, 2000;
Aaker, 1991, 1996;
Keller, 1993;
2000-09 - Destination image is not the only dimension:
Cai (2002);
- Brand equity of tourism destinations:
Konecnik& Gartner (2007);
After 2010 - Destination brand equity:
Gartner &Ruzzier, (2011);
Gartner (2014);
Choi &Sirakaya, 2005;
Stronza& Gordillo, 2008;
Hung, Sirakaya-Turk & Ingram, 2011;
Evans et al., 2015;
Gartner, 2014;
Martínezet al., 2019;
On the other hand, the tourists notice the value of the brand equity when they perceive
that the time has come for the idea that encapsulates destination attributes, both tangible and
intangible. Destination brands, and therefore, the value of destination brand equities is in many
ways noticeably different from those of a product brand. First, destinations are living, dynamic
places that change all the time. Second, destinations are multidimensional in nature and
structure and tend to mean different things to different visitors (Konecnik & Gartner, 2007;
Gartner, 2014). Next, destinations carry different levels of experience and perception. Another
crucial difference is that there no markets for destinations. Therefore, one cannot use the market
value to measure their brand equities. Similarly, you cannot return a destination if it does not
live to tourists’ expectations. Although, under some circumstances, tourists can switch to
another destination (Gartner, 2014).
Another interesting point related to measuring of the destination brand equity is the
difference between branded and non-branded products. The tourism destination market is
specific and unique in a way that destinations are unique, therefore, it would be difficult to find
unbranded destination and compared it to a branded one with similar or same characteristics.
Thus, destination awareness represents familiarity with the destination either by
recognition, recall or top-of-mind awareness (Keller, 2013) while destination image is an
overall impression of natural and cultural heritage richness, use of environment, providing
superior satisfaction, and the overall performance of all airport-to-airport service providers
(Lopesi, 2011). Similarly, loyalty is intention to repeat the experience, while resonance is an
ultimate match between the destination and a visitor (Keller, 2013). As internet makes
secondary data more accessible and less costly to obtain, there is a growing need for the methods
to evaluate secondary data validity and reliability (Chigora, 2015; Simkins & Peterson, 2015).
Also, Busse (2010) points that for hypotheses testing and confirmation, it is valid to use a single
database; however, for confirmatory research, multiple databases with secondary data are
acceptable.

66
Between 2001-2012, there are at least 64 relevant published papers on research in
destination brand equity (Kladou et al., 2015). Before works of Konecnik & Gartner (2007),
there was a lack of empirical research effort on destinations Boo, et al. 2009). Initial works on
destination branding were focused on destination brand image and have overshadowed the
interest in destination brand equity (Kladou et al., 2015; Anuwichanont & Mechinda, 2014).
At that time, there was very little research literature on destination brand equity (Kladou
et al., 2015). That changed when interest in destination brand equity increased as researches
started to pay attention to the four basic brand equity subjects (awareness, image, quality and
image) on destination valuation and analysis (Iniesta-Bonillo et al., 2016; Konecnik & Gartner,
2007; Kladou & Kehagias, 2014; Zhang et al., 2016), as proposed by Aaker (1991, 1996).
Literature review revealed the pressure for credibility and substance causing the researchers,
marketers and scholars to adopt the term “Destination Brand Equity” borrowed from the
traditional corporate and customer branding theory (Kladou et al., 2015).
Even though Aaker’s (1991, 1996) brand equity model has five dimensions, awareness,
association/image, perceived quality and brand assets, in the context of tourism destination
brand equity, the research uses only four (Konecnik & Gartner, 2007; Kladou et al., 2015;
Teodorović, Popesku, and Pavlović, 2019). Next, it is important to mention that brand asset is
excluded from the destination brand equity analysis. Unlike consumer products, where images
are based on real and measurable data because of the tangible nature of the products, tourism
products are experiential in nature since they are produced and consumed at the same time.
Therefore, product assets, which are important for consumer products have no meaning in the
brand equity evaluations.
Also, there are many macro factors that can make a destination experience a probability
of a certain expectation rather than an expected standard. Climate change influencing local
weather, political situations such as one in Greece in 2015, currency exchange rate, terrorism,
migrations, natural disasters, social events and so on can altered perception and an expected
experience from a destination. Therefore, replication of a destination experience, time after
time, is a challenge. The evolution of the destination brand equity concept is shown in Table
3.1., on page 64.
3.2.1. Destination Brand Awareness
A well-known destination will attract more visitors than those that are less know
(Chigora, 2015). Well known products or services send message to customers that they are
reputable and attractive (Gustafson & Chabot, 2007). Many researchers consider brand
awareness as the capacity of a person to recognize a brand that he or she has seen before or
recall a brand when a product category or cue is exposed (Liu, Liston-Heyes, & Ko, 2010).
Also, brand awareness is considered as a major, first level, part of the brand equity (Gartner &
Ruzzier, 2011). Similarly, Keller (2013) suggests that brand awareness is the first level of the
brand equity pyramid paradigm
Aaker (1991) puts brand awareness ahead of other elements of brand equity. The concept
of top of the mind awareness and added awareness resembles the earlier recognition and recall.
Top of the mind assumes that a customer has a predefined notion about the product in terms of
ranking it as a first choice in a purchasing decision. Also, it plays a role in a customer’s effort

67
to form his or her buying behavior concept based on their top choice. Consequently, an added
awareness suggests that the brand will be picked among many offered.
A destination needs to be known to be visited (Gartner & Konecnik Ruzzier, 2011).
Global and economic performance of a destination increases if an effort is made to create and
make a destination known (Im, et al., 2012). There is relationship between brand awareness
and market outcome (Homburg, Klarmann, & Schmitt, 2010), as there is a relationship between
destination effective brand awareness and receipts and arrivals. However, awareness is not
sufficient to make destination brand strong (FutureBrand, 2015).
In the case of Zimbabwe country brand, high awareness doesn’t automatically translate
into the brand loyalty and, therefore, into the market outcome (Chigora, 2015). Gartner and
Konecnik Ruzzier (2011) point out that awareness of tourism destinations is not always positive,
but can also take a negative form, which, in turn, drives the brand equity of the destination
down. In its research Ndlovu and Heath (2013) point out that culprits of the Zimbabwe’s
negative brand awareness come from the political and human development as well as from
socio-economic issues. Also, a customer’s association process kicks in only after he or she
becomes aware of the destination (Pitta & Katsanis, 1995).
Consumer-based brand equity is defined and explained by brand awareness if the brand
is a high-involvement product (Im, et at., 2012). Others suggest that awareness may not play a
significant role with high-involvement products but with the low-involvement ones (Keller,
2013). Brand loyalty, choice and associations are affected by the brand awareness (Shahin,
Kazemi, & Mahyari, 2012). Many researches use brand association as a standalone part (Yoo
& Donthy, 2001). Reputable countries, with high positive images, play a vital role with
potential visitors by projecting their image to the value of their tourism destinations (Yasin,
Noor, & Mohamad, 2007). The fact that brand awareness can be associated to the country-of-
origin is well known to researchers (Shahin et al., 2012). According to Keller (2013), the
country-of-origin can help the recognition and recall processes of differentiating the destination
based on the country. Brand awareness can take many dimensions such as recall, recognition,
top-of-mind awareness, dominance, knowledge and opinion (Aaker, 1996). Others see brand
awareness as a recall and recognition with different levels of breath and depth (Keller, 2013).
However, in many cases, awareness results in curiosity that causes trial or visitation in the
destination context.
Alamro and Rowley (2011) suggest that awareness precedes brand preference and suggest
that brand promise is an important aspect of the brand preference. The authors concluded that
brand awareness is a result of either controllable or non-controllable communication. In the
low involvement purchase brand awareness may be enough to make purchasing decision
(Keller, 2013). However, in the high involvement buying scenarios the strong feelings about
the product is needed. In a scenario of equal reputation consumer will make purchasing decision
based on the brand awareness (Brewer & Zhao, 2011). Earlier studies confirm existence of the
relationship between brand awareness and brand loyalty (Nguyen, Barrett, & Miller, 2011).
Also, first time tourists give more value to the cognitive attributes than repeat tourists, and form
majority of their opinions about the destination based on cognitive analysis which emphasizes
the role of the destination awareness element (Yolal, Chi, & Pesämaa, 2017).
Melo & de Farias (2018) analyzed the impact of the hedonic sustainability stimulus used
in the advertising message for a tourism destination. The authors found that sustainability

68
generates more interest about destination by tourists. Further, Malone, McCabe, & Smith
(2014) state that motivators based on emotional experiences have significant impact on
strengthening the current and intended ethical behavior of tourists. Budeanu (2005) emphasizes
that tourists’ needs to be educated with intention to increase their awareness of the social,
cultural and environmental aspects of the impacts that they can have on the tourism destinations.
The authors claim that the awareness is particularly important in the destinations where impacts
of social, cultural and environmental activities are high.
Bhuiyan, Siwar, & Ismail (2015), Ritchie & Crouch (2010), Seraphin et al. (2018), and
Simkins & Peterson (2015) also confirm that widespread use of resources for tourism activities
destroys the ecosystem of destinations. Moreover, the authors found that preservation of natural
habitat and the environmental awareness are necessary for sustainability of the ecotourism
destinations. Mihanyar et al. (2015) argue that sustainable tourism awareness has a positive
impact on the satisfaction of tourists and behavioral activities and has significant influence on
the environmental behavior.
Based on the above the thesis proposes the following supporting hypotheses:
H3: Economic sustainability has a positive impact on the destination awareness.
H4: Social sustainability has a positive impact on the destination awareness.
H5: Environmental sustainability has a positive impact on the destination awareness.
3.2.2. Destination Brand Image
Brand associations or brand image is the most researched dimension of the brand equity.
It stands for strong, favorable and unique associations linked to the brand in memory (Keller,
2013). Formally, brand associations can take form of images, product-profiles, conditions,
awareness, brand elements etc. Strong, positive, favorable and unique associations are
necessary condition for creating strong brands (Keller, 2013).
Similarly, a destination image is a generic concept manifested as a comprehensive
impression based on the collection of beliefs and feelings about a specific destination (Zhang,
Wu, Morrison, Tseng, & Chen, 2016).
A country destination has elements of the extrinsic or secondary association, which
represent an important source of the country-of-origin knowledge for consumers so they can
form either positive or negative feelings of a destination (Zhang et a., 2016). Empirical
evidence proved this (Yasin et al., 2007; Shahin et al., 2012; Moradi & Zarei, 2012). Brand
associations are meaning of the brand and can be viewed from the product, organization and
personality perspective (Aaker, 1996). Online image is a new growing concept which is based
on the belief of a destination from internet’s search engines (Bloom, 2015).
A few studies on CBBE view destination image and (perceived) destination quality as
one dimension because they both project characteristics of the tourism destination offerings
(Ferns & Walls, 2012; Konecnik & Gartner, 2007). Keller (2009) includes both elements,
destination image and perceived destination quality in the destination brand performance and
destination imagery in his pyramid CBBE model. While some authors, Bianchi et al. (2014),
69
and Teodorović et al., (2019) consider destination quality as a single element, the others (Im, et
al., 2012) view destination image as a single construct. Aaker (1991, 1996) empirically
considers both destination image and quality as independent dimensions in its CBBE model, a
view that is supported in the thesis.
Traditionally, studies on tourism destination brand image adopt the works of Echtner &
Ritchie (1993) where they suggest the multidimensional nature of the tourism destination brand
image construct. Besides the common and unique view of destinations, the study proposes
attribute-based images. Furthermore, Echtner & Ritchie (1993) and Gallarza et al., (2002)
defined a set of most common attributes used in tourism destination brand image literature.
Landscape, residents’ friendliness, scenery, cultural attractions, price started to appear in the
research literature as a reflection of the destination resources. Consequently, attribute-based
concept supports paradigm that tourism destination brand image manifests the attractiveness of
the destination resources in the minds and hearts of the potential tourists (Bianchi et al., 2014;
Horng et al., 2012; Konecnik & Gartner, 2007; Teodorovic et al., 2019).
Konecnik & Gartner (2007), explored the image of Slovenia from the perception of the
German and Croatian tourists. Im et al. (2012) conceptualized destination attribute-based
images of Korea and Malaysia while Ferns & Walls (2012) defined quality and image constructs
for the US Midwest as a tourism destination. Next, Horng et al. (2002) examined the image of
the culinary tourism in Taiwan while Kladou & Kehagias (2014) developed image attributes
for the cultural tourism in Rome. Also, Teodorovic et al., (2019) explored image of Serbia from
the domestic tourists’ point of view.
The tourism research literature confirms that people behave differently at their residence
than when they travel (Miao & Wei, 2013). While people are more inclined to engage in
environmentally more friendly behavior when they are at home, they are far less inspired to do
that when they are traveling. In fact, pro-sustainable behavior is not consistent even when in
tourism destination (Miao & Wei, 2013). According to Line & Hanks (2016) tourists are more
likely to support sustainable behavior in the nature-based tourism destinations than urban
destinations. This behavior suggests that destination itself has an impact on the sustainable
behavior.
Destination image is commonly conceptualized to coincide with both affective and
cognitive elements (Baloglu & Mangaloglu, 2001; Kim & Perdue, 2011). Cognitive destination
image is a tourist’s perception of tangible structures that constitute destination such as building,
hotels, restaurants, parks, monuments or wildlife, waterfalls, flora and fauna, springs and etc.
On the other hand, affective destination image is a lamentation of the tourists’ perception of
“his or her feelings about destination” expressed as exciting, relaxing, stressful, or other. Line,
Hanks & Miao (2018) state that a person’s image of a particular destination, besides many
factors, can be mostly influenced by the type of destinations, urban or nature based. The authors
concluded that the type of destination determines the pro-environmental behavior of tourists.
Hanks et al. (2016) state that features of various types of tourism destination differ greatly
and differently respond to sustainability messages. For example, urban destinations are in
general much more developed, offer more choices and are easily accessible than less developed
rural destinations. The large number of choices such as hotels, restaurants, entertainment and
shopping are causing tourist to be less responsive to sustainability messages in general and
environmental messages (Ashworth & Page, 2011; Edwards, Griffin, & Hayllar, 2008).

70
However, nature-based destinations are closer to the scenery of the landscape and the
wildlife and create stronger bond between tourists and the environment. In general, nature-
based destinations are less developed and undisturbed and are more likely, than the urban once,
to spark more sustainable behavior of tourists. Hanks et al. (2016) state that the natural
environment, greenery, natural features and the wildlife are more likely to cause positive
attitude towards cognitive notion of sustainable behavior.
Based on the presented facts the thesis proposes the following supporting hypotheses:
H6: Economic sustainability has a positive impact on the destination image.
H7: Social sustainability has a positive impact on the destination image.
H8: Environmental sustainability has a positive impact on the destination image.
3.2.3. Destination Brand Quality
Parasuraman, Zeithaml, & Berry (1985, 1988) empirically places destination quality into
the research literature on tourism as the difference between tourists’ actual expectations and
performance. The difference influences the judgement and emotional feeling towards the
delivery of the promised quality (Pike, et al., 2010). The thesis supports the Aaker’s (1991) and
Keller’s (1993) formulation of the CBBE model where brand quality is defined as a key
dimension which reflects the superiority and excellence. Ferns & Walls (2012, p29) see
destination brand quality as a tourists’’ perception of a destination’s ability to carry out or
exceed their expectations. Moreover, other authors suggest that the destination brand quality is
a reflection of the on-site experience (Chen & Tsai, 2007). Unpolluted environment and
cultural experience are considered as usual aspects of the destination brand quality.
The perception of brand quality arises when there is an information asymmetry (Kirmani
& Rao, 2000). Based on the information they have, potential tourists feel uncertainty about a
destination that could be identical, close, different and significantly different from the actual.
The “quality” or the gap between expected and actual experience with the destination is a
perceived quality which many researchers, scientists and marketers agree to have impact on the
destination brand equity (Aaker, 1996, Keller, 2013, Konecnik & Gartner, 2007). Perceived
quality is a collection of many benefits, attributes, and image perspectives, that exist in the
minds of tourists or consumers and can last throughout the life of the product (Keller, 2013).
Research shows that perceived quality adds more value to buying activity influenced by brand
equity (Low & Lamb Jr, 2000). Research literature confirms that the country-of-origin plays a
role in a visitor’s choice of the tourism destination (Pappu, Quester & Cooksey, 2007) as well
as that perceived quality varies across different cultures (Jung & Shen, 2011).
Also, consumers want consistent quality at the low price, and subjectively assess product
features to form feeling of the quality (Saleem, Rahman, & Umar, 2015). Herstain & Zvilling
(2011) argue that among brand attributes the brand quality attributes should take high priority
for marketers. Other studies suggest that brand credibility increases perceived quality which
affects buying intention with a pleasure-seeking behavior as a moderating role (Baek & King,
2011). On the other hand, global brands usually meet customer’s buying preferences by
71
focusing on quality and prestige (Akram, Merunka, & Akram, 2011). There is a positive
relationship between perceived quality and brand loyalty (Nguyen et al., 2011). Also, Konecnik
& Garnter (2007) and Teodorovic et al., (2019) confirmed that destination quality has direct
impact on destination image and destination loyalty. Both studies show that destination
awareness has direct significant impact on destination quality. Baker & Crompton (2000)
conducted a study on behavioral intentions, satisfaction, and quality which confirmed
hypothesis that perceived destination quality impacts tourists’ behavior.
Based on the above the thesis proposes the following hypotheses:
H9: Economic sustainability has a positive impact on the destination quality.
H10: Social sustainability has a positive impact on the destination quality.
H11: Environmental sustainability has a positive impact on the destination quality.
3.2.4. Destination Brand Loyalty
Researchers view brand loyalty as a consumers’ tendency to stick to a brand by showing
behavior of repeat purchase and “primary choice” attitude that results in a consumer’s repeat
consumption of a brand (Yoo & Donthy, 2001). Javalgi & Moberg, (1997) recognize two
dimensions of brand loyalty: behavioral and attitudinal. Consumers tend to stick to those brands
that exhibit high brand equity (Moradi & Zarei, 2012). Countries with memorable and favorable
images exhibit high brand preference that leads to a strong destination brand loyalty (Kim,
1995). Also, one body of research shows that the country-of-origin and brand loyalty are
significantly related (Shahin et al., 2012) while the others found the relationship insignificant
(Moradi & Zarei, 2012).
Loyal customers are ready to spend more on a brand after recognizing it. The attachment
to the brand is a result of the belief that a customer is better off with the brand (Belaid & Behi,
2011). Many demographic variables are responsible for a customer loyalty behavior to a brand
(Saleem et al., 2015). For example, men are less loyal than women (Jansen, 2008). Also,
research by Hur, Ahn, & Kim (2011) noted that a brand community tends to share their
experience with the brand which positively affects buying intentions resulting in increased
brand loyalty.
Brand image plays role as a mediator and affects brand loyalty (Saleem et al., 2015), and
is important because it conveys some meaning of the brand that exists in the consumers’
(tourists’) minds (Keller, 2013). Similar argument about brand image shows a positive
relationship with brand loyalty (Bianchi & Pike, 2011). The argument that supports mediating
role of brand image between perceived quality and brand loyalty is that perceived quality itself
is not enough to spur the brand loyalty among customers. Some other variable is needed and
that is brand image (Saleem et al., 2015). Similarly, a company’s message about the perceived
quality matches better customers’ expectations when a strong brand image is associated (Hsieh
& Li, 2008).
Konecnik & Gartner (2007) suggest that cognitive and affection elements form
destination image influence destination brand loyalty. The cognitive part is responsible for

72
knowledge and beliefs about attributes of the product or destination while affection element
explains how tourists feel about a destination (Hosany, Ekinci, & Uysal, 2006). Furthermore,
Konecnik & Gartner (2007) and Kim et al. (2017) suggest that destination quality and
destination awareness have a mediating role between the destination brand image and
destination brand loyalty.
In tourism literature, Chi & Qu (2008), Kim & Brown (2012), and Yuksel, Yuksel, &
Bilim (2010) confirmed that tourism satisfaction directly affects tourism destination loyalty. In
case of island destinations, sand, sea and sun are not the only elements that influence the
tourists’ loyalty. The research found that social elements such as host population, guests and
safety are important for destination loyalty (Sangpikul, 2017).
Verma & Rajendran (2017) found that historical nostalgia is important determinant of
destination loyalty as well as perceived value and satisfaction. Interesting results on destination
loyalty were obtained by Iordanova (2017), which show that strong destination image positively
affects destination loyalty. In particular, the study indicates that destination loyalty is more
influenced by the destination affective image than destination cognitive image.
Anderson, Fornel, & Lehman, (1994) and Zeithaml, (2000) confirm in their study that
customer loyalty and quality increase profits. In the tourism destination context, this means
that both quality and loyalty have positive impact on destination economic sustainability. Also,
Ryglová, Ryglová, Šácha, & Maráková (2018) examined the ways of developing tourists’
loyalty in rural destinations under the development umbrella of destination sustainability. They
found that satisfaction has direct influence on the tourists’ loyalty. The same research points to
well-being, image and services as dimensions of the most positive influence. Also, the
sustainable development should be a priority. Furthermore, the authors concluded that from the
destination marketing point of view, sustainable development “pull” strategy should be based
on tourists’ loyalty as the key element in the sustainable tourists’ behavior. The pull strategy is
particularly effective when there is a high involvement and high level of destination brand
loyalty in the specific destination marketing segment. The strategy is appropriate when tourists’
perceived difference between destinations is pronounced and when tourists are capable of
selecting destinations prior to visiting them. Pull strategy involves advertising, promotions,
special offers and communication mix to create demand among the potential tourists. The
advertising message should include sustainability theme, connect closely to destination brand
positioning and facilitate in creating points-of-parity and points of difference strategy (Kotler
& Keller, 2012).
Based on the above the thesis proposes the following supporting hypotheses:
H12: Economic sustainability has a positive impact on the destination loyalty.
H13: Social sustainability has a positive impact on the destination loyalty.
H14: Environmental sustainability has a positive impact on the destination loyalty.

73
4. CONCEPTUAL FRAMEWORK
The chapter formally introduces the theoretical framework for evaluating the impact that
sustainability has on destination brand equity. The proposed conceptual model in this thesis
consists of the elements of sustainability and the elements of destination brand equity.
First, dimensions of the proposed model are explained. Following the introduction, the
theoretical background of the causal relationships between the elements of the tourism
destination brand equity, and destination sustainability are explained. Furthermore, theoretical
concepts used as a background for operationalization of the elements of sustainability such as
original form of integration, social exchange theory, service marketing theory, integrated
theoretical framework and goal framing theory are outlined.
Second, the chapter presents and describes the proposed model, its constructs and
structure. The proposed relationships of each individual dimension of the proposed model are
outlined within the corresponding theoretical framework. A set of hypotheses, drawn earlier in
the study, are shown to highlight the causality structure of the model. Further, the thesis
analyzes each individual dimension of the proposed model and highlights the scale concept
across the individual elements.
Finally, the theoretical framework behind the country as a destination is presented. The
concept of evolution and meaning of the country destination brand equity research is
highlighted. At last, the chapter proposes the measurement strategies of the destination brand
equity across different destinations.
4.1. Theoretical Foundation
The thesis utilizes several different theoretical concepts in order to evaluate the causal
relationship between the elements of the tourism destination brand equity and destination
sustainability such as original form of integration, social exchange theory, service marketing
theory, integrated theoretical framework and goal framing theory as listed in the Table 4.1.,
page 74.
The original definition of the concept of sustainable development comes from the
Brundtland Commission’s report from 1987,“Our Common Future”, which defines
sustainability as “development that meets the needs of the present without compromising the
ability of future generations to meet their own needs” (“World Commission on Environment
and Development”, WCED, 1987). The concept is defined by three constituting elements:
economic sustainability, social sustainability and environmental sustainability.
On the other hand, in the theoretical domain, Aaker (1991, 1996) outlined the concept of
customer-based brand equity as a tool for measuring, tracking and evaluating the value of
brands which is used as the bases of the proposed model in this thesis. Based on Aaker’s and
other tourism research literature, the adopted concept of the destination brand equity usually
consists of the four elements: destination awareness, destination image, destination quality and
destination loyalty. Despite the fact, that a Aaker never proposed how to operationalize the
elements, the model became the most widely used in the tourism research literature.
Recently, Mihalic (2016) proposed a Triple-A-Model that consist of the elements:
awareness, sustainability (agenda) and responsibility (action). The model supports strong

74
relationship between awareness and sustainability and addresses the gap between appealing
concept of sustainable development and its slow penetration in tourism development. The
notion of responsible tourism connects responsible behavior and action. It brings a new
understanding of tourism and posts the question of ethics. Next, the author states that
responsible tourism is taking place when a novel understanding of tourism is analyzed
(Bramwell, Lane, McCabe, Mosedale, & Scarles, 2008; Mihalic, 2016).
Another theoretical concept, the original form of integration, as shown in Figure 2.6. on
page 46, captures the impact of economic, social and environmental elements on destination
sustainability (Lee & Kirkpatrick, 1997). The concept requires that sum of all individual outputs
must be zero or greater than zero to confirm sustainable development of a destination.
Furthermore, the social exchange theory promotes the concept of power, trust, benefits
and costs as the social elements of tourism destination sustainability (Oberg & Svensson, 2010).
Moreover, contemporary service marketing theory introduces the key concepts such as
resources, value co-creation, value-in-use, relationships and experiences to define the custom-
based brand equity paradigm in tourism (Chekalina et al., 2016).
Next, to define economic element of the destination brand equity the more universal
approach to the economic impact on the destination brand equity is leading to the concept of
expenditure, arrivals, length of stay and seasonality (Dwyer, et al., 2014). Destination arrivals
and receipts are the most common indicators of a tourism destination economic activity in the
traditional demand side economy. Also, Butler (2001) suggests that seasonality has a
significant economic effect on a tourism destination.
Also, the integrated theoretical framework defines the environmental awareness as the
antecedent of the pro-environmental behavior. The concept views knowledge, motivation and
skill as key factors for affecting the sustainable environmental behavior (Harju-Autti &
Kokkinen, 2014). The thesis transparently identifies impacts and changes that (1) tourists
exhibit on destination resources, (2) destination resources and service providers have on
tourists, and (3) form experiences, expectations and various tangible and intangible outcomes,
obtained by tourists, as a result of the resource alteration process.
Consequently, the main concepts of the proposed model are to highlight the causal
relationships between the elements of destination sustainability and the elements of destination
brand equity. Those relationships are based on (1) interaction and consumption of the
destination resources by tourists, (2) the impact of destination resources on tourists, and (3)
tourists’ influence on destinations resources (Chekalina et al., 2016).
Table 4.1 Theoretical Foundation
Concept Domain Description Variables Source
Sustainability
Concept
Sustainability Economic,
Social,
Environmenta
l
Arrival,
Expenditure,
Wellbeing,
Safety,
Hospitality,
Climate,
Brundtland Commission,
WCED (1987)

75
Pollution, Noise,
Biodiversity
Customer-
Based Brand
Equity
Brand Equity Awareness,
Quality,
Image,
Loyalty
Recognition,
Recall, Top-of-
Mind
Awareness,
Associations,
Superiority,
Revisit, World-
of-Mouth
Aaker (1991, 1996);
Keller (1996, 2013)
Triple-A-
Model
Responsible
Tourism
Sustainable-
responsible
tourism
Awareness,
Agenda,
Action
Mihalic (2016)
Original
Weak Form
of Integration
Sustainability Seven
equations for
measuring
impact on
sustainable
destination
brand equity
Economic,
Social,
Environmental,
Awareness,
Image,
Quality,
Loyalty
Lee & Kirkpatrick, 1997;
Gartner, 2014
Social
Exchange
Theory
Social Exchange
Process
Power, Trust,
Benefits, Cost
Ward & Berno, 2011;
Nunkoo & Gursoy, 2012
Service
Marketing
Theory
Economic,
Consumer
Aspirational,
Co-creation,
Eco-centric,
Transformatio
nal, Shared
Value-in-use
Optimization
Expenditure,
Length of Stay,
Seasonality
Porter et al., 2011;
Scharmer et al., 2013;
Dwyer et al., 2017; Porter
et al., 2011; Dwyer et al.,
2014; Barros et al., 2010;
Weaver et al., 2000
Integrated
Theoretical
Framework
Environmental Environmenta
l Awareness,
Pro-
environmental
Behavior
Motivation,
Skill, Knowledge
Steg, et al., 2014
Goal Framing
Theory
Environmental Pro-
environmental
Behavior
Normative,
Hedonic, Gain
Goals
Lindenberg and Steg,
(2007)
The proposed model in the thesis is based on the following theories: original integrated
format as proposed by Lee & Kirkpatrick, (1997),social exchange theory, goal framing theory,
integrated theoretical framework, service marketing theory and customer-based brand equity
theory.

76
The proposed model supports seven regression equations: economic, social and
environmental, awareness, image, quality and loyalty, as shown in Figure 2.7, on page 47.
Operationalizing the equations require selecting the scale that is important for the evaluation of
a destination.
This thesis supports conceptualization of the social equation based on the social exchange
theory and includes power, trust, cost and benefits as variables (Nunkoo & Ramkissoon, 2012).
Power is considered as the ability of the local community to achieve the best possible outcomes
for the well-being of its residents as well as visitors. On the other hand, trust is a promise of a
destination as a brand, co-created by a destination and visitors and considered by visitors. Also,
trust is a change-of-state because of interactions between residents and the visitors. The authors
point that the other two variables, cost and benefit, are the bases for deciding whether or not
residents should engage in relationships that maximize benefits and minimize costs. In the
tourism setting, cost is considered as the sacrifice that host population has to forgone in order
to consider benefits. On the other hand, the benefits are rewards in the exchange process for
accepting the cost (Nunkoo & Gursoy, 2012). In other words, the pollution, noise, crowding,
crime, traffic, etc. are sacrifices for the benefit of economic wealth, prosperity, knowledge,
cross-cultural exchange, and increase of the overall well-being of the host population.
According to Fredline & Faulkner (2000) the SET suggests that residents support tourism
development only if the benefits outweigh costs. The same authors indicate that SET, in the
area of residents’ attitude towards tourism, is the most influential theory.
This relationship is in line with the works of Grönroos (2000,2009) and, Lindberg‐Repo
and Grönroos (2004) who suggested that media, competitors and customers contribute to the
articulation of the promise of the destination brand
Tourism brings both prosperity and destruction to the local community of any destination.
Therefore, the cost-benefit scenarios, as perceived by the local population, must be included
into any destination development equation (Davis et al., 1988; Hung et al., 2011). For the local
community to endorse tourism it must have trust in the authorities that they have the power to
implement the benefits and minimize the cost (Nunkoo, 2012).
Next, the economic equation is conceptualized based on the integrated approach that
encompasses aspiration, co-creation, eco-centric behavior, shared value and optimization
destinations (Szmigin et al., 2009; Lean, 2009; Reisinger, 2013; Pollock, 2015; Porter &
Kramer, 2011; Scharmer & Kaufer, 2013; Dwyer et al., 2017; ETC, 2017). The aspirational
visitor is looking at the whole value of consumption rather than just a single aspect (Szmigin,
et al., 2009). Furthermore, co-creation is the transformation process of visitors’ and residents’
values because of their interaction. The new economic logic offers preference to the shared
value and optimization over traditional maximization practices. The new logic gives preference
to quality and creativity over quantitative goals. There is a popular view among many scholars
and academics that the focus should be on expenditure, seasonality and the length of stay rather
than on arrivals (Dwyer, et al., 2014).
Further, conceptualization of the environmental equation focuses on the integrated
theoretical framework which recognizes environmental awareness as an important step towards
the pro-environmental behavior. The environmental awareness, which as a higher-order entity,
is a mix of the elements of motivation, skill and knowledge (Partanen-Hertellet.al., 1999).

77
More tourism creates more collision with the environment by reducing the potential for
tourism expansion. However, Crouch (2010), Gartner (2014) and Qiu Zhang et al. (2016)
suggest that the long-term value of a tourism destination depends on the sustainable use of
resources. To better understand tourism destination, it is paramount to be aware, have judgment
of quality and long-lasting impressions, and develop loyalty of the environment, as well as the
economic and social forces that are responsible for any growth and development (Gartner, 2014;
Buckley, 2012).
Conceptualization of the awareness equation is based on the dimensions such as recall,
recognition, top-of-mind awareness, dominance, knowledge and opinion (Aaker, 1996). On the
other hand, image equation is seen as the collection of beliefs, feelings and remembrance that
people have of a specific destination (Zhang et al., 2016). Further, quality equation should
include elements that reflect difference in expectations and the overall judgements of
superiority. Finally, conceptualization of the loyalty equation, must include attitudinal and
behavioral constructs. Intention to revisit, recommend, pay premium and anything that suggests
attachment to the destination are considered as measurement options.
As mentioned earlier, each construct of the overall destination brand equity consists of
underlying drivers as suggested by ‘social exchange theory’, ‘integrated theoretical framework’
and ‘original form of integration’ (Ward & Berno, 2011; Nunkoo & Gursoy, 2012; Harju-Autti
& Kokkinen, 2014).
For a destination to remain attractive it must keep, preserve or even enhance its’ carrying
capacity (Crouch, 2010). Exceeding destination capacity with the consumption of resources
deteriorates the long-term health of a destination. Eventually, the image capital of a destination
deteriorates with the consequence of lowering the value of destination brand equity.
In that regard, we must consider brand equity of a tourism destination in the same way
that we look at the development of sustainability in the long run. Consequently, we need to
consider destination brand equity dimensions as a part of the same development process that
also includes constructs of environmental, economic and social elements.
For the last forty years, the environmental and social issues have slowly started to gain
interest among academics, scholars, researchers and the public. The term sustainability, as a
concept and direction for development, is a recent subject. The focus was on the pragmatic side
of the sustainability concept, its role, goals, areas of implementation, management and the
overall applicability. Besides the fact that there have been many studies on tourism destinations,
there were few concerning sustainability aspects (Nunkoo & Ramkissoon, 2011; Nunkoo &
Gursoy, 2012; Andereck et al., 2011; Ward & Berno, 2011; Latkova & Vogt, 2012).
Dwyer et al., (2014) suggest expenditure, length of stay and arrival as proxy variables for
the economic brand equity construct. The social exchange theory proposes power, trust, cost
and benefit as main proxy candidates of the social brand equity, while the integrated theoretical
framework regards knowledge, motivation and skill as the major proxy variables for the
environmental destination brand equity. According to the reviewed theories the structure of the
proposed model is shown in Figure 4.1, p. 78.

78
Figure 4.1 Proposed Model: Conceptual Framework
In this section, the thesis formally introduces the multidimensional theoretical model,
which depicts the full interrelation between the elements of sustainability and the elements of
destination brand equity. Going forward with presenting the formal framework for the
sustainable tourism destination brand equity model, that will serve for analyzing the proposed
hypothesis, this thesis combines the destination brand equity model, based on the four elements
(awareness, image, quality and loyalty) as proposed by Aaker (1991, 1996) with the original
form of integration model for measuring the destination sustainable development and brand
equity (Lee & Kirkpatrick, 1997).
The proposed theoretical framework is intended for analysis of the impact that sustainable
elements have on the components of the destination brand equity and individual causal
relationships between the elements, see Figure 4.1. The proposed theoretical framework is
supported by its operational format with equations presented earlier in Figure 2.7, on page 47.
Finally, based on the above, the thesis proposes the hypothesized models shown in Figure 4.2
on page 80.
The first element of the model, destination brand awareness, which represents the isolated
element of the hierarchy of the proposed model, is a prerequisite of placing a destination into
the awareness and decision set by prospective tourists. It reflects the strength of destination
presence in the minds of the perspective tourists. (; Gartner, 2009; Pike et al., 2010; Gartner &
Konecnik Ruzzier, 2011;). Aaker (1996) suggested that awareness in the brand context appears
Destination
Sustainability
Power Trust Cost
Benefit
SOCIAL
Receipts Arrivals
Length of Stay
ECONOMIC
Motivation Knowledge
Skill
ENVIRONMENTAL Recall
Recognition Top-of-Mind
Awareness
AWARENESS
Strong
Associations
Tangible
Intangible
IMAGE
Expectations
Superior Value
QUALITY
Revisit Word-of-Mouth Premium Price
LOYALTY Destination
Brand Equity
IMP
AC
T

79
in six distinctive manifestations: recognition, recall, top-of-mind awareness, dominance,
knowledge, and opinion.
Recognition is associated with the ability of the potential tourists to recognize name, main
features, geographical location and some characteristic of a destination when the name of a
destination comes up. Also, recognition is the lowest-ranked category of destination brand
awareness (Im et al., 2014). Next, recall is considered a capacity to, without assistance, come
up with the name of a destination associated with the specific destination category. The tourism
destination categories can be any of the following: cultural, religious, adventure, ski, sun, sand
& swim, culinary, adrenalin, etc. tourism destinations.
On the other hand, top-of-mind destination awareness is related to the destination name
that comes up first in the recall process (Gartner, 2009; Hornig et al., 2012). When asked to
think about tourism destinations, a result that comes up all the time is called a destination brand
dominance (Garcia et al., 2012).
Similarly, knowledge about destination is what prospective tourists know about a
destination brand, its distinctive features and attributes, revoke of advertising and related pieces
of information, and facts that are differentiating one destination from the other (Konecnik &
Gartner, 2007; Pike et al., 2010). Opinion about a destination is the top level of the destination
awareness structure. It happens when prospective tourists have highly favorable, unique and
individual opinion of a destination (Konecnik & Gartner, 2007; Boo et al., 2009).
Therefore, word-of-mouth by family and friends, social and mass media, traditional press
releases, tourism industry reports, and various internet applications focusing on tourism, are
important sources of data about tourism destinations. Positive or negative information about a
tourism destination points out if the destination brand development is justified or if there is an
unacceptable risk for the investment in the development. Also, word-of-mouth heralds if a
tourism destination is deteriorating or growing in popularity. Therefore, information about
tourism destination can have either positive or negative impact on a destination’s brand
awareness and its’ reputation (Gartner, 2009). Most importantly, the growing use of internet
causes the impact on the tourists’ decision-making makes it hard to control communication
messages (Grönroos, 2000).
Next, destination brand image is defined as a set of strong associations about tourism
destinations’ tangible and intangible resources, memorable tourism experiences enhanced by
tourism destination products and services, as well as various specific destination experiences
and social interactions, that exist in the minds of tourists. Perceptions and experiences of
destination resources are unique for every tourist while selection of resources is unique for every
destination (Palmer, 2010; Zabkar, Brencic, & Dmtrovic, 2010. Moeller, 2010). On the other
hand, marketing literature recognizes human, tangible and intangible resources as a source for
tourism consumption (Bianchi et al., 2014, 2010; Echtner & Ritchie,1993; Im et al., 2012).
Destination brand loyalty is the final element of the Aaker’s (1991, 1996) destination
brand equity model. It is the ultimate objective of the development of the destination brand
associations. Based on the previous destination brand loyalty literature (i.e., Pike et al., 2010;
Kladou & Kehagias, 2014), the thesis supports the previous definitions that the destination
brand loyalty represents the intensity of attachment which a perspective tourist has to a
destination brand. The literature supports attitudinal and behavioral aspects of loyalty,
respectively.

80
Figure 4.2. Proposed Model: Hypothesized Framework
Behavioral loyalty is manifested as an intend to revisit and positive word of mouth
(Konecnik & Gartner, 2007). On the other hand, attitudinal brand loyalty is about selection of
choices and actions that a tourist intends to make based on its attitude towards the destination
resources, perceived attributes, and benefits that can be obtained by visiting a destination
(Gartner, 2009). Attitudinal loyalty shows a strong desire to revisit the destination and spread
the positive message on the destination to others. Also, when comparing among different
destination choices, a tourist shows the preference to a destination and willingness to pay the
higher price (Bianchi et al., Chen & Myagmarsuren; Horng et al., 2012; Pike et al., 2010). The
thesis is focused on evaluating attitudinal loyalty as the part of the proposed paradigm.
Economic Sustainability
Environmental Sustainability
Social Sustainability
Destination
Awareness
Destination
Loyalty
Destination
Quality
Destination
Image
H3
H6
H10
H13
H4
H7
H11
H14
H8 H12
H9
H5
H1, H2

81
Finally, the proposed model supports multi-faceted nature of the tourism destination
brand equity. Next, the thesis supports the argument that the universality of the model is
achieved by incorporating major elements of sustainability such as social, environmental and
economic. The point is made that each of these elements has an individual contribution to the
overall value of the destination brand equity. With no market for destinations, the value of the
destination is tied to its long-term perspective based on the expectations that economic reasons
will still be there, natural environment will not deteriorate, and the well-being of the visitors
and residents will be preserved. Destinations have long-term perspective and gain their value
only if their prosperity will continue in the future.
4.3. Country as a Destination
The reality of globalization is making places competing in the global marketplace for
products, services, ideas, talent, tourists, events, investments, influence, etc. For countries,
reputation and brands are every bit as important for their prosperity and success in the
contemporary world as are the brands of products and services for corporations (Anholt, 2010).
Most importantly, a country brand serves as an umbrella brand for products and services
originated in that country. Recent proliferation and availability of the global datasets showing
rankings and evaluating countries based on various research, public, political and marketing
aspects make countries a suitable target for research communities including those with interest
in sustainable tourism and tourism destination branding. Freire (2016) and (Anholt, 2014) state
that stakeholders in charge of their countries, regions and cities have interest in tourism and are
investing in promotion of their places. In this thesis, the preference for countries over regions,
cities and other tourism destinations is given to strengthen the case of universality of the
proposed model. In the destination brand architecture country brand serves as an umbrella
brand that influences all other destination brands within that country such as regions, cities and
other local places. All destinations within a country inherit and benefit from the value and
perception of its country’s destination brand equity. Therefore, deductive conclusion is that the
country destination brand equity is at the top of the value inheritance pyramid. Universality is
achieved by obtaining the common destination brand equity of all countries.
Ashworth & Kavaratzis (2010), Cevero (2016) and Fetscherin (2010) argue that there
is an interest by scholars in country branding which is further supported by a number of authors
(Szondi, 2007; Kotler & Keller, 2012;; Gertner, 2011; Warnaby & Medway, 2013).
The global economy considers country branding as crucial element in competition and
exports (Mariutti &Tench, 2015). Brands project thier image into the market by either
communicating brands’ features to the intendent audience or by broader marketing activities
designed to add value to the brand recipients as well as by awareness (Kotler & Keller, 2012,
Kapferer, 2004; Shimp, 2007). Consequently, country brands gain their global place by
implemeting their branding strategy (Mariutti & Tench, 2015). Inevitably, countries brand and
are a significant source of the national pride (Mariutti & Tench, 2015). People tend to identify
themselves with the image of what their country projects (Cevero, 2016).
In this thesis the “country brand” is chosen as the place for research and interchangeably
uses “country branding and nation branding”, regarding “country” as a standard term, (Mariutti

82
& Tench, 2015; Fetscherin, 2010; Gudjonsson, 2005; Nation Brands Index, 2016; Country
Brand Index, 2019).
National branding is considered in the context of economic, diplomatic and political
scenarios. International relations as a part of diplomacy is considered as the main reason why
the governments are interested in the nation branding. (Aronczyk, 2013; Anholt, 2007; Jansen,
2008; Jaffe & Nebenzahl, 2001).
This dissertation considers country branding and place branding as one which is
supported by significant number of researchers (Ruzzier & De Chernatony, 2013; Gertner,
2011; Go & Govers, 2011; Sevin, 2011; Ashworth & Kavaratzis, 2010; Moilanen & Rainisto,
2009; Dinnie, 2009; Kavaratzis, 2010).
Branding of a country is a sophisticated subject in relation to many different areas
including management and research (Chan & Marafa, 2013; Ruzzier & De Chernatony, 2013;
Gertner, 2011; Go & Govers, 2011; Ashworth & Kavaratzis, 2010; Dinnie, 2009; Kavaratzis,
2005; Rainistro, 2003). Therefore, from the strategic point of view, county brand strategies can
utilize marketing activities. Thus, many researchers consider country brand closely associated
with marketing strategies and place branding (Dinnie, 2013; Warnaby & Medway, 2013;
Zakarevičious & Lonikaitè, 2013; Jansen, 2008; Kavaratziz, 2005). Also, country branding is
used to support various marketing and communication planning activities (Dinnie, 2005; Kotler
& Keller, 2012; Gertner, 2011).
Schröter and Schwekendiek (2015) consider nation brand as a blend of differential
components. Further, the authors state that nation image can be used as a tool for implementing
different economic, social, security and power initiatives.
Country branding is not a new subject, but it has produced a a lot of commotion in the
academic, research and corporate communities (Kotler & Keller, 2012; Dinnie, 2009; Ashworth
& Kavaratzis, 2010; Gertner; 2011; Go & Govers, 2011; Warnaby & Medway, 2013).
Branding a country requires a different strategy and approach from one used to brand
product or services. Country brand is a sophisticated structure of multi-functional and cross-
related elements that belongs to the public domain (Dinnie, 2009; Moilanen & Rainisto, 2009;
Kavaratzis, 2010; Warnaby & Medway, 2013; Ashworth & Kavaratzis, 2010; Go and Gover,
2011; Gertner, 2011; Buhmann & Ingenhoff, 2013; Warnaby & Medway, 2013; Fetscherin
2010, p.467)
Anholt (2007), Moilanen & Rainisto (2009) and Szondi (2007) state that development,
promotions, performance and management are vital to the country brands. Similarly, Mariutti
& Tench (2015) argues that governments strive to make brand sophisticated and spend
significant resources on the plethora of public specialists, consultants, and practitioners
There is a desire to preserve global resources (Kerk & Manuel, 2014; Ritchie & Crouch,
2003), Today, this trend is both challenge and an opportunity for enterprises to make a
difference in the marketplace (Gerlach & Witt, 2012; SSF, 2014; Andersen, Ditlevsen, Nielsen,
Pollach & Rittenhofer, 2013; Castellani & Sala, 2010). Therefore, this thesis considers country
brands suitable for the analysis of the impact of tourism destination sustainable development
on the destination brand equity.

83
4.4. Country Destination Brand Equity
National identity, pride, self-awareness and the role we play in the global world is all
reflected in the country brand. If incorporates visitors, stakeholders, different interests,
residents and public and private organizations (Mariutti & Tench, 2015; Buhmann & Ingenhoff,
2013; Dinnie, 2009; Jansen, 2008).
Today, country destination brand equity is a valuable research topic which seems to be
significantly associated with the destination attractiveness. (Chiu & Ho, 2015). Destination
attractiveness reflects positive experience with a destination or favorable opinion about it even
when a country is not visited. According to Reitsamera, Brunner-Sperdinb, & Stokburger-Sauer
(2006), destination attractiveness refers to a demand-side aspect influenced by the scenery, local
community, accessibility and, amenities and infrastructure which are considered key factors in
inspiring people to visit and stay a period of time. Consequently, attractiveness causes a
significant influence on the destination selection process, tourists’ behavior and the formation
process of attachment (Henkel, Henkel, Agrusa, & Tanner, 2006). In regard to destination
attractiveness the research literature has develop two different approaches. The first approach
recognized importance of the tangible features and characteristics of a destination as an
important factor in forming cognitive and affective perceptions about destination. The second
approach is related to the tourists’ image perception of a destination (Formica & Uysal, 2006).
According to Reitsamera et al., (2006), the two approaches need to be integrated for the
memorable experience and favorable image formation about a destination.
Trust and positive relationship, attractiveness, competitiveness, cost-to-value ratio are
key elements for creating memorable experiences and satisfaction in the minds of the consumers
(Ritchie & Crouch, 2010; Mihailovich, 2006; Buhmann & Ingenhoff, 2013; Go & Govers,
2011).
Moilanen & Rainisto (2009) and Kavaratzis (2005) argue that marketing plays a major
role in the global positioning of the country’s brand. On the other hand, Marruti & Tench
(2015) state that widely accepted country brand paradigm is still work in progress. Because,
countries as tourism destinations represent a significant source for the analysis they are used in
the thesis for global evaluation of the presented model.
4.5. Measuring Country Destination Brand Equity
Concept that countries are destinations and have brand value expressed as destination
brand equity is quite similar to the concept of product brand equity (Kladou et al., 2015).
According to Mariutti & Tench, (2015), the concept produced interest in the research
community to develop several paradigms for the global placement and ranking of the country
brands. Criteria for analysis differ and vary from the perceived image to social, economic,
cultural and technological dimension inter alia. Fetscherin (2010) and Dupeyras & MacCallum
(2013) consider perception and attitudes to platy important role and the part of the country brand
equity measurement.
According to Pike & Bianchi (2016) tourism literature recognized measurement of the
destination brand performance as a field in 2007. The previous concept of measuring
destination brand performance “net present value”, which proved inadequate for measuring
values of the destination brand equity, was replaced by the CBBE approach which started to

84
gain significant support by the service-based marketing research. The authors measured the
impact of the emerging long-haul market (Chile) and short-haul traditional market (New
Zealand) on the destination Australia using CBBE model. Their research shows stronger
positive impact of brand awareness (salience), brand image and brand value on brand loyalty
for short-haul market (New Zealand).
On the regulatory side, The Organization for Economic Cooperation and Development
OECD (2016) suggests that tourism environment is changing over time while Dupeyras &
MacCallum (2013) proposes indicators that include satisfaction, motivation, different
behaviors, awareness and sustainability for tracking the changes. However, the overall
conclusion is that tools for monitoring and tracking are not widespread among the countries.
Country Brand Index (FutureBrand, 2018) and Travel & Tourism Competitiveness Index
(Crotti & Misrahi 2017) proved to be preferred choices for the number of countries for tracking,
evaluation and monitoring competitiveness in tourism markets worldwide. Still, according to
the Dupeyras & MacCallum (2013) the choice of indicators can be quite different from country
to country.
There is a significant amount of literature contributing to validation of country destination
brand equity taking into account business or research perspective (Konecnik & Gartner, 2007;
San Martín, Herrero, & García de los Salmones, 2018; Pike , Bianchi, Kerr, & Patti, 2010;
Teodorovic et al., 2019 .
The research aspects consider integrated paradigms and potential variables of scientific
importance (Kotler & Keller, 2012). According to Buhmann & Ingenhoff (2013) and Mariutti
& Tench (2015) the business aspect is predominantly concerned with the public opinion, image,
country brand, expenditure and performance.
85
5. METHODOLOGY
The thesis supports notion that conducting research in the social, behavioral and
marketing studies require large and intricate datasets requiring sophisticated statistical methods
for evaluation and illumination of the data (Bartholomew et al., 2008).
To increase robustness of the proposed model, this thesis uses two sets of data, global
data and the data of a case of Serbia. By using multivariate statistical analysis on both sets of
data the thesis intends to confirm the strong areas of the model as well as the moderate and the
weak ones. The strong areas of the model will be those with the almost identical statistically
significant outcome in both sets of data. The moderate areas will show partial similarity while
weak areas will be in the domains where outcomes are clearly different or nonexistent.
The study is empirical in form and exploratory in nature and has adopted quantitative
methods as the main approach to research which is primarily governed by the principles and
techniques of the multivariate statistics.
The multivariate technique represents a statistical analysis of multiple variables in a single
relationship or set of relationships. Multivariate analysis is supported by the multivariate
measurement which utilizes two or more indicators for composite measures. Multivariate
analysis is always followed by reliability and validity measure. Reliability represents extent to
which a variable or group of variables are consistent in what is intended to measure. On the
other hand, validity is an extent to which measure or set of measures correctly represents the
subject of a study. In other words, validity is concerned with how well the concept is defined
by measured data, while reliability is associated with the consistency of measures (Hari et al.,
2010).
The most important concept of the multivariate analysis is the “variate” which stands for
a liner combination of variables with empirically determined weights. The weights are
determined by multivariate technique while the variables are specified by a researcher. A
variate takes mathematical form such as:
Variate value = w1X1 + w2X2 +…+ wnXn
where “wn” is the weight calculated by the multivariate technique and “Xn” is the observed
variable. The result is a single value that best describes an entire set of variables (Hair et al.,
2010). Also, the multivariate analysis is used under the assumption that data is normally
distributed. Besides the fact, that it is important to understand how data distribution departs
from normality, it is important to consider the impacts of the sample size. Smaller sample sizes
of 50 or less can experience significant deviations from normal distributions. Therefore, the
thesis, uses sample sizes of 124, for the global case as a trade-off between the percentage of
missing value in the global case and the size of the dataset (Hair et al., 2010).
Another important concept that is used in the thesis is operationalization of a construct.
It refers to the process in the measurement model involving determination of the measured
variables that are associated with latent constructs (variables) and the manner in which they will
be measured.
The thesis uses exogenous and endogenous constructs as latent, multi-item variables.
Exogenous variable is a predictor or independent variable that is determined outside of the

86
model. In the visual path diagram exogenous variables do not have any paths coming into it.
On the other hand, endogenous, predicted or dependent variables are defined by factors within
the model. Also, they are dependent on other constructs. The dependence paths are visually
represented as paths coming from exogenous or from other endogenous constructs. It is
important to mention that based on the theory implemented in the model, the researcher
determines whether latent variables (constructs) are either exogenous or endogenous variables.
In most cases, a single SEM model most certainly will support both correlational and
dependence relationships which is the case in this thesis.
Both exogenous and endogenous constructs are important in visual representation of a
model which represents the underlying theory, where theory can be regarded as a systematic set
of relationships providing a uniform and inclusive clarification of phenomena (Hair et al., 2010)
There is an interesting theoretical concept related to the structural relationships among
observable and unobservable variables in a model. The multivariate statistics supports two
types of relationships between unobservable variables (constructs): dependence and
correlational (covariance) relationship. Relationships between constructs and variables are
called measurement relationships. Any relationships with a dependence path pointing to an
endogenous construct is considered dependence relationship while exogenous constructs have
only correlational relationship with other exogenous constructs (Hair et al., 2010, p. 615). The
latter is particularly important for the thesis since it relates to the confirmation of the H2
hypothesis.
In addition, inductive analysis will be used in relating the observed (exogenous) variables
and latent (endogenous) variables to define the concept of the model. Furthermore, deductive
approach is adopted to form the theoretical framework, research questions and hypotheses prior
to data collection and analysis. For the global case, the study will rely on the country or national
global indicators obtained from the established global datasets which come from the on-line
sources or directly from the institutions’ databases. Based on the works of Saunders, Lewis, &
Thornhill (2016, p. 436 ), ,in the case of the case of Serbia, the thesis uses data from the Google
Forms based survey conducted on foreign tourists visiting Belgrade and Serbia during the
period between September 2018 to April 2019.
Furthermore, the inductive approach will be used in evaluation of the collected data to
reveal which themes and concepts are of interest for the study. According to Saunders et al.
(2016), data will be assessed as they are collected to develop a conceptual framework for further
analysis. The research questions and research propositions are compared to the previously
established hypotheses. In this thesis, improvements and new developments of the established
theory are applied in interpretations, analysis and data collection. Using inductive method,
latent (predicted) variables are operationalized from the extracted factors or groups of variables
producing constructs that will be interpreted as destination social, economic, environmental,
awareness, image, quality and loyalty dimensions, as shown in Figure 2.7 on page 47.
The country-based global data will consist of country-level proxy quantitative indicators,
with some statistical and mostly survey-based proxy multi-national quantitative indexes of
various continuous scale, see Table 6.1., page 108. Global indicators, which decades ago were
technically and financially difficult or impossible to obtain, are now available due to the
proliferation of the various on-line sources (Alfsen & Greaker, 2007; Evans, Srezov, & Evans,
2015). Additionally, demand for global surveys have mushroomed the creation of quantitative

87
indicators that are rapidly closing the gap between primary and secondary data, because in many
instances, they are so close to the specific subjects of interest. Growing number of global
indicators contribute to the higher resolution and reliability of the survey data which, in turn,
have the consequence that for almost all topics and issues there is data available on-line
(Nunkoo & Gursoy, 2012; Alegre et al., 2010; Ram & Hall, 2015; Petrenko, 2015).
Similarly, the second set of data, the primary survey data of a case of Serbia were
collected in the on-line internet-based survey of the foreign tourists in Google Forms
application, see Table 6.2., page 107. The case of Serbia data will serve as the basis for cross-
valuation of the same proposed model used in the global case. The outcomes in both scenarios
will support the robustness of the model.
Using inductive method, latent (predicted) unobservable constructs or dimensions of the
proposed model (social, economic, environmental, awareness, image, quality and loyalty will
be operationalized from the associated set of the observable (measurable) variables. Using
exploratory factor analysis, which will be later refined using confirmatory factor analysis for
the goodness-of-fit testing, constructs of the proposed theoretical model are extracted and
identified, as shown in Figure 2.7, p. 47.
The study is cross validated on the two datasets: global and case of Serbia, using the two-
phase analysis. The first phase will test statistical validity and reliability of the global data
based on the quantitative proxy indicators from the global datasets based on the data of the
selected countries. Similarly, the second phase will test the validity and reliability of the model
fit between the proposed and estimated model based on the survey data from the case of Serbia.
In both phases, the sustainability domain is conceptualized with three dimensions: economic,
social and environmental while the destination brand equity domain is conceptualized as
awareness, image, quality and loyalty, as proposed in the conceptual framework in Figure 2.7,
on page 47.
Next, in the global case, dimensions will be conceptualized with quantitative indicators
of different scale, with a possibility for scale normalization. The global indicators are listed in
Table 6.1., page 108. Similarly, for the case of Serbia, all variables will be operationalized
using the eleven-point Likert scale from 0 “absolutely yes” to 10 “absolutely no” (Tasci, 2018),
as shown in Table 7.1, page 139. The preference for eleven-point Likert scale over 5 or 7-point
Likert scale, is given to increase granularity and reduce “interval” issues. The interval issue is
evident in the 5 or 7-point Likert scale, where the interval between “agree” or “strongly agree”
tend to be inconsistent from one respondent to another.
Likert scale was introduced in 1932 by Rensis Likert, professor at the University of
Michigan, with intention to provide a tool for more precise evaluation of the survey data in the
social studies (Likert, 1932). Ever since, the Likert scale became one of the most used
methodologies in the various fields of research, but mostly has been used in the social sciences.
However, from the start, the Likert scale methodology was followed by the ongoing controversy
which is still present. The controversy is a result of the two opposing and competing views that
have developed relatively independently from one another. One view is that Likert scale
produces “ordinal” data while the other suggest that the data is “interval” in nature. The thesis
adopts the “intervalist” view based on the analysis by (Carifio & Perla, 2008). The intervalist
view supports using more sophisticated statistical tools such as analysis of variance,
multivariate analytical tools, and factor analysis to mention few.

88
In both scenarios, global and case of Serbia, Cronbach Alpha, Kaiser-Meyer-Olkin Test
(KMO) and Bartlett’s test if sphericity, will confirm the internal suitability of the data.
Cronbach’s Alpha (CA) is the estimate of the internal reliability and consistency associated to
the scores that can be derived from the scale or composite score reliability analysis. The CA
shows if it is justifiable to interpret scores of the data. Anything that shows Cronbach’s Alpha
over 0.7 or over 70% of reliability, is considered acceptable. Next KMO is a measure of
sampling adequacy which is an indicator of whether the correlations matrix is proper for factor
analysis. Even though many sources suggest that KMO should be over 0.5 in this thesis we can
accept only values over 0.65 (Kaiser & Rice, 1974, p. 112). Bartlett’s Test of Sphericity should
be significant showing the p-value under 0.05, suggesting that the number of dimensions can
be reduced.
The exploratory factor analysis (EFA) in SPSS (Statistical Package for Social Sciences)
software package, version 21, is conducted to confirm the dimensionality of the conceptual
framework and loading factors. The EFA is a statistical tool for measuring correlations between
the variables in the given dataset without using any previous theory or information on how to
group the variables. The EFA reduces the number of variables to a more manageable number
for further analysis and, at the same time, preserves the sufficient amount of information of the
original data size. The EFA is the first phase in making ready the variables for the more
straightforward structural equation modeling. The confirmatory factor analysis CFA conducted
in AMOS (Analysis of Moment Structures) software package, version 23, is used to confirm
the model fit between proposed and estimated model as suggested by Byrne (2016).
Furthermore, structural equation modeling analysis SEM or path analysis, in AMOS,
version 23, is used to analyze the causality and hypothesized relationships between the
dimensions of the proposed model. The analysis of the overall impact of the elements of
sustainability on the elements of destination brand equity will test the previously developed
hypotheses.
5.1. Developing Research Instrument
Design of the research instrument is intended to support measuring the relationships
between the elements of the proposed hypothesized model as shown in Figure 4.2, page 80.
The goal is to cross-validate the hypothesized findings in the global and the case of Serbia as
well as to reveal the impact of the elements of sustainability on the elements of destination
brand equity. The choice of the global indicators is specifically intended for the scenario which
includes country datasets.
For the global case, the thesis uses a predefined set of global indexes or indicators from
the datasets of the selected reputable institutions specialized in collecting, analyzing and
interpreting global country data, as shown in Appendix A. There is a growing interest by many
parties, including governments, nations and sovereignties, to improve their competitive position
in the global markets to gain upper hand in various political and business scenarios, and to
increase efficiency and effectiveness of their operations (Anholt, 2007). Consequently, such
interest creates a greater demand for the global data and global indicators. Besides, global
datasets are professionally gathered by specialized institutions with significant finances and
specialized manpower. The datasets could be statistical, survey or combination of both. For

89
example, arrivals, GDP, length-of-stay and expenditure are statistical indicators. However,
happiness index, government effectiveness, quality of nationality, attractiveness, image and
awareness indexes are survey based. Detailed information on global indicators is given in
Appendix A.
In the original statistical format, indicators are constructed from several hundred to over
a thousand responses for each country. Statistical data are pre-tested for reliability, validity and
normality giving the advantage of using global indicators for the quality of data. Therefore,
only reliable and reputable data sources, with a high reputation within the research community,
are used in this thesis. All data used in this thesis come from the public domain. Nevertheless,
using global datasets in tourism destination research is still in its infancy.
Consequently, on the supply side there are proliferation of many global databases with
indexes exceeding the poll of 100 countries. Theoretically, at the global level, country data can
be collected from about 300 nations and sovereignties. However, at the moment, the quality
country-data for empirical research are realistically available from up to 150 developing and
developed countries. Every year, the number of countries and sovereignties taking part in the
development of various global datasets, is increasing, which is the good news for the future
research.
As mentioned above, only recently global databases became available on-line in the
public domain. The intent of using global indicators is to 1) confirm the proposed model and
presented hypotheses 2) prove applicability of the model across different countries, regions, and
nations, 3) increase universality and robustness, and 4) develop a tool for monitoring, tracking
and analyzing development of the destination brand equity and destination sustainability.
On the other hand, survey data is used to narrow the research to a more specific case that
will be used to cross-validate the proposed model on the empirically collected data of a case of
Serbia with intention to confirm the global case or vice-verse. The advantage of using survey
data over global indicators is that there is no need for proxy variables and there are no missing
fields issues. However, the issues related to normality such as skewness and kurtosis remain.
The survey data gives more control over the variables or research questions allowing surgical
precision in obtaining relevant data. The most significant advantage of the survey data is that
it can be customized to a specific domain or specific issue. On the downside, besides size, the
survey data could be prone to normality issues such as skewness and kurtoses. This thesis uses
case of Serbia data to cross-validate the proposed hypothesized model utilizing destination
sustainability elements and destination brand equity dimensions of a case of Serbia.
5.2. Data Collection and Preparation
The global data is collected on-line or directly by obtaining datasets from the international
institutions in the form of proxy variables. For the global variables in this thesis, which are
outlined by the theoretical concepts, it would be very difficult to find exact match on-line.
Therefore, proxy variables, that reflect the substance, nature and similar meanings are used.
Next, the on-line data is transferred into the Excel-type database for further statistical analysis.
In this thesis, the number of missing data in the global dataset are reduced to 15% allowing for
the acceptable number of country data and reasonable size of the research instrument. Data is

90
checked for normality, outliers, kurtosis and skewness. All missing data are imputed by mean
values as suggested by Hair et al. (2010).
The case of Serbia survey data comes with no missing values and no outliers since the
questions are in the close format and are streamlined with Google Forms application. Still,
normality issues such as kurtosis and skewness are possible. Those data are either eliminated
or replaced by means.
5.3. Multivariate Modelling
The thesis relies on techniques and methods of the multivariate statistics to analyze,
evaluate, test and confirm specified hypotheses and relationships. One of the main goals of the
multivariate techniques such as factor analysis, multivariate analysis of variances, discriminant
analysis, multiple regression and others are to expand researchers’ and scientists’ explanatory
capacity to efficiently use statistics in their research. They also, provide researchers with
effective tools for addressing many of the theoretical and managerial questions.
As datasets in social, behavioral, marketing, economic, political, psychology, and
education sciences have grown complex over the years, the sophisticated statistical methods
become extremely significant and important in interpretation and analysis of such data. Very
often in social sciences as well as in marketing research we cannot directly measure intended
variables. In this thesis the unobservable variables are social, economic and environmental, as
well as awareness, image, quality, and loyalty, in addition to destination sustainability and
destination brand equity.
In multivariate statistics those variables that cannot be directly observed are called latent
variables, latent constructs, latent factors or simply factors. The names are used interchangeably
in this thesis. Sometimes, there are cases with models represented by a single latent variable,
however, most models are multidimensional involving multiple latent variables.
In this thesis we are confronted with a set of interrelated sustainability and brand equity
variables, how those variables support the parent variables (economic, social, environmental,
awareness, image, quality and loyalty), and how the parent variables are related to one another.
The number of issues between sustainability and brand equity variables have both theoretical
and managerial significance. The only statistical tool that can fully address all these issues is
structural equation modelling (SEM) technique, which is an extension of multivariate
techniques such as multiple regression analysis and factor analysis.
Structural equation modelling is mostly used in analyzing theories that contain multiple
equations including relations with dependent variables. Important feature of the structural
equation modelling is a capability to evaluate a series of mutually dependent hypothesized
relationships at the same time. SEM is the only technique that allows for analysis of both
measurement features and theoretical causalities in one place.
5.4. Structural Equation Modelling
The research community considers structural equation modelling (SEM) as the primary
multivariate technique followed by the cluster analysis and MANOVA (Hershberger, 2003).
Origins of SEM date back to the first half of the twentieth century when economic and genetics
research were in full swing. At that time, scientists needed a statistical tool for evaluating

91
relationships between variables (Blalock, 1962). The problem that scholars and researchers
experienced was lack of computers and software programs to support complexity of SEM. The
progress was made in the late 60’s and early 70’s when the calculation was done on latent
constructs using maximum likelihood estimation by Jöreskog & Sörbom (1976). The work of
Jöreskog & Sörbom lead to the development of the LISREL (Linear Structural Equations)
program, which was the first software package to gain large popularity and usage for calculating
SEM or path analysis. By 2000 and today, SEM became a number one choice for multivariate
analysis (Byrne B.,1998; Jöreskog & Sörbom, 1997; Jöreskog, 1981).
Most multivariate techniques can evaluate only a single relationship at one time. It is true
even for the techniques such as canonical analysis and multivariate analysis of variance, which
allow for multiple dependent variables. They all represent single relationships between
independent and dependent variables. What sets SEM apart from other multivariate techniques
is the ability to evaluate multiple relations at one time.
SEM is a tool that combines features of factor analysis and multiple regression analysis
that provides scientists and researchers with a tool to simultaneously evaluates a set of
causalities among the evaluated variables as well as between several latent once. However, to
represent interrelationships of variables between constructs requires a structural model. The
structural model is a collection of one or more dependence relationships expressed by the
hypothesized model’s constructs (Hari et al., 2010).
Dependence relationship between two latent constructs is known as structural
relationship. In the diagram, they are denoted with an arrow showing dependency. Endogenous
(latent) variables can depend on another constructs, however, exogenous (predictor) constructs
cannot be dependent on either exogenous or endogenous constructs.
SEM is also referred as covariance structure analysis, latent variable analysis, or by a
name of the statistical software packages such as AMOS, LISREL and others. Regardless of
the testing procedures, all SEMs are characterized by the following three characteristics:
1. Estimation of multiple and interrelated dependence relationships.
2.Presentation of measurement errors of the estimation process and outline of unobserved
concepts in the relationships.
3. Definition of a deterministic model for explaining the entire set of relationships.
SEM is a tool that estimates a set of independent, individual, equations at the same time,
based on the predefined paradigm used by the statistical program. To analyze which
independent variables predict each dependent variable, a researcher relies on prior experience,
theory and research goals. A series of structural equations are than used for each dependent
variable. SEM is different from other multivariate analyses since it allows for multiple
evaluations of dependent variables.
Survey generated data are not a prefect measure of someone’s answer. People can
overstate or understate their answers causing measurements errors in the collected data.
Consequently, the answers could affect the estimate of the true structure of the coefficients.
Thus, internal consistency based on the degree to which a latent construct and its corresponding
indicators are interrelated is called reliability. Reliability stands for the magnitude to which
indicators measure the same thing. Increase in reliability means that more of the variance is
explained in each indicator. The more of the outcome is explained the lower the measurement
error (Hari et al., 2010).

92
In the SEM analysis, it is important to make a distinction between independent and
dependent constructs. Slightly different terminology is applied since the concept calls for
predicting latent constructs with other latent constructs. Like independent variable, exogenous
latent constructs are defined outside of the paradigm. On the other hand, endogenous latent
constructs are identical to non-independent variables and are theoretically determined by
variables within the model. Visually, in a path diagram, the dependent relation is depicted by
anarrow from an exogenous construct to endogenous constructs or from one endogenous
construct to another, but not from endogenous construct to exogenous construct.
Furthermore, following suggestion of Hari et al. (2010), the thesis defines a model as
representation of a theory, where theory is defined as a collection of relationships that offer a
broad and coherent explanation of phenomena. Theory is not only limited to academic domain
but also can be derived from practical experience gathered by observation of the real-world
behavior. The thesis uses two underlying theories, sustainability and brand equity, as the basis
for the model. The sustainability and brand equity model together consist of seven constructs
as shown earlier in Figure 2.7., page 47. In the visual format, the diagram that portrays the
relationships between constructs is called path diagram.
Strong theoretical basis for detailed description of both measurement and structural model
are prerequisite for any SEM analysis. The fundamental role of the SEM theory is outlined as:
(1) Definition of model relationships.
(2) In case of cross-sectional data, it is important to show causation.
(3) Formation of the modeling strategy.
Also, it is important to notice that two types of structural relationships exist between latent
constructs in the structural model: dependence and correlation (covariance) relationship. The
simple dependence relationship between exogenous and endogenous constructs is denoted as
straight arrow pointing from independent (exogenous) variable to dependent (endogenous)
variable. In the structural relationship no paths are coming into the independent construct which
has only correlational relationship with other constructs (Hari et al., 2010).
After confirming the model-fit using CFA and, validity and reliability of the model the
next step is to confirm the hypothesized relations between the model components. For that
purpose, the structural equation modelling (SEM) method or path analysis is conducted in
AMOS software package. The SEM analysis of the data must meet the criteria outlined in the
Table 6.1., page 108. Next, all paths must be significant for p values below 0.01 and 0.05.
Also, in the SEM analysis the correlations factors are the same as regression weights, which are
used to prove causality (Hari et al., 2010).
To confirm the H1 and H2 hypotheses, the higher-order factors are used to establish the
existence of the common variables that significantly explain low-order variables as presented
in the work of Konecnik & Gartner (2007). In the proposed model, sustainability and brand
equity constructs are defined as higher order unobservable variables or latent factors. The
sustainability construct is a high-order exogenous construct of economic, social and
environmental low order factors, while brand equity is a high-order construct of image,
awareness, quality and loyalty factors. Since the higher-order factor is considered a latent

93
variable (endogenous), therefore, all variables that a second-order variable represents must
include error terms in the path diagram.
5.5. Structural Equation Modeling Process
Because of its appealing way to test theory, SEM has become an attractive multivariate
technique among the researchers. If a theory can be expressed as a set of relationships between
observable variables and latent factors or constructs, then it will be possible to use SEM to
evaluate how well the theory matches the reality as described by data. The diagram in Figure
5.1., p. 94, shows five subsequent stages of the SEM process as follows:
Stage 1: Defining individual constructs
Stage 2: Developing and specifying the measurement model
Stage 3: Testing for reliability and validity
Stage 4: Defining the structural model
Stage 5: Assessing structural model validity
5.6. Stage 1: Defining Individual Constructs
Testing hypotheses that include structural relationships between the constructs are as
reliable as the measurement model that defines how these constructs are created. Thus, a
reliable and valid measurement model is a prerequisite for obtaining useful results from SEM.
Therefore, the process how the measurement items are selected to define each construct is the
bases for the entire SEM analysis.
The process of construct operationalization requires that corresponding theoretical
framework of the constructs are well defined. The operationalization of the constructs requires
defining measurement scale items and scale types of each construct. In the global scenario,
different scales of measurement, used in prior research, are used depending on the type of global
indicators. In the case of Serbia scenario, 11-point Likert scale developed specifically for this
research is used as suggested by Netemeyer, Bearden, & Sharma (2003). This is acceptable
since there is no prior history of the previous research on Serbia.
Finally, an extensive pre-testing procedure should be applied to screen items for
appropriateness. In this study, scales are used in the contexts, therefore, pretesting is an
important process of getting the research in the right direction from the beginning. The
importance of the pre-testing is to show items that behave statistically and eliminate items that
do not. Therefore, pretest results are empirically tested to avoid the problems when the final
model is analyzed per guideline of Hair et al. (2010).
Once scales are defined, data is collected, exploratory factor analysis (EFA) in SPSS is
applied on data to determine the number of underlying constructs and corresponding
measurement variables.

94
Stage 1
Stage 2
Stage 3
Stage 4
Stage 5
Figure 5.1. Structural Equation Modelling Process (Hair et al., 2010)
Is Measurement Model Valid?
Proceed with structural
model analysis Yes
Defining Individual Constructs (EFA) What items are to be used as measured variables? (SPSS)
Developing and Specifying Measurement Model (CFA) Connecting measured variables with constructs
Drawing a path diagram of measurement model (AMOS)
Testing for Reliability and Validity Verifying Goodness-of-Fit threshold values (AMOS)
No Refine measures or
design a new study
Defining Structural Model Converting measurement model to structural
model (AMOS)
Assessing Structural Model Validity (AMOS) Asses for GOF, significance size, and direction
of structural parameters estimates
Is Structural Model Valid?
Draw substantive
conclusions and
recommendations
No Refine model and test
with new data Yes

95
Exploratory Factor Analysis (EFA) is a model-based technique which gives us the
knowledge about population. The EFA is using techniques such as statistical significance,
precision of estimation and goodness-of-fit. It provides us with means to link the observable
variables to the unobservable ones.
To measure latent variables, it is necessary to collect several observable variables which
we feel are associated and likely to be indicators of latent variables. To find a set of
corresponding observable variables it is necessary to consider some intuitive understanding of
the latent variable for which we are interested in. If the survey is large in scope with the number
of indicators exceeding 30 or more survey questions, it may be a good idea to reduce the number
of indicators or observable variables to a more manageable size for analysis without important
information loss (Bartholomew et al., 2008). In this thesis, we start with analysis of the
predefined set of latent variables and look to name observable variables or indicators that are
closely associated with the corresponding latent variables. Also, in this thesis, we use
interchangeably observable variables, measures and indicators to refer to measured variables.
The characteristic that differ EFA from other multivariate tools is that factors are obtained
from the statistical outcome not the theory. This means that underlying pattern of the dataset
defines the structure of the latent variables. Therefore, EFA is performed without any prior
knowledge about the number of latent variables and the prior relationship between observable
variables and associated latent variables. Consequently, the number of variables and their
distribution among factors is determined by EFA analysis conducted by a software package.
This thesis uses SPSS version 21. Therefore, the resulting factors can only be named after the
EFA is performed (Hair et al., 2010).
The essence of the factor analysis is to supply information about latent variables provided
that the observable variables are known, using regression type relationship. Consequently, the
knowledge about latent variables can be obtained only indirectly. The assumption here is that
a latent variable is associated to several observed variables which depend on it, causing a
correlation between them. The correlation between indicators is considered as a common
source of influence. In EFA, all measured indicators or variables are related to every factor by
factor loading estimate. The desirable outcome is when each observable variable loads highly
on only one factor and has smaller loadings (i.e. under 0.4) on other factors (Hair et al., 2010).
The importance of the latent variable analysis is to find out if the correlations between the
observed variables can be explained by a reduced number of latent variables. Therefore, latent
variable models can be used in exploratory or confirmatory analysis. The exploratory analysis
is used to find underlying (reduced) set of items for latent variables. On the other hand, the
confirmatory analysis or measurement model analysis, which will be explained later in the text,
is used to measure if the proposed concept is consistent with the estimated one (Bartholomew
et al., 2008).
In this thesis the EFA is conducted in SPSS, version 21, on the proposed dataset. Prior
to EFA the Cronbach Alpha is calculated. After selecting the extraction and rotation method,
number of iterations, and the criterion of eigenvalue-greater-than-one, data is outlined in the
pattern matrix (Bartholomew et al., 2008). After confirming the Kaiser-Meyer-Olkin (KMO)
and Bartlett’s Test of Sphericity, data is analyzed in the pattern matrix for further reduction.
The correlation matrix is evaluated for values between 0.3 and 0.7 and the possibility to repeat
96
the EFA with different extraction and rotation options depending if data is oblique (correlated)
or orthogonal (uncorrelated).
Next, the number of individual variables is reduced and grouped into the factors by
dropping items with multicollinearity and standardized loadings under 0.5. The value of the
average standardized loadings per latent variable is preferable above 0.7. The recommended
number of variables per factors is between 3 and 5, however, 2 variables per factor are
acceptable which depends on the structure of factors and availability of data (Kenny, 2016).
The sums of the square loadings should preferable be over 50% to capture the sufficient amount
of the information from the original dataset (Hair et al., 2010).
5.7. Stage 2: Developing and Specifying Measurement Model
In this stage, the measurement model is defined based on the specified scale items. First,
each latent variables of the model are identified. Second, observable (measured) indicator
variables must be ascribed to latent constructs. AMOS offers convenient graphical way to
represent the relationships of the diagram. It is important to label symbols for constructs,
indicators and relationships among them. To make the process of defining the measurement
model easy to structure the following issue must be addressed:
1) Theoretical bases for the relationship between construct and indicators must be
established, in addition to the empirical support for constructs’ unidimensionality and validity.
2) Minimum and maximum number of indicators for each construct
3) Should indicators describe or explain the construct. Latter suggests considering
construct as an indicator.
The research effort in evaluating the measurement model must test the reliability and
validity. As a part of the scale development effort several indicators and the type of constructs
must be addressed. The thesis utilizes confirmatory factor analysis (CFA) to define
measurement model of goodness-of-fit analysis.
Confirmatory Factor Analysis (CFA) is a multivariate technique to determine how well
measured variables represent a smaller number of latent variables. In this thesis CFA and
measurement model analysis are used interchangeably. Unlike EFA, where predetermined
guidelines are used to determine proper number of variables and which variables load on a
specific factor, with CFA the number of latent variables and the set of corresponding indicators
for each latent variable are determined by a researcher. Therefore, in CFA, statistical functions
are not intended to assign indicators to factors. Instead the researcher, based on the adopted
theory, makes the association between variables and factors before any results can be produced.
Also, an observable variable or indicator is assigned to only a single latent variable, without
any cross-loading (loadings on multiple single factors) associations.
CFA is a way to confirm and test the strength of compliance between prespecified latent
variable constructs including factor loadings of real data and a-priori theoretical model of factor
loadings. Thus, CFA statistics shows how well our theoretical assumptions of the factors
correspond to reality. Therefore, CFA can be considered as a tool that either confirms or rejects
our predisposed theory (Hair et al., 2010).
This thesis uses CFA to confirm and test the proposed measurement theory. In other
words, measurement theory outlines how well observable variables systematically and logically

97
form the relationships among constructs in the proposed theoretical model. Furthermore,
measurement theory analyzes a set of relationships between the observable variables and
corresponding latent constructs which are not directly measured. Therefore, measurement
models are further used with structural theory to fully specify the SEM model.
Next, constructs in measurement theory must first be determined. Unlike EFA, in CFA a
researcher uses a predefined set of observable variables and latent constructs. A predefined set
of relations is applied between the observed and latent variables, a process that is known as
operationalization of the measurement model.
The CFA analysis produces five elements: latent variables, observable variables, loadings
between constructs, the relationships among constructs, and error terms for each indictor. The
latent variables are presented in diagrams as ellipses while observable variables are presented
by rectangles. Two headed curved arrows are used to depict correlational relationships between
latent variables, suggesting that all latent constructs are exogenous. The relationships between
respective observable variables and latent variables (called factor loadings) are shown by arrows
from the construct to the observable or measured variable. Since a latent variable doesn’t fully
explain the measured variable, error terms are added to measured variables (Hair et al., 2010).
5.8. Stage 3: Testing for Reliability and Validity
After reducing number of variables in EFA, by determining the number of factors and
their individual structure, the confirmatory factor analysis (CFA) is conducted in AMOS
software package, version 23. to determine the model fit between the proposed and estimated
model. The benchmark analysis, based on the criteria outline in Table 5.1., p. 98, is used to
confirm the model fit.
The next stage is assessment of the measurement model reliability and validity. As the
measurement model is correctly defined, an empirical evaluation of the relations between
variables and constructs as suggested by the measurement theory is tested. The reality
presented by the empirical sample data is compared to the theory. In short, the validity of the
model shows how well theory fits the data.
To compare the theory against the reality as given by the collected data sample the
reliability and validity of the measurement model must be established (Kenny, 2016). Put
differently, we need to see how strongly theory fits the data. After the measurement model is
finalized and specified, an empirical measure of the associations between indicators and latent
variables or constructs are outlined by the measurement theory.
Assessing Fit. The results of the CFA allow as to test and verify whether a covariance
matrix of the measured data is represented sufficiently by the covariance matrix based on the
theory. The fit analysis compares the two covariance matrices.
Path Estimates. Analyzing path estimates involves evaluating links between latent
variables to indicator variables. The rule of thumb suggest that loadings are acceptable for
values 0.5 or higher. Loadings that are meeting the criteria suggest strong associations of
indicators to their related constructs and show construct validity. These guidelines can be
explained similarly to differences between correlation and covariance since, in both cases, they
are related to the standardized loading estimates. The standardized loading estimates cut
distortions of the different scales of the measures.
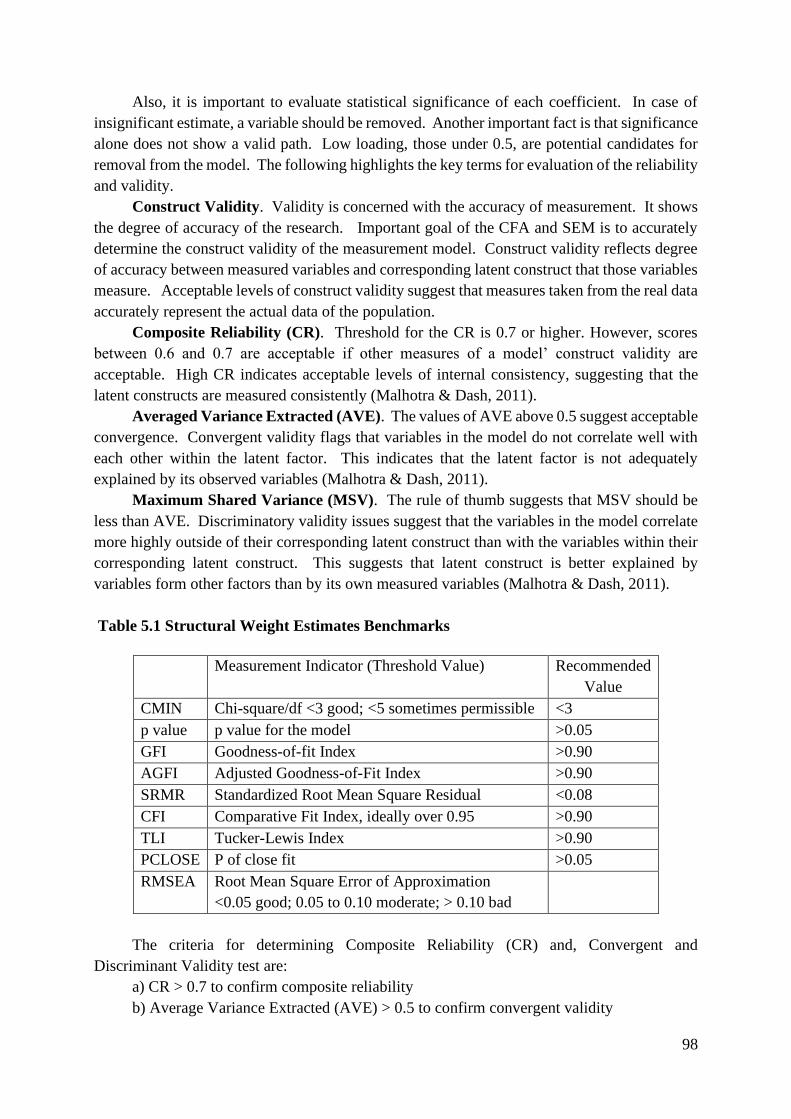
98
Also, it is important to evaluate statistical significance of each coefficient. In case of
insignificant estimate, a variable should be removed. Another important fact is that significance
alone does not show a valid path. Low loading, those under 0.5, are potential candidates for
removal from the model. The following highlights the key terms for evaluation of the reliability
and validity.
Construct Validity. Validity is concerned with the accuracy of measurement. It shows
the degree of accuracy of the research. Important goal of the CFA and SEM is to accurately
determine the construct validity of the measurement model. Construct validity reflects degree
of accuracy between measured variables and corresponding latent construct that those variables
measure. Acceptable levels of construct validity suggest that measures taken from the real data
accurately represent the actual data of the population.
Composite Reliability (CR). Threshold for the CR is 0.7 or higher. However, scores
between 0.6 and 0.7 are acceptable if other measures of a model’ construct validity are
acceptable. High CR indicates acceptable levels of internal consistency, suggesting that the
latent constructs are measured consistently (Malhotra & Dash, 2011).
Averaged Variance Extracted (AVE). The values of AVE above 0.5 suggest acceptable
convergence. Convergent validity flags that variables in the model do not correlate well with
each other within the latent factor. This indicates that the latent factor is not adequately
explained by its observed variables (Malhotra & Dash, 2011).
Maximum Shared Variance (MSV). The rule of thumb suggests that MSV should be
less than AVE. Discriminatory validity issues suggest that the variables in the model correlate
more highly outside of their corresponding latent construct than with the variables within their
corresponding latent construct. This suggests that latent construct is better explained by
variables form other factors than by its own measured variables (Malhotra & Dash, 2011).
Table 5.1 Structural Weight Estimates Benchmarks
Measurement Indicator (Threshold Value) Recommended
Value
CMIN Chi-square/df <3 good; <5 sometimes permissible <3
p value p value for the model >0.05
GFI Goodness-of-fit Index >0.90
AGFI Adjusted Goodness-of-Fit Index >0.90
SRMR Standardized Root Mean Square Residual <0.08
CFI Comparative Fit Index, ideally over 0.95 >0.90
TLI Tucker-Lewis Index >0.90
PCLOSE P of close fit >0.05
RMSEA Root Mean Square Error of Approximation
<0.05 good; 0.05 to 0.10 moderate; > 0.10 bad
The criteria for determining Composite Reliability (CR) and, Convergent and
Discriminant Validity test are:
a) CR > 0.7 to confirm composite reliability
b) Average Variance Extracted (AVE) > 0.5 to confirm convergent validity

99
c) MSV < AVE, and ASV < AVE to confirm discriminant validity
Where MSV is Maximum Shared Variance, and ASV is Average Shared Variance
Absolute Fit Indices. Is a measure of how well the model outlined by researcher fits the
observed data. They provide the most fundamental evaluation of how well a researcher’s theory
fits the data.
Chi-square (χ2) is the only statistically based fit measure. It is difference between
observed and estimated covariance matrices. If the observed model is identical with the
estimated model the χ2 equals zero showing perfect model fit. It depends on the sample size.
Degrees of Freedom (DF) represents mathematical observation that doesn’t depend on
the sample size. It is a sum of the elements below the diagonal in the correlational matrix and
the variances on the diagonal indicating the total number of covariances terms in the matrix. It
depends on the size of the covariance matrix, hence, the number of constructs (Hair et al., 2010).
Normed Chi-Square (CMIN) represents the ratio between χ2 and the degrees of freedom
of the model. Preferably, the ratio should be less than 3 and lower to be associated with a good
fit of the model. It is sensitive to the sample size and can be calculated from the model’s data.
Goodness-of-Fit Index (GFI). GFI is non-statistical test to examine fit statistics. It is
sensitive to sample size. Estimated range of GFI is 0 to 1, with the values closer to 1 indicating
better fit.
Root Mean Square Error of Approximation (RMSEA). Most commonly used
indicator introduced to counter the χ2inclination to reject models with a large number of
observable variables and sample size. Lower RMSEA values indicate better fit.
Standardized Root Mean Residual (SRMR). Is used for comparing fit across models.
Lower SRMR values indicate better fit while higher values represent worse fit. SRMR is often
called the badness-of-fit since the high values indicate poor fit.
Tucker Lewis Index (TLI). TLI is a comparison of the normed chi-square values
between the null and the specified model. Higher values suggest a better fit than the models
with lower values.
Comparative Fit Index (CFI). It is moderately sensitive to model complexity. The
value over 0.9 indicates good model fit. The index is normed, so its values fall in the range
between 0 and 1.
Parsimony Fit Indices measure which model in the competing set of models provide the
best fit based on complexity. Less complicated models or better fit improves the value of the
index. It provides a useful information in analyzing competing models.
Adjusted Goodness of Fit Index (AGFI). The index takes into account differing degrees
of model complexity. The index favors simpler modes and penalizes the complex ones. Its
values a usually lower than GFI values. AGFI is not associated with any statistical test. It is
affected by sample size and model complexity.
P of Close Fit (PCLOSE). In the close-fitting model with RAMSEA greater than 0.05,
PCLOSE is a one side test of the null hypothesis. So, if the p is greater than 0.05 (i.e. not
statistically significant) it suggests that the model fit is close. If the p is less than 0.05, it is
assumed that the fit of model is worse than close fitting (i.e. the RAMSEA is greater than 0.05).

100
It is critical to sample size and the degrees of freedom. With less degrees of freedom, the less
power in the test.
5.9. Stage 4: Defining Structural Model
After confirming the goodness-of-fit using CFA, validity and reliability of the model the
next step is to confirm the hypothesized relations between the model components. For that
purpose, the structural equation modelling (SEM) method or path analysis is conducted in
AMOS software package. The SEM analysis of the data must meet the criteria outlined in the
Table 5.1, page 98. Next, all paths must be significant for p values below 0.01 and 0.05.
When there is a high correlation between the first-order constructs, there is a possibility
of creating a second-order construct or a common variable that significantly explains low-order
variables (Konecnik & Gartner, 2007; Iniesta-Bonillo et al., 2016). The second-order factor is
considered as predictor or exogenous latent variable. Consequently, all the variables that
second-order variable represents must include error variables. Also, in the SEM analysis the
correlations factors between exogenous constructs are the same as regression weights, which
are used to prove causality (Hair et al., 2010).
In the previous stage, measurement model is specified by assigning indicator variables to
the constructs they should defined. In this stage, the structural model is defined by specifying
hypothesized relationships among the constructs based on the proposed theoretical model. The
relationships between the constructs represent hypotheses of the adopted model. In this thesis,
that would be 14 hypothesized relationships between sustainability constructs and destination
brand equity constructs. The next section will describe how defining a measurement model is
a critical step in developing a SEM model.
5.10. Stage 5: Assessing Structural Model Validity
In the final stage, validity of the structural model and its corresponding hypothesized
theoretical relationships are tested for validity. Prerequisite for the validity test is the successful
evaluation of the reliability and validity in the measurement model. If that is not the case, the
analysis should be terminated at Stage 3. Without acceptable fit of the measurement model, the
fit will not improve in the structural model.
There are differences in evaluating the fit of a measurement model and structural model.
In the measurement model all constructs are assumed to be correlated to one another. However,
in the structural model the relationships between some constructs could be zero. This means
that structural model in most cases holds fewer relationships among constructs since not every
construct will be hypothesized to have a direct relationship with every other construct. In that
regard, a measurement model is less constrained than a structural model because more
relationships in the structural model are set to zero and excluded from estimation.
Consequently, the χ2 goodness-of-fit of the measurement model will be less than χ2
goodness-of-fit for the structural model. Overall, the closer the structural model goodness-of-
fit approaches the measurement model, the better the structural model goodness-of-fit. The
reason is that measurement goodness-of-fit is the upper limit to the goodness-of-fit of a
conventional structural model.

101
Structural model can be assumed to be a measurement model with added constraints. This
is because structural model usually evaluates less relationships than measurement model, since
not all relationships are hypothesized. As mentioned earlier, measurement model assumes that
all constructs are related to all other constructs. Adding a constraint cannot reduce the chi
square value. In other words, relaxing the constraint by introducing a relationship in the model
should reduce the chi-square value or at least keep it unchanged (Hair et al., 2010).
So, removing or adding a path changes the degree of freedom since adding path means
reducing while removing path means adding constraint. So, adding one constraint means that
chi-square difference test will have one more degree of freedom. Adding two means that test
will have two degrees of freedom and so on.
It is important to mention that structural model is regarded acceptable if it is significant
in a predicted direction and has acceptable model fit. The rules of thumb for the structural
model validity are similar to findings in Table 5.1., p. 98, however, there are some differences:
a) For complex models, the chances of alternative models with equivalent fit increases.
b) Multiple fit indicators should be used to evaluate goodness-of-fit:
- The χ2 and degree-of-freedom (df)
- One absolute fit index (GFI, RMSEA, or SRMR)
- One incremental fit index (CFI or TLI)
- One goodness-of-fit index (GFI, CFI, TLI, etc.)
- One badness-of-fit index (RMSEA, SRMR, etc.)
c) It is not practical to apply single set of cutoff rules to all measurement and SEM models.
d) The quality of fit depends on model characteristics, complexity and size.
e) Simple models with small samples should comply to strict fit thresholds
f) Complex models with larges samples should have more relaxed standards. With large
number of variables, cutoff values of 0.95 on major measures are unrealistic (Hair et al., 2010).
In general, the assessment of the goodness-of-fit of the structural model uses the same criteria
to those used in the measurement model. These measurements institute the validity of the
structural model. However, the comparison with the measurement model should also be made
to establish the overall fit. Since measurement model establishes an upper limit to the
goodness-of-fit of a structural model, the closer the structural model goodness-of-fit comes to
the measurement model, the better the structural model fit (Hair et al., 2010).
102
6. GLOBAL DESTINATION CASE
This chapter formally confirms the constructs of the model, causal relations and the
hypotheses using the global data. The chapter introduces a multivariate analysis of the global
data represented by a set of proxy global indicators. Also, the chapter presents the formation
of the research instrument and data analysis. Research findings are presented with the analysis
of three scenarios involving predictor variables.
Based on the proposed stages in the diagram in Figure 6.1., p. 104, in the first part, the
model based on the global data are explained and operationalized for the analysis. Next the
EFA is performed in SPSS to test how the data meets the theory. EFA reduces the number of
observable variables to a set of factors or latent variables of the proposed model. Each extracted
factor is identified with explanation of the corresponding observable variables.
In the next step, the proposed model is analyzed in AMOS software for goodness-of-fit
using measurement model statistics to verify that the proposed theoretical concept meets the
data. After the measurement model is confirmed, the SEM analysis is conducted to evaluate
the hypothesized relations between the elements of the model.
Finally, the chapter establishes composite reliability, convergent and discriminant
validity of the proposed model based on the proposed guideline in section 5.10, p. 100.
6.1. Global Case
To prove universality, generality and multi-adaptability of the proposed model the thesis
uses data from the 199 countries and sovereignties obtained from 19 multi-national global
databases. The initial research instrument is comprised of proxy indicators that are believed to
match the seven elements of the proposed model.
The EFA analysis in SPSS further reduced the number of indicators producing seven
factors that closely match the elements of the proposed model. The CFA is conducted to
confirm the elements of the proposed model while SEM analysis is conducted to confirm the
hypothesized relations between the elements of the proposed model.
For the exploratory multivariate analysis of the global data the analysis is conducted in
three stages using SPSS and AMOS software. In Table 6.1 data is checked for normality,
outliers, and missing data issues. Finally, composite reliability, convergent and discriminatory
validity of the model will be confirmed.
6.2. Scale Development: Operationalization of the Model
The focus of the scale development is on the selection of global indicators that are
associated to the composing dimensions of the proposed model. The model’s dimensions are
divided into two domains: destination sustainability and destination brand equity. The former
is represented by the social, economic, and environmental constructs while the latter is formed
from destination awareness, image, quality and loyalty elements.
Using different measurement scales the destination economic dimension is
operationalized using nine-item scale of global proxy variables or global indicators from three
global databases. The analysis uses the two sets of global economic indicators. In the first set,
variables are related to the number of foreign arrivals, expenditure, and overnights, while in the

103
second set, the focus is on the different economic ratios. Those ratios are tourists’ expenditure
over exports and GDP, tourism coverage of inbound over outbound expenditure, economic
wellbeing, and the number of international meetings (Table 6.1., page 105). The economic
variable items in the research instrument are formulated based on the earlier research literature
(Iniesta-Bonillo et al., 2016).
Destination social dimension is operationalized by thirteen-item scale on various
measurement criteria from eight different global databases. Since it is difficult to directly
measure the social variables such as trust, power, benefits and costs, the survey adopts the
metrics of social wellbeing, world corruption index, talent, national IQ, world happiness, safety,
health care, and indicators related to the usage of internet (Table 6.1., page 105). Also, on-line
based social networks have significant influence on the social aspects related to tourism
(Gössling, 2016; BBMG, 2016).
Destination environmental dimension is operationalized using twelve-item scale or global
indicators from six different global databases or research institutions supported by the earlier
research (Buckley, 2012; Iniesta-Bonillo et al., 2016). The variables are operationalized using
different measurement scale. The environment sustainability is the original area of focus by the
research community. It relates to the natural capital and, state of the renewable and non-
renewable resources. In this thesis they are operationalized as the impact that pollution,
protection of territories, environmental wellbeing, environmental awareness, improved water
sources have on the environmental dimension of the proposed model, Table 6.1., page 105.
Awareness of a country as a destination is particularly difficult to measure. The four-
item scale is supported by awareness, attractiveness, effectiveness of marketing and google-
trend-search indicators. The research instrument indicators, attractiveness and awareness, are
formulated using Image Travel database, which shows awareness and attractiveness of
countries as tourism destinations from the Nordic tourists’ point of view. The third indicator is
defined by using metrics of the effectiveness of marketing and the number of times a country
comes up while searching the internet (Google Trend). The latter is obtained by using Google
Trend application. These four global indicators are collected from three different databases of
different measurement scale (Table 6.1., page 108). Aaker (1996) suggests that the top-of-mind
awareness is difficult to measure when a visitor has already got experience with a destination
(Konecnik & Gartner, 2007; Boo et al., 2009; Pike et al., 2010).
Destination image is operationalized using seventeen-item scale consisting of proxy
variables or global indicators from four global databases of different metric scale. The list of
image items is deduced from the previous tourism research literature (Konecnik & Gartner,
2007; Pike et al., 2010; Boo et al., 2009). The proxies are represented by travel image,
competitiveness, country brands, adventurousness, heritage and culture, Table 6.1., page 108.
The indicators are selected to stand for the motive or emotional attachment tourists have towards
a destination.
The conceptualization of the destination quality is formulated using twenty-one items
from four different databases, all operationalized in different measurement scales. The tourism
literature-based items are selected to capture the quality of service, superiority and performance
(Konecnik & Gartner, 2007; Pike et al., 2010; Boo et al., 2009). The thesis supports destination
quality through the set of global indicators such as quality of country index, effectiveness,

104
infrastructure, quality of life, purchasing power, traffic commute time, property price to income
ratio, infrastructure, and priority of travel and tourism, Table 6.1., page 105.
Finally, destination loyalty is particularly difficult to measure using global indicators.
The concepts of preference, emotional attachment, recommendation, paying premium and
revisiting are not sufficiently covered at the global level. Therefore, destination loyalty is
conceptualized using five proxy indicators of different measurement scale from four different
global databases. As a result, the thesis uses indicators that relate to the country brand and
country index to show preference and attachment, Table 6.1., page 105. The indicators are
based on the earlier tourism literature assessments of the destination brand loyalty (Konecnik
& Gartner, 2007; Pike et al., 2010; Boo et al., 2009).
Figure 6.1. Scale Development Global Case
Destination
Sustainability
Arrivals
Expenditure
Int.’ l Meetings Cost of Living
Property Price to Income
Other
ECONOMIC
Exponential Pollution Ind.
Pollution Index Environmental Wellbeing
Environmental Perf. Index
Protected Territories Improved Water Source
Others
ENVIRONMENTAL
Effectiveness of Marketing
Google Trend Awareness Awareness Index
Attractiveness Index
O|ther
AWARENESS
Heritage Cultural Influence
Adventurous Index
Country Brand Strategy Travel Image
T&T Competitiveness Index
Global Competitiveness Digital Competitiveness
Other
IMAGE
Quality of Tourism Infrastructure
Staff Training Quality of Nationality Index
Quality of Roads
Quality of Life Prioritization of T&T
Purchasing Power Index
Other
QUALITY
Country Index Nations Brand
Country Brand Index
Other
LOYALTY
Destination
Brand Equity
Social Wellbeing National IQ
Gov. Effectiveness
World Happiness World Talent
World Corruption Index
Individuals Using Internet Mobile Phone Sub.
Int’l Openness
Health Care Index
Safety Index
Other
SOCIAL
Economic
Sustainability
Environmental
Sustainability
Social
Sustainability
Destination
Awareness
Destination
Loyalty
Destination
Quality
Destination
Image
IMPACT

105
6.3. Research Instrument
Indicators in the research instrument are related to the dimensions of the proposed model
and are of different metrics. The research instrument consists of 77 quantitative indicators
extracted form 19 global databases. Indicators are of different statistical, empirical or
measurement type.
The original number of countries used in the analysis is 199 with the 38% of the missing
data. The preparation for the EFA reduced the number of empty fields to 15% and the number
of countries to 124 which is justified by Hair et al., (2010). The EFA further reduced the number
of variables (indicators) to 31, and the number of empty fields to 15%, which is considered
acceptable for further analysis as justified by Hair et al., (2010). The missing fields are filled
out by the corresponding means. Also, data are checked for outliers by analyzing the maximum
and minimum values (Hair et al., 2010). Furthermore, there are 25 indicators with the number
of countries under 100, see Table 6.1. All indicators from the World Economic Forum while
The Travel & Tourism Competitiveness Index come from the Crotti & Misrahi’s, (2017) report,
however, individual indicators in the report have different dates of origin.
Normality of the data in the research instrument are evaluated by mean, median, skewness
and kurtosis. Total of five indicators are removed because of kurtosis and skewness issues,
further reducing the number of indicators to 77.
Table 6.1. Global Research Instrument
Item Data Source # of C
Social Sustainability
Social Wellbeing SSI 2017 151
World Corruption Index Transparency Int’l 2018 187
World Talent IMD 2017 61
National IQ Intelligence 2012 137
World Happiness WHR 2018 149
Safety Index Numbeo 2018 70
Health Care Index Numbeo 2018 70
Individuals Using Internet Crotti & Misrahi 2017 136
Fixed Broadband Subscription Crotti & Misrahi 2017 133
Government Effectiveness Index World Bank 2017 187
Mobile Phone Subscription Crotti & Misrahi 2017 136
Environmental Sustainability
Environmental Performance Index Yale University 2018 171
Environmental Wellbeing SSI 2017 151
Protected Territories Crotti & Misrahi 2017 176
Drinking Water Crotti & Misrahi 2017 86
Environmental Awareness Crotti & Misrahi 2017 82
Pollution Index Numbeo 2018 98
Exponential Pollution Index Numbeo 2018 98
Improved Water Source Crotti & Misrahi 2017 175
Per Capita Fossil Fuel Emission Rates Crotti & Misrahi 2017 179
Natural & Cultural Resources Sub-index Crotti & Misrahi 2017 136

106
Environmental Democracy Index WRI 2018 70
Climate Index CCPI 2018 70
Economic Sustainability
Inbound Overnight Int’l Tourist Arrivals UNWTO 2015-2017 167
Int’l Tourist Overnights UNWTO 2015-2017 135
Inbound Int’l Tourist Expenditure UNWTO 2015-2017 148
Int’l Tourist Expenditure over EGS UNWTO 2015-2017 146
Inbound Tourism Expenditure over GDP| UNWTO 2015-2017 113
Tourism Coverage Inbound over Outbound UNWTO 2015-2017 150
Total Travel & Tourism Contribution to GDP (a) UNWTO 2015-2017 123
Economic Wellbeing Index SSI 2017 151
Number of International Assoc. Meetings Crotti & Misrahi 2017 122
Destination Awareness
Awareness Index Image Travel 2015 96
Attractiveness Index Image Travel 2015 96
Google Trend (a) Google Trends 2018 199
Effectiveness of Marketing Crotti & Misrahi 2017 136
Destination Image
Travel Image Image Travel 2015 96
TT&T Competitiveness Index Crotti & Misrahi 2017 136
The Global Competitiveness Report Crotti & Misrahi 2017 139
Digital Competitiveness IMD 2018 141
Country Brand Strategy Crotti & Misrahi 2017 136
Country Brand Rankings Crotti & Misrahi 2017 168
Number of World Heritage Natural Sites (a) Crotti & Misrahi 2017 73
Natural Tourism Digital Demand Crotti & Misrahi 2017 136
Attractiveness of Natural Assets Crotti & Misrahi 2017 136
Number of World Heritage Cultural Sites Crotti & Misrahi 2017 111
Oral and Intangible Cultural Heritage Crotti & Misrahi 2017 91
Sports Stadiums Crotti & Misrahi 2017 94
Cultural & Entertainment Tourism DD (a) Crotti & Misrahi 2017 117
Adventurous U.S. News 2018 80
Cultural Influence U.S. News 2018 80
Heritage U.S. News 2018 80
Destination Quality
Quality of Tourism Infrastructure Crotti & Misrahi 2017 136
Number of Operating Airlines Crotti & Misrahi 2017 134
Quality of Roads Crotti & Misrahi 2017 136
Global Infrastructure Quality Statista 2018 100
Staff Training Crotti & Misrahi 2017 136
Internet Use for B2B Crotti & Misrahi 2017 136
Purchasing Power Parity Crotti & Misrahi 2017 136
Sustainability of T&T Industry Crotti & Misrahi 2017 136
Quality of Air Transport Crotti & Misrahi 2017 136
Airport Density Crotti & Misrahi 2017 106

107
Prioritization of T&T Crotti & Misrahi 2017 136
Airport Charges and Taxes Crotti & Misrahi 2017 135
Hotel Price Index Crotti & Misrahi 2017 101
Ground Transport Efficiency Crotti & Misrahi 2017 136
Hotel Rooms Number Crotti & Misrahi 2017 115
Tourist Service Infrastructure Crotti & Misrahi 2017 136
Quality of Life Numbeo 2018 70
Purchasing Power Index Numbeo 2018 70
Price Competitiveness Crotti & Misrahi 2017 136
Traffic Commute Time Index Numbeo 2018 70
Quality of National Index Henley & Partners 175
Destination Loyalty
Country Brand Index Crotti & Misrahi 2017 75
Nations Brand Brand Finance 2018 100
Country Index FutureBrand 2017 82
Cost of Living Index Numbeo 2018 70
C country; UNWTO The World Tourism Organization, CCPI Climate Change Performance Index; WRI World
Resource Institute; DD digital demand; SSI sustainable society index; GDP gross domestic product, EGS exports
of goods and services; IMD World Competitiveness Center; (a) removed for kurtosis and skewness issues.
6.4. Data Analysis
The original number of countries participating in the data collection process range from
61 to 199 per proxy indicators. After skewness and kurtosis analysis the maximum number of
participating countries was reduced to 187. The average number of responses are from 121
countries while the median number of responses is from 135 countries which shows light
skewness of the data to the right. The number of selecting indexes was originally 77, but was
reduced to 72 for skewness and kurtosis issues
Table 6.2. Descriptive Statistics
Item Mean SD SK KUR
Social Sustainability
Social Wellbeing 6 2 0 -1
World Corruption Index 58 27 0 -1
World Talent 63 16 0 -1
National IQ 85 11 0 -1
World Happiness 5 5 1 0
Safety Index 63 13 0 0
Health Care Index 66 10 0 -1
Individuals Using Internet 53 28 0 -1
Fixed Broadband Subscription 14 13 1 -1
Government Effectiveness Index 62 27 0 -1
Mobile Phone Subscription 117 35 0 1

108
Environmental Sustainability
Environmental Performance Index 57 13 0 -1
Environmental Wellbeing 5 2 0 -1
Protected Territories 12 12 1 1
Drinking Water 81 24 -1 1
Environmental Awareness 49 11 0 -1
Pollution Index 57 22 0 -1
Exponential Pollution Index 101 40 0 -1
Improved Water Source 89 14 -1 1
Per Capita Fossil Fuel Emission Rates (a) 1 1 2 3
Natural & Cultural Resources 3 1 1 1
Environmental Democracy Index 1 0 0 -1
Climate Index 77 15 -1 0
Economic Sustainability
Inbound Overnight Int’l Tourist Arrivals 3,376 4,562 2 2
Int’l Tourist Overnights 19,004 26,676 2 2
Inbound Int’l Tourist Expenditure 4,241 5,892 2 2
Int’l Tourist Expenditure over EGS 14 14 1 2
Inbound Tourism Expenditure over GDP| 6 5 1 1
Tourism Coverage Inbound over Outbound 224 215 2 2
Total Travel & Tourism Contribution to GDP (a) 14,880 19,207 2 4
Economic Wellbeing Index 4 2 0 0
Number of International Assoc. Meetings 70 91 2 2
Destination Awareness
Awareness Index 69 29 2 2
Attractiveness Index 214 71 -1 0
Google Trend (a) 7 12 4 20
Effectiveness of Marketing 4 4 1 0
Destination Image
Travel Image 269 82 0 0
TT&T Competitiveness Index 4 4 0 -1
The Global Competitiveness Report 60 13 0 -1
Digital Competitiveness 73 17 0 -1
Country Brand Strategy Ratings 72 13 -1 2
Country Brand Rankings 8 1 0 0
Number of World Heritage Natural Sites (a) 2 1 2 3
Natural Tourism Digital Demand 22 24 1 1
Attractiveness of Natural Assets 5 1 0 -1
Number of World Heritage Cultural Sites 5 4 1 2
Oral and Intangible Cultural Heritage 5 5 2 2
Sports Stadiums 7 5 1 0
Cultural & Entertainment Tourism DD (a) 12 12 2 3
Adventurous 3 2 1 0
Cultural Influence 2 2 1 1
Heritage 3 3 1 0

109
Destination Quality
Quality of Tourism Infrastructure 5 1 0 0
Number of Operating Airlines 44 37 2 2
Quality of Roads 4 1 0 -1
Global Infrastructure Quality 73 10 0 -1
Staff Training 5 5 1 0
Internet Use for B2B 5 5 1 0
Purchasing Power Parity 1 0 1 1
Sustainability of T&T Industry 4 1 0 0
Quality of Air Transport 4 1 0 0
Airport Density 1 1 2 2
Prioritization of T&T 4 1 0 0
Airport Charges and Taxes 70 20 -1 1
Hotel Price Index 126 43 1 1
Ground Transport Efficiency 4 1 0 -1
Hotel Rooms 1 1 1 1
Tourist Service Infrastructure 4 1 0 -1
Quality of Life 143 33 0 -1
Purchasing Power Index 72 30 0 -1
Price Competitiveness 5 1 0 0
Traffic Commute Time Index 35 7 0 0
Quality of National Index 41 35 1 0
Destination Loyalty
Country Brand Index 26 12 1 0
Nations Brand 76 13 0 1
Country Index 4 3 1 -1
Cost of Living Index 53 20 1 1
Property Price to Income Ratio (a) 13 11 3 10
SD Standard deviation; SK Skewness; KUR Kurtosis; (a) removed for kurtosis and skewness issue.
Hungary and Bulgaria are the only countries with no missing data while Cook Islands,
French Polynesia, Guadalupe and San Marino show 94% of the missing data. As mentioned
earlier, the countries with high number of missing data are removed. In comparison, Serbia has
only 6% of missing data, see Table 6.3.
Table 6.3. Missing Data
Countries % of Missing Data # of Countries
(Cumulative)
Bulgaria, Hungary 0% 2
Romania, Portugal Sweden,
Slovakia, Poland, Jordan, Israel and
mostly European countries
Under5% 34
India, Panama, Saudi Arabia, South
Africa, Japan, Mexico, Russia,
5 -10% 49
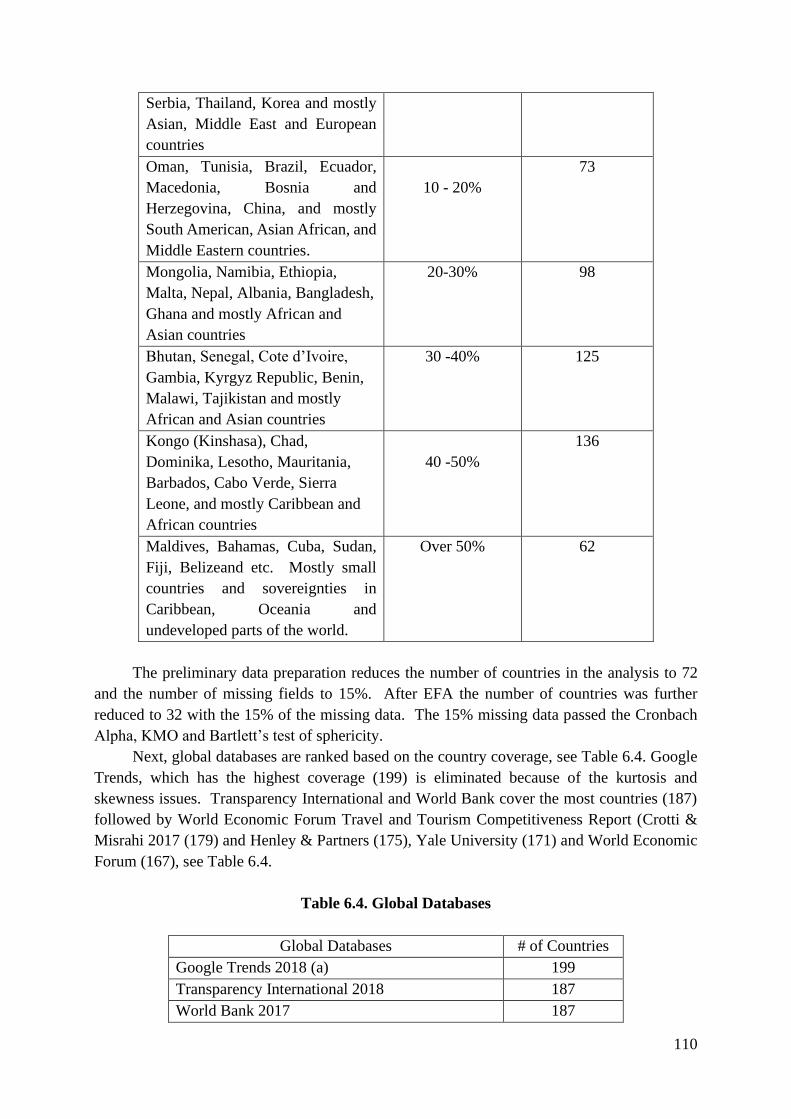
110
Serbia, Thailand, Korea and mostly
Asian, Middle East and European
countries
Oman, Tunisia, Brazil, Ecuador,
Macedonia, Bosnia and
Herzegovina, China, and mostly
South American, Asian African, and
Middle Eastern countries.
10 - 20%
73
Mongolia, Namibia, Ethiopia,
Malta, Nepal, Albania, Bangladesh,
Ghana and mostly African and
Asian countries
20-30% 98
Bhutan, Senegal, Cote d’Ivoire,
Gambia, Kyrgyz Republic, Benin,
Malawi, Tajikistan and mostly
African and Asian countries
30 -40% 125
Kongo (Kinshasa), Chad,
Dominika, Lesotho, Mauritania,
Barbados, Cabo Verde, Sierra
Leone, and mostly Caribbean and
African countries
40 -50%
136
Maldives, Bahamas, Cuba, Sudan,
Fiji, Belizeand etc. Mostly small
countries and sovereignties in
Caribbean, Oceania and
undeveloped parts of the world.
Over 50% 62
The preliminary data preparation reduces the number of countries in the analysis to 72
and the number of missing fields to 15%. After EFA the number of countries was further
reduced to 32 with the 15% of the missing data. The 15% missing data passed the Cronbach
Alpha, KMO and Bartlett’s test of sphericity.
Next, global databases are ranked based on the country coverage, see Table 6.4. Google
Trends, which has the highest coverage (199) is eliminated because of the kurtosis and
skewness issues. Transparency International and World Bank cover the most countries (187)
followed by World Economic Forum Travel and Tourism Competitiveness Report (Crotti &
Misrahi 2017 (179) and Henley & Partners (175), Yale University (171) and World Economic
Forum (167), see Table 6.4.
Table 6.4. Global Databases
Global Databases # of Countries
Google Trends 2018 (a) 199
Transparency International 2018 187
World Bank 2017 187

111
World Economic Forum, 2017 73-179
Henley & Partners 2017 175
Yale University 2018 171
Sustainable Society Index (SSI) 2017 151
World Happiness Report (WHR) 2018 149
IMD World Competitiveness Center 2017-2018 61-141
Intelligence 2012 137
Statista 2018 100
Brand Finance 2018 100
Numbeo 2018 98
Image Travel 2015 96
FutureBrand 2017 82
U.S. News 2018 80
World Resource Institute (WRI) 2018 70
Climate Change Performance Index (CCPI) 2018 70
(a) removed for skewness and kurtosis issues.
Original set of proxy indicators came from the total of 18 global databases. After
removing a Google Trend indicator, the corresponding database is also removed so the final
number of databases dropped to17. The number of countries covered by each indicator range
from as little as 61 (IMD) to as much as 187 (Transparency International and World Bank).
6.5. Exploratory Factor Analysis
Applying the exploratory factor analysis (EFA) provided by SPSS application version 21
and Principal Axis Factoring (PAF) method with Promax and Kaiser Normalization rotation
and eigenvalue greater-than-one criteria, resulted in extraction of 7 factors which accounted for
the total of 80% of the sum of square loading variances explained. The EFA reduced the
number of variables from the original 77 to 32, see Table 6.5. The extracted factors reflect the
elements of the proposed model. Factors in Table 6.5 are sorted by the percentage of variance
extracted (VE%).
Table 6.5. Measurement Model
Factors D N SL CA VE% CR AVE
Social Sustainability 12 0.91 45.71 0.95 0.87
Social Wellbeing (a) SO1 1.023
Individuals Using Internet (a) SO2 0.999
Improved Water Source(a) SO3 0.897
National IQ (a) SO4 0.882
Fixed Broadband Subscription (a) SO5 0.865
Env. Performance Index (a) SO6 0,855
Quality of National Index (a) SO7 0.778
Tourist Service Infrastructure (a) SO8 0.747
Gov. Effectiveness Index SO9 0.740
World Happiness (a) SO10 0.724

112
Global Competitiveness Report SO11 0.702
Internet Use for B2B SO12 0.586
Destination Loyalty 6 0.86 9.24 0.86 0.72
Digital Competitiveness (a) LO1 0.920
World Talent (a) LO2 0.843
Purchasing Power Index (a) LO3 0.806
Country Index LO4 0.741
Cost of Living Index (a) LO5 0.739
Nations Brand LO6 0.697
Destination Awareness &Quality 4 0.94 7.17 0.92 0.86
Effectiveness of Marketing AQ1 0.983
Sustainability of T&T (a) AQ2 0.896
Tourism Infrastructure AQ3 0.873
Prioritization of T&T (a) AQ4 0.778
Destination Image1 3 0.81 6.53
Heritage (a) IM1 0.888
Cultural Influence (a) IM2 0.815
Adventurous (a) IM3 0.786
Economic Sustainability 3 0.83 4.61 0.83 0.71
Tourist Arrivals EC1 0.855
Tourist Expenditure EC2 0.753
Number of Int’l Assoc. Meetings (b) EC3 0.657
Destination Image 2 2
Country Brand Strategy IM4 0.975 0.27 3.57 0.95 0.90
Country Brand Rankings IM5 0.897
Environmental Sustainability 2
Exponential Pollution Index EN1 -0.864 0.91 3.11 0.99 0.99
Pollution Index EN2 -0.858
Total variance explained 79.93 D dimensions (AQ awareness& Quality, IM image, LO loyalty, SO social, EC economic, EN environmental); N
number of extracted items; SL standardized loadings; CA Cronbach’s alpha; VE variance explained; N number
of variables after CFA; CR composite reliability; AVE average variance extracted; (a) items deleted after CFA;
(b) dropped for better CA.
The Kaiser-Meyer-Olkin test of sampling adequacy of 0.884 is significantly above the
threshold of 0.5, showing good internal consistency while Bartlett’s Test of Sphericity is
significant (p<0.001) suggesting that data is suitable for the factor analysis (Field, 2009). The
Cronbach’s Alpha on standardized items of 0.937, is significantly above the threshold of 0.7
which confirms good internal reliability of data and pointing that the correlation matrix is
suitable for factor analysis. The eigenvalue greater-than-one criteria is applied for extracting
the factors. All standardized loadings are greater than 0.5.
The first factor, which explains 45.7% of variance, is named “social sustainability”
because it reflects social wellbeing, government effectiveness, happiness, intelligence among

113
others (see Table 6.5., page 111). The 0.907 Cronbach’s Alpha suggests good internal reliability
of the factor. The findings confirm the earlier research that social sustainability reflects the
power, trust, cost and benefit (Nunkoo & Ramkissoon, 2011).
The second factor, marked as “destination loyalty”, accounts for 9.24% of the variances.
It reflects tourists’ preference and emotional attachment to the destination. The 0.862
Cronbach’s Alpha indicates a very good level of internal reliability (see Table 6.5., page 111).
The factor consists of six exogenous indicators such as country index and nations brand. The
findings are consistent with the earlier research of destination loyalty which supports notion
that loyalty is highly associated with the strength of the brand (Im et al., 2012).
Destination awareness and quality are extracted as one dimension. The factor accounts
for 7.17% of the variances explained. There are four exogenous indicator variables in the factor.
The impact on the awareness comes from the “effectiveness of marketing” variable. On the
other hand, impact on quality comes from the sustainability, quality of infrastructure and
prioritization of travel and tourism indicators. The 0.940 Cronbach’s Alpha shows very good
internal reliability. The findings are in line with the earlier research literature and arguments.
The EFA produced two image variables which are extracted as the fourth and sixth
factors. The fourth factor marked as “image 1”, accounts for 6.53% of the variances explained.
The factor consists of the 3 exogenous indicator variables: “heritage”, “cultural influence” and
“adventures”. All the variables are supported by the earlier research literature on tourism
destinations. The Cronbach’s Alpha is 0.810shows a very good internal reliability.
The fifth factor is marked as “economic sustainability” since it has variables related to
“arrivals” and “tourists’ expenditure”. The factor accounts for 4.61% of the variances
explained. Also, the factor has Cronbach’s Alpha of 0.830, which suggests good internal
reliability. The third variable “number of association meetings” must be dropped for internal
consistency issues (Table 6.5., p. 111). The structure of the factor is in line with the earlier
research literature and arguments.
The sixth factor, which accounts for 3.57% of the variances explained, is marked as
“image 2”. It has two variables “country brand strategy” and “country brand rankings”. The
Cronbach’s Alpha of the factor is 0.27 indicates poor internal reliability. The factor should be
used with caution in further analysis.
The seventh factor which accounts for 3.11% of the variances explained is denoted as
“environmental sustainability” is formed by two variables “pollution” and “exponential
pollution”. The factor has standard loadings of over 0.5 and Cronbach’s Alpha of 0.91 which
shows a very good internal reliability for further analysis.
Overall, the total percentage of variances explained is 79.9%. Six out of seven factors
have very good Cronbach’s Alfa measures, which shows that extracted data in EFA is suitable
for goodness of fit analysis using CFA employed by AMOS software application.

114
6.6. Measurement Model
Figure 6.2. Measurement Model Global Case (AMOS, v.23)
Confirmatory factor analysis (CFA), conducted in AMOS, version 23 software package,
further reduced the number of variables from 32 to 13 as a part of the empirical testing of the
measurement model (Hair, et al., 2010), see Figure 6.2. The goodness-of-fit statistics shows
that all parameters are within the recommending values (Table 6.6). Below is the diagram of
the measurement model as presented in Table 6.6.
Table 6.6. Goodness-of-Fit Statistics
Measurement indicator (Threshold Value) RV SV
Absolute Fit Measures
CMIN Chi-square/df <3 good; <5 sometimes permissible <3 1.815
p value p value for the model >0.05 0.000
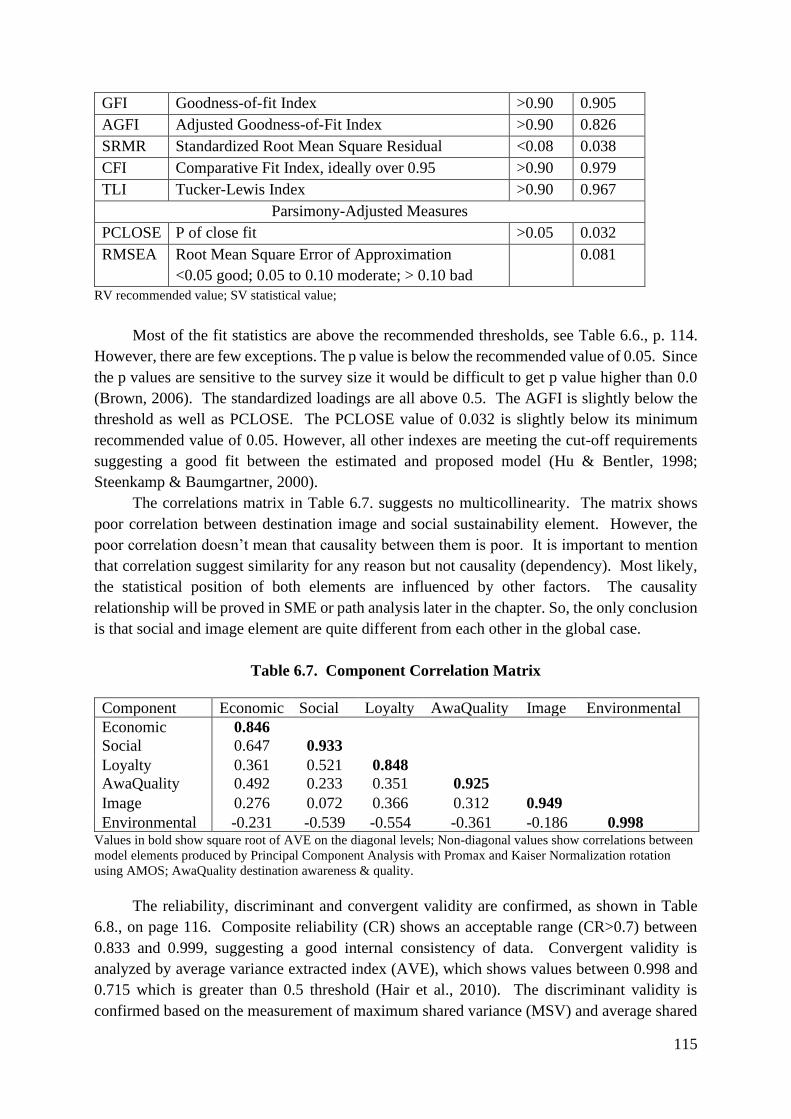
115
GFI Goodness-of-fit Index >0.90 0.905
AGFI Adjusted Goodness-of-Fit Index >0.90 0.826
SRMR Standardized Root Mean Square Residual <0.08 0.038
CFI Comparative Fit Index, ideally over 0.95 >0.90 0.979
TLI Tucker-Lewis Index >0.90 0.967
Parsimony-Adjusted Measures
PCLOSE P of close fit >0.05 0.032
RMSEA Root Mean Square Error of Approximation
<0.05 good; 0.05 to 0.10 moderate; > 0.10 bad
0.081
RV recommended value; SV statistical value;
Most of the fit statistics are above the recommended thresholds, see Table 6.6., p. 114.
However, there are few exceptions. The p value is below the recommended value of 0.05. Since
the p values are sensitive to the survey size it would be difficult to get p value higher than 0.0
(Brown, 2006). The standardized loadings are all above 0.5. The AGFI is slightly below the
threshold as well as PCLOSE. The PCLOSE value of 0.032 is slightly below its minimum
recommended value of 0.05. However, all other indexes are meeting the cut-off requirements
suggesting a good fit between the estimated and proposed model (Hu & Bentler, 1998;
Steenkamp & Baumgartner, 2000).
The correlations matrix in Table 6.7. suggests no multicollinearity. The matrix shows
poor correlation between destination image and social sustainability element. However, the
poor correlation doesn’t mean that causality between them is poor. It is important to mention
that correlation suggest similarity for any reason but not causality (dependency). Most likely,
the statistical position of both elements are influenced by other factors. The causality
relationship will be proved in SME or path analysis later in the chapter. So, the only conclusion
is that social and image element are quite different from each other in the global case.
Table 6.7. Component Correlation Matrix
Component Economic Social Loyalty AwaQuality Image Environmental
Economic 0.846
Social 0.647 0.933
Loyalty 0.361 0.521 0.848
AwaQuality 0.492 0.233 0.351 0.925
Image 0.276 0.072 0.366 0.312 0.949
Environmental -0.231 -0.539 -0.554 -0.361 -0.186 0.998 Values in bold show square root of AVE on the diagonal levels; Non-diagonal values show correlations between
model elements produced by Principal Component Analysis with Promax and Kaiser Normalization rotation
using AMOS; AwaQuality destination awareness & quality.
The reliability, discriminant and convergent validity are confirmed, as shown in Table
6.8., on page 116. Composite reliability (CR) shows an acceptable range (CR>0.7) between
0.833 and 0.999, suggesting a good internal consistency of data. Convergent validity is
analyzed by average variance extracted index (AVE), which shows values between 0.998 and
0.715 which is greater than 0.5 threshold (Hair et al., 2010). The discriminant validity is
confirmed based on the measurement of maximum shared variance (MSV) and average shared

116
variance (AVE). For all constructs the ASV is lower than MSV which confirms discriminant
validity.
Table 6.8. Reliability, Convergent and Discriminatory Validity Matrix
CR AVE MSV ASV
Economic 0.833 0.715 0.419 0.184
Social 0.952 0.870 0.551 0.358
Loyalty 0.835 0.719 0.551 0.284
Awareness &
Quality
0.922 0.856 0.404 0.250
Image 0.947 0.901 0.137 0.073
Environmental 0.999 0.998 0.307 0.154 CR composite reliability; AVE average variance extracted; MSV maximum shared variance; ASV averaged
shared variance; Awareness & Quality destination awareness & quality.
6.7. Structure Equation Modeling -Path Analysis
After the CFA confirmed the model-fit of the proposed model (Table 6.5., p.111), the
next step is to evaluate the causal (hypothesized) relationships within the proposed model.
Structural equation modelling (SEM) or path model analysis, , is considered for evaluation of
the causal relationships among the dimensions of the proposed model. The findings are used
to test the proposed hypotheses. The analysis is performed in AMOS, version 23, software
package on the output data from the goodness-of-fit analysis.
In the following analysis, to highlight the impact of the individual elements of the
destination sustainability on the elements of destination brand equity, the thesis evaluates three
SEM scenarios for each social, environmental and economic element in the role of a predictor
(exogenous) construct.
In the Scenario 1 the estimated model, consists of the six dimensions with social
sustainability as the predictor element, environmental sustainability, economic sustainability,
destination loyalty, destination image and, destination awareness and quality, Figure 6.3, p.
117. The latter is a joint construct that represents destination awareness and destination quality
as one dimension. The predictor element is one that acts as the independent exogenous variable
that predicts value of other constructs in the model. This is in line with previously adopted
hypotheses: H4, H5, H7, H10, H11, H12and H13.
The estimated model shows that social sustainability element is the most dominant as it
impacts all other elements in the model. The impact of the social element is most obvious on
destination loyalty (0.65) and economic sustainability 0.65).
All path estimates shown in Figure 6.3, page 117, are all statistically significant at p
values lower than 0.001 and 0.05, except for the environmental sustainability to destination
loyalty relation (H14) which is not significant at p < 0.08 probability. The path analysis, shown
in Figure 6.3, page 117, confirms seven hypothesized relations and fully confirms the goodness-
of-fit criteria for good model fit, as shown in Table 6.9., p. 117.

117
6.7.1. Scenario 1: Social Sustainability Construct as Predictor
Figure 6.3 Social Sustainability Construct as Predictor
Table 6.9. Goodness-of-Fit Statistics Global Case
Measurement indicator (Threshold Value) RV SV
Absolute Fit Measures
CMIN Chi-square/df <3 good; <5 sometimes permissible <3 1.698
P p value for the model >0.05 0.000
GFI Goodness-of-fit Index >0.90 0.884
AGFI Adjusted Goodness-of-Fit Index >0.90 0.826
SRMR Standardized Root Mean Square Residual <0.08 0.054
CFI Comparative Fit Index, ideally over 0.95 >0.90 0.971
-0.13 (p<0.08)
-0.25 (p<0.02) 0.70 (p<0.001)
0.43 (p<0.001)
0.29 (p<0.001)
0.73 (p<0.001)
-0.24 (p<0.003)
0.38 (p<0.001)
Social Sustainability
Destination Image
Destination
Loyalty
-0.55 (p<0.001)
Environmental Sustainability
H12
H13
Destination
Awareness & Quality
Economic Sustainability
H7
H10 & H4
H11 & H5
H14
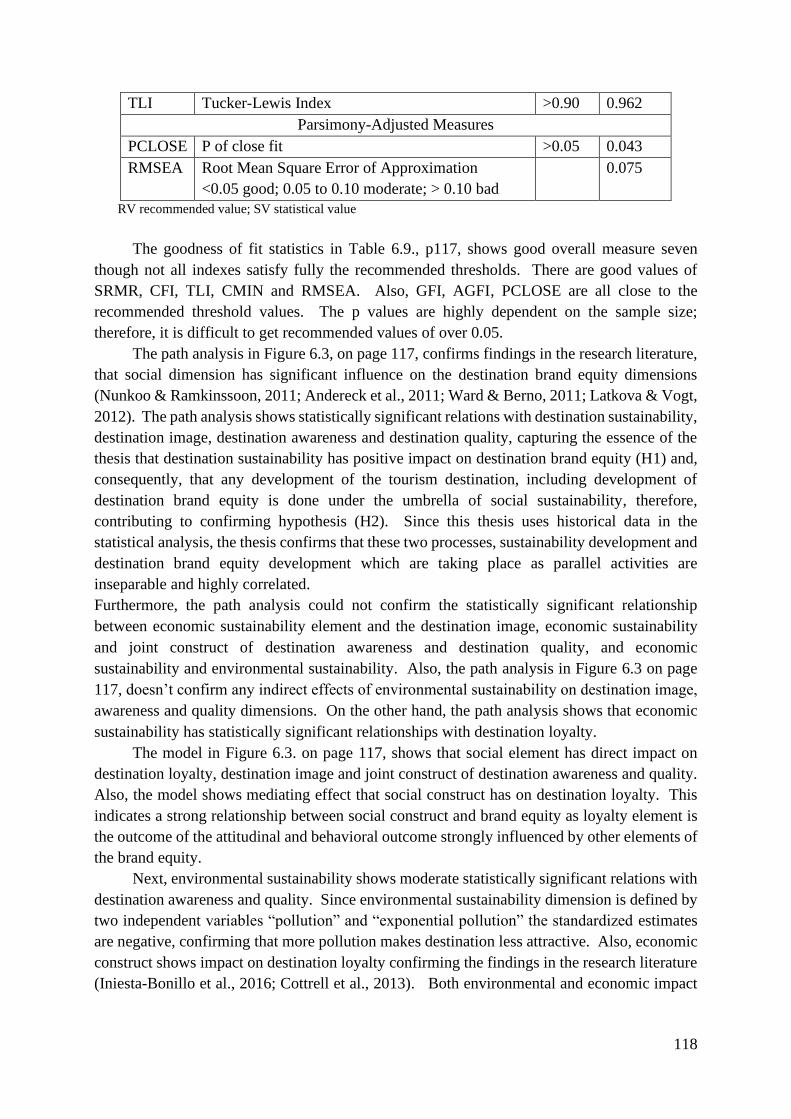
118
TLI Tucker-Lewis Index >0.90 0.962
Parsimony-Adjusted Measures
PCLOSE P of close fit >0.05 0.043
RMSEA Root Mean Square Error of Approximation
<0.05 good; 0.05 to 0.10 moderate; > 0.10 bad
0.075
RV recommended value; SV statistical value
The goodness of fit statistics in Table 6.9., p117, shows good overall measure seven
though not all indexes satisfy fully the recommended thresholds. There are good values of
SRMR, CFI, TLI, CMIN and RMSEA. Also, GFI, AGFI, PCLOSE are all close to the
recommended threshold values. The p values are highly dependent on the sample size;
therefore, it is difficult to get recommended values of over 0.05.
The path analysis in Figure 6.3, on page 117, confirms findings in the research literature,
that social dimension has significant influence on the destination brand equity dimensions
(Nunkoo & Ramkinssoon, 2011; Andereck et al., 2011; Ward & Berno, 2011; Latkova & Vogt,
2012). The path analysis shows statistically significant relations with destination sustainability,
destination image, destination awareness and destination quality, capturing the essence of the
thesis that destination sustainability has positive impact on destination brand equity (H1) and,
consequently, that any development of the tourism destination, including development of
destination brand equity is done under the umbrella of social sustainability, therefore,
contributing to confirming hypothesis (H2). Since this thesis uses historical data in the
statistical analysis, the thesis confirms that these two processes, sustainability development and
destination brand equity development which are taking place as parallel activities are
inseparable and highly correlated.
Furthermore, the path analysis could not confirm the statistically significant relationship
between economic sustainability element and the destination image, economic sustainability
and joint construct of destination awareness and destination quality, and economic
sustainability and environmental sustainability. Also, the path analysis in Figure 6.3 on page
117, doesn’t confirm any indirect effects of environmental sustainability on destination image,
awareness and quality dimensions. On the other hand, the path analysis shows that economic
sustainability has statistically significant relationships with destination loyalty.
The model in Figure 6.3. on page 117, shows that social element has direct impact on
destination loyalty, destination image and joint construct of destination awareness and quality.
Also, the model shows mediating effect that social construct has on destination loyalty. This
indicates a strong relationship between social construct and brand equity as loyalty element is
the outcome of the attitudinal and behavioral outcome strongly influenced by other elements of
the brand equity.
Next, environmental sustainability shows moderate statistically significant relations with
destination awareness and quality. Since environmental sustainability dimension is defined by
two independent variables “pollution” and “exponential pollution” the standardized estimates
are negative, confirming that more pollution makes destination less attractive. Also, economic
construct shows impact on destination loyalty confirming the findings in the research literature
(Iniesta-Bonillo et al., 2016; Cottrell et al., 2013). Both environmental and economic impact

119
are result of the moderating effect, since both elements are first influenced by social element as
depicted in the model.
Finally, we can summarize the structural parameter estimates for each of the hypothesized
relations in Table 6.10.
Table 6.10. Structural Weight Estimates for Social Case
Path
Relationships
Unstandardized
Weight
Estimate
Standardized
Weight
Estimate
Standard
Error
Estimate
z-Value
Estimate
H4: Soc → Awa 0.017 0.436 0.004 4.731
H5: Env → Awa -0.011 0.44 0.004 -2.921
H7: Soc →Im 0.218 0.383 0.046 4.724
H10: Soc → Qu 0.017 0.436 0.004 4.731
H11: Env → Qu -0.011 -0.244 0.004 -2.930
H12: Eco → Lo 0.000 -0.203 0.000 -2.050
H13: Soc → Lo 0.055 0.647 0.011 5.201
SUS sustainability; BE brand equity, Aw destination awareness; Im destination image; Qu destination quality;
Lo destination loyalty; Eco economic sustainability; Env environmental sustainability; Soc social sustainability
6.7.2. Scenario 2: Environmental Construct as Predictor
The path analysis in Figure 6.3, page 117, and Table 6.10 has statistically confirmed seven
relations and established a common base for confirming H1 and H2 hypotheses later in the
study. All seven confirmed paths a statistically significant. Therefore, based on the global
data the constructs in the proposed model can be empirically considered as valid, reliable and
acceptable.
In the second scenario, environmental construct is a predictor or exogenous independent
variable that predicts all other constructs in the model shown in Figure 6.4, page 120. The
number and type of constructs are the same as in Figure 6.3., on page 117, except for the
hypothesized relationships H4, H5, H8, H10, H11, H12 and H13. In this scenario,
environmental sustainability construct shows impact on the joint element of destination
awareness and quality and the element of destination image, while it shows indirect impact on
destination loyalty via social sustainability and economic sustainability construct both serving
as moderators.
All path estimates shown in Figure 6.4., page 120, are all statistically significant at p
values lower than 0.001 and 0.05 and confirms seven hypothesized relations. Also, the analysis
confirms acceptable goodness-of-fit criteria as shown in Table 6.11., p.120.

120
Figure 6.4. Environmental Construct as Predictor
Table 6.11. Goodness-of-Fit Statistics Global Case
Measurement Indicator (Threshold Value) Recommended
Value
Statistical
Value
CMIN Chi-square/df <3 good; <5 sometimes
permissible
<3 2.093
p value p value for the model >0.05 0.000
GFI Goodness-of-fit Index >0.90 0.880
AGFI Adjusted Goodness-of-Fit Index >0.90 0.805
SRMR Standardized Root Mean Square Residual <0.08 0.090
CFI Comparative Fit Index, ideally over 0.95 >0.90 0.968
TLI Tucker-Lewis Index >0.90 0.956
PCLOSE P of close fit >0.05 0.002
RMSEA Root Mean Square Error of Approximation
<0.05 good; 0.05 to 0.10 moderate; > 0.10 bad
0.094
0.29 (p<0.001)
-0.21 (p<0.016)
0.44 (p<0.001)
-0.23 (p<0.21) 0.55 (p<0.001)
-0.26 (p<0.008)
-0.29 (p<0.001)
0.71 (p<0.001)
-0.24 (p<0.005)
Social Sustainability
Destination Image
Destination
Loyalty
-0.41 (p<0.001)
Environmental Sustainability
H12
H13
Destination
Awareness & Quality
Economic Sustainability
H8
H10 & H4
H11 & H5
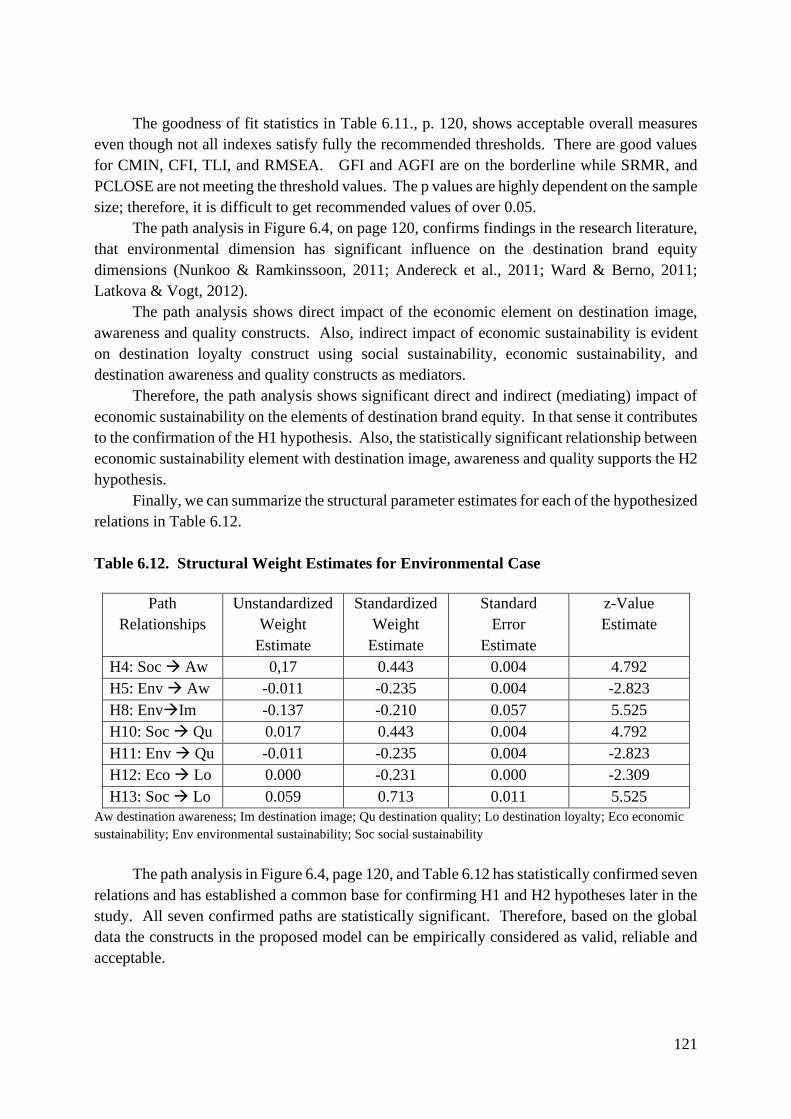
121
The goodness of fit statistics in Table 6.11., p. 120, shows acceptable overall measures
even though not all indexes satisfy fully the recommended thresholds. There are good values
for CMIN, CFI, TLI, and RMSEA. GFI and AGFI are on the borderline while SRMR, and
PCLOSE are not meeting the threshold values. The p values are highly dependent on the sample
size; therefore, it is difficult to get recommended values of over 0.05.
The path analysis in Figure 6.4, on page 120, confirms findings in the research literature,
that environmental dimension has significant influence on the destination brand equity
dimensions (Nunkoo & Ramkinssoon, 2011; Andereck et al., 2011; Ward & Berno, 2011;
Latkova & Vogt, 2012).
The path analysis shows direct impact of the economic element on destination image,
awareness and quality constructs. Also, indirect impact of economic sustainability is evident
on destination loyalty construct using social sustainability, economic sustainability, and
destination awareness and quality constructs as mediators.
Therefore, the path analysis shows significant direct and indirect (mediating) impact of
economic sustainability on the elements of destination brand equity. In that sense it contributes
to the confirmation of the H1 hypothesis. Also, the statistically significant relationship between
economic sustainability element with destination image, awareness and quality supports the H2
hypothesis.
Finally, we can summarize the structural parameter estimates for each of the hypothesized
relations in Table 6.12.
Table 6.12. Structural Weight Estimates for Environmental Case
Path
Relationships
Unstandardized
Weight
Estimate
Standardized
Weight
Estimate
Standard
Error
Estimate
z-Value
Estimate
H4: Soc → Aw 0,17 0.443 0.004 4.792
H5: Env → Aw -0.011 -0.235 0.004 -2.823
H8: Env→Im -0.137 -0.210 0.057 5.525
H10: Soc → Qu 0.017 0.443 0.004 4.792
H11: Env → Qu -0.011 -0.235 0.004 -2.823
H12: Eco → Lo 0.000 -0.231 0.000 -2.309
H13: Soc → Lo 0.059 0.713 0.011 5.525
Aw destination awareness; Im destination image; Qu destination quality; Lo destination loyalty; Eco economic
sustainability; Env environmental sustainability; Soc social sustainability
The path analysis in Figure 6.4, page 120, and Table 6.12 has statistically confirmed seven
relations and has established a common base for confirming H1 and H2 hypotheses later in the
study. All seven confirmed paths are statistically significant. Therefore, based on the global
data the constructs in the proposed model can be empirically considered as valid, reliable and
acceptable.

122
6.7.3. Scenario 3: Economic Construct as Predictor
Figure 6.5. Economic Construct as Predictor
In the third scenario, economic construct is a predictor or exogenous independent variable
that predicts all other constructs in the model shown in Figure 6.5. The number and type of
constructs are the same as in previous two scenarios. The analysis confirms the hypothesized
relationships H5, H7, H10, H11, H12 and H13.
All path estimates shown in Figure 6.5 are statistically significant at p values lower than
0.001 and 0.05. The path analysis confirms seven hypothesized relations. Also, the path
analysis confirms acceptable goodness-of-fit criteria as shown in Table 6.13., p. 123.
0.38 (p<0.001)
0.44 (p<0.004)
0.68 (p<0.001)
--0.23 (p<0.02)
0.65 (p<0.001)
0.29 (p<0.001)
0.71 (p<0.001)
-0.40 (p<0.004)
Social Sustainability
Destination Image
Destination
Loyalty
Environmental Sustainability
H12
H13
Destination
Awareness
& Quality
Economic Sustainability
H11 & H5
H7
H10 & H4

123
Table 6.13. Goodness-of-Fit Statistics Global Case
Measurement Indicator (Threshold Value) Recommended
Value
Statistical
Value
CMIN/DF Chi-square/df <3 good; <5 sometimes
permissible
<3 1..817
p value p value for the model >0.05 0.0
GFI Goodness-of-fit Index >0.90 0.894
AGFI Adjusted Goodness-of-Fit Index >0.90 0.831
SRMR Standardized Root Mean Square Residual <0.08 0.05
CFI Comparative Fit Index, ideally over 0.95 >0.90 0.976
TLI Tucker-Lewis Index >0.90 0.967
PCLOSE P of close fit >0.05 0.024
RMSEA Root Mean Square Error of Approximation
<0.05 good; 0.05 to 0.10 moderate; > 0.10 bad
0.81
The goodness of fit statistics in Table 6.13 shows good overall measures even though not
all indexes satisfy fully the recommended thresholds. There are good values of SRMR, CFI,
TLI, CMIN/DF and RMSEA. GFI is at the border line while AGFI and PCLOSE are all very
close to the recommended threshold values. The p values are highly dependent on the sample
size making it difficult to get recommended values of over 0.05.
The path analysis in Figure 6.5 on page 122, confirms findings in the research literature,
that economic sustainability dimension influences elements of destination brand equity (Iniesta-
Bonillo et al., 2016; Cottrell et al., 2013; Font & McCabe, 2017; Kim et al., 2017; Moise et al.,
2019).
The analysis outlined in Figure 6.5, page 122, shows direct and indirect impact of
economic sustainability on the elements of destination brand equity. Direct impact is on
destination loyalty while indirect impact is on destination image, awareness, and quality. Direct
impact creates negative response from destination loyalty suggesting that economic elements
alone are not enough to lift interest of the potential tourist to visit, revisit, pay premium and
spread the positive word about a destination. Further implications are that economic element
must first initiate positive change in the social element which, in turn, will positively affect
change the destination loyalty.
Finally, we can summarize the structural parameter estimates for each of the hypothesized
relations in Table 6.14.
Table 6.14. Structural Weight Estimates for Economic Case
Path
Relationships
Unstandardized
Weight
Estimate
Standardized
Weight
Estimate
Standard
Error
Estimate
z-Value
Estimate
H4: Soc → Aw 0.017 0.44 0.004 4.738
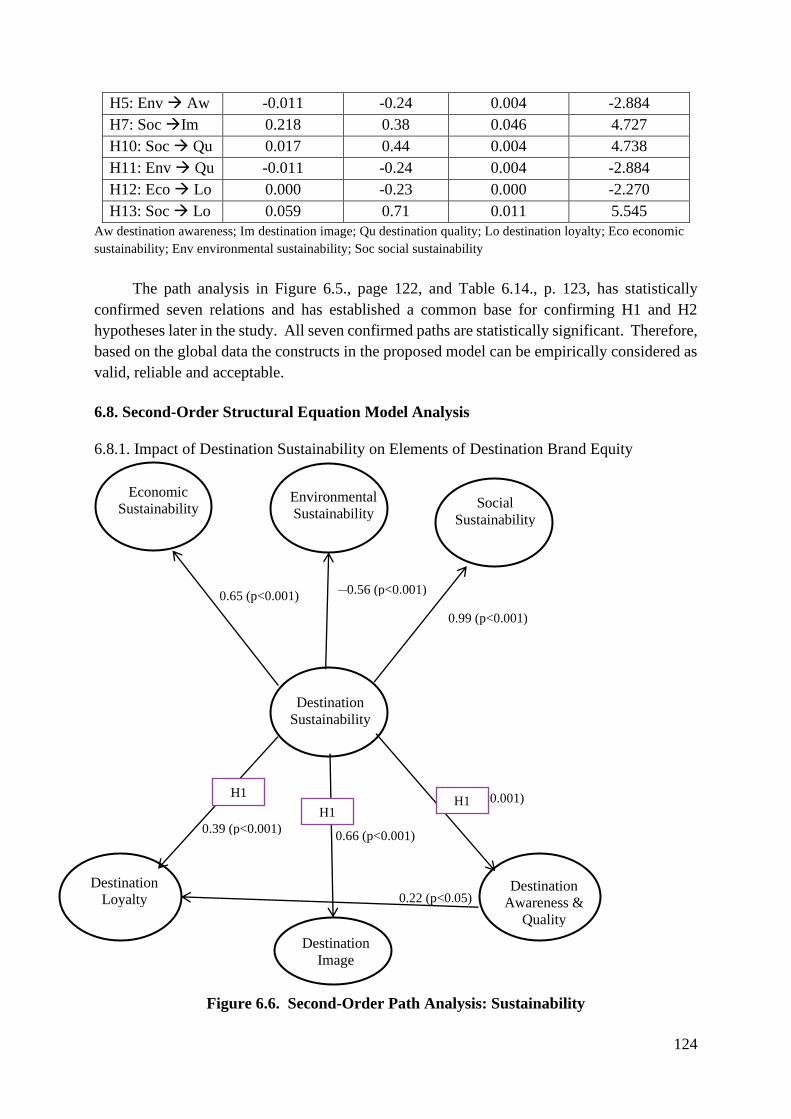
124
H5: Env → Aw -0.011 -0.24 0.004 -2.884
H7: Soc →Im 0.218 0.38 0.046 4.727
H10: Soc → Qu 0.017 0.44 0.004 4.738
H11: Env → Qu -0.011 -0.24 0.004 -2.884
H12: Eco → Lo 0.000 -0.23 0.000 -2.270
H13: Soc → Lo 0.059 0.71 0.011 5.545
Aw destination awareness; Im destination image; Qu destination quality; Lo destination loyalty; Eco economic
sustainability; Env environmental sustainability; Soc social sustainability
The path analysis in Figure 6.5., page 122, and Table 6.14., p. 123, has statistically
confirmed seven relations and has established a common base for confirming H1 and H2
hypotheses later in the study. All seven confirmed paths are statistically significant. Therefore,
based on the global data the constructs in the proposed model can be empirically considered as
valid, reliable and acceptable.
6.8. Second-Order Structural Equation Model Analysis
6.8.1. Impact of Destination Sustainability on Elements of Destination Brand Equity
Figure 6.6. Second-Order Path Analysis: Sustainability
—0.56 (p<0.001) 0.65 (p<0.001)
0.39 (p<0.001)
0.22 (p<0.05)
0.66 (p<0.001)
0.60 (p<0.001)
0.99 (p<0.001)
Destination
Sustainability
Destination Image
Social Sustainability
Destination Loyalty
Economic
Sustainability
Destination Awareness &
Quality
Environmental Sustainability
H1
H1 H1

125
The path analysis in Figure 6.3, 6.4 and 6.5, show high correlations between the factors
of destination brand equity (awareness, loyalty, quality, and image). Also, the same analysis
shows high correlations between the isolated factors of destination sustainability (social,
economic, and environmental).
In the scenarios when lower-order elements are significantly correlated there is a
possibility of the existence of the higher-order factor or factors (Byrne, Baron, Larsson, &
Melin, 1995; Konecnik & Gartner, 2007). The path analysis in Figure 6.6, page 124,
considers destination sustainability as a higher-order factors consisting of social and economic
sustainability.
The path analysis shows that destination sustainability dimension has significant impact
on the elements of destination brand equity. The impact is clear on destination loyalty, image
and on joint part of destination awareness and quality. The strongest impact of sustainability
is on the destination image 0.66 and awareness and quality factor with standardized weight
estimates of 0.60. In practical terms, if sustainability goes up by 1.0 the joint awareness and
quality factor goes up by 0.60.
Table 6.15. Goodness-of-Fit Statistics
Measurement indicator (Threshold Value) RV SV
Absolute Fit Measures
CMIN Chi-square/df <3 good; <5 sometimes permissible <3 1.902
p value p value for the model >0.05 0.000
GFI Goodness-of-fit Index >0.90 0.886
AGFI Adjusted Goodness-of-Fit Index >0.90 0.822
SRMR Standardized Root Mean Square Residual <0.08 0.043
CFI Comparative Fit Index, ideally over 0.95 >0.90 0.973
TLI Tucker-Lewis Index >0.90 0.963
Parsimony-Adjusted Measures
PCLOSE P of close fit >0.05 0.011
RMSEA Root Mean Square Error of Approximation
<0.05 good; 0.05 to 0.10 moderate; > 0.10 bad
0.086
RV recommended value; SV statistical value
The goodness-of-fit measurements shows acceptable statistical levels. GFI of 0.886 and
AGFI of 0.850 came close to0.90 threshold, p value of 0.00 came below the recommended
value of 0.05, and PCLOSE of 0.011 is below the recommended value of 0.05. All other
indexes, including RMSEA (0.086), are meeting the recommended values (Table 6.15),
suggesting a very good model fit between proposed and estimated model (Hu & Bentler, 1998;
Steenkamp & Baumgartner, 2000).

126
The correlations matrix in Table 6.16. suggests no multicollinearity.
Table 6.16. Component Correlation Matrix
Component Loyalty Sustainability A&Q Image
Loyalty 0.849
Sustainability 0.705 0.865
A&Q 0.617 0.597 0.924
Image 0.228 0.343 0.310 0.950 Values in bold show AVE levels; Non-diagonal values show correlations between model
elements produced by Principal Component Analysis with Promax and Kaiser
Normalization rotation using AMOS; A&Q destination awareness & quality.
The reliability, discriminant and convergent validity are confirmed, as shown in Table
6.17. Composite reliability (CR) shows an acceptable range (CR>0.7) between 0.836 and
0.948, suggesting a good internal consistency of data. Convergent validity is analyzed by
average variance extracted index (AVE), which shows values between 0.903 and 0.749 which
is greater than 0.5 threshold (Hair et al., 2010). The discriminant validity is confirmed based
on the measurement of maximum shared variance (MSV) and average shared variance (AVE).
For all constructs the ASV is lower than MSV which confirms discriminant validity (Hair et
al., 2010).
Table 6.17. Reliability, Convergent and Discriminatory Validity Matrix
CR AVE MSV ASV
Loyalty 0.836 0.772 0.497 0.310
Sustainability 0.848 0.749 0.497 0.284
A&Q 0.921 0.854 0.381 0.278
Image 0.948 0.903 0.096 0.049 CR composite reliability; AVE average variance extracted; MSV maximum shared variance; ASV averaged
shared variance; A&Q destination awareness & quality.
6.8.2. Impact of Destination Sustainability on Destination Brand Equity
In the second scenario, using the same data, the path analysis is conducted on the model
with two second-order factors: destination sustainability and destination brand equity, see
Figure 6.7., page 127.
The higher order destination sustainability factor is loaded with three latent variables:
social, environmental and economic sustainability. All estimated weight loadings are over the
absolute value of 0.5, Figure 6.7., page 130. Similarly, higher order destination brand equity
is loaded with three latent variables: destination loyalty, image and a joint variable of
awareness and quality. All standardized estimated weights exceed absolute value of 0.5
except for the image which shows standardized estimated weight factor of 0.41.
The path analysis shows statistically significant impact of destination sustainability on
destination brand equity with standardized weight estimates of 0.92. In the path analysis
standardized weight estimates between exogenous variables are identical to correlation values.
This suggests that both constructs move in the same direction at about same intensity. The

127
implication of findings in the path analysis are the similarities between the two development
processes.
Figure 6.7. Two Second-Order Factors: Destination Sustainability and Brand
Equity
The path analysis confirms high standardized weight estimate (0.92) between
sustainability and brand equity suggesting high level of causality. Also, the sign that two
constructs are moving in the same direction and with the same intensity confirm the H2
-0.56 (p<0.001) 0.65 (p<0.001)
0.92 (p<0.001)
0.82 (p<0.001) 0.41 (p<0.001)
0.73 (p<0.001)
0.98 (p<0.001)
Destination
Sustainability
Destination Image
Social Sustainability
Destination Loyalty
Economic
Sustainability
Destination Awareness &
Quality
Destination Brand Equity
Environmental
Sustainability
H1, H2

128
hypothesis that destination sustainability and destination brand equity are two similar
processes and, could be considered as one, in the long run.
Table 6.18. Goodness-of-Fit Statistics
Measurement indicator (Threshold Value) RV SV
Absolute Fit Measures
CMIN Chi-square/df <3 good; <5 sometimes permissible <3 1.928
p value p value for the model >0.05 0.000
GFI Goodness-of-fit Index >0.90 0.886
AGFI Adjusted Goodness-of-Fit Index >0.90 0.821
SRMR Standardized Root Mean Square Residual <0.08 0.049
CFI Comparative Fit Index, ideally over 0.95 >0.90 0.972
TLI Tucker-Lewis Index >0.90 0.962
Parsimony-Adjusted Measures
PCLOSE P of close fit >0.05 0.009
RMSEA Root Mean Square Error of Approximation
<0.05 good; 0.05 to 0.10 moderate; > 0.10 bad
0.087
RV recommended value; SV statistical value;
Goodness-of-fit statistics, in Table 6.18, shows that five out of nine indictors are meeting
the recommended values. The p value is 0.0 which is below the recommended value of 0.05.
The GFI of 0.886 is close to the threshold value of 0.90, so the index can be accepted. Also,
the AGFI of 0.821 is close to the threshold value of 0.90 while PCLOSE of 0.009 is significantly
below the threshold value of 0.05. Despite that few indexes are below the threshold values,
most of the indexes meet or are close to the recommended values, hence, justifying the
acceptance of the results (Hu & Bentler, 1998; Steenkamp & Baumgartner, 2000).
Finally, the summary of the structural parameter estimates for each of the hypothesized
relations is shown in Table 6.19.
Table 6.19. Structural Weight Estimates for H1 and H2
Path
Relationships
Unstandardized
Weight
Estimate
Standardized
Weight
Estimate
Standard
Error
Estimate
z-Value
Estimate
H1: SUS → Aw 0.704 0.624 0.120 5.854
H1: SUS →Im 6.141 0.369 1.450 4.236
H1: SUS → Qu 0.704 0.624 0.120 5.854
H1: SUS → Lo 1.364 0.548 .330 4.127
H1: SUS → BE 0.777 0.918 0.120 6.450
H2: SUS → BE 0.777 0.918 0.120 6.450
SUS destination sustainability; BE destination brand equity; Aw destination awareness; Im destination image;
Qu destination quality; Lo destination loyalty.

129
The path analysis in Figure 6.6, page 124, and Figure 6.7., page 127, statistically
confirms H1 and H2 hypothesis, Table 6.15., p. 125. Considering seven previously confirmed
paths in Figure 6.5., page 122, we can conclude that the proposed model constructs, based on
global data, is empirically proved as valid, reliable and acceptable.
130
7. CASE OF SERBIA
This chapter explores hypothesized relationships between the elements of destination
sustainability and the elements of destination brand equity. It shows in detail the EFA, CFA
and SEM analysis on the data from a case of Serbia. The estimated relations are confirmed and
compared with the predicted model.
First, tourism landscape of Serbia, is highlighted to show a historical, cultural and
hereditary background for the case.
Second, the chapter explains how the data for the analysis are collected from the foreign
tourists. The chapter explains the formation of the research instrument, operationalization of
the research questions, measurement scale and the reliability, convergent and discriminatory
validity of the data.
Further, different research and model estimation scenarios are presented to confirm the
proposed hypotheses. The goodness-of-fit analysis is confirmed using confirmatory factor
analysis while hypotheses are tested using structural equation modeling technique. Finally, the
outlined hypotheses are tested, and the overall conclusion of the results is explained. The
research instrument for the case of Serbia is presented. Finally, the exploratory study is
conducted to confirm the elements of the destination sustainability and destination brand equity
constructs of the case of Serbia. Further, the proposed model is measured up against the
estimated model for the final confirmation.
7.1. Case of Serbia
In the case of Serbia scenario, all constructs and relations of the global model, presented
earlier in chapter 6, are repeated on the data from the case of Serbia. The survey on Serbia is
conducted exclusively on the foreign tourists, who are visiting Belgrade, the capital and the
most popular tourism destination in Serbia.
Because each country is unique and has a distinct set of tangible and intangible
characteristics, the intent of the thesis is to show statistically significant similarity with the
global model, not the exact match.
Serbia is a former republic of Yugoslavia, located in the western part of the Balkan region.
According to WTTC (2018), Serbian tourism was 6.7% of the GDP (direct and indirect
contributions) in 2017, contributing 7.1% of the total exports, and generated 96,500 jobs (direct
and indirect) which is 4.9% of the total employment.
In 2017, direct contributions to the GDP reached 2.3%, tourism generated 1.9% of the
country’s employment and created some 37,000 jobs. Statistical Yearbook of the Republic of
Serbia (Statistical Yearbook, 2019) reported for 2018, 1.7 million foreign and about the same
number of domestic tourists. Overnights reached 9.3 million with 39% related to the domestic
tourists. WTTC (2018) reported that foreign tourists spent 64% of the total expenditure for
2018. Mountain resorts and spas were the most popular with bed overnight utilization of 50%.
Domestic tourists expressed preference for spas and mountain resorts with overnight occupancy
of 39% and 32% respectfully. In 2017, the size of the total tourism market in Serbia was about
€1.2 billion euros (Statistical Yearbook, 2019). Government’s voucher program, which started

131
in the recent years, have significantly contributed to the increase in domestic tourism in Serbia
(Ministry of Trade, Tourism and Telecommunications, [MTTT], 2016).
Serbia was placed by the Travel and Tourism Competitiveness Index (Calderwood &
Soshkin, 2019) 83rd among 140 countries. Well in front of Serbia are Croatia (27), Slovenia
(36), Bulgaria (45), Romania (56), and Montenegro (67). Only Albania (86) , North Macedonia
(101), Moldova (103), and Bosnia and Herzegovina (105) are behind the Seriba. The report
points weakness of Serbia in several areas but most importantly in air connectivity,
international openness and investments in cultural resources (Crotti & Misrahi, 2017).
According to Calderwood & Soshkin (2019), Serbia shows moderate performance in enabling
environment and T&T policy while falls behind on infrastructure and natural and cultural
resources.
Nordin, (2005) and Yeoman (2012) evaluate tourism in Serbia through the prism of
environmental, demographic, political, social and economic aspects. Dwyer’s et al. (2014)
considers these aspects as crucial for the competitiveness of every destination. Serbia has a
lot of room for improvement, in particular in the infrastructure, laws and destination
management. Also, Serbia needs to pay attention to avoid “strategic drift” to circumvent
deterioration of its competitive advantage (Dwyer & Edwards, 2009).
Customer needs and value creation are part of the competitive advantage of a destination
which Serbia should recognize and implement into its tourism development strategy. Serbia’s
tangible and intangible tourism resources are well recognized (MTTT, 2016). At the moment,
there is a room for improvement in the areas of legal structure, investments, infrastructure,
social and environmental laws and research. Tourism potential of Serbia lays in attractions
around and in the capital of Belgrade, mountains, monasteries, spas, rural areas, rivers and
archeological sites.
7.2. Scale Development: Operationalization of the Model
The survey “of the case of Serbia” includes measures of eight perceived dimensions,
social, economic, socio-economic, environmental, awareness, image, quality and loyalty.
Design of the case of Serbia survey instrument is intended to facilitate measuring the
relationships between the elements of the proposed model. The goal is to cross-validate the
findings in the global case as well as to reveal other interesting outcomes. The survey is
specifically intended to analyze perception of the international tourists who are visiting
Belgrade, regardless of any previous experience with Serbia and its destinations. The focus of
the survey is on the tourists who visited Belgrade, since it is the most visited Serbian destination
by international travelers.
Belgrade as a tourist destination represents more than just a local destination. In general,
it represents a regional destination. In this thesis, Belgrade is chosen as a subject for analysis
because it is the first and the most frequently visited destination by foreign tourists during their
visit, travel and stay in Serbia. This become more obvious when the location and traffic hub
are taken into consideration (main airport, administrative center and the most developed tourist
destination in Serbia). Belgrade generates most of the revenue of tourism in Serbia since it is
the most popular destination to arrive or to use as a hub for different trips to other parts of

132
Serbia. Uneven development of tourism in Serbia makes Belgrade even more attractive for
foreign tourists. Because of the significant contribution of Belgrade to the overall tourism
experience in Serbia, Belgrade is considered as viable representative of the Serbian tourism and
is used as a proxy for Serbia for analysis in this study. This is a common practice in the
scientific literature to select a specific destination within a country to test and cross-validate the
theory (Martín, Herrero, & Salmones, 2018; Gusoy et al., 2010; Donner & Fort, 2018). This is
further supported by the official data on Serbian tourism. According to Statistical Yearbook
(2019), in 2018, 57% of the foreign tourists who came to Serbia visited Belgrade and accounted
for 55% of foreign tourists’ overnights. Since statistical data show that majority of tourists
who travel to Serbia gravitate towards Belgrade, this thesis supports Belgrade to represent
Serbia as a destination.
The main survey was divided into the eight groups of questions that describe the
corresponding constructs of the model shown in Figure 7.1, page 134. Those groups or
constructs are, economic, social, socio-economic, environmental, awareness, image, quality
and loyalty. Since the constructs are latent variables, they are difficult to measure (observe)
directly. Therefore, the multivariate analysis suggests using suitable proxy observable variables
to indirectly define each construct. The multivariate analysis tests the reliability and validity
of the goodness-of-fit of the survey data, which if proved as reliable and valid, the focus shifts
towards examining causal relations between the dimensions (constructs) of the model which
leads to hypotheses testing.
Economic destination dimension is measured using three-item scale. The eleven-point
Likert scale is applied (Tasci, 2018). The proposed proxy observable variables measure of the
perception of tourists related to investments in tourism, infrastructure and making money from
tourism, Figure 7.1., page 134. Accordingly, the economic element of sustainability infers
generating optimal output with objective to sustain a good standard of living with the
boundaries of the existing capital and meeting economic needs of the population (Mbaiwa,
2005). The research question items in the research instrument are formulated based on the
previous research literature (Iniesta-Bonillo et al., 2016; Andereck & Vogt, 2000), see Figure
7.1., p 134.
Social destination dimension is rated by the five-item scale on an eleven-point Likert-
type scale from 0 (i.e. absolutely no) to 10 (absolutely yes). Since it would be difficult to
directly measure unobservable social variables, as suggested by the social exchange theory:
trust, power, benefits and costs, the thesis adopts, based on the literature review, the following
observable proxy metrics: staff friendliness, behavior of tourists, and feeling safe (Chekalina et
al., 2016; Konecnik & Gartner, 2007). See Figure 7.1., p 134. The proxy variable “feeling
safe” corresponds to trust and power since it reflects law enforcement structure and the
effectiveness of the local governance of a destination. The remaining two variables “stuff
friendliness” and “behavior of tourist” are supported by the literature as shown in Table 7.1.,
page 134. All items are conceptualized as statements and ranked at the eleven-point Likert
agreement scale from 0 (absolutely no) to 10 (absolutely yes). See Figure 7.1., p 134.
Socio-economic element is rated by the 2-item scale on an eleven-point Likert type scale
from 0 (i.e. absolutely no) to 10 (absolutely yes) as supported by Tasci (2018). The element is
defined by two proxy variables “reasonable prices” and “value-for-money” which factor
analysis (SPSS) confirmed as one construct, see Figure 7.4., p 154.

133
Aaker (1996) and Sweeney & Soutar (2001) suggested that value can be measured by
interviewing tourists if the choice of the brand offers good value for the money. Similarly,
Zeithaml, (1988) considers value-for-money as a functional value that is formed by quality and
price. Also, Sanchez, et al., (2006) and Williams & Soutar (2009) proposed a scale for
measuring post-purchase perceived value in tourism. The same authors suggest that the service
quality (benefit) and price are affective perceived value and, therefore, belong to emotional and
social value.
Boo et al. (2009) tested “judgements and feelings” element and confirmed that social
image positively influence value for money. Chekalina (2015) confirms positive perception of
the value-for-money and social destination resources. The same author argues that social
engagements are important part of visiting a destination suggesting that well-trained, service-
oriented, professional and highly qualified personnel at the tourism organizations and lodging
facilities can contribute that tourists feel comfortable, welcome and experience value for
money. The author states that travelling raises possibility of having social engagements in a
casual atmosphere and enhance travelling experience by meeting interesting people. When
travelling, one can exchange life experiences, feelings and thoughts with other travelers.
Shopping in another part of the world, where prices and choices of products are different brings
another level of social excitement contributing to the trips’ value for money. The same author
suggests that the overall positive experience of travelling including satisfaction with many
activities and value for money, create positive feeling and result in happiness. Williams &
Soutar (2009) point to the benefit of prestige as a social value resulting from the travel.
Zeithaml (1988) suggested that consumer-value conceptualization corresponds to the positive
relationship between value-for-money and the perception of destination resources.
Reasonable price is considered a perceived consumer value by Tasci (2018). Aaker
(1996) included reasonable price in Brand Equity Ten Scales as a dimension of an association
component. Iniesta-Bonillo et al. (2016) consider the difference between the economic benefit
and economic cost , which indicate “reasonable” value or prices, as a part of the economic
sustainability. Boo et al. (2009) places reasonable prices in the destination brand value context
while Tasci (2018) suggests that latent variable consumer value, which includes “reasonable
prices”, should be evaluated outside of the destination brand equity model as a separate item,
rather than as its integral part. This thesis considers “reasonable price” togather with “value-
for-money”, as a building block of the socio-economic sustainability construct that belongs to
the sustainability domain.
Environmental destination dimension was formulated using five-item scale which is
supported by the previous research by reflecting on the environmental awareness of the quality
of the environment. (Buckley, 2012; Iniesta-Bonillo et al., 2016; Andereck & Vogt, 2000).
According to Iniesta-Bonillo et al., (2016), perceived environmental sustainability is a
representative element of the general concept of sustainability while Andereck & Vogt (2000)
state that the observable variables should be formulated to reflect impact that environment has
on a tourism destination as shown in Figure7.1.

134
Figure 7.1. Scale Development for the Case of Serbia
The environmental observable variables are operationalized using the eleven-point
Likert-type absolute scale ranging from “0=absolutely no” to “10=absolutely yes”. The
environment sustainability is the original area of focus by the research community. It relates to
the natural capital and the state of the renewable and non-renewable resources. In this thesis
they are operationalized as the impact of pollution, smell, noise, crowding, and environmental
care, as shown in Figure 7.1. The variables reflect environmental awareness that lead to pro-
environmental behavior as shown in Figure 2.10, page 58.
Destination awareness is operationalized in six statement variables (questions) at the
eleven-point Likert-type absolute scale. As Aaker (1996) stated the top-of-mind awareness is
hard to measure on visitors with previous experience with a destination (Konecnik & Gartner,
IMPACT
Destination
Sustainability
Investments
Infrastructure Can make money
ECONOMIC
Level of pollution Level of smell
Level of noise
Crowd levels
Attending environment
ENVIRONMENTAL
Name and reputation Famous destination
Recall
Top-of-mind Ads on Serbia
Popular destination
AWARENESS
Fits personality Impression on friends
Reflexing who I am
Relaxing atmosphere
Excellent entertainment
IMAGE
Quality of service Quality of experience
Superior experience
Exceeds expectations
QUALITY
Like visiting
Preferred choice
Emotionally attached Recommend
Revisit
LOYALTY
Destination
Brand Equity
Reasonable prices
Value for money
SOCIO-ECONOMIC
Economic
Sustainability
Environmental
Sustainability
Social
Sustainability
Destination
Awareness
Destination
Loyalty
Destination
Quality
Destination
Image
Friendly staff
Behavior of tourist Safety
SOCIAL

135
2007; Boo et al., 2009; Pike et al., 2010). Therefore, to measure destination brand awareness,
the research instrument is formulated using metrics of destination brand knowledge and brand
presence as employed by Lehmann, Keller, and Farley (2008). See Figure 7.1., p 134.
Destination image is operationalized using five variable statements ranked on eleven-
point Likert scale. The list of image items is deduced from the previous tourism research
literature (Konecnik & Gartner, 2007; Pike et al., 2010; Boo et al., 2009), and is polished in the
context of Serbia-distinct attribute characteristics as communicated in the tourism publications,
literature and media. The items are selected to represent the motive or emotional attachment
tourists have towards the destination. See Figure 7.1., p. 134.
The conceptualization of the destination quality is formulated using four items ranked on
eleven-point Likert scale. The items are formulated as statements. The tourism literature-
based items are selected to capture the quality of service, superiority and performance
(Konecnik & Gartner, 2007; Pike et al., 2010; Boo et al., 2009). See Figure 7.1., p. 134.
Finally, destination loyalty is conceptualized using five statements rated at the eleven-
point Likert agreement scale, ranging from (0 absolutely no) and (10 absolutely yes). The
statements are based on the previous tourism literature assessments of the destination brand
loyalty (Konecnik & Gartner, 2007; Pike et al., 2010; Boo et al., 2009). The statements are
constructed to reflect the preference, emotional attachment, repeat visitation and intention to
recommend a destination. See Figure 7.1., p. 134.
Moreover, the wording and the structure of the questionnaire are polished and completed
in the course of discussions with academic and research colleagues. The first 20 responses were
used to pre-test the questionnaire, resulting in the change of wording in four questions. The
questions were prepared in English using Google Forms application and were directly presented
to respondents for self-answering using tablets or phones. The copy of the survey is presented
in the Appendix B at the end of this paper.
7.3. Research Instrument
Design of the research instrument is intended for the foreign tourists only, and those who
were in Serbia at the time the survey was conducted. It consists of the total of 41 questions,
with 8 questions related to demographics. There are eight groups of questions, destination
economic sustainability, destination socio-economic sustainability, destination social
sustainability, destination environmental sustainability, destination brand awareness, image,
quality and loyalty that correspond to dimensions of the proposed model. The socio-economic
questions are extra measurement dimension introduced to support social and economic
elements for better evaluation of the model. All non-demographic questions are rated on an
eleven-point Likert agreement scale (0=absolutely no or disagree, to 10=absolutely yes or
agree). Only the English version of the questionnaire is prepared, see Table 7.1 on page 134.
The Likert scale is used because it is easy to read and complete, produces reliable results
and is simple to construct. The most popular Likert scales are 5 and 7-point. However, it is
common to use 9-point Likert scale for increased granularity (Tasci, 2018). For the same
reason, the thesis uses 11-point Likert scale to reduce the perceptual difference in size between
the intervals (Bertram, 2019).
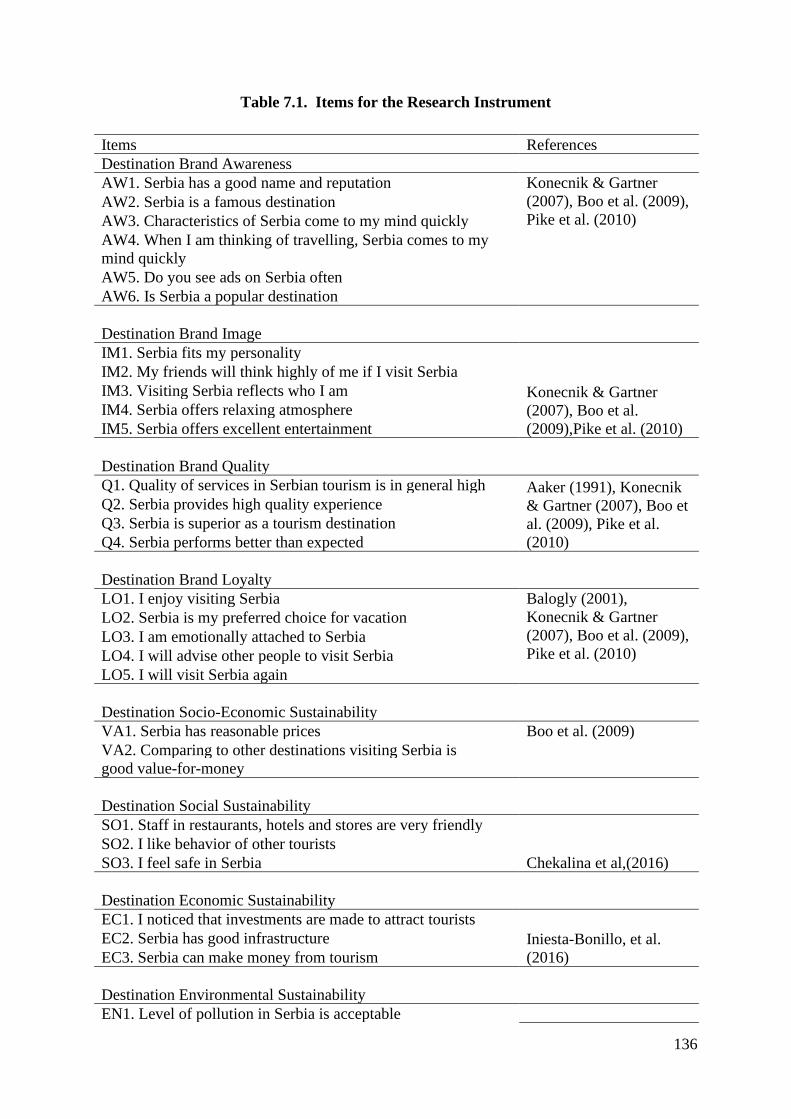
136
Table 7.1. Items for the Research Instrument
Items References
Destination Brand Awareness
AW1. Serbia has a good name and reputation Konecnik & Gartner
(2007), Boo et al. (2009),
Pike et al. (2010)
AW2. Serbia is a famous destination
AW3. Characteristics of Serbia come to my mind quickly
AW4. When I am thinking of travelling, Serbia comes to my
mind quickly
AW5. Do you see ads on Serbia often
AW6. Is Serbia a popular destination
Destination Brand Image
IM1. Serbia fits my personality
Konecnik & Gartner
(2007), Boo et al.
(2009),Pike et al. (2010)
IM2. My friends will think highly of me if I visit Serbia
IM3. Visiting Serbia reflects who I am
IM4. Serbia offers relaxing atmosphere
IM5. Serbia offers excellent entertainment
Destination Brand Quality
Q1. Quality of services in Serbian tourism is in general high Aaker (1991), Konecnik
& Gartner (2007), Boo et
al. (2009), Pike et al.
(2010)
Q2. Serbia provides high quality experience
Q3. Serbia is superior as a tourism destination
Q4. Serbia performs better than expected
Destination Brand Loyalty
LO1. I enjoy visiting Serbia Balogly (2001),
Konecnik & Gartner
(2007), Boo et al. (2009),
Pike et al. (2010)
LO2. Serbia is my preferred choice for vacation
LO3. I am emotionally attached to Serbia
LO4. I will advise other people to visit Serbia
LO5. I will visit Serbia again
Destination Socio-Economic Sustainability
VA1. Serbia has reasonable prices Boo et al. (2009)
VA2. Comparing to other destinations visiting Serbia is
good value-for-money
Destination Social Sustainability
SO1. Staff in restaurants, hotels and stores are very friendly
Chekalina et al,(2016)
SO2. I like behavior of other tourists
SO3. I feel safe in Serbia
Destination Economic Sustainability
EC1. I noticed that investments are made to attract tourists
Iniesta-Bonillo, et al.
(2016)
EC2. Serbia has good infrastructure
EC3. Serbia can make money from tourism
Destination Environmental Sustainability
EN1. Level of pollution in Serbia is acceptable

137
EN2. Level of smell in Serbia is acceptable
Buckley (2012); Iniesta-
Bonillo, et al. (2016)
EN3. Level of noise in Serbia is acceptable
EN4. Crowd levels are acceptable in Serbia
EN5. Serbia has visible practice in maintaining environment
7.4. Data Collection
Data collection process is conducted on the international tourists during their stay in Belgrade,
Serbia. Belgrade, the capital of Serbia is considered the most popular destination among foreign
tourists since according to Statistical Yearbook (2019) in 2018, 57% of foreign tourists who
came to Serbia visited Belgrade and accounted for 55% of foreign tourists’ overnights in the
city. Because majority of the foreign tourists who visit Serbia tend to gravitate towards and
spend most of the time in Belgrade, we can assume that the foreign tourists who visit Belgrade
also represent those visiting Serbia. The idea of the survey is to capture the on-the-spot
destination experience of the tourists. This approach has some reservations from the Palmer
(2010) who suggests that evaluation of the service performance should happen sometimes after
the consumption of service to allow for impressions to settle and mature.
The increased popularity of the on-line based surveys gave a way to the popularity of the
mobile-phone or smart-phone based surveys. The Google Forms and similar applications are
becoming increasingly popular as a tool for developing, revising, recording and analyzing the
survey data. There are many advantages of using mobile phone-based surveys such as
convenience, speed, timeliness, low administration cost, process control, analysis, global reach,
easy and direct data entry by participants, error reduction and analysis. Also, the smart-phone
surveys reduce the junk mail image of the e-mail survey.
Furthermore, the mobile-phone surveys drop the missing data issues since they have built-
in features that do not allow omitting fields. Next, traditional problems with internet
connections and coverage are eliminated since the mobile phones are constantly online if there
is a signal coverage, which is more widespread than internet connections. Moreover, the mobile
data signal is conveniently available at almost any location making it convenient and possible
for conducting the survey anywhere.
Easy of a survey design creates advantage since the Google Forms uses its easy-to-use
development platform. Finally, privacy and security issues are of low concern since the data
comes directly to the designated host platform. In comparison to the regular mail or e-mail
surveys the response rate of the surveys using mobile-phone applications are higher since they
are conducted on the spot in the interviewer-to-person context. The Google Forms application
structured format allows for the self-completing the survey by participants. Also, the survey
application doesn’t allow for data outliers if a structured Likert-style format is used.
The tourist structure of the survey participants by the incoming country suggests that most
of the interviewers are from the former republics of Yugoslavia and countries that are close
neighbors to Serbia, with exception of Turkey and Greece.
Data were anonymously acquired between September of 2018 and May 2019 from the
tourists at the several well-known tourist attractions in Belgrade. Most of the interviews took
place at Kalemegdan Fortress, Knez Mihailova Street and around the Temple of Saint Sava.
These locations were selected based on the interviewers’ previous experience based on the
success ratio between completed interviews and the number of tourists asked to participate.
138
The interviews were conducted using an online Google Form application in the presence of the
interviewers who controlled that data were entered smoothly flawlessly.
Potential candidates for the survey where approached in English and initially screened
for the survey. Those willing to participate were given tablet or phone with ready-to-use Google
Form application for the self-entry. Partially finished surveys where automatically discarded
by the Google Forms which eliminated missing data issues. The answers of the first question
in the survey, which required that participants to type the country of residence in the open “text”
format, were latter standardized in the Excel database by the administrator. This was needed
since participants used many different spelling ways to name their countries of residence. All
other questions where in the structured format.
The number of valid responses collected was n=368. The number of missing entries was
zero since the Google Form doesn’t allow empty fields. Therefore, no missing value corrections
were needed.
7.5. Data Analysis
The survey of Serbia turned out to be very heterogeneous in terms of the number of
countries taking place. The total of 49 countries participated in the survey. The most
participants were from Turkey 12%, followed by Greece 9% and North Macedonia 7%. The
top 51% of the participants come from just 7 countries: Turkey 12%, Greece 9%, North
Macedonia 7%, Bulgaria 6%, Croatia 6%, Montenegro 5% and Slovenia 5%. The participant
structure of the interviews mainly corresponds to the structure of the foreign tourists’ arrivals
in Serbia in 2018. 3
The number of participants from the former Yugoslav republics were 26% with the
highest number of the tourists arriving from North Macedonia 7.34% followed by Croatia
6.25%. From the neighboring countries the number of participants was 28% with the highest
percentage coming from North Macedonia. Since majority of the foreign tourists who visit
Serbia gravitate towards Belgrade (Statistical Yearbook, 2019), in this thesis we can assume
that those who participated in the survey represent tourists visiting Serbia.
The analysis shows that 49% of the participants were between 20 and 29 years of age.
Males outnumbered females 56% to 44% respectively. Nevertheless, there is a good balance
between male and female travelers visiting Serbia. Most of the participants 37% reported that
they work in the private sector, followed by students 21% and those working in public
institutions 20%. The 40% of the participants reported income over $10,000 while 23%
reported income between $10,000 and $20,000. Tourists who visit Serbia are likely to travel
with a friend 42% while 53% reported their marital status as single, see Table 7.2., on page 139.
Students are one-fifth of the total participants interviewed confirming that Belgrade and
Serbia offer good entertainment and value for money. Half of the visitors reported that they are
first time in Serbia showing good balance between those with and without prior tourism
experience with Serbia. In this thesis, Belgrade is considered a representative of Serbia.
3 (in thousands) Bosnia & Herzegovina (121), Bulgaria (100), Turkey (97), Croatia (94),
Slovenia (87), Montenegro (82), Greece (71) and etc. (Statistical Yearbook, 2019, p. 344).

139
Also, one third of the travelers were married couples, half of them with children pointing that
Serbia is interesting and safe country. However, the overall impression is that Serbia is mostly
popular among its immediate neighbors as well as Turkey and Greece. The exceptions are the
tourists from Romania and Hungary. Because of the language difficulties the Chinese tourists,
whose presence dramatically increased in Serbia recently, are absent in the survey.
Table 7.2. Demographic Characteristics
Response N= 368
Frequency Percent
Gender
Female 163 44.29
Male 205 55.71
Total 368 100.00
First Time in Serbia
Yes 191 51.90
No 177 48.10
Total 368 100.00
Marital Status
Married with Children 62 16.85
Married without Children 49 13.32
Single 202 54.89
Divorced 7 1.90
Other 48 13.04
Total 368 100.00
Traveling With
Alone 61 16.58
Friend 155 42.12
Group 2 0.54
Partner 95 25.82
Relative 13 3.53
Spouse 36 9.78
Business Partner 6 1.63
Total 368 100.00
Income
under $10,000 147 39.95
$10,000-$20,000 85 23.10
$20,000-30,000 47 12.77

140
Descriptive statistics, shown in Table 7.3., on page 141, shows skewness, kurtosis, means
and standard deviations for the items of the measurement model for the overall sample (n=368).
The analysis of the descriptive statistics highlights the high difference between mean minimum
and maximum values of 4.46. Also, the difference between median values (not shown in Table
7.3, p.141) is 5.00, which is high. The difference in standard deviation range from 1.69 to 3.21
or maximum 1.52. Standard deviation shows the spread of data. In normal distribution 99% of
data needs to fall within three standard deviations from each side of the mean. If standard
$30,000-$40,000 32 8.70
over $40,000 57 15.49
Total 368 100.00
Occupation
Academic 31 8.42
NGO 4 1.09
Private 136 36.96
Public 72 19.57
Student 79 21.47
Other 46 12.5
Total 368 100.00
Age
Under 20 20 5.43
20-29 181 49.18
30-39 116 31.52
40-49 34 9.24
50-59 13 3.53
Over 60 4 1.09
Total 368 100.00
Country of Residence
Turkey 43 11.68
Greece 33 8.97
Macedonia 27 7.34
Bulgaria 23 6.25
Croatia 23 6.25
Montenegro 19 5.43
Slovenia 19 5.16
Other 180 48.10
Total 368 100.00

141
deviation is close to mean that leads to kurtosis issue which is the case with AW4, AW5 and
AW6 in Table 7.3 on page 141.
The difference in the values of skewness are under 1.52 with no extremes over (+/-) 2.00
threshold, showing acceptable levels. The kurtosis values range from -1.03 to 3.34, suggesting
kurtoses issue in some responses. Since, there is only one item with extreme kurtosis value of
3.34 and the skewness value just over the 2.00 threshold, we can assume data as acceptable.
Overall, the (n=368) survey data is considered normally distributed and suitable for multivariate
analysis.
Table 7.3. Descriptive Statistics
Items Mean SD SK KUR
Destination Brand Awareness
AW1. Serbia has a good name and reputation 7.49 2.09 -0.66 0.19
AW2. Serbia is a famous destination 6.32 2.62 -0.28 -0.83
AW3. Characteristics of Serbia come to my mind
quickly
6.92 2.52 -0.58 -0.50
AW4. When I am thinking of travelling, Serbia
comes to my mind quickly
5.88 2.94 -0.21 -1.01
AW5. Do you see ads on Serbia often 4.18 3.21 0.37 -1.03
AW6. Is Serbia a popular destination 5.53 2.80 0.05 -0.97
Destination Brand Image
IM1. Serbia fits my personality 7.52 2.22 -0.84 0.29
IM2. My friends will think highly of me if I visit
Serbia
6.59 2.50 -0.58 -0.09
IM3. Visiting Serbia reflects who I am 6.52 2.62 -0.59 -0.21
IM4. Serbia offers relaxing atmosphere 7.75 2.19 -0.93 0.43
IM5. Serbia offers excellent entertainment 7.82 2.10 -1.07 1.37
Destination Brand Quality
Q1. Quality of services in Serbian tourism is in
general high
7.04 2.11 -0.74 0.64
Q2. Serbia provides high quality experience 7.15 1.96 -0.47 0.27
Q3. Serbia is superior as a tourism destination 6.05 2.52 -0.14 -0.80
Q4. Serbia performs better than expected 7.27 2.17 -0.77 0.11
Destination Brand Loyalty
LO1. I enjoy visiting Serbia 8.64 1.74 -1.46 2.23
LO2. Serbia is my preferred choice for vacation 5.97 2.77 -0.32 -0.77
LO3. I am emotionally attached to Serbia 6.23 3.20 -0.52 -0.87
LO4. I will advise other people to visit Serbia 8.11 2.08 -1.39 2.17
LO5. I will visit Serbia again 8.39 2.30 -1.87 3.34
Destination Socio-Economic Sustainability
VA1. Serbia has reasonable prices 8.54 1.69 -1.25 1.21

142
VA2. Comparing to other destinations visiting Serbia
is good value-for-money
8.29 1.70 -0.97 0.39
Destination Social Sustainability
SO1. Staff in restaurants, hotels and stores are very
friendly
8.19 1.88 -1.22 1.41
SO2. I like behavior of other tourists 7.38 1.95 -0.65 0.6
SO3. I feel safe in Serbia 7.82 2.05 -1.15 1.38
Destination Economic Sustainability
EC1. I noticed that investments are made to attract
tourists
6.70 2.41 -0.62 -0.07
EC2. Serbia has good infrastructure 6.42 2.33 -0.62 -0.05
EC3. Serbia can make money from tourism 8.08 2.00 -1.33 2.10
Destination Environmental Sustainability
EN1. Level of pollution in Serbia is acceptable 6.74 2.33 -0.72 0.33
EN2. Level of smell in Serbia is acceptable 7.11 2.21 -0.74 0.32
EN3. Level of noise in Serbia is acceptable 7.24 1.97 -0.48 -0.15
EN4. Crowd levels are acceptable in Serbia 7.57 1.86 -0.88 1.13
EN5. Serbia has visible practice in maintaining
environment
6.48 2.31 -0.57 -0.06
SD=Standard deviation; SK=Skewness; KUR=Kurtosis
7.6. Multivariate Analysis
The exploratory factor analysis (EFA), provided by SPSS application version 21, using
Principal Component Analysis (PCA) method with Promax and Kaiser Normalization rotation
and eigenvalue greater-than-one criteria, resulted in extraction of 5 factors which accounted for
the total of 71.5% of the sum of square loading variances explained. The EFA reduced the
number of variables from the original 33 to 21, see Table 8.4.
Table 7.4. Measurement Model
Factors D N SL CA VE% CR AVE
Destination Image &Loyalty 3 0.83 40.06 0.82 0.61
Fits personality IM1 0.823
Impression on friends (a) IM2
Reflects who I am IM3 0.742
Relaxing atmosphere (a) IM4
Excellent entertainment (a) IM5
Like visiting Serbia (a) LO1
Preferred choice (a) LO2
Emotionally attached (b) LO3 0.757
Recommend Serbia LO4 0.748
Revisit Serbia LO5 0.767
Destination Awareness 2 0.88 12.28 0.86 0.76

143
Name and reputation (a) AW1
Famous destination AW2 0.879
Recall (a) AW3
Top-of-mind awareness (b) AW4 0.655
Ads on Serbia AW5 0.830
Popular destination(b) AW6 0.898
Environmental Sustainability 2 0.82 8.56 0.77 0.63
Level of pollution (b) EN1 0.717
Level of smell EN2 0.899
Level of noise EN3 0.868
Crowd levels (b) EN4 0.641
Maintaining environment (a) EN5
Destination Quality 3 0.86 5.65 0.82 0.61
Quality of service Q1 0.834
Quality of experience Q2 0.741
Superior experience Q3 0.721
Exceeds expectations (b) Q4 0.786
Socio-Economic
Sustainability
2 0.83 4.94 0.84 0.72
Reasonable prices VA1 0.908
Value for money VA2 0.852
Social Sustainability 0
Friendly staff (a) SO1
Behavior of tourists (a) SO2
Safety (a) SO3
Economic Sustainability 0
Investments (a) EC1
Infrastructure (a) EC2
Can make money (a) EC3
Total variance explained 71.51 TD tourism destination; D dimensions (AW awareness, IM image, Q quality, LO loyalty, SO social, EC
economic, EN environmental); N number of extracted items; SL standardized loadings; CA Cronbach’s alpha;
VE variance explained; N number of variables after CFA; CR composite reliability; AVE average variance
extracted;(a) items deleted after EFA; (b) items deleted after CFA.
The Kaiser-Meyer-Olkin test of sampling adequacy of 0.893 is significantly above the
threshold of 0.5, indicates good internal consistency while Bartlett’s Test of Sphericity is
significant (p<0.001) suggesting that data is suitable for factor analysis (Field, 2009). The
Cronbach’s Alpha of 0.911, is significantly higher then the threshold of 0.7 which confirms
good internal reliability of data and pointing that correlation matrix is suitable for factor
analysis.
The first factor, which explains 40.06% of variance, is named as “destination image and
loyalty”. The factor has dual features of destination loyalty and image. It reflects the intention
to recommend, revisit, and emotional attachment on the loyalty side, while at the same time, it

144
supports personality and self-identity on the image side, see Table 7.4., on page 142. The 0.831
Cronbach’s Alpha suggests good internal reliability of the factor. The findings confirm the
earlier research that destination personality and self-identity form image associations while
intention to revisit, recommend and emotional attachment to destination form loyalty
association.
The second factor, marked as “destination awareness”, accounts for 12.28% of the
variances. It reflects tourists’ strength of information about the destination. The 0.876
Cronbach’s Alpha indicates a very good level of internal reliability, see Table 7.4., on page 142.
The factor consists of four exogenous variables such as famous destination, top-of-mind
awareness, advertising, and popularity. The findings are consistent with the previous research
of destination awareness which supports, recognition, recall, top-of-mind awareness, and
knowledge (Im et al., 2012).
Environmental sustainability is the third factor with 8.56% of the variances explained. It
includes tourists’ perception of the features that contribute to the overall experience of the
environmental sustainability. Those observable features are pollution, smell, noise, crowding,
and maintenance. The 0.818 Cronbach’s Alpha indicates very good internal reliability. The
findings are in line with the previous research literature and arguments.
The fourth factor accounts for 5.65% of the variances explained. It is denoted as
“destination quality”. The factor consists of four observable variables: service quality,
experience, superiority, and expectation. All the variables are supported by the research
literature on tourism destinations. The Cronbach’s Alpha is 0.861 which shows acceptable
internal reliability.
The final factor is marked as socio-economic with 4.94% of the variances explained. The
Cronbach’s Alpha of 0.832 shows good internal reliability. The factor drawn from the two
observable variables: “reasonable prices: and “good value for money”. This factor is used in
the research literature to improve the proposed models. In this thesis it is considered as a stand-
alone factor, however, it can be considered as a part of both the social and economic domain.
In this thesis, the “value-for-money” and “|reasonable prices” constructs are recognized as
observable social and economic variables respectfully. Reasonable prices is based on the ratio
between price and from the benefit derived from “get” and “give” while value-for-money is
based on the utility derived from the products ability to increase social concepts (Sweeney &
Soutar, 2001). Both variables are engaged in the synergy relationship that creates a latent
(higher-order) variable “socio-economic” that will represent them in the analysis.
Measurement model analysis (CFA) did not confirm goodness-of-fit (GOF) for the first
element of the social sustainability: friendliness, safety and behavior of tourists, however, it has
confirmed GOF for the of socio-economic element. At last, the CFA did not confirm the
elements of economic sustainability: investments, infrastructure and making money from
tourism. In both instances, the conclusion is that foreign tourists could not develop strong
perception of the Serbian economy and its social structure based on trust and power. However,
international tourists pay significant attention on the perception of benefits, costs and social
interaction. This is a valuable information that all relevant stakeholders in Serbia can use as a
bases for the development of destination management, marketing and development strategies.
The correlations matrix in Table 7.5. suggests no multicollinearity. The matrix shows
poor correlation between destination awareness and destination socio-economic sustainability.

145
Table 7.5. Component Correlation Matrix
Component Quality Awareness Image &
Loyalty
Environment Socio-
Economic
Quality 0.782
Awareness 0.485 0.871
Image & Loyalty 0.590 0.521 0.783
Environment 0.461 0.233 0.351 0.796
Socio-Economic Sust. 0.359 0.072 0.366 0.312 0.850 Values in bold show AVE levels; Non-diagonal values show correlations between model elements produced by
Principal Component Analysis with Promax and Kaiser Normalization rotation using AMOS.
The reliability, discriminant and convergent validity are confirmed, as shown in Table
7.6. Composite reliability (CR) shows an acceptable range (CR>0.7) between 0.775 and 0.862,
suggesting a good internal consistency of data. Convergent validity is analyzed by average
variance extracted index (AVE), which shows values between 0.612 and 0.758 (Table 7.6.)
which is greater than 0.5 threshold (Hair et al., 2010). The discriminant validity is confirmed
based on the measurement of maximum shared variance (MSV) and average shared variance
(AVE). For all constructs the ASV is lower than MSV which confirms discriminant validity.
Table 7.6. Reliability, Convergent and Discriminatory Validity Matrix
CR AVE MSV ASV
Quality 0.825 0.612 0.566 0.361
Awareness 0.862 0.758 0.305 0.163
Image & Loyalty 0.823 0.613 0.566 0.298
Environment 0.775 0.633 0.281 0.150
Socio-Economic Sust. 0.838 0.723 0.295 0.173 CR composite reliability; AVE average variance extracted; MSV maximum shared variance; ASV averaged
shared variance
7.7. Measurement Model Analysis
Confirmatory factor analysis (CFA), conducted in AMOS, version 23 software package,
further reduced the number of variables from 21 to 12 as a part of the empirical testing of the
measurement model (Hair, et al., 2010), see Table 7.4., p.142. The goodness-of-fit statistics
shows that all parameters are within the recommending values (Table 7.7., p. 146). Based on
the measurement model data presented in Table 7.4., page 142, the diagram of the measurement
model is constructed using AMOS, version 23, in Figure 7.2., page 146.

146
Figure 7.2. Measurement Model Case of Serbia (AMOS, v.23)
Table 7.7. Goodness-of-Fit Statistics
Measurement indicator (Threshold Value) RV SV
Absolute Fit Measures
CMIN Chi-square/df <3 good; <5 sometimes permissible <3 2.443

147
p value p value for the model >0.05 0.000
GFI Goodness-of-fit Index >0.90 0.955
AGFI Adjusted Goodness-of-Fit Index >0.90 0.919
SRMR Standardized Root Mean Square Residual <0.08 0.037
CFI Comparative Fit Index, ideally over 0.95 >0.90 0.970
TLI Tucker-Lewis Index >0.90 0.955
Parsimony-Adjusted Measures
PCLOSE P of close fit >0.05 0.079
RMSEA Root Mean Square Error of Approximation
<0.05 good; 0.05 to 0.10 moderate; > 0.10 bad
0.063
RV recommended value; SV statistical value.
All fit statistics show values above recommended thresholds except for the p value
(Table 7.7., p. 146). Since the p values are sensitive to the survey size it would be difficult to
get p value higher than 0.0 (Brown, 2006). The standardized loadings are all above 0.5.
Since all other indexes are meeting the cut-off requirements the measurements show a robust
fit between the estimated and proposed model (Hu & Bentler, 1998; Steenkamp &
Baumgartner, 2000).
7.8. Structural Equation Modeling
To evaluate the causal relationships among the components of the adopted paradigme
and to test the hypotheses the path model analysis, is considered. The two scenario SEM
analysis is employed to confirm the stated hypotheses.
In each scenario the model is analyzed from the perspective of a different predictor or
exogenous construct in order to capture and highlight the hypothesized paths in the model. In
the first scenario, socio-economic sustainability construct is used as a predictor while in the
second scenario environmental sustainability construct takes the predictor’ role. The economic
factor, which is left out by CFA, see Table 7.4., p. 142. However, the economic impact can
still be analyzed using the socio-economic element. That means that in SEM analysis
destination sustainability will be represented by socio-economic and environmental elements.
In the SEM analysis predictor is an exogenous construct that acts as an independent
variable. In the SEM diagram, the “independent variable” is depicted by arrows pointing away
from the predictor to other constructs in the model.
7.8.1. Scenario 1: Socio-Economic Construct as Predictor
In the first scenario the estimated model consists of the five constructs with socio-
economic sustainability as the predictor element, environmental sustainability, destination
loyalty and destination image as a joint construct, destination awareness and destination quality,
Figure 7.1., p. 134 . The joint construct formed by destination image and loyalty is represented
by three variables: fits-my-personality, recommend and revisit Serbia.
The predictor element is defined by two observable variables: reasonable prices and
value-for-money, see Table 7.4., p 142. The predictor construct acts as an independent variable
that predicts value of other constructs in the model. The path analysis of the model in Figure

148
7.2., page 146, reveals the following hypotheses: H3, H4, H5, H6, H7, H8, H9, H10, H11, H12,
H13 and H14.
Figure 7.3. Social and Economic Sustainability Construct as Predictor
The estimated model shows that socio-economic sustainability element as the most
dominant as it impacts all other elements in the model. The impact of the social-economic
element is most obvious on destination loyalty and image (0.42) and environmental
sustainability (0.37).
All path estimates shown in Figure 7.1, page 134, are all statistically significant at p
values lower than 0.001 and 0.05. The path analysis, shown in Figure 7.2., page 146, confirms
twelve (12) hypothesized relations and shows very good goodness-of-fit criteria, as shown in
Table 7.8 on page 148.
0.42 (p<0.001)
0.19 (p<0.003) 0.35 (p<0.001)
-0.24 (p<0.002)
-0.24 (p<0.01)
0.40 (p < 0.001)
0.57 (p < 0.05)
0.22 (p<001)
0.37 (p<0.001)
0.19 (p < 0.009)
Socio-Economic
Sustainability
Environmental Sustainability
Destination
Awareness
Destination
Quality
Destination
Image &
Loyalty
H5
H11
H9, H10
H6, H7, H12, H13
H8, H14
H3, H4

149
Table 7.8 Goodness-of-Fit Statistics Case of Serbia Case
Measurement indicator (Threshold Value) RV SV
Absolute Fit Measures
CMIN Chi-square/df <3 good; <5 sometimes permissible <3 1.913
P p value for the model >0.05 0.000
GFI Goodness-of-fit Index >0.90 0.965
AGFI Adjusted Goodness-of-Fit Index >0.90 0.938
SRMR Standardized Root Mean Square Residual <0.08 0.035
CFI Comparative Fit Index, ideally over 0.95 >0.90 0.979
TLI Tucker-Lewis Index >0.90 0.969
Parsimony-Adjusted Measures
PCLOSE P of close fit >0.05 0.483
RMSEA Root Mean Square Error of Approximation
<0.05 good; 0.05 to 0.10 moderate; > 0.10 bad
0.05
RV recommended value; SV statistical value.
The goodness of fit statistics in Table 7.8 shows good overall measures with all indexes
satisfying fully the recommended thresholds. All indexes are showing good values except for
the p value which is difficult to get recommended values of over 0.05 because of the sample
size.
The path analysis in Figure 7.3., on page 148, confirms findings in the research literature
(Nunkoo & Ramkinssoon, 2011; Andereck et al., 2011; Ward & Berno, 2011; Latkova & Vogt,
2012), that social and economic dimensions have significant influence on the destination brand
equity dimensions. The path analysis shows statistically significant relations with destination
image, destination loyalty, destination awareness and destination quality, capturing the essence
of the thesis that destination sustainability has positive impact on destination brand equity (H1)
and, consequently, that any development of the tourism destination, including development of
destination brand equity is done under the umbrella of social and economic sustainability,
therefore, contributing to the confirmation of hypothesis (H2).
As this thesis uses historical data in the statistical analysis, the thesis confirms that these
two processes, sustainability development and destination brand equity development which are
taking place as parallel activities are inseparable and highly correlated.
Furthermore, the path analysis could not confirm the statistically significant relationship
between economic sustainability on all destination brand equity elements shown in Figure 8,1a,
p…. Also, the path analysis confirms the indirect (moderating) effects of social and economic
sustainability on destination awareness and quality elements through destination image and
loyalty constructs. There is also indirect effect of social and economic sustainability on all
elements of the destination brand equity.
Both direct and indirect effects confirm that social sustainability and economic
sustainability have significant impact on the elements of destination brand equity supporting
the confirmation of H1 and H2.
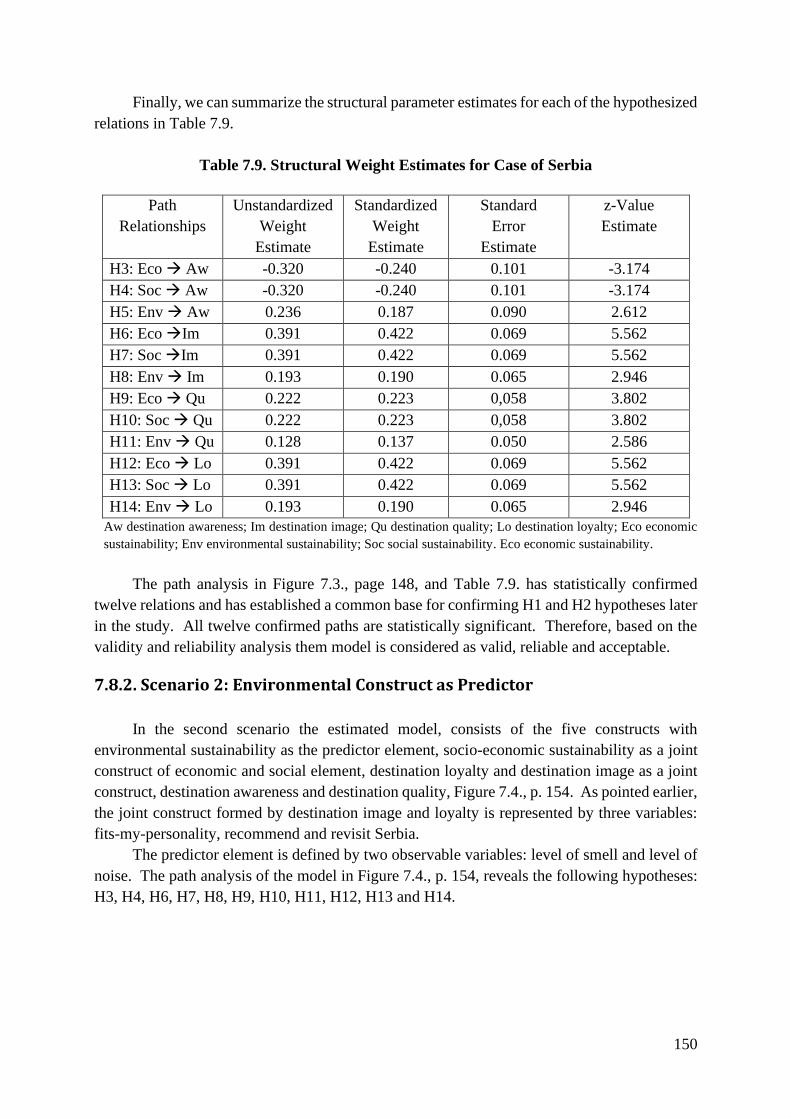
150
Finally, we can summarize the structural parameter estimates for each of the hypothesized
relations in Table 7.9.
Table 7.9. Structural Weight Estimates for Case of Serbia
Path
Relationships
Unstandardized
Weight
Estimate
Standardized
Weight
Estimate
Standard
Error
Estimate
z-Value
Estimate
H3: Eco → Aw -0.320 -0.240 0.101 -3.174
H4: Soc → Aw -0.320 -0.240 0.101 -3.174
H5: Env → Aw 0.236 0.187 0.090 2.612
H6: Eco →Im 0.391 0.422 0.069 5.562
H7: Soc →Im 0.391 0.422 0.069 5.562
H8: Env → Im 0.193 0.190 0.065 2.946
H9: Eco → Qu 0.222 0.223 0,058 3.802
H10: Soc → Qu 0.222 0.223 0,058 3.802
H11: Env → Qu 0.128 0.137 0.050 2.586
H12: Eco → Lo 0.391 0.422 0.069 5.562
H13: Soc → Lo 0.391 0.422 0.069 5.562
H14: Env → Lo 0.193 0.190 0.065 2.946
Aw destination awareness; Im destination image; Qu destination quality; Lo destination loyalty; Eco economic
sustainability; Env environmental sustainability; Soc social sustainability. Eco economic sustainability.
The path analysis in Figure 7.3., page 148, and Table 7.9. has statistically confirmed
twelve relations and has established a common base for confirming H1 and H2 hypotheses later
in the study. All twelve confirmed paths are statistically significant. Therefore, based on the
validity and reliability analysis them model is considered as valid, reliable and acceptable.
7.8.2. Scenario 2: Environmental Construct as Predictor
In the second scenario the estimated model, consists of the five constructs with
environmental sustainability as the predictor element, socio-economic sustainability as a joint
construct of economic and social element, destination loyalty and destination image as a joint
construct, destination awareness and destination quality, Figure 7.4., p. 154. As pointed earlier,
the joint construct formed by destination image and loyalty is represented by three variables:
fits-my-personality, recommend and revisit Serbia.
The predictor element is defined by two observable variables: level of smell and level of
noise. The path analysis of the model in Figure 7.4., p. 154, reveals the following hypotheses:
H3, H4, H6, H7, H8, H9, H10, H11, H12, H13 and H14.

151
Figure 7.4. Environmental Construct as Predictor
The estimated model shows that socio-economic sustainability, as a moderating element,
is the most dominant as it impacts all other destination brand equity elements in the model.
The impact of the social and economic element is most obvious on destination loyalty and
image (0.4), destination quality (0.36) destination awareness (-0.28). Negative relationship
between social and economic sustainability and destination awareness can be explained by
looking more closely to the corresponding observable variables. The destination awareness is
defined by “level of smell” and “level of noise” variables. Their increase can obviously cause
deterioration of the value-for-money and price levels causing the perception value of the social
and economic sustainability to decrease.
Environmental sustainability constructs show direct impact on destination image and
loyalty (0.22), destination quality (0.43) and social sustainability (0.36)
0.43 (p < 0.001) -0.22 (p < 0.001)
-0.28 (p < 0.001)
-0.24 (p < 0.001)
0.64 (p < 0.001)
0.75 (p < 0.001)
0.38 (p < 001)
0.36 (p < 0.001)
Socio-Economic
Sustainability
Environmental Sustainability
Destination
Awareness
Destination
Quality
Destination
Image &
Loyalty
H11
H9, H10
H6, H7, H12, H13
H8, H14
H3, H4

152
All path estimates shown in Figure 7.4., page 154, are all statistically significant at p
values lower than 0.001 and 0.05. The path analysis confirms seven hypothesized relations and
shows very good goodness-of-fit criteria, as shown in Table 7.10.
Table 7.10. Goodness-of-Fit Statistics - Case of Serbia
Measurement indicator (Threshold Value) RV SV
Absolute Fit Measures
CMIN Chi-square/df <3 good; <5 sometimes permissible <3 2.461
P p value for the model >0.05 0.000
GFI Goodness-of-fit Index >0.90 0.951
AGFI Adjusted Goodness-of-Fit Index >0.90 0.917
SRMR Standardized Root Mean Square Residual <0.08 0.042
CFI Comparative Fit Index, ideally over 0.95 >0.90 0.966
TLI Tucker-Lewis Index >0.90 0.951
Parsimony-Adjusted Measures
PCLOSE P of close fit >0.05 0.068
RMSEA Root Mean Square Error of Approximation
<0.05 good; 0.05 to 0.10 moderate; > 0.10 bad
0.063
RV recommended value; SV statistical value.
The goodness of fit statistics in Table 7.10 shows almost perfect overall measures with
all indexes satisfying fully the recommended thresholds, except for the p value.
The path analysis in Figure 7.4., on page 154, confirms findings in the research literature,
that environment dimension has significant influence on the destination brand equity
dimensions (Nunkoo & Ramkinssoon, 2011; Andereck et al., 2011; Ward & Berno, 2011;
Latkova & Vogt, 2012).
The path analysis shows statistically significant relations between environmental
sustainability with destination image, destination loyalty and destination quality but not with
destination awareness. However, social and economic sustainability, as predicted constructs
by environmental element, show impact on all destination brand equity elements, confirming
findings from the Figure 7.3., p. 148, in Scenario 1.
Thus, capturing the essence of the thesis that destination sustainability has positive impact
on destination brand equity (H1) and, consequently, that any development of the tourism
destination, including destination brand equity is done under the social sustainability, hence,
confirmation of hypothesis (H2).
As this thesis uses empirical data in the statistical analysis, the thesis suggests that these
two processes, sustainability development and destination brand equity development which are
taking place as joined parallel activities are inseparable and highly correlated.
Furthermore, the path analysis could not confirm the statistically significant relationship
of environmental sustainability on destination awareness as shown in Figure 7.4., p 151. Also,
the path analysis confirms the indirect (moderating) effects of social and economic
sustainability on elements of the destination brand equity.

153
Both direct and indirect effects confirm that social sustainability and economic
sustainability have significant impact on the elements of destination brand equity, therefore,
contributing to confirmation of H1 and H2.
Finally, we can summarize the structural parameter estimates for each of the hypothesized
relations in Table 7.11.
Table 7.11. Structural Weight Estimates for Serbia
Path
Relationships
Unstandardized
Weight
Estimate
Standardized
Weight
Estimate
Standard
Error
Estimate
z-Value
Estimate
H4: Eco → Aw -0.360 -0.277 0.097 -3.708
H4: Soc → Aw -0.360 -0.277 0.097 -3.708
H6: Eco →Im 0.482 0.431 0.075 6.437
H7: Soc →Im 0.482 0.431 0.075 6.437
H8: Env→Im 0.230 0.219 0.068 3.384
H9: Eco → Qu 0.389 0.381 0.058 6.723
H10: Soc → Qu 0.389 0.381 0.058 6.723
H11: Env → Qu 0,171 0.178 0.051 3.353
H13: Eco → Lo 0.482 0.431 0.075 6.437
H13: Soc → Lo 0.482 0.431 0.075 6.437
H14: Env→ Lo 0.230 0.219 0.068 3.384
Aw destination awareness; Im destination image; Qu destination quality; Lo destination loyalty; Eco
economic sustainability; Env environmental sustainability; Soc social sustainability
The analysis in Figure 7.4., page 151, and Table 7.11 has statistically confirmed eleven
(11) relations and has established a common base for confirming H1 and H2 hypotheses later
in the study. All eleven confirmed paths are statistically significant. Therefore, latent variables
in the proposed paradigm are empirically considered as valid, reliable and acceptable.
In case when there are strong loadings between the elements in the structural path analysis
there is possibility of the existence of a higher-order common factor (Byrne, Baron, Larsson, &
Melin, 1995; KonecnIk & Gartner, 2007; Iniesta-Bonillo et al., 2016). Therefore, the causal
paths between the second-order factor destination brand equity and the lower-order elements
destination awareness, destination image & loyalty and destination quality are significant at the
0.001 probability level (Figure 7.5., page 154).
The second order common element destination sustainability is constituted by two latent
dimensions: socio-economic and environmental sustainability. As a result, there is a
confirmation of the H1 hypothesis.
Also, the path analysis reveals direct and indirect mediating impact of the environmental
sustainability on destination brand equity. The indirect effect is created by socio-economic
sustainability element. The path analysis confirms statistically significant regression weights
or correlation factors between environmental (0.36) and socio-economic (0.42) and destination
brand equity.

154
Figure 7.5. Second-Order Standardized Path Estimates: Destination Brand Equity
The goodness-of-fit thresholds for the estimated path analysis in Figure 7.5., on page 154,
are confirmed in Table 7.12. The measurement indicators in Table 7.12 show good fit between
the proposed and estimated model. The p value is highly sensitive to the sample size; therefore,
it is difficult to expect values higher than zero. PCLOSE is also below its threshold value of
0.05 but higher than zero. Other measures are in the recommended ranges and contribute to the
statistical significance of the model.
Table 7.12. Second-Order Measurement
Measurement RV SV
Absolute Fit Measures
CMIN Chi-square/df <3 good; <5 sometimes permissible <3 2.866
P p value for the model >0.05 0.000
0.79 (p < 0.04)
0.97 (p < 0.001)
0.42 (p<0.001)
0.37 (p < 0.001)
0.56 (p < 0.001)
0.36 (p < 0.001)
Destination
Brand Equity
Destination Image &
Loyalty
Destination
Awareness
Environmental Sustainability
Destination Quality
Socio-Economic
Sustainability
H1
H1

155
GFI Goodness-of-fit Index >0.90 0.944
AGFI Adjusted Goodness-of-Fit Index >0.90 0.908
SRMR Standardized Root Mean Square Residual <0.08 0.054
CFI Comparative Fit Index, ideally over 0.95 >0.90 0.958
TLI Tucker-Lewis Index >0.90 0.942
Parsimony-Adjusted Measures
PCLOSE P of close fit >0.05 0.006
RMSEA Root Mean Square Error of Approximation
<0.05 good; 0.05 to 0.10 moderate; > 0.10 bad
0.071
RV recommended value; SV statistical value.
Finally, we can summarize the structural parameter estimates for each of the hypothesized and
significant relations in Table 7.13.
Table 7.13. Structural Weight Estimates for Second-Order Path Analysis
Path
Relationships
Unstandardized
Weight
Estimate
Standardized
Weight
Estimate
Standard
Error
Estimate
z-Value
Estimate
H1: ENV→ BE 0.272 0.358 0.061 6.756
H1: SOC-ECO →BE 0.332 0.417 0.062 5.352 ENV environment; BE destination brand equity; SOC socio-economic sustainability.
As said earlier, the H1 hypothesis is confirmed since elements of the destination
sustainability, represented by environmental, economic and social sustainability, have
statistically significant impact on the destination brand equity. In addition, the path analysis in
Figure 7.5., on page 154, the diagram highlights the significant and important mediating role of
the --socio-economic element.
. Also, the path analysis points that the increase of the socio-economic value increases
the value of the brand equity.
The correlations matrix in Table 7.14, suggests no multicollinearity. Also, the matrix
shows acceptable correlations between components.
Table 7.14. Component Correlation Matrix
Component Environment Brand
Equity
Socio-
Economic
Environment 0.797
Brand Equity 0.511 0.791
Socio-Economic 0.368 0.548 0.852 Values in bold show AVE levels; Non-diagonal values show correlations between
model elements produced by Principal Component Analysis with Promax and
Kaiser Normalization rotation using AMOS.
The reliability, discriminant and convergent validity are confirmed, as shown in Table
7.15, on page 156. Composite reliability (CR) shows an acceptable range (CR>0.7) between
0.840 and 0.776, suggesting a good internal consistency of data. Convergent validity is
analyzed by average variance extracted index (AVE), which shows values between 0.726 and

156
0.626 (Table 7.15) which is greater than 0.5 threshold The discriminant validity is confirmed
based on the measurement of maximum shared variance (MSV) and average shared variance
(AVE). ASV is lower than MSV which confirms discriminant validity.
Table 7.15. Reliability, Convergent and Discriminatory Validity Matrix
CR AVE MSV ASV
Environment 0.776 0.635 0.261 0.198
Brand Equity 0.828 0.626 0.300 0.281
Socio-Economic Sust. 0.840 0.726 0.300 0.218 CR composite reliability; AVE average variance extracted; MSV maximum shared variance; ASV averaged
shared variance;
Good relation between socio-economic sustainability (socio-economic) and
environmental sustainability (0.37), see Figure 7.5., on page 154, shows possibility for
constructing a higher-order element destination sustainability. The Figure 7.6., on page 157,
presents the structural path diagram showing significant correlation between destination brand
equity and destination sustainability. The correlation value or regression weight of 0.87
suggests that both elements, destination brand equity and sustainability, are inseparable
confirming the hypothesis that the two constructs in the long run become one (H2). Further the
path analysis of the same diagram confirms the earlier findings (Figure, 7.2., p. 81), 7.3 (p.97)
and 8.4 (p.84) that destination sustainability imposes a statistically significant impact to
destination brand equity. In practical terms, if sustainability goes up by 1.0 the brand equity
goes up by 0.87. Therefore, the path analysis in Figure 7.6., p.157, confirms almost identical
nature of destination sustainability and destination brand equity by testing the strength and
direction of the impact.
Consequently, the analysis supports the H1 and H2 hypotheses (Table 7.17, p. 157).
Table 7.16. Second-Order Evaluation
Measurement Values RV SV
Absolute Fit Measures
CMIN Chi-square/df <3 good; <5 sometimes permissible <3 2.866
P p value for the model >0.05 0.000
GFI Goodness-of-fit Index >0.90 0.944
AGFI Adjusted Goodness-of-Fit Index >0.90 0.908
SRMR Standardized Root Mean Square Residual <0.08 0.054
CFI Comparative Fit Index, ideally over 0.95 >0.90 0.958
TLI Tucker-Lewis Index >0.90 0.942
Parsimony-Adjusted Measures
PCLOSE P of close fit >0.05 0.006
RMSEA Root Mean Square Error of Approximation
<0.05 good; 0.05 to 0.10 moderate; > 0.10 bad
0.071
RV recommended value; SV statistical value.
The goodness-of-fit thresholds for the estimated path analysis in Figure 7.6., p. 157, are
confirmed in Table 7.16., p. 159. The measurement indicators show good fit between the

157
proposed and estimated model. The p value is highly sensitive to the sample size; therefore, it
is difficult to expect values higher than zero. PCLOSE is also below its threshold value of 0.05
but higher than zero. Other measures are in the recommended ranges and contribute to the
statistical significance of the model. The values in Table 7.16., on page 159, are the same as
those in Table 7.12., on page 154, since the same measurement model is used.
Figure 7.6. Two Second-Order Estimates: Brand Equity and Sustainability
Finally, the structural parameter estimates for each of the hypothesized and significant
relations are summarized in Table 7.17.
Table 7.17. Structural Weight Estimates for Second-Order Path Analysis
Path
Relationships
Unstandardized
Weight
Estimate
Standardized
Weight
Estimate
Standard
Error
Estimate
z-Value
Estimate
H1: SUS → BE 1.134 0.873 0.222 5.106
H2: SUS & BE 1.134 0.873 0.222 5.106 SUS destination sustainability; BE destination brand equity; SUS & BE destination sustainability and brand
equity in the long run.
0.59 (p < 0.001)
0.63 (p < 0.001)
0.87 (p < 0.001)
0.97 (p < 0.001)
0.79 (p < 0.001)
0.56 (p < 0.001)
Destination
Sustainability
Destination Image &
Loyalty
Socio-Economic Sustainability
Destination Quality
Destination Awareness
Destination Brand Equity
Environmental
Sustainability

158
7.9. Hypotheses Analysis Summary
Table 7.18. Confirmation of the Hypotheses
Path
Relationships
Global Case Serbia Case Diagram in Figure
H1: SUS →BE confirmed confirmed 6.6, 6.7, 7.5, 7.6
H2: SUS & BE confirmed confirmed 6.7, 7.6
H3: Eco → Aw not confirmed confirmed 7.3, 7.4, 6.5
H4: Soc → Aw confirmed confirmed 6.3,7.3,7.4
H5: Env → Aw confirmed confirmed 6.4, 6.5, 7.3
H6: Eco →Im not confirmed confirmed 7.4,6.5
H7: Soc →Im confirmed confirmed 6.3, 6.4,7.3, 7.4
H8: Env →Im confirmed confirmed 6.4, 7.3, 7.4
H9: Eco → Qu not confirmed confirmed 7.3, 7.4, 6.5
H10: Soc → Qu confirmed confirmed 6.3, 6.4, 6.5, 7.3, 7.4
H11: Env → Qu confirmed confirmed 6.3, 6.4, 6.5, 7.3, 7.4
H12: Eco → Lo confirmed confirmed 7.3, 7.4, 6.5
H13: Soc → Lo confirmed confirmed 6.3, 6.4, 6.5, 7.3, 7.4
H14: Env → Lo not confirmed confirmed 7.3, 7.4, 6.5
SUS sustainability; BE brand equity, Aw awareness; Im image; Qu quality; Lo loyalty; Eco economic
sustainability; Env environmental sustainability; Soc social sustainability; SUS sustainability; BE destination
brand equity.
7.10. Results Summary
The final outcomes are shown in Table 7.18., with 4 unconfirmed hypotheses: H3, H6,
H9 and H14 in the global case, and all confirmed hypotheses in the case of Serbia. The
following is individual assessment of each hypothesis.
H1: There is a significant positive impact of tourism destination sustainability on
tourism destination brand equity (Global: confirmed; Serbia: Confirmed)
Global Case: The hypothesis H1 is considered confirmed based on the findings in the study
that majority of the elements of sustainability: economic, social and environmental have impact
on destination brand equity. The study confirmed dominant role of the social element since it
impacts all of the destination brand equity elements in both cases. Yet, impact of the economic
element could not be confirmed on awareness H3, image H6 and quality H9 while
environmental element could not be confirmed on loyalty H14. The latter suggest that
environmental construct, which is represented by the two observable variables representing
pollution, could not be related to loyalty element represented by country index and nations
brand. Therefore, besides H1 and H2, eight other hypotheses are confirmed, making the total
of 8 confirmed hypotheses.

159
Serbia Case: Based on the same criteria applied in the global case, the hypothesis H1 and H2
are considered confirmed. Also, 12 remaining hypotheses between H3 and H14 are confirmed
making the total of 14 confirmed hypotheses. All three, social, economic and environmental
sustainability elements exhibited the most impact on the destination brand equity elements.
H2: Tourism destination sustainability development and tourism destination brand
equity development are two parallel processes that merge to become one process in the
long run. (Global: Confirmed; Serbia: Confirmed)
Global Case: The hypothesis H2 is considered confirmed since the analysis in Figure 6.3., p.
117, shows that the second order elements representing destination sustainability and
destination brand equity are highly correlated (0.92), meaning that destination sustainability
element substantially explains the destination brand equity and vice-versa, confirming that in
the long run both elements move in the same direction, have equal intensity and substance.
Serbia Case: The same is confirmed in the Figure 6.3., p. 117.
The following are analysis of hypotheses for the individual constructs in the global and case of
Serbia scenarios.
H3: Economic sustainability has a positive impact on the destination awareness.
(Global: Not Confirmed; Serbia: Confirmed)
Global Case: The hypothesis H3 is not confirmed. The economic construct, based on the
observable variables: arrivals, expenditure and number of international meetings, did not
produce statistically significant relationships with most of the destination brand equity elements
including awareness.
Serbia Case: The hypothesis H3 is confirmed. Statistically economic construct, as a part of
joined socio-economic construct has significant relation with the destination awareness as
shown in Figure 7.4., p. 151 and Figure 7.5., p. 154.
H4: Social sustainability has a positive impact on the destination awareness. (Global:
Confirmed; Serbia: Confirmed)
Global Case: The hypothesis H4 is confirmed. The social construct, based on the observable
variables: government effectiveness, competitiveness index and using internet for B2B,
produced statistically significant relationships with all destination brand equity elements
including awareness.
Serbia Case: As in the global case, the hypothesis H4 is confirmed. Statistically socio-
economic construct, produced statistically significant relationships with all elements of
destination brand equity, including awareness.
H5: Environmental sustainability has a positive impact on the destination awareness.
(Global: Confirmed; Serbia: Confirmed)

160
Global Case: The hypothesis H5 is confirmed. The environmental construct, based on the
observable variables: pollution and exponential pollution, produced statistically significant
relationships with destination brand equity elements: awareness, quality and image.
Serbia Case: As in the global case, the hypothesis H5 is also confirmed. Statistically
environmental construct, based on the observable variables: level of smell and level of noise,
produced statistically significant relationships with all elements of destination brand equity
including awareness.
H6: Economic sustainability has a positive impact on the destination image. (Global:
Not Confirmed; Serbia: Confirmed)
Global Case: The hypothesis H6 is not confirmed. The economic construct, based on the
observable variables: arrivals, expenditure and number of international meetings, did not
produce statistically significant relationships with destination image.
Serbia Case: The hypothesis H6 is confirmed.
Statistically economic construct, as a part of joined socio-economic construct has significant
relation with the destination image as shown in Figure 7.4., p 151.
H7: Social sustainability has a positive impact on the destination image. (Global:
Confirmed; Serbia: Confirmed)
Global Case: The hypothesis H7 is confirmed. The social construct, based on the observable
variables: government effectiveness, competitiveness index and using internet for B2B,
produced statistically significant relationships with all destination brand equity elements.
Serbia Case: As in the global case, the hypothesis H7 is confirmed. Statistically socio-
economic construct produced statistically significant relationships with the elements of
destination image.
H8: Environmental sustainability has a positive impact on the destination image.
(Global: Confirmed; Serbia: Confirmed)
Global Case: The hypothesis H8 is confirmed. The environmental construct, based on the
observable variables: pollution and exponential pollution, produced statistically significant
relationships with destination image.
Serbia Case: As in the global case, the hypothesis H8 is confirmed. Statistically environmental
construct, based on the observable variables: level of smell and level of noise, produced
statistically significant relationships with destination image.
H9: Economic sustainability has a positive impact on the destination quality. (Global:
Not Confirmed; Serbia: Confirmed)
Global Case: The hypothesis H9 is not confirmed. The economic construct, based on the
observable variables: arrivals, expenditure and number of international meetings, did not

161
produce statistically significant relationships with any of the destination brand equity elements
including quality
Serbia Case: The hypothesis H9 is confirmed.
Statistically economic construct, as a part of joined socio-economic construct has significant
relation with the destination quality as shown in Figure 7.4., p. 154.
H10: Social sustainability has a positive impact on the destination quality. (Global:
Confirmed; Serbia: Confirmed)
Global Case: The hypothesis H10 is confirmed. The economic construct, based on the
observable variables: government effectiveness, competitiveness index and using internet for
B2B, produced statistically significant relationships with all of destination brand equity
elements including destination quality
Serbia Case: As in the global case, the hypothesis H10 is confirmed. Statistically socio-
economic construct produced statistically significant relationships with all the elements of
destination brand equity including destination quality.
H11: Environmental sustainability has a positive impact on destination quality. (Global:
Confirmed; Serbia: Confirmed)
Global Case: The hypothesis H11 is confirmed. The environmental construct, based on the
observable variables: pollution and exponential pollution, produced statistically significant
relationships with destination quality.
Serbia Case: As in the global case, the hypothesis H11 is confirmed. Statistically
environmental construct, based on the observable variables: level of smell and level of noise,
produced statistically significant relationships with the elements of destination quality.
H12: Economic sustainability has a positive impact on the destination loyalty. (Global:
Confirmed; Serbia: Confirmed)
Global Case: The hypothesis H12 is confirmed. The economic construct, based on the
observable variables: arrivals, expenditure and number of international meetings, produced
statistically significant relationships with any of the destination brand equity elements including
loyalty.
Serbia Case: Hypothesis H12 is confirmed.
Statistically economic construct, as a part of joined socio-economic construct has significant
relation with the destination loyalty as shown in Figure 7.4., p 154.
H13: Social sustainability has a positive impact on the destination loyalty. (Global:
Confirmed; Serbia: Confirmed)
Global Case: The hypothesis H13 is confirmed. The economic construct, based on the
observable variables: government effectiveness, competitiveness index and using internet for

162
B2B, produced statistically significant relationships with any of the destination brand equity
elements including loyalty.
Serbia Case: As in the global case, the hypothesis H13 is confirmed. Statistically socio-
economic construct produced statistically significant relationships with destination loyalty.
H14: Environmental sustainability has a positive impact on the destination loyalty.
(Global: Not Confirmed; Serbia: Confirmed)
Global Case: The hypothesis H14 is not confirmed. The environmental construct, based on
the observable variables: pollution and exponential pollution, did not produce statistically
significant relationships with destination loyalty.
Serbia Case: The hypothesis H14 is confirmed. Statistically environmental construct, based
on the observable variables: level of smell and level of noise, produced statistically significant
relationships with the elements of destination loyalty.
163
8. DISCUSSIONS AND FUTURE RESEARCH
This chapter reviews the final comments on the findings presented in the thesis and
elaborates on the theoretical impacts, managerial relevance, research limitations and future
directions of the research.
8.1. Evaluation of Research Outcomes
This thesis attempts to formulate a theoretical concept of the impact that tourism
destination sustainability has on destination brand equity and destination branding. The study
follows the work of Gartner (2014) who states that destination brand equity development and
destination sustainability become one and the same process in the long run. However, the same
author offered no clue how to measure or prove the concept, creating a gap in the research
literature on the impact of destination sustainability on destination brand equity development.
Consequently, this thesis offers an exploratory effort to fulfill the gap.
To prove the impact of sustainability on destination brand equity it is necessary to prove
causality between the two entities. First, causality relationship between the individual elements
of destination sustainability and destination brand equity must be examined in the one-to-many
scenario. Each element of the destination sustainability (economic, social and environmental)
needs to be analyzed against all elements of the destination brand equity (awareness, image,
quality and loyalty). Second, causality between the overall sustainability and the overall
destination brand equity must be proved in the one-to-one scenario. In both cases, causality is
established using structural equation modeling as a part of the multivariate statistical analysis
technique.
Using two sets of different empirical data, the global and case of Serbia, the thesis proves
two major hypotheses a) “destination sustainability impacts destination brand equity”, and b)
“destination sustainability and destination brand equity are two parallel development processes
that become one and the same process in the long run”. The findings contribute to the research
literature on tourism destinations and destination sustainability by proposing the framework in
which other relationship and issues can be tested, recognized, and managed.
Moreover, the thesis is concerned with the interest of the destination researchers and
scientists on the influence that tourism destination economic, social and environmental forces
have on the elements of destination brand equity: awareness, image, quality and loyalty.
For the last three decades the social, economic and environmental concepts are
recognized and theoretically evaluated as the components of the sustainable development. On
the other hand, the brand equity concept of a tourism destination is a recent theoretical construct.
The concept is based on the earlier theoretical works and models developed by Aaker, Keller
and others. Aaker and Keller proposed the most popular theoretical paradigms for evaluating
the brand equity concept known as customer-based brand equity model (CBBE).
Also, plethora of scientists contributed to the brand equity research effort. However, for
the research interest in this thesis a more refined set of scientific literature on tourism
destination brand equity and on destination sustainability was selected.
Furthermore, the proposed model outlines the concepts of tourism destination brand
equity and destination sustainability as two parallel processes integrated into one as captured in

164
the proposed model. The thesis is primarily concern with the impact that sustainability has on
destination brand equity in the tourism context. In that regard, the study uses the research
literature on the influence that destination sustainability development has on tourism destination
branding process. The theoretical foundation of the sustainability research literature is based
on the original form of integration model, social exchange theory, holistic approach and
integrated theoretical framework. However, the theoretical foundation for the destination brand
equity development is borrowed from Aaker’s and Keller’s CBBE model.
The primary goal of the study is to confirm that sustainable destination development impacts
destination brand equity. The second goal of the study is to prove that sustainable development
of a destination and destination brand equity development effort could become one process in
the long run. In that regard, the study proves the similarity of the two processes by using the
correlational relationship between the second-order elements in SEM analysis of both
destination brand equity and destination sustainability. The SEM analysis shows that
destination sustainability and destination brand equity are highly correlated, indicating that one
construct is significantly explained by the other and vice-verse. Moreover, in the SEM, the
relationship between two exogenous variables is both correlational and causal. This confirms
that destination sustainability and destination brand equity are dependent on each other in the
long run. For the theoretical evaluation and consideration, this thesis proposes a
multidimensional conceptual model for the statistical testing and confirmation. Based on the
proposed multidimensional model, the study unifies the previous empirical findings outlined in
the research literature.
First, the study adopts Aaker’s customer-base brand equity model consisting of the four
elements: destination awareness, destination image, destination quality and destination loyalty.
Also, the thesis uses economic, social and environmental elements for the sustainability as a
part of the proposed model. The elements of the model are operationalized based on the two
data sources: global and Serbia. The proposed model is constructed by merging the Aaker’s
CBBE model and the destination sustainability concept into one model.
In the global scenario the proposed model was operationalized into the six isolated latent
elements using indicators from the global databases, because destination awareness and quality
are operationalized as an individual element by EFA analysis in stage 1. The “awareness &
quality” latent element was defined by four observable variables (indicators): effectiveness of
marketing, sustainability of travel & tourism, tourism infrastructure and prioritization of travel
& tourism. In the following stage 2, CFA analysis has further reduced the number of observable
variables in the awareness & quality element to two: marketing effectiveness and tourism
infrastructure.
The SEM analysis recognizes social element as the most dominant element of the model,
indicating that the social element affects all other elements in the model including economic
and environmental ones. Findings in the thesis suggest that tourism destinations with higher
levels of social sustainability are more developed and have higher value of brand equity.
Further, in the global model, the economic sustainability affects only destination loyalty
while environmental element impacts destination loyalty, awareness and quality. Also, findings
show that destination loyalty is influenced by the social element as well as the destination
awareness and quality. This is in line with the earlier literature on the destination branding
where awareness and quality are considered antecedents of loyalty.

165
In the singly country case, which is based on the survey data from the international
tourists visiting Serbia, the analysis mostly confirms the findings in the global case. The
operationalization of the data from the case of Serbia produced three sustainability elements:
social, economic and environmental. The social and economic elements are jointly
operationalized as socio-economic element defined by two exogenous observable variables:
“reasonable prices” and “value-for-money”. Next, the path analysis shows that social and
economic elements only affect destination quality, image and loyalty but, show less impact on
the environmental element. In fact, the study confirms the impact of destination awareness and
quality on the single element of destination loyalty. The relationship is supported by the earlier
research literature.
Furthermore, the thesis revealed that results obtained from the global and Serbia case
produced the multidimensional conceptualization of the proposed model, which is in line with
the works of Aaker and Keller. Also, the study, in the global scenario integrates destination
awareness and quality in one element. Keller places both elements at the bottom of its
hierarchical model and suggest that overlapping is possible. Also, some earlier studies support
the concept that quality suggests cues for the recall and recognition of a destination. On the
other hand, the Serbia case integrated image and loyalty in one element which Keller’s
pyramidal model places at the very top of the hierarchical structure, showing, that the two items
overlap at the measurement level. Also, social and economic elements in the case of Serbia are
integrated into one element defined by “value-for-money” and “reasonable prices”.
In the global case observable variables are selected from the pool of available global
indicators either from internet or directly from the data source. Since the research literature
where global indicators are used is scarce, the thesis relies on the theoretical foundation to make
the best possible match between indictors and theory. On the other hand, in the Serbia case
observable variables are survey based supported by the research literature. Therefore, it is not
likely for observable variables to be the same in both datasets. At most, they can be similar.
Next, the economic sustainability is defined in the global case as a latent variable
consisting of “arrivals” and “expenditure” indicators. In the case of Serbia, the economic latent
variable was defined as “investments”, “infrastructure”, and “can make money”. However, all
three variables were dropped by the measurement model analysis.
In the case of Serbia and in the global case the main hypotheses H1 and H2 are confirmed
in the second order structural path analysis. The impact of the isolated sustainability elements
“environmental’ and “social” on the second order destination brand equity construct is tested
and confirmed. The impact of the second order destination sustainability on the second order
destination brand equity confirms the H1 hypotheses. Since the path analysis shows strong
causality between the second order destination sustainability and the second order destination
brand equity, the conclusion is that the two elements significantly explain each other and
therefore, are similar in nature, intensity and direction. In other words, if destination
sustainability changes by a certain value the destination brand equity changes by the same
intensity, direction and nature. This confirms the H2 hypotheses.
Finally, the environmental sustainability latent variable was defined in the global case as
a construct of two pollution indicators which created negative correlations with other factors.
This is expected since the environmental variable is defied by two pollution observable
variables which causes negative impact on both destination sustainability and brand equity

166
factors. Similarly, in the case Serbia, the environmental latent variable was operationalized
with the “level of smell” and “level of noise” variables. Finally, the earlier research shows that
the socio-economic element is influenced by the quality of destination resources, which places
tourists into the co-creation role at the destination value exchange level.
Both global and case of Serbia confirm the first two major hypotheses. The global case
confirms ten out of fourteen hypotheses while all fourteen hypotheses are confirmed in the case
of Serbia. The global case could not confirm impact of environmental sustainability on
destination loyalty and the impact of economic sustainability on destination awareness, image
and quality.
Finally, as mentioned earlier, the results of the study are presented in Table 7.18., on page
158, show 4 out of 14 unconfirmed hypotheses: H3, H6, H9 and H14 in the global case, and all
confirmed hypotheses in the case of Serbia.
Conclusion is that the proposed model was applied on two different datasets producing
significant similarity in the outcome. This leads to the conclusion that the statistically obtained
results support the notion of universality and robustness of the proposed model.
8.2. Theoretical Implications
The subject of destination brand equity and its causal (correlational) relation with the
destination sustainability is empirically confirmed in this thesis. Furthermore, the thesis
augments an understanding of the impact that both destination sustainability and its elements,
recognized by the tourism sustainability research literature as social, economic and
environmental sustainability, have on the destination brand equity and its elements, identified
in the tourism research literature as destination awareness, image quality and loyalty. The thesis
captures the multidimensional nature of causal relations and heterogenous patterns of the
destination resources dissipation process in the proposed model, which sufficiently explains the
intricate details between the destination sustainability and brand equity domains.
The thesis addresses the gap in the tourism destination scientific literature on the impact
of sustainability and its elements on the elements of destination brand equity by confirming the
impact that destination sustainability development has on the development of the tourism
destination branding in general, and destination brand equity in particular. More specifically,
the thesis highlights the causal relations between the heterogeneous elements of both destination
sustainability and brand equity. It confirms the dominant part of the social element as the
driving force of all other elements in the proposed model.
Moreover, the benefits of the social and economic sustainability element are emphasized
in the context of the perception of socio-economic construct, and the need to understand the
advantages of destination tourism in both country-specific and tourist-specific context. In the
country specific context, based on the global data operationalization, using selected indicators,
the social and economic factors emerge as the most dominant constituents. In the global
context, social sustainability shows both direct and indirect influence on the destination loyalty,
direct influence on destination image, and both direct and indirect influence on destination
quality and awareness. In the global setting, destination awareness and quality are extracted
in the EFA as a single isolated element. The indirect impact of the social dimension on loyalty
is imposed through the mediating effect of economic sustainability, environment sustainability,

167
destination awareness and destination quality while indirect impact on destination awareness
and quality is imposed through the mediating role of environmental sustainability. This
confirms the findings of Diedrich and Garcia-Buades (2009) who suggest that social effects are
present throughout the destination.
In the context of the case of Serbia, the social and economic sustainability elements show
strong dominant role. First, in the case Serbia, the social and economic sustainability is
operationalized as the joined socio-economic construct which is in line with the previous
theoretical considerations of a social and economic elements in the tourism destination research
literature The value-for money is recognized as a part of the socio-economic construct which
is supported by the literature suggesting exchange of resources in the social setting between
individuals or groups. However, the question is still whether socio-economic construct is an
independent proposed model dimension or a member of the more complex social or economic
dimension, which requires further investigation.
In the global scenario, destination awareness and quality are measured as a single
construct of the proposed model. The same scenario shows that destination awareness and
quality impose significant direct impact on destination loyalty which is in line with the
theoretical research on the subject.
Similarly, in the Serbia case, destination awareness and quality are measured as isolated
elements of the proposed model. Also, both dimensions are statistically confirmed by
environmental sustainability factor, showing significant indirect mediating effect on the single
element of destination image and quality as suggested by research literature.
Findings of the thesis are corresponding to the earlier research on tourism destination.
The thesis confirms the multidimensional structure to the proposed model, which encapsulates
the aspects of social sustainability, economic sustainability, environmental sustainability,
destination awareness, destination image, destination quality, and destination loyalty as
standalone proposed model dimensions.
Moreover, the structural path analysis of the causal relations with the proposed model,
are in line with the earlier research outcomes showing positive causal relationships between
social sustainability and the elements of the destination brand equity, here presented as
destination awareness, image, quality and loyalty. At the same time, the path analysis confirms
the positive relationship between social element with the rest of the sustainability elements
environmental and economic sustainability. However, as mentioned earlier, the structural path
analysis of the proposed model does not explain causal relations between environmental
sustainability and destination loyalty in the global case.
However, the question is if the economic element is a standalone isolated element of the
proposed model which requires further investigation. At the same time, the failure of the
economic sustainability to contribute towards explanation of the destination brand equity
elements, shows weak causality and brings up the question of the relevance and the role
economic sustainability plays in the destination brand equity creation process. In the global
scenarios, more research is required with different observable economic variables to provide
better fit between data and the model. In other words, a set of global indicators need to be
filtered out from the global datasets for better results. In the survey scenarios, the task of
selecting or changing variables is more flexible and precise since the development of the
research instrument is in the domain of a researcher. In this thesis, the global economic

168
construct is drawn from two observable global variables (indexes): country average tourist
arrivals and expenditure. In the survey scenario the same construct is extracted as a dual latent
variable denoting the social and economic element consisted of “value-for-money” and
“reasonable prices”. The latter being associated with the economic domain while the former is
related to the social one. The research exercise in this thesis suggests that to prove the
economic construct as a standalone isolated element, more observable variables for both global
and survey scenarios are needed.
In the global case all three elements of the destination sustainability economic, social and
environmental show positive influence on destination loyalty. The Serbia scenario mostly
confirms the global case. The same is the case with destination quality. In the survey scenario
Serbia destination image is influence by all tree sustainability elements while in the global
scenario it is influenced only by social sustainability element. Destination awareness, on the
other hand, is influenced by all sustainability elements in the survey case and only by social
and environmental elements in the global case.
The findings of the structural path analysis, in both global and case Serbia, suggest that
perceived benefits, combined with perceptions of power to achieve them, will result in trust and
community endorsements that will influence tourism policies. Moreover, residents of the
prospective tourism destination will support development if they perceive that benefits
outweigh the costs. In other words, the more positive influence of the social sustainability
element on the other elements of sustainability and the elements of destination brand equity,
the more support from the local community to develop a tourism destination.
Furthermore, the study tests and confirms the significant relationship between the socio-
economic construct, representing by economic and social elements and destination loyalty,
which is supported by the earlier research literature. The case of Serbia confirms significant
acceptable estimated structural relation between social and economic constructs based and a
single construct marked as destination image and loyalty. Also, the same analysis confirms
significant correlation between joint social and economic construct (socio-economic) and
destination quality.
The findings suggest that monetary benefits are significant factor in generating desired
individual level of service and positive behavioral intentions. However, the open question is
how tourists’ resources, other than monetary costs and benefits, such as travelling time, trip
preparation, accessories required for travelling, physical exercises and other travel preparations
before the journey contribute to the perceived quality of the overall travelling experience
The most important finding of the study, which earlier research literature missed to cover,
is confirmation of the impact that destination sustainability has on destination brand equity. It
is confirmed that the changes in the environmental, social and economic factors influence
changes in the tourists’ perception of the tangible and intangible values of a tourism destination.
The second most important finding is that the destination sustainable development and
destination brand equity development efforts require same space, resources and support. The
causality is confirmed in the structural path analysis between the second order destination
sustainability element and the second order destination brand equity element. The results show
multicollinear relation between the two factors suggesting similarity to the level of no
difference between the constructs. The second order path analysis confirmed that any move in
the destination sustainability results in the corresponding change of the destination brand equity
169
in terms of direction, intensity and nature. Finally, with the confirmation of both major
hypothesis, there is a need to understand behavioral input of different tourist segments and how
to incorporate them into the proposed model.
8.3. Managerial Implications
Since a destination can be viewed as a marketing offering wrapped into experiential
choices and products it can be looked upon as a value chain. Therefore, the proposed model
supplies destination managers with an opportunity to develop a tool for evaluating tourism
destinations such as countries, regions, cities, islands and others in managing total destination
experience from the tourists’ point of view.
To make brand information useful for the decision-making process, managers, marketers,
developers and stakeholders, a trend of “longitudinal” studies are needed to track destination
brand activities and performances. Planning of any destination development must incorporate
sustainability elements and practices. In particular, the emphasis should be given to the social
elements that besides monetary benefits and costs, must include institutional and legal
instruments of trusts and power.
Also, destination managers and developers must consider environmental issues to secure
that natural destination resources will be there for the future generations. The study points on
the effects of pollution, however, the list of issues is long. The number of possibilities for the
environment to deteriorate are enormous as the global demand for resources is growing
exponentially driven by the increase in population and standards of living The study suggests
that managing environmental issues can improve destination loyalty, awareness, quality and
image and, hence, destination brand equity by providing an input for initiatives for policy
development.
The analysis in the thesis supports that environmental impact, say pollution, smell, and
noise, can influence destination awareness, image, quality and, to some extent, loyalty.
Similarly, social impact is evident on all destination brand equity elements in global and in the
case of Serbia domain. In the survey scenario, perception of the observable variables value for
money and reasonable prices, which exploratory factor analysis (SPSS) confirmed as one factor,
is the bases for the social and economic evaluation of a destination causing change in the
motivation and forming of a decision-making set.
Social aspects are important part of visiting a destination suggesting that well-trained,
polite, professional and qualified personnel at the tourism organizations and accommodation
facilities can contribute that tourists feel cozy, welcome and experience value for money.
Social engagements are possible and occur regularly during travelling. The social contacts are
caused by a relaxing atmosphere, meeting other people and sharing experiences, thoughts and
feelings.
Another excitement as result of the value for money are experiences from shopping
products and services in another part of the world. Different prices, choices of products and
services in different areas of the world bring excitement and positive feelings which contribute
to the overall happiness. Research literature supports that consumer-value conceptualization
corresponds to the positive relationship between value-for-money and the perception of
destination resources. Some authors suggest that value-for-money experience can be obtained

170
from tourists by interviewing them. Other authors consider value for money as a functional
value formed by the perception of price and quality, and because quality and price have
affective perceived value the value for money belong to the emotional and social domain. Value
for money is also related to the social image and self-image and to the perception of intangible,
functional and social destination resources.
Reasonable price is considered a perceived consumer value as a result of the difference
between the economic benefit and economic cost, which indicate “reasonable” value or price
as a part of the economic sustainability. Some authors place reasonable price in the destination
brand value context while others suggests reasonable price should be evaluated outside of the
destination brand equity model as a separate item, rather than as its integral part.
As stated earlier, motivation to visit a destination will depend on the outcome or exchange
between the benefits versus cost. If the cost (loss) prevails a destination in question will not be
in the decision set. Therefore, the exploitation of the destination resources for the economic
benefit is only partially evaluated in the context of impact on sustainable destination
development. The global case confirms that economic sustainability is an important factor for
managing a destination. Specifically, the study points to the importance of managing social
and economic issues to improve destination awareness, image and quality and consequently
destination brand equity.
However, the most important finding of the study is that environmental development and
to some degree economic development of a destination must occur under the umbrella of the
social sustainability framework. For the tourism destinations to thrive they must impose legal
framework to protect the overuse of the destination resources and provide favorable ground for
tourists’ experiential consumption of those resources. Safety and legal protection are
considered as significant social factors.
In particular, the monitoring of the proposed model’s constituting elements prior, during
and after the experiential events, including festivals, winter and summer recreation, new
destinations, promotion of destination offerings, allow insight into the efficiency and
effectiveness of the destination management, marketers and planners. Moreover, the
monitoring offers a good foundation for the forecasting and proactive planning activities that
will assure a proper balance between tourists’ demand and destinations’ supply of resources.
According to the proposed model, dimensions of destination sustainability drive the value
of destination brand equity. This has important managerial implications. For one purpose,
destination sustainability dimensions give destination brand equity a critical strategic bridge
from the past to the future which is a first step in the formation of the future destination brand
value.
8.4. Research Limitations
The complexity of the proposed model and difficulties in obtaining global and survey
data as well as chartering new theoretical territories result in several limitations in the study.
The need to improve the proposed model drives the number of limitations in the thesis. The
number and operationalization of the relevant global indexes in the global case as well as the
number and the formulation of survey questions and, their operationalization in the case Serbia,
are the major sources for the limitations in the thesis.

171
The most obvious limitation of the thesis is that not all hypotheses are confirmed, though,
the great majority are, including the major ones. Obviously, confinement to two global
observable variables arrivals and expenditure, are limiting economic dimension to have more
significant relations with other latent variables in the proposed model. This is also general
limitation to the model since most of the latent constructs have two observable variables.
Similarly, environment dimension has been reduced to only two global observable
variables pollution and exponential pollution. On the other hand, destination image and
destination awareness need more observable variables to improve the proposed model with
better path relations between the latent variables. Another issue is duality in the latent variable
constructs. In the global case, destination awareness and quality are represented by a single
element.
The similar issues are found in the Serbian scenario where destination image and loyalty
as well as social and economic sustainability are grouped into a single element. Also,
environmental and economic constructs need to be improved by more observable variables. In
other words, the survey, which currently has 33 questions, needs to expand to cover more
ground in all areas. Therefore, there is a need to expand social, economic and environmental
segments.
Also, in the global data scenario, the p value, in the goodness of fit statistics, never meets
the 0.05 criteria. The same is the case in the Serbian data scenario. The theory suggests
sensitivity of the p number to the size of data and confirms that it would be difficult to get
higher p values for a small data size.
Similarly, p of close fit (PCLOSE) in the global scenario is just under the threshold of
0.05. However, RMSEA is always under 0.8 threshold which is a very good result. Since
RMSEA is always used in combination with PCLOSE the issue is acceptable. Similar
limitations exist in the Serbia scenario except for the second-order path analysis where p value
of 0.002 is not meeting the threshold. Also, in depth evaluation of the measurement model
would be difficult to analyze because of the small sample size (n=384) and the high proposed
model complexity.
The other limitation comes from the fact that the Serbia scenario applies only on actual
tourists but misses potential visitors since they were out of the scope of the survey. Another
potential limitation is that the survey is conducted in Belgrade not throughout Serbia. It is a
common practice in the research of a country to base their survey in a highly popular location
of the country rather than spread the survey around. The reason is that the tourists’ perceptions
and excitement are the strongest and more pronounced in the most popular destination in
comparison to the less popular ones.
The thesis supports notion that among foreign tourists Belgrade is a valid representative of
Serbia based on two premises. First, most of the foreign tourist, about 57%, who come to visit
Serbia visit Belgrade. Second, Belgrade is the administrative center and the most developed
tourism destination in Serbia which account for most of the tourism monetary benefits. It is
used as a hub for variety of travel experiences throughout other destinations in Serbia.
Many previous studies on the subject encountered problems with operationalizing
destination awareness, which is also the case in this study. Therefore, different structural
approach is needed to improve operationalization of the destination awareness construct.

172
Similar issue is with the timing of data collection which effects surveys in the case Serbia.
Some researchers suggest that data should be taken upon return from the destination to allow
for impressions to settle and mature in scope, intensity and substance. Implementing temporal
analysis and evaluation of the proposed model will increase theoretical validity, reliability, and
managerial effectiveness and applicability. However, in the case of Serbia scenario this could
create a problem and difficulty to logistically administrate survey in the multiple countries.
Therefore, priority should be given to the global data that has already factored in the time and
spatial dimension.
Another issue is related to the differentiation of destination awareness and quality in the
global case and of destination image and loyalty as well as social and economic sustainability
in the case of Serbia where pair of two elements form a single dimension in the proposed model.
In the global case, limitation is the fit of the proposed indicators with the elements of the
proposed paradigm. To improve suitability between the global data and the model a search for
more appropriate global datasets is needed. In the survey case more observable variables for
each latent variable are required. In the global case the number of country data should be higher
preferably over 150 with the percentage of missing data under 10%, Further limitation is lack
of proper constructs adequate to adopt higher levels of cognitive and affective attachment to
the brand, intention to visit and revisit, paying premium, communications involving the
destination, information browsing and etc.
The other limitation come from the proposed model itself since number of missing values
in the global scenario is high. The reason is the difference in the size of indicators who come
from different data sources covering different number of countries. Also, the number of missing
values limits the size of the dataset. In our study, the number of indicator instances, obtained
from the global databases, range from 61 (IMD) to 187 (Transparency International and World
Bank). The good news for the future research is that the gap is narrowing with number of
instances on the increase since more countries take part in the global surveys.
Another limitation of the global model is inability to test different market segments.
Nevertheless, the thesis proposes a model that is applicable for continents, regions, countries,
sovereignties, municipalities and destinations with higher or lower geographical levels.
Finally, availability of the global data is an issue. Increase in the demand for global data are
causing that majority of the global data sources are moving or considering moving from the
public domain into the more financially attractive private domain. The trend has a potential to
financially burden many research projects outside of the institutional financial umbrella.
8.5. Proposal for Future Research
The future research efforts should be channeled into two directions. Priority should be
given to address and remedy the limitations met in the current study. At the same time, new
avenues to improve, expand and make the proposed model more robust should be explored.
Also, theoretical applicability of the proposed model for the practical applications in the areas
of destination sustainability and brand equity is a challenge that the proposed model is expected
to fulfill and provide. Furthermore, transformation of the proposed model’s promise into the
development tool for the destination management and destination marketing organizations
(DMOs) is the goal of the future endeavors.

173
Implementation of the proposed model is expected to make a significant step forward in
marrying the destination sustainable development with destination brand equity development
effort into one integrated process with a common goal.
First, future data collection, both the global and the case of Serbia, needs to be addressed
based on experiences and obstacles that we learned in the process. The global data has its own
advantages and disadvantages. The advantage is that, in most cases, when data comes from the
reputable databases, data are normalized, valid and reliable. The disadvantage is that the size
of indicators differs, and that the mix of the countries covered is different from one indicator to
the other causing missing data issues. Also, there is an issue with outliers, when the size of the
data related to the same features significantly differ between countries. But, the most important
aspect for the future research should be finding global indicators that closely match the
operationalization goals of the study.
Along the same line, the case of Serbia survey data needs to be expanded in the areas of
observable variables to allow for better operationalization and measurement of the latent
variables. The future data surveys need to cover, potential travelers, not just the actual ones.
This would require some more complex and challenging procedures.
Furthermore, the issues related to the destination awareness need to be addressed in the
future research efforts. The number of observable variables needs to increase in depth and
breadth to allow for better coverage of the strength of associations in the tourists’ minds about
a destination. This applies to all dimensions of the proposed model in both global and case of
Serbia scenarios. In addition, the future research efforts should expand into different regions,
such as Southeast Europe, cities, municipalities, resorts and geographical and scenic
destinations.
The time of the data collection should be addressed in the survey cases. That would
require collection planning to be taken to another level for which more resources are needed.
In the global case scenario, that means more effort for screening those indicators that already
have factored in the time dimension. That may not be as easy as it sounds, since most of the
indicators, may not follow the requirements of the proposed model.
To alleviate the problems with dual latent variables such as a single dimension for
destination loyalty and image in the Serbia case, more relevant observable variables should be
included as survey questions. Testing data from the point of different market segments may
be a problem with the global data but should not be a problem with the survey data since
demographics or other categories can be easily implemented in the survey. However, testing
the model for different segments is an attractive direction for the future research.
Also, the theoretical applicability of the proposed model for the practical applications in
development of destination branding, brand equity and sustainability is a plausible option and
the ultimate goal of this thesis. For the destinations to thrive the factors relevant for the
destination development, exploitation, profitability, and management must be incorporated
under the umbrella of sustainability.
Therefore, transformation of the proposed model’s promise into the development and
management tool for the destination management, destination marketing organizations
(DMOs), and all other relevant institutions and stakeholders, places the proposed model into
the middle of the destination development process.

174

175
9. REFERENCES
Aaker, D. (1991). Managing Brand Equity. New York: The Free Press.
Aaker, D. (1996). Building Strong Brands. New York: The Free Press.
Ahn, B. Y., Lee, B., & Shafer, C. S. (2002). Operationalizing sustainability in regional
tourism planning: An application of the limits of acceptable change framework.
Tourism Management, 23, 1–15.
Akram, A., Merunka, D., & Akram, M. (2011). Perceived brand globalness in emerging
markets and moderating role of consumer ethnocentrism. International Journal of
Emerging Markets , 291-303.
Alamro, A., & Rowley, J. (2011). Antecedents of brand preference for mobile
telecommunications services. Journal of Product & Brand Management , 475-486.
Aledo, A., & Mazon, T. (2004). Impact of residential tourism and the destination life cycle
theory. In F.D. Pineda, C.A. Brebbia & Mugica Sustainable Tourism (pp. 25-36).
Sustainable Tourism, 25-36.
Alegre, J., Mateo, S., & Pou, L. (2010). An analysis of households’ appraisal of their budget
constraints for potential participation in tourism. Tourism Management, 31(1) , 45-56.
Alen, E., Nicolu, J., Losada, N., & Dominguez, T. (2014). Determinant factors of senior
tourists’ length of stay. Annals of Tourism Research, 49, 19-32.
Alfsen, K. H., & Greaker, M. (2007). From natural resources and environmental accounting to
construction of indicators for sustainable development. Ecological Economics , 600-
610.
Allen, L. R., Hafer, H. R., Long, P. T., & Perdue, R. R. (1993). Rural Residents’ Attitudes
toward Recreation and Tourism Development. Journal of Travel Research, 31 (4), 27-
33.
Almeida, F., Peláez, M. A., Balbuena, A., & Cortés, R. (2016). Residents' perceptions of
tourism development in Benalmadena (Spain). Tourism Management, 54, 259–274.
Altinay, L. (2000). Possible impacts of a federal solution to the Cyprus problem on the
tourism industry of North Cyprus. International Journal of Hospitality Management,
19 , 295–309.
Andereck, K. L., & Nyaupane, G. P. (2011). Exploring the nature of tourism and quality of
life perceptions among residents. Journal of Travel Research, 50 , 248–260.
Andereck, K. L., & Vogt, C. A. (2000). The relationship between residents' attitudes toward
tourism and tourism development options. Journal of Travel Research, 39(1), 27-36.
Andereck, K. L., Valentine, K. M., Knopf, R. C., & Vogt, C. A. (2005). Residents'
perceptions of community tourism impacts. Annals of Tourism Research, 32(4), 1056–
1076.
Andersen, S. E., Ditlevsen, M. G., Nielsen, M., Pollach, I., & Rittenhofer, I. (2013).
Sustainability in Business Communication: An Overview. In S. E. Andersen, M. G.
Ditlevsen, M. Nielsen, I. Pollach, & I. Rittenhofer, Sustainability in Business
Commumication. Weisbaden : Springer.
Anderson, E. V., Fornel, C., & Lehman, D. R. (1994). Customer Satisfaction, Market share
and Profitability: Finfdings from Sweden. Journal of Marketing, 58, 53–66.
Anderson, J. R. (1986). The Architecture of Cognition. Boston: Harvard University Press.
Andriotis, K. (2014). Tourism development and the degrowth paradigm. Turisticko
Poslovanje, 2014(13), , 37–45, doi:10.5937/TurPos1413037A.

176
Anholt, S. (2007). Competitive Identity:The New Brand Management for Nations, Cities and
Regions. New York: Palgrave Macmillan.
Anholt, S. (2010). Places,Identity, Image and Reputation. New York, NY: Palgrave
Macmillan.
Anholt, S. (2014). Afterword. Place Branding and Public Diplomacy 10(2), 167–169.
Anuwichanont, J., & Mechinda, P. (2014). Examining the Impact of Brand Equity and Value
Proposition of Ecological Destination on Eco-tourists’ Loyalty. Universal Journal of
Industrial and Business Management , 173-181.
Ap, J. (1992). Residents’ perceptions on tourism impacts. Annals of Tourism Research, 19,
665–690.
Aronczyk, M. (2013). Branding the Nation: The Global Business Identity . Oxford : Oxford
University Press.
Ashworth, G., & Kavaratzis, M. (2010). Towards Effective Place Brand Management.
Northampton: Edward Elgar Publishing.
Ashworth, G., & Page, S. J. (2011). Urban tourism research: recent progress and current
paradoxes. Tourism Managment 31(1), 1-15.
Atkinson, G., Dubourg, R., Hamilton, K., Munasinghe, M., Pearce, D., & Young, C. (1997).
Measuring Sustainable Development: Macroeconomics and the Environment. . Lyme:
CT.
Bachmann, R., Knights, D., & Sydow, J. (2001). Trust and control in organizational
relations. London: Sage Journals. (Organization Studies Special Issue Vol. 22 No. 2).
Baek, T. H., & King, W. K. (2011). Exploring the consequences of brand credibility in
services. Journal of Services Marketing , 260-272.
Baker, D. A., & Crompton, J. L. (2000). Quality, satisfaction and behavioral intentions .
Annals of Tourism Research, 27(3), 785–804.
Baloglu, S., & Mangaloglu, M. (2001). Images of Tourism Destination Turkey, Egypt,
Greece, and Italy as Perceived by US-Based Tour Operators and Travel Agents.
Tourism Management 22 (1), 1–9.
Barros, C., & Machado, L. (2010). The length of stay in tourism. Annals of Tourism
Research,37(3), 692-706.
Barros, C., Butler, R., & Correia, A. (2010). A length of stay of golf tourism: A survival
analysis. Tourism Management, 31(1), 13-21.
Bartholomew, D. J., Steele, F., Moustaki, I., & Galbraith, J. I. (2008). Analysis of Multivariate
Social Science Data. Boka Raton: CRC Press.
BBMG. (2016). Five Human Aspirations & The Future of Brands. Toronto: GlobScan.
Belaid, S., & Behi, T. A. (2011). The role of attachment in building consumer‐brand
relationships: an empirical investigation in the utilitarian consumption context.
Journal of Product & Brand Management , 37-47.
Berry, L. L. (2000). Journal of the Academy of Marketing Science. Cultivating service brand
equity, 28 (1) , 128–137.
Bertram, D. (2019, May 22). Likert Scale. Retrieved from
http://poincare.matf.bg.ac.rs/~kristina/topic-dane-likert.pdf
Besculides, A., Lee, M. E., & McCormick, P. J. (2002). Residents’ perceptions of the cultural
benefits of tourism. Annals of Tourism Research, 29(2), 303–319.
Bhuiyan, M. A., Siwar, C., & Ismail, S. M. (2015). Sustainability Measurement for
Ecotourism Destination in Malaysia: A Study on Lake Kenyir, Terengganu. Social
Indicators Research, 128(3) , 1029–1045, doi:10.1007/s11205-015-1068-5 .
Bianchi, C., Pike, S., & Ling, I. (2014). Investigating attitudes towards three South American
destinations in an emerging long haul market using a model of consumer‐based brand
equity (CBBE). Tourism Management, 42 , 215‐223.
177
Bimonte, S., & Punzo, L. F. (2016). Tourist development and host-guest interaction. Annals
of Tourism Research, DOI: 10.1016/j.annals.2016.03.004.
Blain, C., Levy, S. E., & Ritchie, J. R. (2005). Destination branding: Insights and practices
from destination branding organizations. Journal of Travel Research 43(May), 328–
338, DOI:10.1177/0047287505274646.
Blalock, P. M. (1962). Four-Variable Causal Models and Partial Correlations. American
Journal of Sociology, 68, 182-94.
Bloom, C. (2015). Bloom Consulting Country Brand Ranking 2014/2015. . Madrid: Bloom
Consulting.
Bloomberg, B., Cooper, D. R., & Schidler, P. S. (2008). Business research methods. Second
European edition. . McGraw-Hill Higher Education.
Bojanic, D. C., & Lo, M. (2016). A comparison of the moderating effect of tourism reliance
on the economic development for islands and other countries. Tourism Management,
53, 207-2014.
Boley, B. B., McGehee, N. G., Perdue, R. R., & Long, P. (2014). Empowerment and resident
attitudes toward tourism: Strengthening the theoretical foundation through a Weberian
lens. Annals of Tourism Research, 49, 33-50.
Boo, S. Y., Busser, J. A., & Baloglu, S. (2009). A model of customer-based brand equity and
its application to multiple destinations. Tourism Management 30(2), 219-231,
DOI:10.1016/j.tourman.2008.06.003.
Bose, S., Roy, S. K., & Tiwari, A. K. (2016). Measuring customer-based place brand equity
(CBPBE): an investment attractiveness perspective. Journal of Strategic Marketing,
24(7) , 617-634, doi.org/10.1080/0965254X.2016.1148766.
Boulding, K. (1956). The Image: Knowledge in Life and Society. Ann Arbor, Michigan :
University of Michigan Press.
Bramwell, B., Henry, I., Jackson, G., Prat, A. G., Richards, G., & vanderStraaten, J. (1996).
Sustainable tourism management: Principles and practice. Tilburg, Netherlands:
Tilburg: Tilburg University Press.
Bramwell, B., Lane, B., McCabe, S., Mosedale, J., & Scarles, C. (2008). Research
perspectives on responsible tourism. Journal of Sustainable Tourism, 16 (3), 253-257.
Brewer, A., & Zhao, J. (2011). The impact of a pathway college on reputation and brand
awareness for its affiliated university in Sydney. International Journal of Educational
Management , 34-47.
Brida, J. G., Osti, L., & Barquet, A. (2010). Segmenting resident perceptions towards tourism
— A cluster analysis with a multinomial logit model of a mountain community.
International Journal of Tourism Research, 12, 591–602.
Brougham, J. E., & Butler, R. W. (1981). A segmentation analysis of resident attitudes to the
social impact of tourism . Annals of Tourism Research, 8 (4), 569-590.
Brown, T. A. (2006). Confirmatory Factor Analysis for Applied Research . New York,
London: The Guilford Press.
Buckely, R. (2001). Environmental Impacts (1993) . In D. B. Weaver, The Encyclopedia of
Ecotourism (pp. 379-394). New York, NY: CABI.
Buckely, R. C., & Pegas, F. d. (2012). Tourism and CSR. In A. Holden, & D. Fennell,
Handbook of Tourism and Environment (pp. 521–530). Wallingford: CAB
International.
Buckley, C. R. (2015). Tourism and the sustainability of human societies. In T. V. Singh,
Challenges in Tourism Research (pp. 261-243). Bristol, UK: Channel View
Publications. Retrieved from Researchgate.net:
https://www.researchgate.net/profile/Ralf_Buckley/publication/267453101_Tourism_
and_the_sustainability_of_human_societies/links/561daade08aef097132b26a2.pdf

178
Buckley, J. (2017). Florence launches campaign telling tourists how to behave. Retrieved
from http://www.cntraveler.com/story/florence-launches-campagin-telling
Buckley, R. (2012). Sustainable Tourism: Research and Reality. Annals of Tourism Research,
Vol. 39, No. 2, 528–546.
Buckley, R. C., Castley, J. G., Pegas, F., Mossaz, A. C., & Steven, R. (2012). Population
Accounting Approach to Assess Tourism Contributions to Conservation of IUCN-
Redlisted Mammals. PLoS ONE 7(9): e44134.
Budeanu, A. A. (2005). Impacts and responsibilities for sustainable tourism: A tour operator's
perspective. Journal of Cleaner Production 13(2), 89-97.
Budeanu, A., Miller, G., Moscardo, G., & Ooi, C.-S. (2015). Sustainable Tourism, Progress,
Challenges and Opportunities: Introduction to this Special Volume, . Journal of
Cleaner Production, doi: 10.1016/j.jclepro.2015.10.027.
Buhmann, A., & Ingenhoff, D. (2013). Advancing the Country Image Construct from a Public
Relations Perspective: The Constitution of the County Image and its Effect on Travel
Behavior. EUPRERA 2013 Congress , (pp. 1-17). Barcelona Spain.
Busse, C. (2010). A Procedure for Secondary Data Analysis: Innovation by Logistics Service
Providers. The Journal of Supply Chain Management, 44-58.
Butler, R. (1991). Tourism, environment, and sustainable development. Environmental
Conservation, 18(3), 201–209.
Butler, R. (2001). Seasonality in tourism: Issues and implications. In T. Baum & S. Lundtorp
(Eds.), Seasonality in tourism (pp. 5-22). London: Routledge.
Butler, R. W. (1980). The Concept of a Tourist Area Cycle of Evolution Implications for
Management of Resources. Canadian Geographer, 24 (1), 5-12.
Butler, R. W. (1994). In A. V. Seaton, (Ed.). Seasonality in tourism: Issues and problems.
Chichester: Wiley.
Butler, R. W. (1999). Tourism: An evolutionary perspective. In J. G. Nelson, R. Butler, & G.
Wall, Tourism and sustainable development: A Civic Approach, 2nd ed. (pp. 33-63).
Waterloo, Canada: University of Waterloo.
Byrd, E. T., Bosley, H. E., & Dronberger, M. G. (2009). Comparisons of stakeholder
perceptions of tourism impacts in rural eastern North Carolina. Tourism Management,
30, 693–703.
Byrne, B. M. (2001). Structural Equation Modelling with AMOS, EQS and LISREL ‐
Comparative Approaches to Testing for the Factorial Validity of Measurement
Instrument. International Journal of Testing, 1(1), 55‐86.
Byrne, B. M. (2016). Structural Equation Modeling with Amos Basic Concepts, Applications,
and Programming. New York: Routledge.
Byrne, B. M., Baron, P., Larsson, B., & Melin, L. (1995). The Beck Depression Inventory:
Testing and Cross-Validating a Second-Order Factorial Structure for Swedish
Nonclinical Adolescents. Behaviour Research and Therapy 58(2), 345-356.
Cai, L. (2002). Cooperative branding for rural destinations. Annals of Tourism Research
29(3), 720–742, DOI:10.1016/S0160-7383(01)00080-9.
Calderwood, L. U., & Soshkin, M. (2019). The Travel & Tourism Competitiveness Report
2019 . Geneva: World Economic Forum.
Canavan, B. (2014). Sustainable tourism: Development, decline and de-growth. Management
issues from the Isle of Man. Journal of Sustainable Tourism, 22(1), 127–147,
doi:10.1080/09669582.2013.819876.
Carifio, J., & Perla, R. (2008). Resolving the 50-year debate around using and misusing Likert
scales. Med Educ.,Dec;42(12), 1150-2, doi: 10.1111/j.1365-2923.2008.03172.
Castellani, V., & Sala, S. (2010). Sustainable Policy Index for Tourism Policy Development.
Tourism Management .

179
Cernat, L., & Gourdon, J. (2012). Paths to success: Benchmarking cross-country sustainable
tourism. Tourism Management, 33, 1044–1056.
Cevero, R. (2016, January 10). The FutureBrand Country Index: Country Brand Index 2012-
13. Retrieved from http://www.futurebrand.com/images/uploads/studies/cbi/CBI_
2012-Final.pdf
Chan, C., & Marafa, L. (2013). A review of place branding methodologies in the new
millennium. Place Branding and Public Diplomacy, 9 (4), 236-253.
Chekalina, T., Fuchs, M., & Lexhagen, M. (2016). Customer-Based Destination Brand Equity
Modeling: The Role of Destination Resources, Value for Money, and Value in Use.
Journal of Travel Research, 57(1), 1-21, DOI: 10.1177/0047287516680774.
Chen, C. F., & Chen, F. S. (2010). Experience quality, perceived value, satisfaction and
behavioral behavioral intentions for heritage tourists. Tourism Management, 31, 29–
35.
Chen, C. F., & Myagmarsuren, O. (2010). Exploring relationships between Mongolian
destination brand equity, satisfaction and destination loyalty. Tourism Economics,
16(4), 981‐994.
Chen, C. F., & Tsai, D. (2007). How destination image and evaluative factors affect
behavioral intentions? . Tourism Management, 28(4), 1115‐1122.
Cheng, M. (2016). Sharing economy: A review and agenda for future research. International
Journal of Hospitality Management 57 , 60–70.
Chi, C. G.-Q., & Qu, H. (2008). Examining the structural relationships of destination image,
tourist satisfaction and destination loyalty: An integrated approach. Tourism
Management 29(4), 624-636.
Chigora, F. (2015). Awareness Completes Brand Loyalty: Reality of Zimbabwe Tourism
Destination. Business and Management Horizons , 60-69.
Chiu, S. (2009). Going green? Urban vs. rural residency and pro-environmental attitudes in
China. A Senior Scholars Thesis. Texas A&M University.
Chiu, S. Y., & Ho, J. S. (2015). Local vs. Global Brands: Country-of-Origin’s Effect on
Consumer-based Brand Equity among Status-Seekers. Journal of Econoics and
Behavioral Studies, 6-13.
Choi, H. S., & Sirakaya, E. (2005). Measuring residents’ attitudes toward sustainable tourism:
Development of a sustainable tourism attitude scale. Journal of Travel Research, 43,
380–394.
Christodoulides, G., & de Chernatony, L. (2009). Consumer Based Brand Equity
Conceptualization & Measurement: A Literature Review. International Journal of
Market Research , 1-39.
Coldwell, W. (2017). First Venice and Barcelona: Now anti-tourism marches spread across
Europe. Retrieved from http://www.cntraveler.com/story/florence-launches-campagin-
telling
Cottrell, S. P., Vaske, J. J., & Roemer, J. M. (2013). Resident satisfaction with sustainable
tourism: The case of Frankenwald Nature Park, Germany. Tourism Management
Perspectives, 42-48.
Country Brand Index, C. (2019, October 17). FutureBrand Country Index 2019. Retrieved
from FutureBrand: https://www.futurebrand.com/uploads/FCI/FutureBrand-Country-
Index-2019.pdf
Crompton, J. (1979). Motivations for pleasure vacations. . Annals of Tourism Research 6 (4),
408–424.
Crotti, R., & Misrahi, T. (2017). The Travel and Tourism Competitiveness Report 2017,.
Geneva: World Economic Forum.

180
Crouch, G. (2010). Destination competitiveness: An analysis of determinant attributes.
Journal of Travel Research, 27-45.
Dahles, H., & Susilowati, T. P. (2015). Business resilience in times of growth and crisis.
Annals of Tourism Research (51), 34-50.
Davis, D., Allen, J., & Cosenza, R. M. (1988). Segmenting local residents by their attitudes,
interests and opinions toward tourism. Journal of Travel Research, 27(2), 2–8.
De Chernatony, L., & Dall’Olmo Riley, F. (1999). Experts’ Views about Defining Service
Brands and the Principles of Services Branding. Journal of Business Research 46,
181–192.
Demaria, F., Schneider, F., Sekulova, F., & Martinez-Alier, J. (2013). What is degrowth?
From an activist slogan to a social movement. Environmental Values, 22(2), 191–215,
doi:10.3197/096327113X13581561725194.
Demeritt, D. (2001). The construction of global warming and the politics of science. Annals of
the Association of American Geographers, 91(2), 307–337. doi:10.1111/0004-
5608.00245.
Deville, A., & Wearing, S. (2013). WWOOFing tourism: Beaten tracks and transformational
paths. In Y. Reisinger, Transformational tourism: Tourist perspectives (pp. 151–168).
Oxfordshire: CABI.
Dichter, A., & Manzo, G. G. (2017). Coping with success: Managing overcrowding in
tourism destinations. London: World Travel and Tourism Council.
Diedrich, A., & Garcia-Buades, E. (2009). Local perceptions of tourism as indicators of
destination decline. Tourism Management, 30 (4), 512-521.
Dietz, T., Fitzgerald, A., & Shwom, R. (2005). Environmental values. Annual Review of
Environment and Resources 30:ISSN 1543-5938 , 335-372.
Dinnie, K. (2009). Nation branding: Concepts, issues, practice . Journal of Brand
Management, 16, 582 – 583. doi: 10.1057/bm.2008.36 .
Dinnie, K. (2013). Nation branding. In: Paliwoda, S. (ed.), Exporting, International and
Global Marketing Management: Beyond the fundamentals . London: Available from:
<http://hstalks.com.ezproxy.leedsmet.ac.uk/t>.
Donner, M., & Fort, F. (2018). Stakeholder value-based place brand building. Journal of
Product & Brand Management, Vol. 27 Issue: 7, 807-818, doi.org/10.1108/JPBM-10-
2017-1652.
DuNann Winter, D., & Koger, S. M. (2004). The psychology of environmental problems.
Mahwah, NJ: Lawrence Erlbaum.
Dunlap, R. E., & Jones, R. E. (2002). Environmental Concern: Conceptual and Measurement
Issues. In R. E. Dunlap, & W. Michelson, The Handbook of Environmental Sociology
(pp. 482–524). Westport, CT: Greenwood Press.
Dupeyras, A., & MacCallum, N. (2013). Indicators for Measuring Competitiveness in
Tourism: A Guidance Document. OECD Publishing.
Dwyer, L. (2018). Saluting while the ship sinks: the necessity for tourism paradigm change.
Journal of Sustainable Tourism, 26 (1), 29-48,
https://doi.org/10.1080/09669582.2017.1308372.
Dwyer, L., & Edwards, D. (2009). Tourism product and service innovation to avoid ‘strategic
drift . International Journal of Tourism Research, 11(4) , 321-335.
Dwyer, L., Dragićević, V., Armenski, T., Mihalič, T., & Knežević Cvelbar, L. (2014).
Achieving Destination Competitiveness: an Importance –Performance Analysis of
Serbia. Current Issues in Tourism 19 (13), 1309-1336,
DOI:10.1080/13683500.2014.944487.
Dwyer, L., Duc Pham, T., Forsyth, P., & Spurr, R. (2014). Destination marketing of Australia:
Return on investment. Journal of Travel Research, 53(3), 281-295.

181
Dwyer, L., Edwards, D., Mistilis, N., Roman, C., & Scott, N. (2009). Destination and
enterprise management for a tourism future. Tourism Management, 30(1), 63-74.
Dwyer, L., Knezevic, C. L., Mihalic, T., & Koman, M. (2014a). Integrated Destination
Competitiveness Model: Testing its Validity and Data Accessibility. Tourism
Analysis.
Dwyer, L., Tomljenović, R., & Čorak, S. (2017). Tourism Future: Towards Transformational
Tourism. In L. Dwyer, R. Tomljenović, & S. Čorak, Evolution of Destination Planning
and Strategy (pp. 279-294). London: Springer International Publishing.
Dyer, P., Gursoy, D., Sharma, B., & Carter, J. (2007). Structural modeling of resident
perceptions of tourism and associated development on the Sunshine Coast, Australia.
Tourism Management, 28(2), 409–422.
Dymond, S. J. (1997). Indicators of sustainable tourism in NewZealand: A local government
perspective. Journal of Sustainable Tourism, 5(4), 279–293.
Echtner, C. M., & Ritchie, J. R. (1993). The Measurement of Destination Image: An
Empirical Assessment. Journal of Travel Research, 31 (Spring), 3–13.
Edwards, D., Griffin, T., & Hayllar, B. (2008). Urban tourism research: developing an
agenda. Annals of Tourism Research 35 (4), 1032–1052.
Erdem, T. (1998). Brand Equity as a Signaling Phenomenon. Journal of Consumer
Psychology , 131-157.
Erdem, T., Swait, J., & Valenzuela, A. (2006). Brands as Signals: A Cross-Country
Validation Study. Journal of Marketing Vol. 70(1), 34-39,
DOI:10.1509/jmkg.2006.70.1.34.
Espiner, S., Orchiston, C., & Higham, J. (2017). Resilience and sustainability: a
complementary relationship? Towards a practical conceptual model for the
sustainability–resilience nexus in tourism. Journal of Sustainable Tourism, 1747-
7646.
ETC. (2017). Market Intelligence Report. Brussels: European Travel Commission.
Evangelista, F., & Dioko, L. (2011). Interpersonal influence and destination brand equity
perception. International Journal of Culture, Tourism and Hospitality Research, 5(3) ,
316‐328.
Evans, A., Srezov, V., & Evans, T. (2015). Measuring Tools for Quantifying Sustainable
Development. European Journal of Sustainable Development, 291-300.
Farrell, H. (2004). Trust, distrust and power. In H. Russell (Ed.), Distrust (pp. 85–105). New
York : The Russell Sage Foundation.
Fennell, D. A. (2007). Ecotourism. New York: Routledge.
Fernández, J. I., & Rivero, M. S. (2007). Measuring tourism sustainability: proposal for a
composite index. Tourism Economics, 2009, 15 (2), 277–296.
Ferns, B. H., & Walls, A. (2012). Enduring travel involvement,destination brand equity,and
travelers’ visit intentions: A structural model analysis. Journal of Destination
Marketing & Management 1(1-2), 27-35, DOI:10.1016/j.jdmm.2012.07.002.
Fetscherin, M. (2010). The determinants and measurement of a country brand: the country
brand strength index. International Marketing Review , 466-479.
Field, A. (2009). Discovering statistics using SPSS (3rd. ed.). London: Sage.
Font, X., & McCabe, S. (2017). Sustainability and marketing in tourism: its contexts,
paradoxes, approaches, challenges and potential. Journal of Sustainable Tourism,
25(7), 869-883.
Formica, S., & Uysal, M. (2006). Destination attractiveness based on supply and demand
evaluations: an analytical framework. Journal of Travel Research, 44(4) , 418–430.
Foucault, M. (1978). The history of sexuality: Volume 1: An introduction . New York:
Vintage Books.

182
Franke, N., & Mazanec, J. A. (2006). The six identities of marketing: a vector quantization of
research approaches. European Journal of Marketing, 40 (5/6), 634-661,
https://doi.org/10.1108/03090560610657877.
Franzen, A., & Meyer, R. (2010). Environmental attitudes in cross-national perspective: A
multilevel analysis of the ISSP 1993 and 2000. European Sociological Review 26(2),
219-234.
Fredline, E., & Faulkner, B. (2000). Host community reactions: A cluster analysis. Annals of
Tourism Research, 27(3), 763–784.
Freire, J. R. (2016). Managing destination brand architecture – The case of Cascais
Municipality. Place Branding and Public Diplomacy, 12 (1), 78–90.
FutureBrand. (2018). Country Brand Index . Future Brand.
Gallarza, M. G., Saura, I. G., & Garcia, H. C. (2002). Destination image ‐ Towards a
conceptual framework. Annals of Tourism Research, 29(1), 56‐78.
García, J. A., Gómez, M., & Molina, A. (2012). A destination-branding model: An empirical
analysis based on stakeholders. Tourism Management, 33(3) , 646-661,
https://doi.org/10.1016/j.tourman.2011.07.006.
Gardner, G. T. (2002). Environmental problems and human behavior (2nd ed.). Boston, MA:
Pearson Custom Publishing.
Gartner, W. C. (2014). Brand equity in a tourism destination. Place Branding and Public
Diplomacy, 10(2), 108-116, DOI:10.1057/pb.20.
Gartner, W. C., & Konecnik Ruzzier, M. (2011). Tourism destination brand equity
dimensions: Renewal versus repeat market. Journal of Travel Research, 50(5), 471–
481.
Gerlach, A., & Witt, J. (2012, March). Sustainability in the Context of Strategic Brand
Management. Dissertation in International Marketing . Halmstad University School
of Business and Engineering.
Gertner, D. (2011). Unfolding and configuring two decades of research and publications on
place marketing and place branding. Place Branding and Public Diplomacy , 91-106.
Gill, M. S., & Dawra, J. (2010). Evaluating Aaker's Source of Brand Equity and the
Mediating Role of Brand Image. Journal of Targeting, Measurement and Analysis for
Marketing , 189-198.
Gnoth, J. (2002). Leveraging export brands through a tourism destination brand. Brand
Management, 9(4–5), 262–280, DOI:10.1057/palgrave.bm.2540077.
Gnoth, J. (2007). The structure of destination brands: leveraging values. Tourism Analysis,
12(5/6) , 345–358.
Go, F. M., & Govers, R. (2011). International place branding yearbook 2011: managing
reputational risk. Individual chapter’s contributors. London: Palgrave Macmillan:
Palgrave Macmillan.
Gössling, S. (2016). Tourism, information technologies and sustainability: An exploratory
review. Journal of Sustainable Tourism, 1–18.
Gössling, S., Ring, A., Dwyer, L., Andersson, A. C., & Hall, M. (2015). Optimizing or
maximizing growth? A challenge for sustainable tourism. Journal of Sustainable
Tourism, 1-21.
Grönroos, C. (2000). Service Management and Marketing. A customer relationship
management approach. 2nd edition. Wiley .
Grönroos, C. (2004). The relationship marketing process: communication, interaction,
dialogue, value. Journal of business & industrial marketing, 19(2), 99-113,
https://doi.org/10.1108/08858620410523981.
Grönroos, C. (2009). Marketing as promise management: regaining customer management for
marketing. Journal of Business and Industrial Marketing, 24/5/6 , 351‐359 .
183
Grösslinga, Stefan; Ring, Amata; Dwyer, Larry; Andersson, Ann-Christin; Hall, C Michael.
(2015). Optimizing or maximizing growth? A challenge for sustainable tourism.
Journal of Sustainable Tourism, http://dx.doi.org/10.1080/09669582.2015.1085869.
Gudjonsson, H. (2005). Nation branding. Place Branding, 1(3) , 283–298.
Gursoy, D., & Rutherford, D. G. (2004). Host attitudes toward tourism: An improved
structural model. Annals of Tourism Research, 31(3).
Gursoy, D., Chi, C. G., & Dyer, P. (2010). Local’s attitudes toward mass and alternative
tourism: The case of Sunshine Coast, Australia. Journal of Travel Research, 49, 381–
394.
Gustafson, T., & Chabot, B. (2007). Brand Awareness. . Cornell Maple Bulletin, 105.
Hair, J. F., Anderson, R. E., Babin, B. J., & Black, W. C. (2010). Multivariate data analysis:
A global perspective (Vol. 7). Upper Saddle River, NJ: Pearson.
Hall, C. M. (2007). Scaling ecotourism: The role of scale in understanding the impacts of
ecotourism. In J. E. Higham, Critical issues in ecotourism: Understanding a complex
tourism phenomenon (pp. 243–255). Oxford: Elsevier.
Hall, C. M. (2009). Degrowing tourism: Décroissance, sustainable consumption and steady-
state tourism. Anatolia,20(1), 46–61, doi:10.1080/13032917.2009.10518894.
Hall, C. M. (2011). Policy learning and policy failure in sustainable tourism governance:
From first and second to third order change? Journal of Sustainable Tourism, 649–671
doi:10.1080/09669582.2011.555555.
Hall, C. M. (2019). Constructing sustainable tourism development: The 2030 agenda and the
managerial ecology of sustainable tourism. Journal of Sustainable Tourism, 1-17,
https://doi.org/10.1080/09669582.2018.1560456.
Hall, C. M., & Page, S. J. (1999). The geography of tourism and recreation: Environment,
place and space. . London and New York, NY: Routledge.
Hall, C. M., Gössling, S., & Scott, D. (2015). The Routledge handbook of tourism and
sustainability. Abingdon: Routledge.
Hamilton, K., & Atkinson, G. (2006). Wealth, Welfare and Sustainablity, Advances in
Measuring Sustainable Development. Cheltenham, UK : Edward Elgar Publishing
Limited.
Hanks, L., Zhang, L., Line, N., & McGinley, S. (2016). When less is more: Sustainability
messaging, destination type, and processing fluency. International Journal of
Hospitality Management 58 , 34–43.
Hanson, D., & Grimmer, M. (2007). The mix of qualitative and quantitative research in major
marketing journals, 1993-2002. European Journal of Marketing, 41 (1/2), 58-70.
Hao, H., Long, P., & Kleckley, J. (2001). Factors Predicting Homeowners’ Attitudes toward
Tourism: A Case of a Coastal Resort Community. Journal of Travel research, 50(6),
627-640, doi.org/10.1177/0047287510385463.
Harju-Autti, P., & Kokkinen, E. (2014). A Novel Environmental Awareness Index Measured
Cross-Nationally For Fifty Seven Countries. Universal Journal of Environmental
Research and Technology, 4 (4), 178-198.
Harju-Autti, P., & Kokkinen, E. (2014). A Novel Environmental Awareness Index Measured
Cross-Nationally For Fifty Seven Countries . Universal Journal of Environmental
Research and Technology, Volume 4, Issue 4, 178-198.
Head, L. (2008). Is the concept of human impacts past its use-by date? Holocene, 18(3), 373–
377.
Henkel, R., Henkel, P., Agrusa, W., & Tanner, J. (2006). Thailand as a tourist destination:
perceptions of international visitors and Thai residents. Asia Pacific Journal of
Tourism Research, 11(3), 269–287.

184
Henriques, M. H., & Brilha, J. (2017). UNESCO Global Geoparks: A strategy towards global
understanding and sustainability. Episodes, 40(4), 349–355.
Herrera-Cano, C., & Herrera-Cano, A. (2016). Maldivian disaster risk management and
climate change action in toursm sector: Lessons for the sustainable development
agenda. Advances in Sustainability and Environmental Justice, 19, 113–131.
Hershberger, S. L. (2003). The Growth of Structural Equation Modeling: 1994 to 2001. .
Structural Equation Modeling 10(1) , 35-46.
Herstain, R., & Zvilling, M. (2011). Brand management perspectives in the twenty-first
century. Qualitative Market Research: An International Journal, 188-206.
Higgins-Desbiolles, F. (2010). The Elusiveness of Sustainability in Tourism: The Culture-
Ideology of Consumerism and its Implications. Tourism and Hospitality Research,
10(2), 116-129, doi.org/10.1057/thr.2009.31.
Higgins-Desbiolles, F. (2018). Sustainable tourism: Sustaining tourism or something more?
Tourism Management Perspectives, 25(1), 157-160,
doi.org/10.1016/j.tmp.2017.11.017.
Higham, J. E., Cohen, S. A., Peeters, P., & Gössling, S. (2013). Psychological and
behavioural approaches to understanding and governing sustainable mobility. Journal
of Sustainable Tourism, 21(7), 949–967.
Homburg, C., Klarmann, M., & Schmitt, J. (2010). Brand awareness in business markets:
When is it related to firm performance? . International Journal of Research in
Marketing, 201-212.
Horng, J. S., Liu, C. H., Chou, H. Y., & Tsai, C. Y. (2012). Understanding the impact of
culinary brand equity and destination familiarity on travel intentions. Tourism
Management, 33 , 815‐824.
Horwat, C. (2005). Strategija razvoja turizma Republike Srbije- prvi fazni izvestaj. Beograd:
Ekonomski fakultet, MInistartstvo trgovine, turizma i usluga.
Hosany, S., Ekinci, Y., & Uysal, M. (2006). Destination image and destination personality: an
application of branding theories to tourism places. Journal of Business Research , 638-
642.
Houston, M. B. (2004). Assessing the Validity of Secondary Data Proxies for Marketing
Constructs. Journal of Business Research, 57 (2), 154-61.
Hsieh, A., & Li, C. (2008). The moderating effect of brand image on public relations
perception and customer loyalty. Marketing Intelligence & Planning , 26-42.
Hu, L., & Bentler, P. M. (1998). Fit indices in covariance structure modelling: Sensitivity to
underparameterized model misspecification. Psychological Methods, 3(4), 424–453.
Hult, G. T. (2011). Market-focused sustainability: market orientation plus! Journal of the
Academy of Marketing Science, 39(1), 1-6.
Hung, K., Sirakaya-Turk, E., & Ingram, L. J. (2011). Testing the efficacy of an integrative
model for community participation. Journal of Travel Research, 50 , 276–288.
Hur, M., Ahn, K., & Kim, M. (2011). Building brand loyalty through managing brand
community commitment. Management Decision , 1194-1213.
Im, H. H., Kim, S. S., Elliot, S., & Han, H. (2012). Conceptualizing destination brand equity
dimensions from a consumer-based brand equity perspective. Journal of Travel &
Tourism Marketing 29(4), 385-403, DOI:10.1080/10548408.2012.674884.
Imon, S. S. (2017). Cultural heritage management under tourism pressure. Worldwide
Hospitality and Tourism Themes, 9(3), 335–348. doi:10.1108/WHATT-02-2017-0007.
Iniesta-Bonillo, M. A., Sánchez-Fernández, R., & Jiménez-Castillo, D. (2016). Sustainability,
value, and satisfaction: Model testing and cross-validation in tourist destinations.
Journal of Business Research, 1-6.

185
Insch, A. (2019). The challenges of over-tourism facing New Zealand: Risks and responses.
Journal of Destination Marketing & Management,
https://doi.org/10.1016/j.jdmm.2019.100378.
Iordanova, E. (2017). Tourism destination image as an antecedent of destination loyalty: The
case of Linz, Austria. European Journal of Tourism Research, 16,, 214–232.
Jaffe, E. D., & Nebenzahl, I. D. (2001). National image and competitive advantage.
Copenhagen: Copenhagen Business School Press.
Jansen, S. C. (2008). Designer nations: Neo-liberal nation branding - Brand Estonia. . Social
Identities , 121-142.
Javalgi, R. R., & Moberg, C. R. (n.d.). Service loyalty: implications for service providers.
Journal of Services Marketing , 169-179.
Jennings, G. R. (2009). Methodologies and Methods. In: Jamal, T. And Robinson, M. (Eds),
The SAGE Handbook of Tourism Studies. London, SAGE. London: SAGE.
Jöreskog, K. G. (1981). Basic Issues in the Application of LISREL. Data, 1, 1-6.
Jöreskog, K. G., & Sörbom, D. (1976). LISREL III: Estimation of Linear Structural Equatio
Systems by Maximum Likelihood Methods. Chicago, IL: National Educational
Resources, Inc. .
Jöreskog, K. G., & Sörbom, D. (1997). LISREL 8: A Guide to the Program and Applications.
Chicago, IL: SPSS Inc. .
Jung, J., & Shen, D. (2011). Brand equity of luxury fashion brands among Chinese and US
young female consumers. Journal of East-West Business , 48-69.
Kaiser, H. F., & Rice, J. (1974). Little Jiffy, Mark IV. Educational and Psychological
Measurement, 34, 111-117.
Kallis, G., Kostakis, V., Lange, S., Muraca, B., Paulson, S., & Schmelzer, M. (2018).
Research on Degrowth. Annual Review of Environment and Resources, 43(1), 291–
226, doi:10.1146/annurev-environ-102017-025941.
Kamakura, W., & Russell, G. (1993). Measuring Brand Value with Scanner Data. Journal of
Research in Marketing , 9-21.
Kao, Y. F., Huang, L. S., & Wu, C. H. (2002). Effects of theatrical elements on experiential
quality and loyalty intentions for theme parks. Asia Pacific Journal of Tourism
Research, 13(2), 163–174.
Kapferer, J. N. (2004). Strategic Brand Management: Creating and Sustaining Brand Equity
Long Term. London: Kogan Page.
Kavaratzis, M. (2010). Place branding: where do we stand? In G. Ashworth, & M. Kavaratzis,
Towards Effective Place Brand Management. Northampton: Edward Elgar
Publishing. (pp. 1-14).
Keiner, M. (2000). History, definition(s), and models of “sustainable development” . , Zürich,
Switzerland: Unpublished manuscript, ETH Zürich.
Keller, K. (1993). Conceptualizing, measuring, and managing customer‐based brand equity.
Journal of Marketing, 57, 1-22, DOI:10.2307/1252054.
Keller, K. L. (2013). Strategic Brand Managment. In K. L. Keller, Strategic Brand
Managment Building, Measuring and Managing Brand Equity. Essex: Pearson.
Keller, L. K. (2009). Building Strong Brands in the Modern Marketing Communication
Invironment. Journal of Marketing Communications, 139-155.
Kenny, D. A. (2016, April 9). SEM: Confirmatory Factor Analysis (David A. Kenny).
Retrieved from davidakenny.net: http://davidakenny.net/cm/mfactor.htm
Kerk, G., & Manuel, A. (2014). Sustainable Society Index 2014. The Hague: Sustainable
Society Foundation.

186
Kim, A. K., & Brown, G. (2012). Understanding the relationships between perceived travel
experiences, overall satisfaction, and destination loyalty. Anatolia . International
Journal of Tourism Hospitality Research 23, 328–347.
Kim, C. K. (1995). Brand popularity and country image in global competition: managerial
implications. Journal of Product and Brand Management, 21-33.
Kim, D., & Perdue, R. R. (2011). The Influence of Image on Destination Attractiveness.
Journal of Travel & Tourism Marketing 28 (3), 225–39.
Kim, H.-K., & Lee, T. J. (2017). Brand Equity of a Tourist Destination. Sustainability, 1-21.
Kim, M.-S., Thapa, B., & Kim, H. (2017). International Tourists’ Perceived Sustainability o
Jeju Island, South Korea. Sustainability, 1-13.
Kim, S. H., Han, H. S., Holland, S., & Byon, K. K. (2009). Structural relationships among
involvement, destination brand equity, satisfaction and destination visit intentions: The
case of Japanese outbound travelers. Journal of Vacation Marketing, 15(4), 299–309,
https://doi.org/10.1177/1356766709335835.
King, B., Pizam, A., & Milman, A. (1993). Social impacts of tourism: Host perceptions.
Annals of Tourism Research, 20 (4), 650-665.
Kirmani, A., & Rao, A. (2000). No pain, no gain: A critical review of the literature on
signaling unobservable product quality. Journal of Marketing , 66-79.
Kladou, S., & Kehagias, J. (2014). Assessing destination brand equity: An integrated
approach. Journal of Destination Marketing & Management , 2-10.
Kladou, S., Giannopoulos, A. A., & Mavragani, E. (2015). Destination brand equity research
from 2001 to 2012. Tourism Analysis, 20 (2), 189-200,
DOI:10.3727/108354215X14265319207399.
Kladou, S., Kavaratzis, M., Rigopoulou, E., & Salonika, E. (2017). The role of brand
elements in destination branding. Journal of Destination Marketing & Management, 6
(4), 426-435, .
Klöckner, C. A. (2013). A comprehensive model of the psychology of environmental
behaviour-A meta-analysis. Global Environmental Change 23(5), 1028-1038.
Ko, T. G. (2005). Development of a tourism sustainability assessment procedure: A
conceptual approach. Tourism Management, 26(3), 431–445,
https://doi.org/10.1016/j.tourman.2003.12.003.
Konecnik, M., & Gartner, W. C. (2007). Customer-based brand equity for a destination.
Annals of Tourism Research 34(2), 400–421, DOI:10.1016/j.annals.2006.10.005.
Kotler, P. (1991). In P. Kotler, Principles of Marketing. 5th edn. (p. 442). New Jersey:
Prentice Hall.
Kotler, P., & Keller, K. L. (2012). Marketing Management. Upper Saddle River,NJ: Prentice
Hall.
Kotler, P., & Keller, K. L. (2016). A Framework for Marketing Management. Boston: Pearson
.
Kristjánsdóttir, K. R., Ólafsdóttir, R., & Ragnarsdóttir, K. V. (2017). Reviewing integrated
sustainability indicators for tourism. Journal of Sustainable Tourism,
http://dx.doi.org/10.1080/09669582.2017.1364741.
Latkova, P., & Vogt, C. A. (2012). Residents' Attitudes toward Existing and Future Tourism
Development in Rural Communities. Journal of Travel Research, 51(1), 50-67.
Lean, G. L. (2009). Transformative travel: Inspiring sustainability. In R. Bushel, & P.
Sheldon, Wellness and tourism: Mind, body, spirit, place (pp. 191-205). . New York:
Cognizant.
Lee, H., Ju-Pak, K.-H., & Hong, M. (2015). Comparative Perspectives on Brand Value of
Place Slogans: Analysis of Different Cities, States, and Countries. American
International Journal of Social Science , 59-70.

187
Lee, N., & Kirkpatrick, C. (1997). Intergrating appraisal within the development process . In
N. Lee, & C. Kirkpatrick, Sustainable Development in a Developing World:
Intergrating Socio-economic Appraisal and Environmental Assessment (pp. 11–13).
Northampton, MA: Edward Elgar.
Lehmann, D. R., Keller, K. L., & Farley, J. U. (2008). The Structure of Survey‐Based Brand
Metrics . Journal of International Marketing, 16(4), 29‐56.
Leonidou, L. C., Talias, M. A., & Leonidou, C. N. (2008). Exercised power as a driver of trust
and commitment in cross-border industrial buyer-seller relationships . Industrial
Marketing Management, 37, 92–103.
Likert, R. (1932). A Technique for the Measurement of Attitudes. New York: Archives of
Psychology.
Lim, Y., & Weaver, P. A. (2014). Customer‐based brand equity for a destination: The effect
of destination image on preference for products associated with a destination brand.
International Journal of Tourism Research, 16(3), 223-231,
https://doi.org/10.1002/jtr.1920.
Lind, N. D., Hanks, L., & Miao, L. (2018). Image Matters: Incentivizing Green Tourism
Behavior. Journal of Travel Research, 3, DOI: 10.1177/0047287517697848.
Lindberg‐Repo, K., & Grönroos, C. (2004). Conceptualising communications strategy from a
relational perspective. Industrial Marketing Management, 33(3) , 229‐239.
Lindemann, J. (2010). The Economy of Brands. New York: Palgrave Macmillan.
Lindenberg, S., & Steg, L. (2007). Normative, gain and hedonic goal frames guiding
environmental behavior. Journal of Social issues, 63(1), 117-137,
https://doi.org/10.1111/j.1540-4560.2007.00499.x.
Line, N. D., & Hanks, L. (2016). “The Effects of Environmenta and Luxury Beliefs on
Intention to Patronize Green Hotels: The Moderating Effect of Destination Image.”.
Journal of Sustainable Tourism 24 (6), 904–25.
Line, N. D., Hanks, L., & Miao, L. (2017). Image Matters: Incentivizing Green Tourism
Behavior. Journal of Travel Research 57(3), 1-14,
https://doi.org/10.1177/0047287517697848.
Liu, A. (2006). Tourism in Rural Areas: Kedah, Malaysia. Tourism Management, 27 (5), 878-
889.
Liu, G., Liston-Heyes, C., & Ko, W. W. (2010). Employee participation in cause-related
marketing strategies: A study of management perceptions from British consumer
service industries. Journal of Business Ethics, 92(2), 195–210.
LOHAS. (2017, February 22). Lifestyle of Health and Sustainability. Retrieved from
http://www.lohas.com.au
Lopesi, S. D. (2011). Destination image: Origins, Developments and Implications. Pasos ,
305-315.
Low, G. S., & Lamb Jr, C. W. (2000). The measurement and dimensionality of brand
associations. Journal of Product & Brand Management, 350-370.
Lucarelli, A., & Brorström, S. (2013). Problematising place branding research: A meta-
theoretical analysis of the literature. The Marketing Review, 65-81.
Madrigal, R. (1993). A Tale of Tourism in Two Cities. Annals of Tourism Research, 20 (2),
336-53.
Malhotra, N. K. (1996). Marketing Research: An Applied Orientation. Upper Saddle River,
NJ: Prentice Hall.
Malhotra, N., & Dash, S. (2011). Marketing Research an Applied Orientation. London:
Pearson Publishing.
Malone, S., McCabe, S., & Smith, A. P. (2014). The role of hedonism in ethical tourism.
Annals of Tourism Research, 44(jan), 241-254.

188
Mariutti, F., & Tench, R. (2015). Are we talking the Same Language? Challenging
Complexity in Country Brand Models. Athens Journal of Business and Economics ,
49-61 .
Martin, J. M., Salinas, J. A., & Rodriguez, J. A. (2018). Comprehensive evaluation of the
tourism seasonality using a synthetic DP2 indicator. Tourism Geographies, 1–22,
https://doi.org/10.1080/14616688.2018.1505943.
Martínez, J. M., Martín, J. M., Fernández, J. A., & Mogorrón-Guerrero, H. (2019). An
analysis of the stability of rural tourism as a desired condition for sustainable tourism.
Journal of Business Research 100, 165–174,
https://doi.org/10.1016/j.jbusres.2019.03.033.
Mbaiwa, J. E. (2005). Enclave tourism and its socio-economic impacts in the Okavango
Delta, Botswana. Tourism Management, 26, 157–172.
McCool, S., Butler, R., Buckley, R., Weaver, D., & Wheeller, B. (2013). Is concept of
sustainability utopian: Ideally perfect but impracticable? . Tourism Recreation
Research, 38(1), 213–242.
McGehee, N. G., & Andereck, K. L. (2004). Factors Predicting Rural Residents’ Support of
Tourism . Journal of Travel Research, 43 (2), 188-200.
Mehmetoglu, M. (2007). Nature-based tourists: The relationship between their trip
expenditures and activities. Journal of Sustainable Tourism, 15(2), 200-215.
Meijkamp, R. (2000). Changing consumer behaviour through eco-efficient services, an
empirical study on car sharing in The Netherlands, PhD Thesis, 11, May. Heveka,
Alblasserdam: Delft Univresity of Technology.
Melo, F. V., & de Farias, S. A. (2018). Sustainability communication and its effect in
consumer intention to visit a tourist destination. Tourism & Management Studies,
14(2) , 36-44, DOI: 10.18089/tms.2018.14204.
Miao, L., & Wei, W. (2013). “Consumers’ Pro-environmental Behavior and the Underlying
Motivations: A Comparison between Household and Hotel Settings.” . International
Journal of Hospitality Management 32, 102–112.
Mihailovich, P. (2006). Kinship Branding: A Concept of Holism and Evaluation for the
Nation Brand . Place Branding , 229-247.
Mihalic, T. (2016). Sustainable-responsible tourism discourse – Towards responsible future.
Journal of Cleaner Production, Volume 111, Part B, 16 January 2016, , 461-470,
https://doi.org/10.1016/j.jclepro.2014.12.062.
Mihalič, T., Šegota, T., Knežević Cvelbar, L., & Kir, K. (2016). The influence of the political
environment and destination governance on sustainable tourism development: a study
of Bled, Slovenia. Journal of Sustainable Tourism, 24(11), 1489-1505.
doi.org/10.1080/09669582.2015.1134557.
Mihanyar, P., Rahman, S. A., & Aminudin, N. (2015). The Influence of Sustainable Tourism
Awareness and Environmental Sustainability Dimensions on Behavioural Intentions
Among Domestic Tourists in Developing Countries. Tourism, Leisure and Global
Change, (2), p.TOC-119.
Milano, C. (2018). Overtourism, malestar social y turismofobia. Un debate controvertido.
[Overtourism, social unrest and tourismphobia. A controversial debate]. Pasos.
Revista de Turismo y Patrimonio Cultural, 16(3), 551–564,
doi:10.25145/j.pasos.2018.16.041.
Milano, C., Novelli, M., & Cheer, J. M. (2019). Overtourism and degrowth: a social
movements perspective. Journal of Sustainable Tourism,
doi.org/10.1080/09669582.2019.1650054.
Milman, A., & Pizam, A. (1995). The role of awareness and familiarity with a destination.
Journal of Travel Research 33(3), 21–27.

189
Mitchell, R. W., Wooliscroft, B., & Higham, J. (2010). Sustainable Market Orientation: A
New Approach to Managing Marketing Strategy. Journal of Macromarketing, 30(2) ,
160-170.
Mitchell, R., Wooliscroft, B., & Higham, J. E. (2013). Applying sustainability in National
Park management: Balancing public and private interests. Journal of Sustainable
Tourism, 21(5), 695–715.
Moeller, S. (2010). Characteristics of services – a new approach uncovers their value. Journal
of services Marketing, 24/5 , 359‐368.
Moilanen, T., & Rainisto, S. (2009). How to brand nations, cities and destinations: a
planning book for place branding. London: Palgrave Macmillan.
Moise, M. S., Gil-Saura, I., Šerić, M., Eugenia, M., & Molina, R. (2019). nfluence of
environmental practices on brand equity, satisfaction and word of mouth. Journal of
Brand Management, 1-12.
Moradi, H., & Zarei, A. (2012). Creating consumer-based brand equity for young Iranian
consumers via country of origin sub-components effects. Asia Pacific Journal of
Marketing and Logistics, 394-413.
Morgan, N., Pritchard, A., & Pride, R. (2002). Destination branding: Creating the unique
destination proposition. In Contextualizing destination branding (pp. 10-41). Oxford:
Butterworth-Heinemann.
MTTT. (2016). Tourism Development Strategy of the Republic of Serbia 2016-2025.
Belgrade: Government of the Republic of Serbia Ministry of Trade, Tourism and
Telecommunications.
Muler Gonzalez, V., Coromina, L., & Galí, N. (2018). Overtourism: residents’ perceptions of
tourism impact as an indicator of resident social carrying capacity - case study of a
Spanish heritage town. Tourism Review, Vol. 73 No. 3, 277-296.
https://doi.org/10.1108/TR-08-2017-0138.
Myagmarsuren, O., & Chen, C. (2011). Exploring relationships between destination brand
equity, satisfaction, and destination loyalty: a casestudy of Mongolia. Journal of
Tourism, Hospitality & Culinary Arts, 3(2), 81-94.
Nam, J., Ekinci, Y., & Whyatt, G. (2011). Brand equity, brand loyalty, and consumer
satisfaction. Annals of Tourism Research, 38 (3), 1009–1030.
Nation Brands Index, N. (2016, December 8). Anholt-GfK Nation Brands Index. Retrieved
from The Place Brand Observer: https://placebrandobserver.com/results-anholt-gfk-
nation-brands-index-2016/
Ndlovu, J., & Heath, E. (2013). Re-branding of Zimbabwe to enhance sustainable tourism
development: Panacea or Villain. Academic Journals, 1(12) , 947-955.
Netemeyer, R. G., Bearden, W. O., & Sharma, S. (2003). Scaling Procedures: Issues and
Applications. Thousand Oaks, CA: Sage.
Nguyen, T. D., Barrett, N. J., & Miller, K. E. (2011). Brand loyalty in emerging markets. .
Journal of Marketing Intelligence & Planning , 222-232.
Nguyne, T. V., & Rose, J. (2009). Building trust – Evidence from Vietnamese entrepreneurs.
Journal of Business Venturing, 24, 165–182.
Nicolau, J. L., & Mas, F. J. (2005). Stochastic modeling: A three-stage tourist choice process.
Annals of Tourism Research, 3(1), 49-69,
https://doi.org/10.1016/j.annals.2004.04.007.
Nordin, S. (2005). Tourism of tomorrow - travel trends and force of change. ETOUR
European Tourism Research Institute.
Nourry, M. (2008). Measuring sustainable development: Some empirical evidence for France
from eight alternative indicators. Ecological Economics, 441-456.

190
Nunkoo, R. (2016). Toward a More Comprehensive Use of Social Exchange Theory to Study
Residents’ Attitudes to Tourism. Procedia Economics and Finance 39, 588 – 596 .
Nunkoo, R., & Gursoy, D. (2012). Residents’ support for tourism: An identity perspective.
Annals of Tourism Research, 39(1), 243–268.
Nunkoo, R., & Ramkissoon, H. (2011). Residents’ satisfaction with community attributes and
support for tourism. Journal of Hospitality and Tourism Research 35(2), 171–190.
Nunkoo, R., & Ramkissoon, H. (2012). Power, trust, social exchange and community support.
Annals of Tourism Research, 39 (2), 997-1023.
Nunkoo, R., Smith, S., & Ramkissoon, H. (2013). Residents’ attitudes to tourism: a
longitudinal study of 140 articles from 1984 to 2010. 5-25. Journal of Sustainable
Tourism, 21study of 140 articles from 1984 to 2010.
Nyaupane, G. P., & Timothy, D. J. (2010). Power, regionalism and tourism policy in Bhutan. .
Annals of Tourism Research, 37(4), 969–988.
Öberg, P., & Svensson, T. (2010). Does power drive our trust? Relations between labor
market actors in Sweden. Political Studies, 58, 143–166.
OECD. (2016, October 5). Society at a Glance 2016. Retrieved from OECD Social Indicators:
http://www.oecd-ilibrary.org/social-issues-migration-health/society-at-a-glance-
2016_9789264261488-en
Oppermann, M. (2000). Tourism destination loyalty . Journal of Travel Research 39(3), 78–
84.
Palmer, A. (2010). Customer experience management: a critical review of an emerging idea .
Journal of Services Marketing, 24(3), 196‐208.
Pappu, R., Quester, P. G., & Cooksey, R. W. (2007). Country image and consumer-based
brand equity: relationships and implications for international marketing. Journal of
International Business Studies , 726-745.
Parasuraman, A., Zeithaml, A. V., & Berry, L. L. (1988). SERVQUAL: A Multiple‐item
Scale for Measuring Consumer Perceptions of Service Quality . Journal of Retailing,
64 (Spring), 12‐37.
Park, C. S., & Srinivasan, V. (1994). A survey-based method for measuring and
understanding brand equity and its extendibility. Journal of marketing research, 31(2),
https://doi.org/10.1177/002224379403100210.
Park, D. B., Lee, K. W., Choi, H. S., & Yoon, Y. (2012). Factors influencing social capital in
rural tourism communities in South Korea. 1511–1520: Tourism Management, 33.
Parkvithee, N., & Miranda, M. J. (2012). The interaction effect of country-of-origin, brand
equity and purchase involvement on consumer purchase intentions of clothing labels.
Asia Pacific Journal of Marketing, 24(1), 7-22,
https://doi.org/10.1108/13555851211192678.
Partanen-Hertell, M., Harju-Autt, P., Kreft-Burman, K., & Pemberton, D. (1999). Raising EA
in the Baltic Sea area. The Finish Environment 327. ISBN 952-11-0528-3 (p. 128). .
Helsinki: Finnish Environment Institute.
Pereira, H. M., Leadley, P. W., Proenc¸a, V., Alkemade, R., & Scharlemann, J. P. (2010).
Scenarios for global biodiversity in the 21st century. Science, 330, 1496–1501.
Persha, L., Agrawal, A., & Chhatre, A. (2011). Social and ecological synergy. Science 331,
1606–1608.
Peterson, M., & Malhotra, N. K. (1997). Comparative Market Marketing Measures of
SocietalQuality of Life: Substantive Dimensions in 186 Countries. Journal of
Macromarketing, 17 (Spring), 25-38.
Petrenko, P. (2015, May 29). Country-of-origin image effects on satisfaction and purchase
intention in the industrial product for seafood producs: A study of Norwegian, Chilean
and Canadian salmon buyers . Aalesund: Aalesund University College.

191
Pike, S. (2007). PiConsumer-based brand equity for destinations: Practical DMO performance
measures. Journal of Travel & Tourism Marketing, 22(1), 51–61.
Pike, S., & Bianchi, C. (2016). Destination brand equity for Australia : testing a model of
CBBE in short haul and long haul markets. Journal of Hospitality and Tourism
Research, 40(1), 114-134.
Pike, S., Bianchi, C., Kerr, G., & Patti, C. (2010). Consumer-based brand equity for Australia
as a long-haul tourism destination in an emerging market. International Marketing
Review, 27(4), 434–449, DOI:10.1108/02651331011058590.
Pitta, D. A., & Katsanis, L. P. (1995). Understanding brand equity for successful brand
extension. Journal of consumer marketing, 12(4), 51-64,
https://doi.org/10.1108/07363769510095306.
Pollock, A. (2012, September 12). Conscious travel: Signposts towards a new model for
tourism. 2nd UNWTO Ethics and Tourism Congress Conscious Tourism for a New
Era, Quito.
Pollock, A. (2015). Social entrepreneurship in tourism: The conscious travel approach. UK:
Tourism Innovation Partnership for Social Entrepreneurship (TIPSE).
Popescu, R. (2007). National Brand – A Challenge for Romania. Transylvania Review of
Administrative Sciences, 86-102.
Popesku, J. (2016). Menadzment turisticke destinacije. Beograd: Univerzitet Singidunum.
Porter, M., & Kramer, M. (2011). Creating Shared Value. Harvard Business Review, 89(1/2) .
62-77.
Pratt, S. (2015). The economic impact of tourism in SIDS. Annals of Tourism Research, 52 ,
148–160.
Prebensen, N. K., Woo, E., Chen, J. S., & Uysal, M. (2012). Motivation and involvement as
antecedents of the perceived value of the destination experience. Journal of Travel
Research, 52(2), 253–264.
Qiu Zhang, H., Fan, D. X., Tse, T. S., & King, B. (2016). Creating a scale for assessing
socially sustainable tourism. Journal of Sustainable Tourism, 1-18.
Qiu, H., Fan, D. X., Lyu, J., Lin, P. M., & Jenkins, C. L. (2018). Analysing the Economic
Sustainability of Tourism Development: Evidence from Hong Kong. Journal of
Hospitality & Tourism Research, Vol. XX, No. X, Month 201X,, 1–23, DOI:
10.1177/1096348018777046.
Qiu, H., Fan, D. X., Lyu, J., Lin, P., & Jenkins, C. L. (2019). Analyzing the Economic
Sustainability of Tourism Development: Evidence from Hong Kong. Journal of
Hospitality & Tourism Research, 43(2), 226–248,
https://doi.org/10.1177/1096348018777046.
Ram, Y., & Hall, C. M. (2015). Length of family vacations, children’s age and parenting style
an exploratory study. Anatolia, 26, 476-479.
Reisinger, Y. (2013). Transformational Tourism: Tourist Perspective . Wallingford: CABI.
Reitsamera, B. F., Brunner-Sperdinb, A., & Stokburger-Sauer, N. E. (2916). Destination
attractiveness and destination attachment: The mediating role of tourists’ attitude.
Tourism Management Perspectives, 19, 93-101, doi.org/10.1016/j.tmp.2016.05.003.
Ritchie, B. J., & Crouch, G. L. (2003). The Competitive Destination: The Sustainable Tourism
Perspective. Cambridge: CABI Publishing.
Ritchie, J. B., & Crouch, G. I. (2010). A Model of Destination
Competitiveness/Sustainability: Brazilian Pespectives. Revista de Administracao
Publica .
Ritchie, J. R., & Ritchie, R. J. (1998). The Branding of Tourism Destinations: Past
Achievements and Future Challenges. Proceedings of the 1998 Annual Congress of
the International Association of Scientific Experts in Tourism, Destination Marketing:

192
Scopes and Limitations, P. Keller and M. Morocco (eds.) (pp. 89–116). Switzerland:
St. Gallen: International Association of Scientific Experts in Tourism.
Rojas-Méndez, J. (2013). The Nation Brand Molecule. Journal of Product & Brand
Management .
Roy, R. (2000). Sustainable product-service systems. Futures, 32, 289-99.
RTP, R. T. (2019, October 5). Overtourism. Retrieved from
responsibletourismpartnership.org:
http://responsibletourismpartnership.org/overtourism
Rutty, M., Gössling, S., Scott, D., & Hall, C. M. (2015). The global effects and impacts of
tourism. In C. M. Hall, S. G€ossling, & D. Scott, The Routledge handbook of tourism
and sustainability (pp. 36–63). Abingdon: Routledge.
Ruzzier, M. K., & De Chernatony, L. (2013). Developing and applying a place brand identity
model: The case of Slovenia. Journal of Business Research 60(1), 45-52.
Ryglová, K., Ryglová, K., Š. J., & Maráková, V. (2018). Building Customer Loyalty in Rural
Destinations as a Pre-Condition of Sustainable Competitiveness. Sustainability 2018,
10(4), 957-968; https://doi.org/10.3390/su10040957.
Saleem, S., Rahman, S. U., & Umar, R. M. (2015). Measuring customer based beverage brand
equity: Investigating the relationship between perceived quality, brand awareness,
brand image, and brand loyalty. International Journal of Marketing Studies, 7(1) , 66-
76, http://dx.doi.org/10.5539/ijms.v7n1p66 .
San Martín, H., Herrero, A., & García de los Salmones, M. d. (2018). An integrative model of
destination brand equity and tourist satisfaction. Current Issues in Tourism, 22 (16),
1992-2013 , 10.1080/13683500.2018.1428286.
Sanchez, J., Callarisa, L. J., Rodrıguez, R. M., & Moliner, M. A. (2006). Perceived value of
the purchase of a tourism product. Tourism Management, 27(4), 394-409.
Sangpikul, A. (2017). The influences of destination quality on tourists’ destination loyalty: An
investigation of an island destination. Tourism, 65, 422–436.
Saunders, M., Lewis, P., & Thornhill, A. (2016). Research Methods. Harlow: Pearson.
Scharmer, O., & Kaufer, K. (2013). Leading from the Emerging Future. Oakland: Berrett-
Koehler. Retrieved 2017, from Scharmer, O. & Kaufer K, (2013). Leading from the
Emerging Future: From Ego-system to Eco-system Economies. Retrieved from
Sydney: ReadHowYouWant.com.
Scheyvens, R., Banks, G., & Hughes, E. (2016). The private sector and the SDGs: The need to
move beyond ‘business as usual'. Sustainable Development, 24(6), 371–382.
doi:10.1002/sd.1623.
Schröter, T. Y., & Schwekendiek, D. (2015). Understanding South Korea's' Poor Nation
Brand Image: A Content Analysis of Two Leading German Print News Media, 1948-
2013. International Journal of Asia, 11(1), 115–135.
Schwartz, S. H. (1992). Universals in the content and structures of values: Theoretical
advances and empirical tests in 20 countries. In M. Zanna (Ed.). Orlando, FL:
Academic Press.
Seraphin, H., Sheeran, P., & Pilato, M. (2018). Over-tourism and the fall of Venice as a
destination. Journal of Destination Marketing & Management, 9, , 374–376.
doi:10.1016/j.jdmm.2018.01.011.
Sevin, E. (2011). Thinking about place branding: Ethics of concept. Place Branding and
Public Diplomacy , DOI= 10.1057/pb.2011.15, 155-164.
Shahin, A., Kazemi, A., & Mahyari, H. K. (2012). How consumer's perception of country of
origin affects brand equity: A case study in Iran. Middle-East Journal of Scientific
Research, .

193
Sharma, P. (2011). Country of origin effects in developed and emerging markets: Exploring
the contrasting roles of materialism and value consciousness. Journal of International
Business Studies , 285-306.
Sheldon, P., & Dwyer, L. (2010). The global financial crisis and tourism. Journal of Travel
Research, 49(1). 3-45.
Shen, H., Luo, J., & Zhao, A. (2017). The sustainable tourism development in Hong Kong:
An analysis of Hong Kong residents' attitude towards mainland Chinese tourist.
Journal of Quality Assurance in Hospitality & Tourism, 18, 45–68.
https://doi.org/10.1080/1 528008x.2016.1167650.
Shimp, T. (2007). Integrated marketing promotions in advertising and promotion. 7th ed.
Mason, Ohio: Thompson South-Western.
Simkins, T. J., & Peterson, M. (2015). Assessing the Value of a Societal-Level Sustainability
Index for Macromarketing Research. Journal of Macromarketing , 1-18.
Simon, C. J., & Sullivan, M. W. (1990). The measurement and determinants of brand equity:
A financial approach. Working Paper. Graduate School of Business, University of
Chicago.
Sinclair, R. N., & Keller, K. L. (2014). A case for brands as assets: Acquired and internally
developed. Journal of Brand Managment , 286-302.
Spangenberg, J. H. (2002). Environmental space and the prism of sustainability: frameworks
for indicators measuring sustainable development. Ecological Indicators, 2 , 295–309.
Retrieved from Indicators for sustainable communities:
http://www.foeerupe.org/sustainability/sustain/t-content-prism.htm
Srinivasan, V., Park, C., & Chang, D. (2005). An Approach to the Measurement Analysis and
Prediction of Brand Equity and its Sources. Management Science , 1433-1448.
SSF. (2014, December ). Sustainable Society Index. Retrieved from Sustainable Society
Foundation: http://www.ssfindex.com/about-ssf/
Stapp, W., Bennett, D., Bryan, W., Fulton, J., MacGregor, J., Nowak, P., & Havlick, S.
(1969). The concept of environmental education. Journal of Environmental Education,
1(1), 30-31.
Statistical Yearbook. (2019). Statistical Yearbook of the Republic of Serbia. Belgrade:
Statistical office of the Republic of Serbia.
Steenkamp, J. B., & Baumgartner, H. (2000). On the use of structural equation models for
marketing modeling. International Journal of Research in Marketing, 17(2-3), 195-
202, https://doi.org/10.1016/S0167-8116(00)00016-1.
Steg, L., & Nordlund, A. (2012). Models to explain environmental behaviour. Chichester:
Wiley-Blackwell.
Steg, L., Bolderdijk, J. W., Keizer, K., & Perlaviciute, G. (2014). An integrated framework
for encouraging pro-environmental behaviour: The role of values, situational factors
and goals. Journal of Environmental Psychology, 38, 104-115,
https://doi.org/10.1016/j.jenvp.2014.01.002.
Steg, L., De Groot, J. I., Dreijerink, L., Abrahamse, W., & Siero, F. (2011). General
antecedents of personal norms, policy acceptability, and intentions: The role of values,
worldviews, and environmental concern. Society and Natural Resources 24(4) , 349-
367.
Steg, L., Perlaviciute, G., Van derWerff, E., & Lurvink, J. (2014). The significance of hedonic
values for environmentally-relevant attitudes, preferences and actions. Environment
and Behavior, 46(2), 163-192, http://dx.doi.org/10.1177/0013916512454730.
Stronza, A., & Gordillo, J. (2008). Community views of ecotourism. Annals of Tourism
Research, 35(2, 448–468.

194
Sweeney, J., & Soutar, G. N. (2001). Consumer perceived value: the development of a
multiple item scale. Journal of Retailing, 77(2), 203–220.
Szmigin, I., Carrigan, M., & McEachern, M. G. (2009). The conscious consumer: taking a
flexible approach to ethical behaviour. International Journal of Consumer Studies,
33(2), 224-231, https://doi.org/10.1111/j.1470-6431.2009.00750.x.
Szondi, G. (2007). The Role and Challenges of Country Branding in Transition Countries:
The Central and Eastern European Experience . Place Branding and Public
Diplomacy , , 8-20.
Tasci, A. D. (2018). Testing the cross-brand and cross-market validity of a consumer-based
brand equity (CBBE) model for destination brands. Tourism Management, 65, 143-
159.
Taylor, P. J. (1995). Building on construction: An exploration of heterogeneous
constructionism, using an analogy from psychology and a sketch from socio-economic
modeling. Perspectives on Science, 3(1), 66–98.
Taylor, P. J. (1999). What can agents do? Engaging with complexities of the post-Hardin
commons. . Advances in Human Ecology, 8, 125–156.
Teodorović, M., Popesku, J., & Pavlović, D. (2019). Building a Domestic Destination Brand:
A Case of Serbia. TEME .
UNDP. (2017). UN Human Development Report 2014 . New York: United Nations
Development Pregramme.
United Nations. (2008). Measuring Sustainable Development. Geneva: United Nations.
UNSDG 2030. (2019, May 28). Sustainable Development Goals. Retrieved from UN
Sustainable Develoopment Goals Knowledge Platform:
https://sustainabledevelopment.un.org/?menu=1300
UNWTO. (2007). Sustainable Tourism Indicators and Destination Management. Kolasin,
Montenegro: UNWTO.
UNWTO. (2015-2017). Word Tourism Organization (TTCR17 05.04.17. Madrid: Word
Tourism Organization .
UNWTO, & UNDP. (2017). Tourism and the sustainable development goals – Journey to
2030 . Madrid: UNWTO.
Usakli, A., & Baloglu, S. (2011). Brand personality of tourist destinations: An application of
self-congruity theory. Tourism Management, 32(1), 114–127.
Uysal, M., Sirgy, M. J., Woo, E., & Kim, H. (. (2015). Quality of life (QOL) and well-being
research in tourism. Tourism Management , 1-18.
Van der Zwan, F., & Bhamra, T. (2003). Services marketing: taking up the sustainable
development challenge. Journal of Services Marketing, 17(4), 341–356,
doi:10.1108/08876040310482766 .
Vargas-Sánches, A., de los Ángeles Plaza-Mejίa, M., & Porras-Bueno, N. (2009).
Understanding Residents’ Attitudes toward the Development of Industrial Tourism in
a Formal Mining Community. Journal of Travel Research, 47 (3), 373-87.
Verma, A., & Rajendran, G. (2017). The effect of historical nostalgia on tourists’ destination
loyalty intention: An empirical study of the world cultural heritage site—
Mahabalipuram, India. Asia Pacific Journal of Tourism Research , 22(9), 977–990,
https://doi.org/10.1080/10941665.2017.1357639.
Vlek, C. &. (2007). Human behavior and environmental sustainability: Problems, driving
forces and research topics. Journal of Social Issues, 63(1), 1 - 19.
Walker, R., Bisset, P., & Adam, J. (2007). Managing risk: Risk perception, trust and control
in a primary care partnership. Social Science and Medicine, 64, 911–923.
Wang, Y., & Pfister, R. E. (2008). Residents Attitudes toward Tourism and Perceived
Personal Benefits in a Rural Community. Journal of Travel Research, 47 (1), 84-93.

195
Wang, Y., Rompf, P., Severt, D., & Peerapatdit, N. (2006). Examining and identifying the
determinnts of travel expenditure patterns . International Journal of Tourism
Research, 8(5), 333-346.
Ward, C., & Berno, T. (2011). Beyond social exchange theory: Attitudes toward tourists.
Annals of Tourism Research, 38 (4), 1556-1569.
Warnaby, G., & Medway, D. (2013). What about the ‘place’ in place marketing? . Marketing
Theory , 345-363.
WCED, W. C. (1987). Our Common Future. New York: Oxford University Press.
Weaver, D., & Oppermann, M. (2000). Tourism management. New York: John Wiley.
Weiermair, K., & Fuchs, M. (1999). Measuring Tourist Judgment on Service Quality. . Annals
of Tourism Research 26 , 1004–1021.
Wijkman, A., & Rockström, J. (2012). Bankrupting Nature: Global risks and pathways to
global sustainability. Nalen 6th.
Williams, P., & Soutar, G. N. (2009). Value, Satisfaction and Behavioral Intentions in an
Adventure Tourism Context. Annals of Tourism Research, Vol. 36, No. 3, 413–438,
doi:10.1016/j.annals.2009.02.002.
Wilson, S., Fesenmaier, D. R., Fesenmaier, J., & Van Es, J. C. (2001). Factors for Success in
Rural Tourism Development. Journal of Travel Research, 40 (2), 132-138.
Worthy, K. (2008). Modern Institutions, Phenomenal Dissociations, and Destructiveness
Toward Humans and the Environment. Organization Environment, 148-170.
WTO. (1993). World Tourism Organization: Tourism report year 2000 and beyond
qualitative aspects. Madrid: World Tourism Organization.
WTTC. (2018). Travel and Tourism Economic Impact 2018 Serbia. London: World Travel &
Tourism Council.
Yang, J., Ryan, C., & Zhang, L. (2014). Sustaining culture and seeking a Just Destination:
governments, power and tension – a life-cycle approach to analysing tourism
development in an ethnic-inhabited scenic area in Xinjiang, China . Journal of
Sustainable Tourism, 1151-1174.
Yang, Y., Liu, X., & Li, J. (2015). How Customer Experience Affects the Customer-Based
Brand Equity for Tourism Destinations. Journal of Travel & Tourism Marketing,
32(1), 95-113; DOI: 10.1080/10548408.2014.997959.
Yasin, N. M., Noor, N. M., & Mohamad, O. (2007). Does image of country-of-origin matter
to brand equity? . Journal of Product & Brand Management, 38-48.
Yeganeh, H., & Su, Z. (2005). Positivism and constructivism: two opposite but reconcilable
paradigms in cross‐cultural management research. . Proceedings of 33rd ASAC Annual
Conference. Administrative Sciences Association of Canada.
Yeoman, I. (2012). Tomorrow's Tourism. Bristol, UK: Channel View Publications.
Yolal, M., Chi, C. G., & Pesämaa, O. (2017). Examine destination loyalty of first-time and
repeat visitors at all-inclusive resorts. International Journal of Contemporary
Hospitaltiy Management, 29, 1834–1853.
Yoo, B., & Donthu, N. (2001). Developing and Validating a Multidimensional Consumer-
Based Brand Equity Scale. Journal of Business Research 52(1), 1-14.
Yoon, Y., Gursoy, D., & Chen, J. S. (2001). Validating a tourism development theory with
structural equation modeling. Tourism Management, 22(4), 363–372.
Young, M., Markham, F., Reis, A., & Higham, J. E. (2015). Flights of fantasy: A
reformulation of the ‘flyers’ dilemma. Annals of Tourism Research, 54(9), 1-15,
doi.org/10.1016/j.annals.2015.05.015.
Yu, C., Chancellor, H. C., & Cole, S. T. (2011). Measuring residents’ attitudes toward
sustainable tourism: A reexamination of the sustainable tourism attitude scale. Journal
of Travel Research, 50 (1), 57-63.

196
Yuksel, A., Yuksel, F., & Bilim, Y. (2010). Destination attachment: Effects on customer
satisfaction and cognitive affective and conative loyalty. Tourism Management 2010,
274–284.
Zabkar, V., Brencic, M., & Dmitrovic, T. (2010). Modelling perceived quality, visitor
satisfaction and behavioral intentions at the destination level. Tourism Management,
31 , 537‐546.
Zakarevičius, P., & Lionkiaitė, J. (2013). An Initial Framework for Understanding the
Concept of Internal Place Branding. <www.ceeol.com>, 143-160.
Zeithaml, V. A. (1988 ). Consumer Perceptions of Price, Quality, and Value: A Means-End
Model and Synthesis of Evidence. Journal of Marketing, 52(July) , 2-22.
Zeithaml, V. A. (2000). Service quality, profitability, and the economic worth of customers:
What we know and what we need to learn. Journal of the Academy of Marketing
Science, 28(1), 67–85.
Zhang, J., Wu, B., Morrison, A. M., Tseng, C., & Chen, Y.-C. (2016). How Country Image
Affects Tourists' Destination Evaluations. Journal of Hospitality & Tourism Research
42(6), 904-930.
Zouganeli, S., Trihas, N., Antonaki, M., & Kladou, S. (2012). Aspects of sustainability in the
destination branding process: a bottom-up approach. Journal of Hospitality Marketing
and Management, 21 (7), 739-757.

197
APPENDIX A: Research Instrument for Global Data
Name Year Type Dataset # C Sub-Indicators
Social Indicators
Social Wellbeing 2016 Statistics Sustainable
Society Index
151 Sufficient food, Sufficient
to drink, Sanitation,
Education, Healthy Life,
Gender Equality, Income
Distribution, Population
Growth, Good Governance
(9)
World
Corruption Index
2018 Survey Transparency
International
187 Free and Fair Elections,
Strong Independent
Institutions, Political
Rights, Civil Rights
World Talent 2017 Survey,
Statistics
IMD 61 Investment &
Development, Appeal,
Readiness.
National IQ 2012 Survey Ulster Institute for
Social Research
180
World Happiness
Report
2018 Survey Helliwell, J.F.;
Layard, Richard;
Sachs, Jeffrey D.
149 Explained by: Income,
social support, life
expectancy, freedom,
generosity, and corruption
Safety Index
2018 Survey Numbeo 70
Health Care
Index
2018 Survey Numbeo 70
Individuals
Using Internet
2017 Statistics Crotti & Misrahi
2017
136
Fixed Broadband
Subscriptions
2017 Statistics Crotti & Misrahi
2017
136
Government
Effectiveness
Index
2017 Statistics World Bank 187
Mobile Phone
Subscriptions
2017 Statistics Crotti & Misrahi
2017
136
Environmental Indicators
Environmental
Performance
Index
2018 Statistics/Survey Yale and
Colombia
University
171 Environmental Health
(40%), Ecosystem Vitality
(60%), 24 indicators

198
Environmental
Wellbeing
2016 Statistics Sustainable
Society Index
(SSI)
151 Biodiversity, Renewable
Water resources,
Consumption, Energy Use,
Energy Savings,
Greenhouse Gases,
Renewable Energy (7)
Protected
Territories
2017 Statistics The World Bank 176
Drinking Water
2015 Statistics The World Bank 86
Environmental
Awareness
2017 Crotti & Misrahi
2017
82
Pollution Index
2018 Statistics Numbeo 98
Exponential
Pollution Index
2018 Statistics Numbeo 98
Improved Water
Source
2015 Statistics The World Bank
Per Capita Fossil
Fuel Emission
Rates
2014 Statistics Carbon Dioxide
Analysis
Information
Center
179
Natural &
Capital
Resources Sub-
index
2017 Statistics/Survey Crotti & Misrahi
2017
136
Environmental
Democracy
Index
2018 Statistics/Survey World Resource
Institute
75
Climate Index
2018 Statistics Numbeo 70
Economic Indicators
Inbound
Overnight
Arrivals
2015-
2017
Statistics UNWTO 2015-
2017
167
Inbound
Overnights
2015-
2017
Statistics UNWTO 2015-
2017
135
Inbound
Overnights
Expenditure
2015-
2017
Statistics UNWTO 2015-
2017
148

199
Tourism
Expenditure over
Exports of
Goods and
Services
2015-
2017
Statistics UNWTO 2015-
2017
146
Inbound Tourism
Expenditure over
GDP
2015-
2017
Statistics UNWTO 2015-
2017
113
Tourism
Coverage
Inbound over
Outbound
2015-
2017
Statistics UNWTO 2015-
2017
155
Total Travel &
Tourism
Contribution to
GDP
2015-
2017
Statistics UNWTO 2015-
2017
123
Economic
Wellbeing
2016 Statistics Sustainable
Society Index
(SSI)
151 Organic Farming, Genuine
Savings, GDP,
Employment, Public Debt
(5)
Number of
International
Association
Meetings
2017 Statistics Crotti & Misrahi
2017
122
Awareness Indicators
Awareness Index
2015 Survey Travel Image 96 Knowledge, Ability to rank
Attractiveness
Index
2015 Survey Travel Image 96 Experience, impression
Google Trend
Awareness
2018 Survey Google Trend 199 Trend in the number of
country name appearing in
search
Effectiveness of
Marketing
2017 Survey Crotti & Misrahi
2017
136
Image Indicators
Image Index 2015 Survey Travel Image 96 Awareness and
Attractiveness

200
Travel &
Tourism
Competitiveness
Index
2017 Survey/Statistics Crotti & Misrahi
2017
136 14 Pillars
The Global
Competitiveness
Report
2018 Survey/Statistics Crotti & Misrahi
2017
136 Enabling Environments,
Human Capital, Markets,
Innovation Ecosystem
Digital
Competitiveness
2018 Survey/Statistics IMD 63 Knowledge, Technology,
Future Readiness
Country Brand
Strategy Ratings
2017 Statistics Crotti & Misrahi
2017
136 Value System, Quality of
Life, Business Potential,
Heritage & Culture,
Tourism, Made In
Country Brand
Rankings
2018 Survey WEF Bloom
Consulting
168 Economic Performance,
Digital Demand, Country
Brand Strategy & Online
Performance
Number of
World Heritage
Natural Cites
2017 Statistics Crotti & Misrahi
2017
136
Natural Tourism
Digital Demand
2017 Statistics Crotti & Misrahi
2017
136
Oral and
Intangible
Cultural Heritage
2017 Statistics Crotti & Misrahi
2017
136
Attractiveness of
Natural Assets
2017 Survey Crotti & Misrahi
2017
136
Number of
World Heritage
Cultural Cites
2017 Statistics Crotti & Misrahi
2017
136
Sports Stadiums
2017 Statistics Crotti & Misrahi
2017
136
Cultural and
Entertainment
Tourism
2017 Statistics Crotti & Misrahi
2017
136
Adventurous
Index
2018 Survey US News, BAV
Group, Wharton
80 65 Country Attributes
Cultural
Influence
2018 Survey US News, BAV
Group, Wharton
80 65 Country Attributes

201
Heritage 2018 Survey US News, BAV
Group, Wharton
80 65 Country Attributes
Quality Indicators
Quality of
tourism
infrastructure
2017 Survey Crotti & Misrahi
2017
136
Number of
Operating
Airlines
2017 Statistics Crotti & Misrahi
2017
136
Quality of Roads
2018 Survey/Statistics Numbero 70
Global
Infrastructure
Quality
2018 Survey Statista 100
Staff Training
2017 Survey Crotti & Misrahi
2017
136
Internet Use for
B2B
2017 Statistics Crotti & Misrahi
2017
136
Purchasing
Power Parity
2017 Statistics Crotti & Misrahi
2017
136
Sustainability of
travel and
tourism industry
development
2017 Survey Crotti & Misrahi
2017
136
Quality of Air
Transport
2017 Survey Crotti & Misrahi
2017
136
Airport Density
2017 Statistics Crotti & Misrahi
2017
136
Prioritization of
Travel &
Tourism
2017 Survey/Statistics Crotti & Misrahi
2017
136
Airport Charges
& Taxes
2017 Statistics Crotti & Misrahi
2017
136
Hotel Price
Index
2017 Statistics Crotti & Misrahi
2017
136
Ground
Transport
Efficiency
2017 Survey Crotti & Misrahi
2017
136

202
Hotel Rooms
2017 Statistics Crotti & Misrahi
2017
136
Tourist Service
Infrastructure
2017 Statistics/Survey Crotti & Misrahi
2017
136
Quality of Life
2018 Survey/Statistics Numbeo 70
Purchasing
Power Index
2018 Statistics Numbeo 70
Price
Competitiveness
2017 Statistics Crotti & Misrahi
2017
136
Traffic Commute
Time Index
2018 Statistics Numbeo 70
Quality of
Nationality
Index
2017 Statistics/Survey Henley &
Partners. Kälin
and Kochenov’s
Index
175 Human Development,
Economic Strength, Peace
& Stability, Settlement
Freedom, Travel Freedom.
Loyalty Indicators
Country Brand
Index
2017 Statistics Crotti & Misrahi
2017
75
Nations Brand
2018 Survey BrandFinance 100
Country Index
2017 Survey FutureBrand 82
Cost of Living
2018 Statistics Numbeo 70
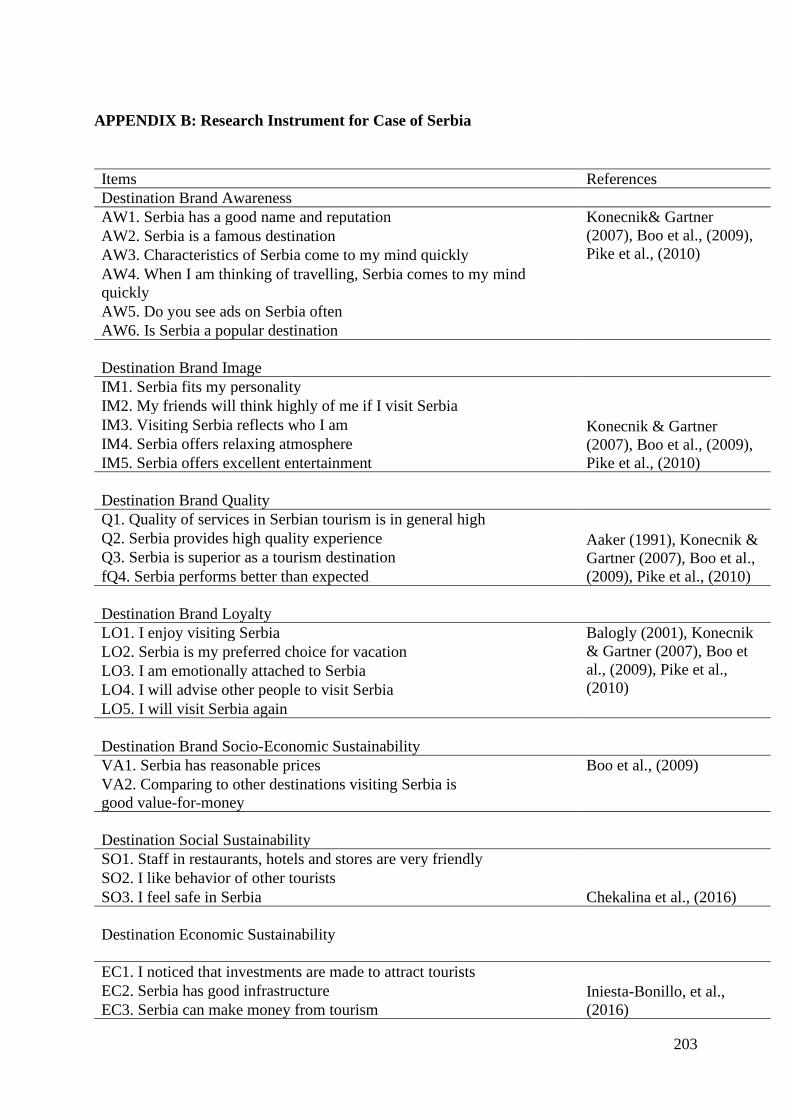
203
APPENDIX B: Research Instrument for Case of Serbia
Items References
Destination Brand Awareness
AW1. Serbia has a good name and reputation Konecnik& Gartner
(2007), Boo et al., (2009),
Pike et al., (2010)
AW2. Serbia is a famous destination
AW3. Characteristics of Serbia come to my mind quickly
AW4. When I am thinking of travelling, Serbia comes to my mind
quickly
AW5. Do you see ads on Serbia often
AW6. Is Serbia a popular destination
Destination Brand Image
IM1. Serbia fits my personality
Konecnik & Gartner
(2007), Boo et al., (2009),
Pike et al., (2010)
IM2. My friends will think highly of me if I visit Serbia
IM3. Visiting Serbia reflects who I am
IM4. Serbia offers relaxing atmosphere
IM5. Serbia offers excellent entertainment
Destination Brand Quality
Q1. Quality of services in Serbian tourism is in general high
Aaker (1991), Konecnik &
Gartner (2007), Boo et al.,
(2009), Pike et al., (2010)
Q2. Serbia provides high quality experience
Q3. Serbia is superior as a tourism destination
fQ4. Serbia performs better than expected
Destination Brand Loyalty
LO1. I enjoy visiting Serbia Balogly (2001), Konecnik
& Gartner (2007), Boo et
al., (2009), Pike et al.,
(2010)
LO2. Serbia is my preferred choice for vacation
LO3. I am emotionally attached to Serbia
LO4. I will advise other people to visit Serbia
LO5. I will visit Serbia again
Destination Brand Socio-Economic Sustainability
VA1. Serbia has reasonable prices Boo et al., (2009)
VA2. Comparing to other destinations visiting Serbia is
good value-for-money
Destination Social Sustainability
SO1. Staff in restaurants, hotels and stores are very friendly
Chekalina et al., (2016)
SO2. I like behavior of other tourists
SO3. I feel safe in Serbia
Destination Economic Sustainability
EC1. I noticed that investments are made to attract tourists
Iniesta-Bonillo, et al.,
(2016)
EC2. Serbia has good infrastructure
EC3. Serbia can make money from tourism

204
Destination Environmental Sustainability
EN1. Level of pollution in Serbia is acceptable
Buckley (2012); Iniesta-
Bonillo, et al., (2016)
EN2. Level of smell in Serbia is acceptable
EN3. Level of noise in Serbia is acceptable
EN4. Crowd levels are acceptable in Serbia
EN5. Serbia has visible practice in maintaining environment
Related Documents