ed: JS/ sa, PY, CS BUY (Upgrade from Hold) Last Traded Price ( 30 May 2019): S$0.24 (STI : 3,143.00) Price Target 12-mth: S$0.34 (43% upside) (Prev S$0.33) Analyst Lee Keng LING +65 6682 3703 [email protected] What’s New • FY19 revenue in line; net profit slightly above • Growth across all business segments • Tweaked earnings by 1-3% • Negatives priced in; upgrade to BUY with revised TP of S$0.34 Price Relative Forecasts and Valuation FY Mar (S$m) 2018A 2019A 2020F 2021F Revenue 192 266 307 355 EBITDA 57.8 84.5 87.7 95.9 Pre-tax Profit 36.6 39.8 46.0 55.9 Net Profit 22.4 19.1 21.7 26.7 Net Pft (Pre Ex.) 22.4 19.1 21.7 26.7 Net Pft Gth (Pre-ex) (%) 27.8 (14.5) 13.4 23.1 EPS (S cts) 1.93 1.65 1.87 2.30 EPS Pre Ex. (S cts) 1.93 1.65 1.87 2.30 EPS Gth Pre Ex (%) 15 (15) 13 23 Diluted EPS (S cts) 1.93 1.65 1.87 2.30 Net DPS (S cts) 0.0 0.0 0.0 0.0 BV Per Share (S cts) 15.4 18.4 20.3 22.6 PE (X) 12.5 14.6 12.9 10.4 PE Pre Ex. (X) 12.5 14.6 12.9 10.4 P/Cash Flow (X) nm 154.5 2.5 4.2 EV/EBITDA (X) 4.9 6.3 5.3 4.6 Net Div Yield (%) 0.0 0.0 0.0 0.0 P/Book Value (X) 1.6 1.3 1.2 1.1 Net Debt/Equity (X) CASH 0.8 0.4 0.2 ROAE (%) 16.9 9.7 9.6 10.7 Earnings Rev (%): 3 1 Consensus EPS (S cts): 2.30 2.90 Other Broker Recs: B: 1 S: 0 H: 2 Source of all data on this page: Company, DBS Bank, Bloomberg Finance L.P Upgrade to BUY as value emerges Value emerging; upgrade to BUY. Share price has shed 27% since our downgrade to HOLD after the release of 3QFY19 results in February. At current level, we see value emerging. Based on sum of the parts valuation, and stripping out its stakes in UnUsUaL and Vividthree, the market is valuing the core production and cinema segment at only S$144m, which works out to P/EBITDA of slightly over 2x, which is too low in our view. mm2 paid 13.8x for the Cathay cinema chain in Singapore and about 8-9x for the Malaysia cinemas while peers are trading at about 5.5x P/EBITDA. Though the group still needs to deleverage given the swing to 0.8x net gearing at end-FY19 and high interest expense, we believe the negatives are already priced in. We see value emerging at the current level with 43% upside to our revised TP of S$0.34. Upgrade to BUY. Where we differ: Slight difference in valuation peg vs consensus. We value the production segment based on PE and P/EBITDA for the cinema. For UnUsUaL and Vividthree, we value these at current market valuation, vs PE valuation used by consensus. Potential catalyst: More projects especially in North Asia; successful cinema operation spinoff. Valuation: Upgrade to BUY, TP S$0.34. Our sum-of-parts target price of S$0.34 is pegged to 16x FY20F earnings for core business, in line with peers listed in Asia, 5.5x P/EBITDA for cinema business, and current market valuation for UnUsUaL and Vividthree. Key Risks to Our View: No long-term financing arrangements for productions. The commencement of each production is dependent on mm2’s ability to secure funding. Unavailability of good scripts. Lack of good scripts for production may lead to less support from stakeholders. At A Glance Issued Capital (m shrs) 1,163 Mkt. Cap (S$m/US$m) 279 / 202 Major Shareholders (%) Ang Wee Chye 38.1 StarHub Ltd 9.8 Yeo Khee Seng 8.2 Free Float (%) 43.9 3m Avg. Daily Val (US$m) 0.15 ICB Industry : Consumer Services / Media DBS Group Research . Equity 31 May 2019 Singapore Company Guide mm2 Asia Version 20 | Bloomberg: MM2 SP | Reuters: MM2A.SI Refer to important disclosures at the end of this report 87 187 287 387 487 587 687 787 0.1 0.2 0.3 0.4 0.5 0.6 0.7 May-15 May-16 May-17 May-18 May-19 Relative Index S$ mm2 Asia (LHS) Relative STI (RHS)

Welcome message from author
This document is posted to help you gain knowledge. Please leave a comment to let me know what you think about it! Share it to your friends and learn new things together.
Transcript

ed: JS/ sa, PY, CS
BUY (Upgrade from Hold)
Last Traded Price ( 30 May 2019): S$0.24 (STI : 3,143.00) Price Target 12-mth: S$0.34 (43% upside) (Prev S$0.33) Analyst Lee Keng LING +65 6682 3703 [email protected]
What’s New • FY19 revenue in line; net profit slightly above
• Growth across all business segments
• Tweaked earnings by 1-3%
• Negatives priced in; upgrade to BUY with revised TP of S$0.34
Price Relative
Forecasts and Valuation FY Mar (S$m) 2018A 2019A 2020F 2021F Revenue 192 266 307 355 EBITDA 57.8 84.5 87.7 95.9 Pre-tax Profit 36.6 39.8 46.0 55.9 Net Profit 22.4 19.1 21.7 26.7 Net Pft (Pre Ex.) 22.4 19.1 21.7 26.7 Net Pft Gth (Pre-ex) (%) 27.8 (14.5) 13.4 23.1 EPS (S cts) 1.93 1.65 1.87 2.30 EPS Pre Ex. (S cts) 1.93 1.65 1.87 2.30 EPS Gth Pre Ex (%) 15 (15) 13 23 Diluted EPS (S cts) 1.93 1.65 1.87 2.30 Net DPS (S cts) 0.0 0.0 0.0 0.0 BV Per Share (S cts) 15.4 18.4 20.3 22.6 PE (X) 12.5 14.6 12.9 10.4 PE Pre Ex. (X) 12.5 14.6 12.9 10.4 P/Cash Flow (X) nm 154.5 2.5 4.2 EV/EBITDA (X) 4.9 6.3 5.3 4.6 Net Div Yield (%) 0.0 0.0 0.0 0.0 P/Book Value (X) 1.6 1.3 1.2 1.1 Net Debt/Equity (X) CASH 0.8 0.4 0.2 ROAE (%) 16.9 9.7 9.6 10.7 Earnings Rev (%): 3 1 Consensus EPS (S cts): 2.30 2.90 Other Broker Recs: B: 1 S: 0 H: 2
Source of all data on this page: Company, DBS Bank, Bloomberg Finance L.P
Upgrade to BUY as value emerges Value emerging; upgrade to BUY. Share price has shed 27% since our downgrade to HOLD after the release of 3QFY19 results in February. At current level, we see value emerging. Based on sum of the parts valuation, and stripping out its stakes in UnUsUaL and Vividthree, the market is valuing the core production and cinema segment at only S$144m, which works out to P/EBITDA of slightly over 2x, which is too low in our view. mm2 paid 13.8x for the Cathay cinema chain in Singapore and about 8-9x for the Malaysia cinemas while peers are trading at about 5.5x P/EBITDA. Though the group still needs to deleverage given the swing to 0.8x net gearing at end-FY19 and high interest expense, we believe the negatives are already priced in. We see value emerging at the current level with 43% upside to our revised TP of S$0.34. Upgrade to BUY.
Where we differ: Slight difference in valuation peg vs consensus. We value the production segment based on PE and P/EBITDA for the cinema. For UnUsUaL and Vividthree, we value these at current market valuation, vs PE valuation used by consensus.
Potential catalyst: More projects especially in North Asia; successful cinema operation spinoff. Valuation: Upgrade to BUY, TP S$0.34. Our sum-of-parts target price of S$0.34 is pegged to 16x FY20F earnings for core business, in line with peers listed in Asia, 5.5x P/EBITDA for cinema business, and current market valuation for UnUsUaL and Vividthree. Key Risks to Our View: No long-term financing arrangements for productions. The commencement of each production is dependent on mm2’s ability to secure funding. Unavailability of good scripts. Lack of good scripts for production may lead to less support from stakeholders. At A Glance Issued Capital (m shrs) 1,163 Mkt. Cap (S$m/US$m) 279 / 202 Major Shareholders (%) Ang Wee Chye 38.1 StarHub Ltd 9.8 Yeo Khee Seng 8.2
Free Float (%) 43.9 3m Avg. Daily Val (US$m) 0.15 ICB Industry : Consumer Services / Media
DBS Group Research . Equity
31 May 2019
Singapore Company Guide
mm2 Asia Version 20 | Bloomberg: MM2 SP | Reuters: MM2A.SI Refer to important disclosures at the end of this report
87
187
287
387
487
587
687
787
0.1
0.2
0.3
0.4
0.5
0.6
0.7
May-15 May-16 May-17 May-18 May-19
Relative IndexS$
mm2 Asia (LHS) Relative STI (RHS)

Page 2
Company Guide
mm2 Asia
WHAT’S NEW
FY19 earnings slightly above expectations; all segments registered growth
Result Highlights
FY19 revenue in line; net profit slightly above. Total revenue for FY19 surged 39% y-o-y to S$266.2m, mainly driven by the full year contribution for Cathay cinema, vs four-month contribution in FY18; in line with our forecast. Net earnings of S$19.1m (-14% y-o-y) is slightly above our expectation of S$16.8m on better margins.
Slight improvement in gross margin; net margin hit by interest cost. Gross margin for the group of 46.7% was slightly higher than 45.5% in FY18. Net margin of 7.2% saw a steep drop from 11.7% in FY18, as the Group took on more debt, mainly to fund the acquisition of Cathay cinemas in Singapore.
All business segments registered growth. For the core production segment, revenue grew 6% y-o-y, partly attributable to the blockbuster movie, “More than Blue”. Revenue for the Cinema segment surged 124% y-o-y, mainly driven by the full year contribution for Cathay cinemas, vs four-month contribution in FY18. Both UnUsUaL and Vividthree did well, on revenue gains of 23% and 47% respectively.
In terms of geographical breakdown, Singapore accounted for almost 50% of the total group revenue. For the core production segment, revenue from North Asia accounted for 70% vs 57% in FY18, in line with our expectations of higher contribution from North Asia.
Segmental Revenue Breakdown
Source: DBS Bank; Company
Outlook and Strategy
Platform business (Cinema) and core production unit
mm2 continues to enter into slate deals to co-produce high quality digital and live content with international content distributors in North Asia especially, and also in other regions
like Korea. In FY2019 to date, the group has won several awards for its films.
UnUsUaL – Healthy project pipeline
UnUsUal has a visible project pipeline for the next one to three years. For live concerts, UnUsUaL has already lined up its artistes in various locations including Singapore, China, Hong Kong, Malaysia, Bangkok and Jakarta.
The family entertainment shows, which have a wider target audience reach, provide even greater visibility. “Disney on Ice”, which was already launched last year, will continue its tour for the second half of this year. “Walking with Dinosaurs” will have 117 shows in 11 cities starting from August 2019. “Apollo” has scheduled a 3-year tour in North America from mid-2019.
Vividthree – Riding on the momentum of TTB
Following the completion of the flagship Train to Busan VR (TTB VR) tour set in Beijing, the next destination is Xiamen. Vividthree has granted a local promoter a 1-year exclusive territorial right to host the TTB VR tour in the province. The sequel to TTB, slated for release in 2020, should help to keep up the momentum. Outside TTB, Vividthree is also exploring new intellectual property products to expand its business.
Earnings and Recommendation
Tweaked earnings by 1-3%. We have tweaked our FY20F and FY21F earnings by 1-3% after incorporating FY19 numbers. Our sum-of-parts target price of S$0.34 (Prev S$0.33) is pegged to 16x FY20F earnings for core production business, 5.5x P/EBITDA for cinema business, and current market valuations for UnUsUaL and Vividthree. We have assumed slightly higher earnings for the core production segment.
Value emerging; upgrade to BUY. Share price has shed 27% since our downgrade to HOLD after the release of 3Q19 results in February. At current level, we see value emerging. Based on the sum of parts valuation, and stripping out its stakes in UnUsUaL and Vividthree, the market is valuing the core production and the cinema segment at only S$144m, which works out to P/EBITDA of slightly over 2x, which is too low in our view. mm2 paid 13.8x for the Cathay cinema chain in Singapore and about 8-9x for the Malaysia cinemas while peers are trading at about 5.5x P/EBITDA. At current level, we believe the negatives are already priced in. Upgrade to BUY.
In need of deleveraging
mm2 moved into a net debt position following the acquisition of Cathay Cineplexes for S$230m in November 2017, that was financed mainly via debt. The high interest expense led
Core37%
Vividthree3%
Cinema38%
Unusual21%
Others1%

Page 3
Company Guide
mm2 Asia
A spinoff of the cinema business could be an option to address this issue in the long run. Alternatively, the group could explore the option of divesting its 39% in UnUsUaL and 42% stake in Vividthree, or bring in strategic investors.
to a 14.5% drop in net earnings for FY19, while net margins fell to 7.2% from 11.7% in FY18. Going forward, mm2 would have to deleverage in order to maintain a decent net margin.
Quarterly / Interim Income Statement (S$m)
FY Mar 4Q2018 3Q2019 4Q2019 % chg yoy % chg qoq
Revenue 83.6 74.1 78.2 (6.5) 5.6
Cost of Goods Sold (49.5) (44.3) (44.3) (10.4) 0.1
Gross Profit 34.1 29.8 33.9 (0.7) 13.8
Other Oper. (Exp)/Inc (20.5) (18.8) (18.9) (7.8) 0.4
Operating Profit 13.7 11.0 15.0 10.0 36.8
Other Non Opg (Exp)/Inc 0.16 0.47 1.81 nm 290.1
Associates & JV Inc 0.16 0.0 0.04 - (458.3)
Net Interest (Exp)/Inc (3.4) (4.3) (4.9) (41.6) (13.5)
Exceptional Gain/(Loss) 0.0 0.0 0.0 - -
Pre-tax Profit 10.5 7.16 12.0 14.0 68.0
Tax (2.0) (2.5) (2.6) 32.9 5.6
Minority Interest (1.9) (2.7) (3.2) (68.1) 18.1
Net Profit 6.67 1.96 6.20 (7.1) 216.2
Net profit bef Except. 6.67 1.96 6.20 (7.1) 216.2
EBITDA 28.9 17.6 25.0 (13.4) 42.1
Margins (%)
Gross Margins 40.8 40.2 43.3
Opg Profit Margins 16.3 14.8 19.2
Net Profit Margins 8.0 2.6 7.9
Source of all data: Company, DBS Bank
Page 4
Company Guide
mm2 Asia
CRITICAL DATA POINTS TO WATCH
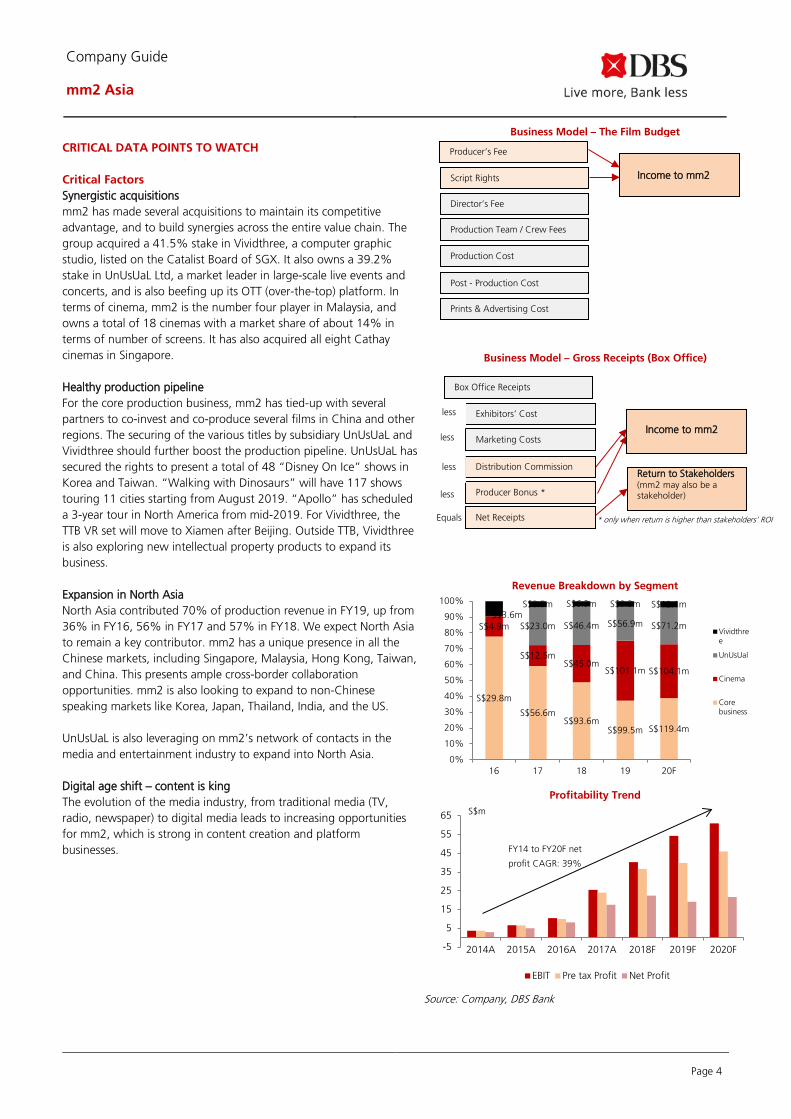
Critical Factors Synergistic acquisitions mm2 has made several acquisitions to maintain its competitive advantage, and to build synergies across the entire value chain. The group acquired a 41.5% stake in Vividthree, a computer graphic studio, listed on the Catalist Board of SGX. It also owns a 39.2% stake in UnUsUaL Ltd, a market leader in large-scale live events and concerts, and is also beefing up its OTT (over-the-top) platform. In terms of cinema, mm2 is the number four player in Malaysia, and owns a total of 18 cinemas with a market share of about 14% in terms of number of screens. It has also acquired all eight Cathay cinemas in Singapore.
Healthy production pipeline For the core production business, mm2 has tied-up with several partners to co-invest and co-produce several films in China and other regions. The securing of the various titles by subsidiary UnUsUaL and Vividthree should further boost the production pipeline. UnUsUaL has secured the rights to present a total of 48 “Disney On Ice” shows in Korea and Taiwan. “Walking with Dinosaurs” will have 117 shows touring 11 cities starting from August 2019. “Apollo” has scheduled a 3-year tour in North America from mid-2019. For Vividthree, the TTB VR set will move to Xiamen after Beijing. Outside TTB, Vividthree is also exploring new intellectual property products to expand its business.
Expansion in North Asia North Asia contributed 70% of production revenue in FY19, up from 36% in FY16, 56% in FY17 and 57% in FY18. We expect North Asia to remain a key contributor. mm2 has a unique presence in all the Chinese markets, including Singapore, Malaysia, Hong Kong, Taiwan, and China. This presents ample cross-border collaboration opportunities. mm2 is also looking to expand to non-Chinese speaking markets like Korea, Japan, Thailand, India, and the US.
UnUsUaL is also leveraging on mm2’s network of contacts in the media and entertainment industry to expand into North Asia.
Digital age shift – content is king The evolution of the media industry, from traditional media (TV, radio, newspaper) to digital media leads to increasing opportunities for mm2, which is strong in content creation and platform businesses.
Business Model – The Film Budget
Business Model – Gross Receipts (Box Office)
Revenue Breakdown by Segment
Profitability Trend
Source: Company, DBS Bank
S$29.8m
S$56.6mS$93.6m
S$99.5m S$119.4m
S$4.9m
S$12.6mS$45.0m
S$101.1m S$104.1m
S$23.0m S$46.4m S$56.9m S$71.2mS$3.6m
S$3.5m S$6.3m S$9.3m S$12.1m
0%
10%
20%
30%
40%
50%
60%
70%
80%
90%
100%
16 17 18 19 20F
Vividthree
UnUsUal
Cinema
Corebusiness
-5
5
15
25
35
45
55
65
2014A 2015A 2016A 2017A 2018F 2019F 2020F
EBIT Pre tax Profit Net Profit
S$m
FY14 to FY20F net
profit CAGR: 39%
Prints & Advertising Cost
Producer’s Fee
Script Rights
Post - Production Cost
Production Cost
Production Team / Crew Fees
Director’s Fee
Income to mm2
Distribution Commission
Marketing Costs
Return to Stakeholders (mm2 may also be a stakeholder)
* only when return is higher than stakeholders’ ROI Net Receipts
Producer Bonus *
Exhibitors’ Cost
Income to mm2
less
less
less
less
Equals
Box Office Receipts

Page 5
Company Guide
mm2 Asia
Appendix 1: A look at Company's listed history – what drives its share price?
Source: DBS Bank, ThomsonReuters
Page 6
Company Guide
mm2 Asia
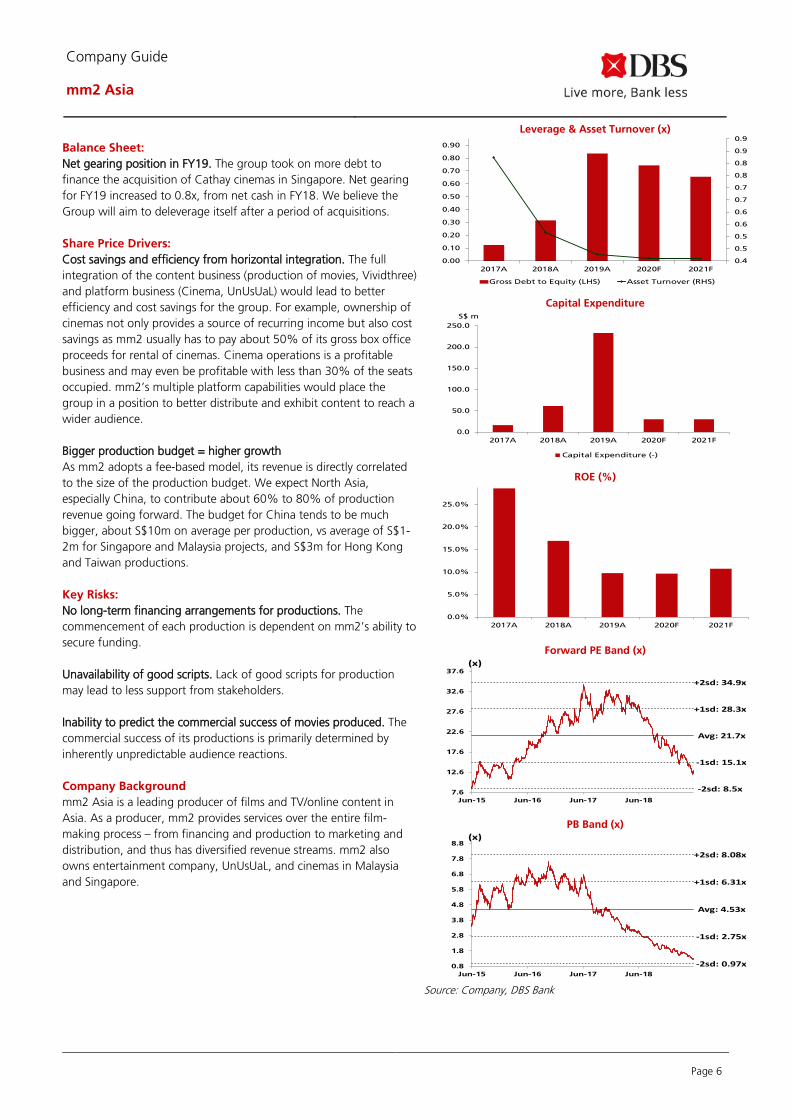
Balance Sheet: Net gearing position in FY19. The group took on more debt to finance the acquisition of Cathay cinemas in Singapore. Net gearing for FY19 increased to 0.8x, from net cash in FY18. We believe the Group will aim to deleverage itself after a period of acquisitions.
Share Price Drivers: Cost savings and efficiency from horizontal integration. The full integration of the content business (production of movies, Vividthree) and platform business (Cinema, UnUsUaL) would lead to better efficiency and cost savings for the group. For example, ownership of cinemas not only provides a source of recurring income but also cost savings as mm2 usually has to pay about 50% of its gross box office proceeds for rental of cinemas. Cinema operations is a profitable business and may even be profitable with less than 30% of the seats occupied. mm2’s multiple platform capabilities would place the group in a position to better distribute and exhibit content to reach a wider audience.
Bigger production budget = higher growth As mm2 adopts a fee-based model, its revenue is directly correlated to the size of the production budget. We expect North Asia, especially China, to contribute about 60% to 80% of production revenue going forward. The budget for China tends to be much bigger, about S$10m on average per production, vs average of S$1-2m for Singapore and Malaysia projects, and S$3m for Hong Kong and Taiwan productions.
Key Risks: No long-term financing arrangements for productions. The commencement of each production is dependent on mm2’s ability to secure funding.
Unavailability of good scripts. Lack of good scripts for production may lead to less support from stakeholders.
Inability to predict the commercial success of movies produced. The commercial success of its productions is primarily determined by inherently unpredictable audience reactions.
Company Background mm2 Asia is a leading producer of films and TV/online content in Asia. As a producer, mm2 provides services over the entire film-making process – from financing and production to marketing and distribution, and thus has diversified revenue streams. mm2 also owns entertainment company, UnUsUaL, and cinemas in Malaysia and Singapore.
Leverage & Asset Turnover (x)
Capital Expenditure
ROE (%)
Forward PE Band (x)
PB Band (x)
Source: Company, DBS Bank
0.4
0.5
0.5
0.6
0.6
0.7
0.7
0.8
0.8
0.9
0.9
0.00
0.10
0.20
0.30
0.40
0.50
0.60
0.70
0.80
0.90
2017A 2018A 2019A 2020F 2021F
Gross Debt to Equity (LHS) Asset Turnover (RHS)
0.0
50.0
100.0
150.0
200.0
250.0
2017A 2018A 2019A 2020F 2021F
Capital Expenditure (-)
S$ m
0.0%
5.0%
10.0%
15.0%
20.0%
25.0%
2017A 2018A 2019A 2020F 2021F
Avg: 21.7x
+1sd: 28.3x
+2sd: 34.9x
-1sd: 15.1x
-2sd: 8.5x7.6
12.6
17.6
22.6
27.6
32.6
37.6
Jun-15 Jun-16 Jun-17 Jun-18
(x)
Avg: 4.53x
+1sd: 6.31x
+2sd: 8.08x
-1sd: 2.75x
-2sd: 0.97x0.8
1.8
2.8
3.8
4.8
5.8
6.8
7.8
8.8
Jun-15 Jun-16 Jun-17 Jun-18
(x)

Page 7
Company Guide
mm2 Asia
Segmental Breakdown FY Mar 2017A 2018A 2019A 2020F 2021F
Revenues (S$m) Production & Distribution 56.6 93.6 99.5 119 143 Cinema Operation 12.6 45.0 101 104 107 Event Production & 23.0 46.4 56.9 71.2 89.0 Post-Production 3.52 6.32 9.29 12.1 15.7 Others 0.04 0.62 (0.6) 0.0 0.0 Total 95.7 192 266 307 355
Income Statement (S$m)
FY Mar 2017A 2018A 2019A 2020F 2021F
Revenue 95.7 192 266 307 355 Cost of Goods Sold (50.5) (105) (142) (161) (188) Gross Profit 45.3 87.3 124 145 167 Other Opng (Exp)/Inc (19.8) (45.9) (67.0) (84.4) (97.7) Operating Profit 25.4 41.4 57.2 61.0 69.2 Other Non Opg (Exp)/Inc 0.0 0.0 0.0 0.0 0.0 Associates & JV Inc 0.0 0.11 0.49 0.0 0.0 Net Interest (Exp)/Inc (1.4) (4.9) (17.9) (15.0) (13.3) Exceptional Gain/(Loss) 0.0 0.0 0.0 0.0 0.0 Pre-tax Profit 24.0 36.6 39.8 46.0 55.9 Tax (3.7) (7.1) (11.1) (12.8) (15.6) Minority Interest (2.8) (7.1) (9.6) (11.5) (13.6) Preference Dividend 0.0 0.0 0.0 0.0 0.0 Net Profit 17.5 22.4 19.1 21.7 26.7 Net Profit before Except. 17.5 22.4 19.1 21.7 26.7 EBITDA 40.3 57.8 84.5 87.7 95.9 Growth Revenue Gth (%) 149.7 100.6 38.6 15.2 15.8 EBITDA Gth (%) 108.0 43.6 46.1 3.9 9.3 Opg Profit Gth (%) 145.1 62.9 38.1 6.6 13.4 Net Profit Gth (Pre-ex) (%) 114.3 27.8 (14.5) 13.4 23.1 Margins & Ratio Gross Margins (%) 47.3 45.5 46.7 47.4 47.0 Opg Profit Margin (%) 26.6 21.6 21.5 19.9 19.5 Net Profit Margin (%) 18.3 11.7 7.2 7.1 7.5 ROAE (%) 28.6 16.9 9.7 9.6 10.7 ROA (%) 15.1 6.0 3.1 2.9 3.1 ROCE (%) 21.8 8.7 0.3 1.3 2.4 Div Payout Ratio (%) 0.0 0.0 0.0 0.0 0.0 Net Interest Cover (x) 18.0 8.4 3.2 4.1 5.2
Source: Company, DBS Bank
Full contribution from Lotus and Cathay
Partial contribution from UnUsUaL
Mainly to finance acquisition of Cathay cinema chain in Singapore

Page 8
Company Guide
mm2 Asia
Quarterly / Interim Income Statement (S$m)
FY Mar 4Q2018 1Q2019 2Q2019 3Q2019 4Q2019
Revenue 83.6 49.0 64.9 74.1 78.2 Cost of Goods Sold (49.5) (16.1) (37.3) (44.3) (44.3) Gross Profit 34.1 32.9 27.6 29.8 33.9 Other Oper. (Exp)/Inc (20.5) (18.4) (13.4) (18.8) (18.9) Operating Profit 13.7 14.5 14.3 11.0 15.0 Other Non Opg (Exp)/Inc 0.16 0.33 0.29 0.47 1.81 Associates & JV Inc 0.16 0.01 0.0 0.0 0.04 Net Interest (Exp)/Inc (3.4) (3.2) (5.5) (4.3) (4.9) Exceptional Gain/(Loss) 0.0 0.0 0.0 0.0 0.0 Pre-tax Profit 10.5 11.6 9.00 7.16 12.0 Tax (2.0) (2.5) (3.5) (2.5) (2.6) Minority Interest (1.9) (1.9) (1.7) (2.7) (3.2) Net Profit 6.67 7.25 3.74 1.96 6.20 Net profit bef Except. 6.67 7.25 3.74 1.96 6.20 EBITDA 28.9 18.2 17.7 17.6 25.0
Growth Revenue Gth (%) 59.6 (41.4) 32.5 14.1 5.6 EBITDA Gth (%) 93.6 (37.2) (2.2) (0.8) 42.1 Opg Profit Gth (%) 37.5 6.2 (1.8) (23.0) 36.8 Net Profit Gth (Pre-ex) (%) 3.7 8.6 (48.4) (47.5) 216.2 Margins Gross Margins (%) 40.8 67.2 42.5 40.2 43.3 Opg Profit Margins (%) 16.3 29.6 22.0 14.8 19.2 Net Profit Margins (%) 8.0 14.8 5.8 2.6 7.9
Balance Sheet (S$m) FY Mar 2017A 2018A 2019A 2020F 2021F
Net Fixed Assets 11.2 42.1 36.4 56.6 76.8 Invts in Associates & JVs 1.49 2.63 2.76 0.0 0.0 Other LT Assets 54.3 301 339 325 308 Cash & ST Invts 25.8 93.2 18.6 102 138 Inventory 23.3 21.1 22.2 37.8 43.8 Debtors 46.4 108 181 235 272 Other Current Assets 0.58 14.1 66.2 66.2 66.2 Total Assets 163 582 666 822 905
ST Debt 11.1 4.97 36.8 36.8 36.8 Creditor 48.4 273 131 252 292 Other Current Liab 7.56 13.0 27.4 29.9 32.6 LT Debt 0.58 61.0 186 186 186 Other LT Liabilities 0.97 21.8 17.4 17.4 17.4 Shareholder’s Equity 86.5 179 214 236 263 Minority Interests 7.94 29.9 52.5 63.9 77.5 Total Cap. & Liab. 163 582 666 822 905
Non-Cash Wkg. Capital 14.3 (143) 110 57.3 57.8 Net Cash/(Debt) 14.1 27.2 (204) (121) (85.0) Debtors Turn (avg days) 135.0 146.7 197.9 247.5 260.9 Creditors Turn (avg days) 369.8 663.0 640.4 519.6 614.5 Inventory Turn (avg days) 169.5 91.5 68.6 81.4 92.2 Asset Turnover (x) 0.8 0.5 0.4 0.4 0.4 Current Ratio (x) 1.4 0.8 1.5 1.4 1.4 Quick Ratio (x) 1.1 0.7 1.0 1.1 1.1 Net Debt/Equity (X) CASH CASH 0.8 0.4 0.2 Net Debt/Equity ex MI (X) CASH CASH 1.0 0.5 0.3 Capex to Debt (%) 141.0 93.0 104.4 13.5 13.5 Z-Score (X) 1.1 1.1 1.1 1.1 1.1
Source: Company, DBS Bank
Mainly to finance acquisition of Cathay cinema chain in Singapore

Page 9
Company Guide
mm2 Asia
Cash Flow Statement (S$m)
FY Mar 2017A 2018A 2019A 2020F 2021F
Pre-Tax Profit 24.0 36.6 39.8 46.0 55.9 Dep. & Amort. 14.8 16.3 26.7 26.7 26.7 Tax Paid (3.8) (5.2) (9.8) (10.3) (12.8) Assoc. & JV Inc/(loss) 0.01 (0.1) 0.0 0.0 0.0 Chg in Wkg.Cap. (30.8) (57.3) (55.0) 50.5 (3.3) Other Operating CF 0.0 0.0 0.0 0.0 0.0 Net Operating CF 4.24 (9.7) 1.81 113 66.5 Capital Exp.(net) (16.5) (61.3) (233) (30.0) (30.0) Other Invts.(net) 0.0 0.0 25.8 0.0 0.0 Invts in Assoc. & JV 0.0 (2.5) (0.5) 0.0 0.0 Div from Assoc & JV 0.0 0.0 0.0 0.0 0.0 Other Investing CF (9.5) (9.8) (24.0) 0.0 0.0 Net Investing CF (26.0) (73.7) (232) (30.0) (30.0) Div Paid 0.0 0.0 0.0 0.0 0.0 Chg in Gross Debt 17.8 60.2 150 0.0 0.0 Capital Issues 18.0 81.6 12.0 0.0 0.0 Other Financing CF (0.5) (1.2) (15.8) 0.0 0.0 Net Financing CF 35.3 141 146 0.0 0.0 Currency Adjustments 0.0 0.0 0.0 0.0 0.0 Chg in Cash 13.5 57.2 (83.9) 83.0 36.5 Opg CFPS (S cts) 3.34 4.09 4.88 5.37 6.00 Free CFPS (S cts) (1.2) (6.1) (19.9) 7.13 3.14
Source: Company, DBS Bank
Target Price & Ratings History
Source: DBS Bank Analyst: Lee Keng LING
S.No.Date of Report
Clos ing Price
12-mthTargetPrice
Rat ing
1: 30 May 18 0.49 0.70 BUY
2: 15 Aug 18 0.42 0.62 BUY
3: 15 Nov 18 0.36 0.50 BUY
4: 13 Feb 19 0.30 0.33 HOLD
Note : Share price and Target price are adjusted for corporate actions.
12
34
0.21
0.26
0.31
0.36
0.41
0.46
0.51
May-18 Jul-18 Sep-18 Nov-18 Jan-19 Mar-19
S$
Mainly to finance Cathay cinema chain acquisition
Proceeds from share placement

Page 10
Company Guide
mm2 Asia
DBS Bank recommendations are based on an Absolute Total Return* Rating system, defined as follows:
STRONG BUY (>20% total return over the next 3 months, with identifiable share price catalysts within this time frame)
BUY (>15% total return over the next 12 months for small caps, >10% for large caps)
HOLD (-10% to +15% total return over the next 12 months for small caps, -10% to +10% for large caps)
FULLY VALUED (negative total return, i.e., > -10% over the next 12 months)
SELL (negative total return of > -20% over the next 3 months, with identifiable share price catalysts within this time frame)
*Share price appreciation + dividends
Completed Date: 31 May 2019 08:49:20 (SGT) Dissemination Date: 31 May 2019 08:51:31 (SGT)
Sources for all charts and tables are DBS Bank unless otherwise specified.
GENERAL DISCLOSURE/DISCLAIMER
This report is prepared by DBS Bank Ltd. This report is solely intended for the clients of DBS Bank Ltd, its respective connected and associated
corporations and affiliates only and no part of this document may be (i) copied, photocopied or duplicated in any form or by any means or (ii)
redistributed without the prior written consent of DBS Bank Ltd.
The research set out in this report is based on information obtained from sources believed to be reliable, but we (which collectively refers to DBS
Bank Ltd, its respective connected and associated corporations, affiliates and their respective directors, officers, employees and agents (collectively,
the “DBS Group”) have not conducted due diligence on any of the companies, verified any information or sources or taken into account any other
factors which we may consider to be relevant or appropriate in preparing the research. Accordingly, we do not make any representation or
warranty as to the accuracy, completeness or correctness of the research set out in this report. Opinions expressed are subject to change without
notice. This research is prepared for general circulation. Any recommendation contained in this document does not have regard to the specific
investment objectives, financial situation and the particular needs of any specific addressee. This document is for the information of addressees
only and is not to be taken in substitution for the exercise of judgement by addressees, who should obtain separate independent legal or financial
advice. The DBS Group accepts no liability whatsoever for any direct, indirect and/or consequential loss (including any claims for loss of profit)
arising from any use of and/or reliance upon this document and/or further communication given in relation to this document. This document is not
to be construed as an offer or a solicitation of an offer to buy or sell any securities. The DBS Group, along with its affiliates and/or persons
associated with any of them may from time to time have interests in the securities mentioned in this document. The DBS Group, may have
positions in, and may effect transactions in securities mentioned herein and may also perform or seek to perform broking, investment banking and
other banking services for these companies.
Any valuations, opinions, estimates, forecasts, ratings or risk assessments herein constitutes a judgment as of the date of this report, and there can
be no assurance that future results or events will be consistent with any such valuations, opinions, estimates, forecasts, ratings or risk assessments.
The information in this document is subject to change without notice, its accuracy is not guaranteed, it may be incomplete or condensed, it may
not contain all material information concerning the company (or companies) referred to in this report and the DBS Group is under no obligation to
update the information in this report.
This publication has not been reviewed or authorized by any regulatory authority in Singapore, Hong Kong or elsewhere. There is no planned
schedule or frequency for updating research publication relating to any issuer.
The valuations, opinions, estimates, forecasts, ratings or risk assessments described in this report were based upon a number of estimates and
assumptions and are inherently subject to significant uncertainties and contingencies. It can be expected that one or more of the estimates on
which the valuations, opinions, estimates, forecasts, ratings or risk assessments were based will not materialize or will vary significantly from actual
results. Therefore, the inclusion of the valuations, opinions, estimates, forecasts, ratings or risk assessments described herein IS NOT TO BE RELIED
UPON as a representation and/or warranty by the DBS Group (and/or any persons associated with the aforesaid entities), that:
(a) such valuations, opinions, estimates, forecasts, ratings or risk assessments or their underlying assumptions will be achieved, and
(b) there is any assurance that future results or events will be consistent with any such valuations, opinions, estimates, forecasts, ratings or risk
assessments stated therein.
Please contact the primary analyst for valuation methodologies and assumptions associated with the covered companies or price targets.
Page 11
Company Guide
mm2 Asia
Any assumptions made in this report that refers to commodities, are for the purposes of making forecasts for the company (or companies)
mentioned herein. They are not to be construed as recommendations to trade in the physical commodity or in the futures contract relating to the
commodity referred to in this report.
DBSVUSA, a US-registered broker-dealer, does not have its own investment banking or research department, has not participated in any public
offering of securities as a manager or co-manager or in any other investment banking transaction in the past twelve months and does not engage
in market-making.
ANALYST CERTIFICATION
The research analyst(s) primarily responsible for the content of this research report, in part or in whole, certifies that the views about the
companies and their securities expressed in this report accurately reflect his/her personal views. The analyst(s) also certifies that no part of his/her
compensation was, is, or will be, directly or indirectly, related to specific recommendations or views expressed in the report. The research analyst
(s) primarily responsible for the content of this research report, in part or in whole, certifies that he or his associate1 does not serve as an officer of
the issuer or the new listing applicant (which includes in the case of a real estate investment trust, an officer of the management company of the
real estate investment trust; and in the case of any other entity, an officer or its equivalent counterparty of the entity who is responsible for the
management of the issuer or the new listing applicant) and the research analyst(s) primarily responsible for the content of this research report or
his associate does not have financial interests2 in relation to an issuer or a new listing applicant that the analyst reviews. DBS Group has
procedures in place to eliminate, avoid and manage any potential conflicts of interests that may arise in connection with the production of
research reports. The research analyst(s) responsible for this report operates as part of a separate and independent team to the investment
banking function of the DBS Group and procedures are in place to ensure that confidential information held by either the research or investment
banking function is handled appropriately. There is no direct link of DBS Group's compensation to any specific investment banking function of
the DBS Group.
COMPANY-SPECIFIC / REGULATORY DISCLOSURES
1. DBS Bank Ltd, DBS HK, DBS Vickers Securities (Singapore) Pte Ltd (''DBSVS'') or their subsidiaries and/or other affiliates do not have
a proprietary position in the securities recommended in this report as of 30 Apr 2019
2. Neither DBS Bank Ltd nor DBS HK market makes in equity securities of the issuer(s) or company(ies) mentioned in this Research
Report.
Compensation for investment banking services:
3. DBSVUSA does not have its own investment banking or research department, nor has it participated in any public offering of
securities as a manager or co-manager or in any other investment banking transaction in the past twelve months. Any US persons
wishing to obtain further information, including any clarification on disclosures in this disclaimer, or to effect a transaction in any
security discussed in this document should contact DBSVUSA exclusively.
Disclosure of previous investment recommendation produced:
4. DBS Bank Ltd, DBS Vickers Securities (Singapore) Pte Ltd (''DBSVS''), their subsidiaries and/or other affiliates may have published
other investment recommendations in respect of the same securities / instruments recommended in this research report during the
preceding 12 months. Please contact the primary analyst listed in the first page of this report to view previous investment
recommendations published by DBS Bank Ltd, DBS Vickers Securities (Singapore) Pte Ltd (''DBSVS''), their subsidiaries and/or other
affiliates in the preceding 12 months.
1 An associate is defined as (i) the spouse, or any minor child (natural or adopted) or minor step-child, of the analyst; (ii) the trustee of a trust of
which the analyst, his spouse, minor child (natural or adopted) or minor step-child, is a beneficiary or discretionary object; or (iii) another person accustomed or obliged to act in accordance with the directions or instructions of the analyst.
2 Financial interest is defined as interests that are commonly known financial interest, such as investment in the securities in respect of an issuer or a new listing applicant, or financial accommodation arrangement between the issuer or the new listing applicant and the firm or analysis. This term does not include commercial lending conducted at arm's length, or investments in any collective investment scheme other than an issuer or new listing applicant notwithstanding the fact that the scheme has investments in securities in respect of an issuer or a new listing applicant.

Page 12
Company Guide
mm2 Asia
RESTRICTIONS ON DISTRIBUTION
General This report is not directed to, or intended for distribution to or use by, any person or entity who is a citizen or resident of or located in any locality, state, country or other jurisdiction where such distribution, publication, availability or use would be contrary to law or regulation.
Australia This report is being distributed in Australia by DBS Bank Ltd, DBSVS or DBSV HK. DBS Bank Ltd holds Australian Financial Services Licence no. 475946. DBSVS and DBSV HK are exempted from the requirement to hold an Australian Financial Services Licence under the Corporation Act 2001 (“CA”) in respect of financial services provided to the recipients. Both DBS Bank Ltd and DBSVS are regulated by the Monetary Authority of Singapore under the laws of Singapore, and DBSV HK is regulated by the Hong Kong Securities and Futures Commission under the laws of Hong Kong, which differ from Australian laws. Distribution of this report is intended only for “wholesale investors” within the meaning of the CA.
Hong Kong This report has been prepared by a person(s) who is not licensed by the Hong Kong Securities and Futures Commission to carry on the regulated activity of advising on securities in Hong Kong pursuant to the Securities and Futures Ordinance (Chapter 571 of the Laws of Hong Kong). This report is being distributed in Hong Kong and is attributable to DBS Bank (Hong Kong) Limited, a registered institution registered with the Hong Kong Securities and Futures Commission to carry on the regulated activity of advising on securities pursuant to the Securities and Futures Ordinance (Chapter 571 of the Laws of Hong Kong).
For any query regarding the materials herein, please contact Carol Wu (Reg No. AH8283) at [email protected]
Indonesia This report is being distributed in Indonesia by PT DBS Vickers Sekuritas Indonesia.
Malaysia This report is distributed in Malaysia by AllianceDBS Research Sdn Bhd ("ADBSR"). Recipients of this report, received from ADBSR are to contact the undersigned at 603-2604 3333 in respect of any matters arising from or in connection with this report. In addition to the General Disclosure/Disclaimer found at the preceding page, recipients of this report are advised that ADBSR (the preparer of this report), its holding company Alliance Investment Bank Berhad, their respective connected and associated corporations, affiliates, their directors, officers, employees, agents and parties related or associated with any of them may have positions in, and may effect transactions in the securities mentioned herein and may also perform or seek to perform broking, investment banking/corporate advisory and other services for the subject companies. They may also have received compensation and/or seek to obtain compensation for broking, investment banking/corporate advisory and other services from the subject companies.
Wong Ming Tek, Executive Director, ADBSR
Singapore This report is distributed in Singapore by DBS Bank Ltd (Company Regn. No. 196800306E) or DBSVS (Company Regn
No. 198600294G), both of which are Exempt Financial Advisers as defined in the Financial Advisers Act and regulated by the Monetary Authority of Singapore. DBS Bank Ltd and/or DBSVS, may distribute reports produced by its respective foreign entities, affiliates or other foreign research houses pursuant to an arrangement under Regulation 32C of the Financial Advisers Regulations. Where the report is distributed in Singapore to a person who is not an Accredited Investor, Expert Investor or an Institutional Investor, DBS Bank Ltd accepts legal responsibility for the contents of the report to such persons only to the extent required by law. Singapore recipients should contact DBS Bank Ltd at 6327 2288 for matters arising from, or in connection with the report.
Page 13
Company Guide
mm2 Asia
Thailand This report is being distributed in Thailand by DBS Vickers Securities (Thailand) Co Ltd.
United Kingdom
This report is produced by DBS Bank Ltd which is regulated by the Monetary Authority of Singapore. This report is disseminated in the United Kingdom by DBS Vickers Securities (UK) Ltd, ("DBSVUK"). DBSVUK is authorised and regulated by the Financial Conduct Authority in the United Kingdom. In respect of the United Kingdom, this report is solely intended for the clients of DBSVUK, its respective connected and associated corporations and affiliates only and no part of this document may be (i) copied, photocopied or duplicated in any form or by any means or (ii) redistributed without the prior written consent of DBSVUK. This communication is directed at persons having professional experience in matters relating to investments. Any investment activity following from this communication will only be engaged in with such persons. Persons who do not have professional experience in matters relating to investments should not rely on this communication.
Dubai International Financial Centre
This research report is being distributed by DBS Bank Ltd., (DIFC Branch) having its office at units 608 - 610, 6th Floor, Gate Precinct Building 5, PO Box 506538, DIFC, Dubai, United Arab Emirates. DBS Bank Ltd., (DIFC Branch) is regulated by The Dubai Financial Services Authority. This research report is intended only for professional clients (as defined in the DFSA rulebook) and no other person may act upon it.
United Arab Emirates
This report is provided by DBS Bank Ltd (Company Regn. No. 196800306E) which is an Exempt Financial Adviser as defined in the Financial Advisers Act and regulated by the Monetary Authority of Singapore. This report is for information purposes only and should not be relied upon or acted on by the recipient or considered as a solicitation or inducement to buy or sell any financial product. It does not constitute a personal recommendation or take into account the particular investment objectives, financial situation, or needs of individual clients. You should contact your relationship manager or investment adviser if you need advice on the merits of buying, selling or holding a particular investment. You should note that the information in this report may be out of date and it is not represented or warranted to be accurate, timely or complete. This report or any portion thereof may not be reprinted, sold or redistributed without our written consent.
United States This report was prepared by DBS Bank Ltd. DBSVUSA did not participate in its preparation. The research analyst(s) named on this report are not registered as research analysts with FINRA and are not associated persons of DBSVUSA. The research analyst(s) are not subject to FINRA Rule 2241 restrictions on analyst compensation, communications with a subject company, public appearances and trading securities held by a research analyst. This report is being distributed in the United States by DBSVUSA, which accepts responsibility for its contents. This report may only be distributed to Major U.S. Institutional Investors (as defined in SEC Rule 15a-6) and to such other institutional investors and qualified persons as DBSVUSA may authorize. Any U.S. person receiving this report who wishes to effect transactions in any securities referred to herein should contact DBSVUSA directly and not its affiliate.
Other jurisdictions
In any other jurisdictions, except if otherwise restricted by laws or regulations, this report is intended only for qualified, professional, institutional or sophisticated investors as defined in the laws and regulations of such jurisdictions.

Page 14
Company Guide
mm2 Asia
DBS Regional Research Offices
HONG KONG DBS (Hong Kong) Ltd Contact: Carol Wu 13th Floor One Island East, 18 Westlands Road, Quarry Bay, Hong Kong Tel: 852 3668 4181 Fax: 852 2521 1812 e-mail: [email protected]
MALAYSIA AllianceDBS Research Sdn Bhd Contact: Wong Ming Tek (128540 U) 19th Floor, Menara Multi-Purpose, Capital Square, 8 Jalan Munshi Abdullah 50100 Kuala Lumpur, Malaysia. Tel.: 603 2604 3333 Fax: 603 2604 3921 e-mail: [email protected]
SINGAPORE DBS Bank Ltd Contact: Janice Chua 12 Marina Boulevard, Marina Bay Financial Centre Tower 3 Singapore 018982 Tel: 65 6878 8888 Fax: 65 65353 418 e-mail: [email protected] Company Regn. No. 196800306E
THAILAND DBS Vickers Securities (Thailand) Co Ltd Contact: Chanpen Sirithanarattanakul 989 Siam Piwat Tower Building, 9th, 14th-15th Floor Rama 1 Road, Pathumwan, Bangkok Thailand 10330 Tel. 66 2 857 7831 Fax: 66 2 658 1269 e-mail: [email protected] Company Regn. No 0105539127012 Securities and Exchange Commission, Thailand
INDONESIA PT DBS Vickers Sekuritas (Indonesia) Contact: Maynard Priajaya Arif DBS Bank Tower Ciputra World 1, 32/F Jl. Prof. Dr. Satrio Kav. 3-5 Jakarta 12940, Indonesia Tel: 62 21 3003 4900 Fax: 6221 3003 4943 e-mail: [email protected]
Related Documents