Welcome message from author
This document is posted to help you gain knowledge. Please leave a comment to let me know what you think about it! Share it to your friends and learn new things together.
Transcript

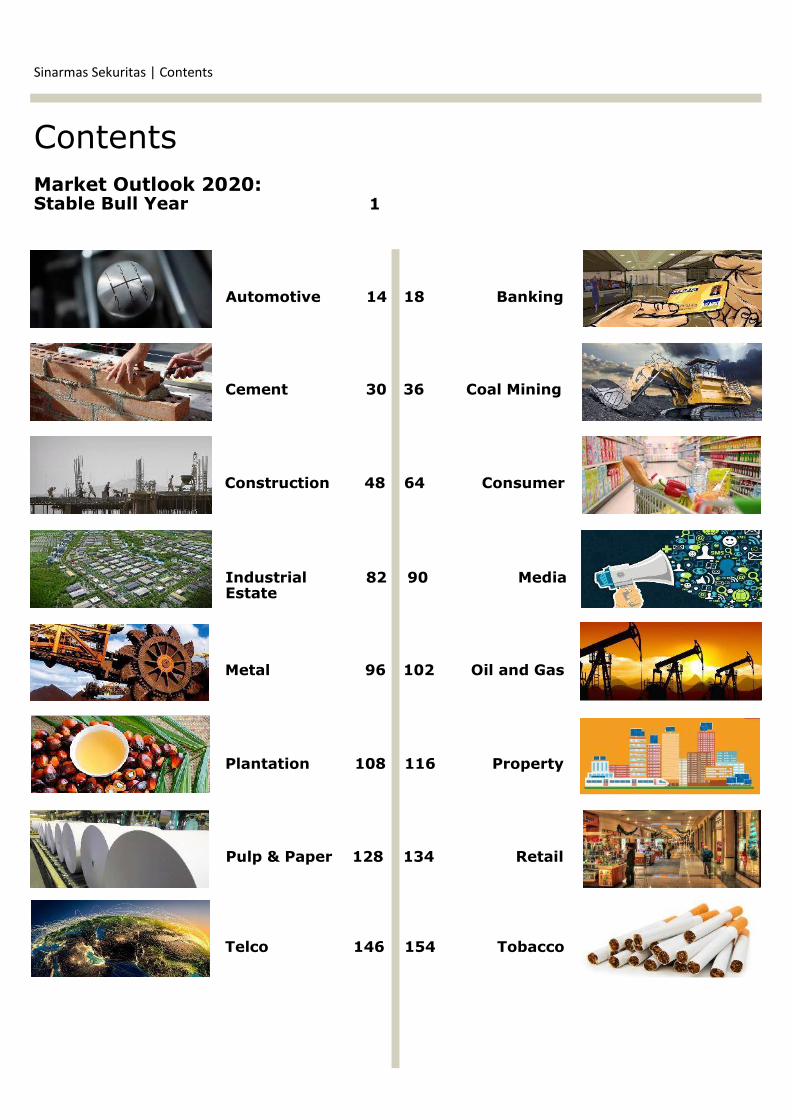
^ŝŶĂƌŵĂƐ^ĞŬƵƌŝƚĂƐŽŶƚĞŶƚƐ
&RQWHQWV 0DUNHW2XWORRN 6WDEOH%XOO<HDU
%DQNLQJ $XWRPRWLYH
&HPHQW
&RDO0LQLQJ
&RQVXPHU &RQVWUXFWLRQ
,QGXVWULDO (VWDWH
0HGLD
0HWDO
2LODQG*DV
3ODQWDWLRQ
3XOS3DSHU
7HOFR
7REDFFR
5HWDLO
3URSHUW\
1
Stable Bull Year Recovery Hopes in Favor of EMs
FY20F JCI target: 6,750 (7.1% upside)
We set our JCI target for 2020F at 6,750, derived from 8.6% FY20F EPS growth
and 16.2x FY20F PE (5-yr mean). Our JCI target implies 7.1% upside potential
from our FY19E target of 6,300. While we expect FY20F to be an extension of
FY19E’s ~5.0% economic growth, positive catalysts for equity should come from
1) lower tail risks as economic indicators are bottoming, 2) better earnings
visibility following FY19E’s sluggish performance, 3) greater political clarity post
election year, and 4) weaker USD which signals a risk-on play as flight-to-quality
premium fades. Upside risks to our call include potential relaxation on fiscal deficit
cap and FDI boost from Omnibus Law, whereas downside risks to our call may
come from rising China’s bond defaults and weaker-than-expected domestic
household consumption. Be that as it may, heightened geopolitical risks and
recession fears appear to be overblown in our view with U.S.-China reaching
‘phase one’ trade deal and many indicators are pointing to economic bottoming.
Macro economic indicators
Stable economic growth
As of 9M19, economic growth stood at a YoY reading of 5.02%, broadly inline with
market and our estimate of 5.0%, but lower than 2Q19 reading of 5.05%. Weaker
government spending post 2019 election (up 98 bps YoY) paired with softer export
(up 2 bps YoY) contributed to the slower growth. Private consumption, however,
posted a stable growth of 5.01% YoY, supporting the economic expansion during
the quarter. As for FY20F, we expect economic growth to be at 5.0%-5.1% target
range with equal weighted upside-versus-downside risks from our target. Breaking
down into components, growth in private consumption is expected to be slightly
lower at 5.0% level. Despite monetary and macroprudential policies easing this
year, price adjustment on several basic needs (e.g. cigarettes, electricity, and
BPJS premium) may pressurize consumption appetite in FY20F. Moreover, shifting
government’s focus on social assistance spending from direct transfer to more of
human capital development may challenge the translation to consumption
spending. As for investment, we believe that growth should be better due to
greater political clarity post election year and relatively low base this year.
Undeterred by sluggish commodity prices (except nickel), opportunity for FDI may
come from capital inflow stemmed by expansionary monetary and fiscal policy
from DMs, as well as government’s effort to boost investment, one of which
through Omnibus Law. As for government expenditure, improvement may occur in
2H20 given the high base in 1H19 (social assistance spending). Lastly, we expect
contribution from export-import should remain similar to FY19E as we see
continuation of import restriction in FY20F in order to safeguard country’s CAD.
Sinarmas Sekuritas | Market Outlook 2020
2019E 2020F
GDP Growth 5.0% - 5.1% 5.0% - 5.1%
Inflation 3.0% - 3.5% 3.0% - 3.5%
7 Day RR Rate 5.00% 4.25% - 5.00%
FX USDIDR 14,000 14,000 - 14,300
JCI Index 6,300 6,750
PE Ratio 16.4x 16.2x

2
Lower tail risks
Many global economic indicators that we monitor (global manufacturing PMI,
China credit impulse, Japan machine tool orders, and global semiconductor sales)
have shown apparent recovery in 2H19 following the downturn in 1H19. For the
most parts, we view these improvements are the products of central banks
easing, expansive fiscal policies, and improving trade war development. While the
bears are still cautious toward the yield curve, upticks in most of these indicators
signal a continuation of cyclical recovery for global trades and industrial activities
in the near-to-medium term. Taking all into account, we do not expect the global
economy to turn 180 degrees, nevertheless, the possibility of a sharp downturn in
FY20F should be minimal in our view. As such, reduced tail risks will bring positive
catalysts for stock prices which we believe favor EM equities relative to DMs.
Sinarmas Sekuritas | Market Outlook 2020
GDP contribution as of 9M19
Source: BPS, Sinarmas Investment Research
GDP component %YoY growth
Source: BPS, Sinarmas Investment Research
Global PMI started to rebound in Aug-19
Source: Bloomberg, Sinarmas Investment Research
China credit impulse vs US ISM
Source: Bloomberg, Sinarmas Investment Research
Japan machine tool orders vs MSCI World EPS
Source: Bloomberg, Sinarmas Investment Research
Semiconductor sales vs MSCI World EPS
Source: Bloomberg, Sinarmas Investment Research
45.0
46.0
47.0
48.0
49.0
50.0
51.0
52.0
53.0
54.0
55.0
2012 2013 2014 2015 2016 2017 2018 2019
Global PMI
-100.00%
-50.00%
0.00%
50.00%
100.00%
150.00%
200.00%
-150
-100
-50
0
50
100
150
200
250
300
20
00
20
01
20
02
20
03
20
04
20
05
20
06
20
07
20
08
20
09
20
10
20
11
20
12
20
13
20
14
20
15
20
16
20
17
20
18
20
19
Japan Machine Tool Orders YoY - LHS MSCI World Index Trailing 12M EPS YoY Change - RHS
-100.00%
-50.00%
0.00%
50.00%
100.00%
150.00%
200.00%
-60.00%
-40.00%
-20.00%
0.00%
20.00%
40.00%
60.00%
80.00%
1997
1998
1999
2000
2001
2002
2003
2004
2005
2006
2007
2008
2009
2010
2011
2012
2013
2014
2015
2016
2017
2018
2019
Global Semiconductor Sales - LHS MSCI World Index Trailing 12M EPS - RHS
-10%
-5%
0%
5%
10%
15%
20%
HH Consumption Govt Spending Investment Export Import
56.6%
1.5%
9.6%
32.3%
-0.1%
HH Consumption Inventory Changes Govt Spending Investment Net Export (Import)
49
50
51
52
53
54
55
21
23
25
27
29
31
33
35
2012 2013 2014 2015 2016 2017 2018 2019
China Credit Impulse - LHS Global PMI

3
Better earnings visibility
We see better earnings visibility in FY20F with JCI EPS rising 8.6% YoY versus a
lackluster growth of 2.7% YoY in FY19E. We turn more constructive on earnings
quality as we see positive turnaround in numerous sectors. Firstly, better earnings
quality should come from Banking sector (which contributes a large proportion of
index EPS) following this year’s mid-single digit growth and spurred by better
liquidity condition from easing policies as well as escalating government capex
spending post election year. Meanwhile, the IFRS 9 adoption should bring FY20F
EPS higher due to potentially lower credit cost. Similarly, we also see a number of
sectors which will experience a turnaround in earnings such as Automotive (Astra
International), Cement, Consumer Staples, Nickel, Oil & Gas, Plantation, and Pulp
& Paper. We regard the underperformance in FY19 has led to JCI’s sluggish
performance versus regional indices. As earnings recover, we expect some of the
capital outflow to return.
Sector EPS projection under our coverage
Sinarmas Sekuritas | Market Outlook 2020
US 2Y/10Y continued to rise since Aug-19
-0.4
-0.3
-0.2
-0.1
0
0.1
0.2
0.3
2016 2017 2018 2019
JAPAN 10Y YIELD
Japan 10Y yield breached 0% first time since Mar-19
Sector FY19E EPS Growth FY20F EPS Growth
Automotive -2.6% 9.6%
Banking 6.2% 15.7%
Cement -9.2% 37.2%
Coal Mining 4.7% -9.2%
Construction -20.9% -4.1%
Consumer Staples -2.1% 4.9%
Industrial Estate 44.0% 11.6%
Media 14.1% 3.5%
Nickel -20.6% 67.4%
Oil and Gas -28.6% 27.1%
Plantation* -79.4% 365.0%
Property 10.5% -24.1%
Pulp and Paper -37.0% 21.3%
Retail 2.9% 12.4%
Telecommunication 64.7% 14.5%
Tobacco 12.4% -14.9%
JCI 2.7% 8.6%
*Figures on the table exclude SIMP due to negative PAT
Source: Bloomberg, Sinarmas Investment Research Source: Bloomberg, Sinarmas Investment Research
-50
0
50
100
150
200
2014 2015 2016 2017 2018
US 2Y/10Y spread

4
Greater certainty post 2019 election
Being a political year, 2019 was colored with uncertainties. Thereupon, this
resulted in lower investment and business confidence across the board. Despite
rising inquiries for industrial lands leading to and following 2019 presidential
election, business activities and consumption spending were postponed as many
decided to take wait-and-see stance. As political overhang clears, pent-up demand
from both foreign and local investors now has a better chance to materialize. This,
we expect, may be further strengthened by Omnibus Law, which we will discuss
below.
Risk-on sentiment from weaker USD
There are few factors that may contribute to weaker USD in FY20F. First, as Fed’s
‘QE’ continues, the value of U.S. Dollar is expected to weaken due to rising
liquidity. While Chairman Powell has denied Fed’s balance sheet expansion for
reserve management purposes as a form of QE, the treasury purchases will add
the Dollar supply and increase liquidity. Second, lower volatility reading (VIX) on
the back of improving global backdrop from trade front and PMIs are expected to
further pressurize U.S. Dollar’s value as a safe-haven as well. Lastly, subdued
inflation in the U.S. has diminished Fed’s ability to raise rates in the near future.
This keeps a cap on Dollar’s strength. All of these factors pointing to weaker USD
should improve the risk-on sentiment on EMs as currency exchange risks have
always overshadowed EM equities.
Sinarmas Sekuritas | Market Outlook 2020
6.9%
2.7%
8.6%8.8%
9.4%
FY18 FY19E FY20F FY21F FY22F
JCI EPS growth (%YoY)
Consolidated coverage EPS growth
Fed’s balance sheet
Source: Bloomberg, Sinarmas Investment Research
3.5
3.7
3.9
4.1
4.3
4.5
4.7
2015 2016 2017 2018 2019
Fed Balance Sheet (in USD Mn)
0
5
10
15
20
25
30
35
2015 2016 2017 2018 2019
VIX
Cboe volatility index (VIX) is near all time low
Source: Bloomberg, Sinarmas Investment Research
Source: Sinarmas Investment Research

5
Rupiah to remain stable in FY20F
To date, Rupiah has appreciated against USD by 3 ppt, outperforming a handful
majority in EM currencies basket and despite 100 bps rate cuts in 2H19 (vs 75 bps
FFR cuts). In addition to the massive foreign inflow of IDR 171.9tn to the bond
market (SBN), Bank Indonesia continued to be supportive toward Rupiah
exchange rates via bond and FX markets in order to maintain economic stability.
Onwards, we expect USDIDR to be within 14,000-14,300 range. While we see
rooms for more policy easing (50-75 bps), weaker USD outlook should provide
cushion to Rupiah in FY20F. Downside risk to our call is worse-than-expected
global turmoil fueled by rising China’s bond defaults.
Sinarmas Sekuritas | Market Outlook 2020
FOMC dot plots
Source: Bloomberg
USDIDR real spread vs IDR (%YoY, Inverted)
Source: Bloomberg, OJK, Sinarmas Investment Research
EM currencies performance vs USD
Source: Bloomberg
-15.0%
-10.0%
-5.0%
0.0%
5.0%
10.0%
15.0%
20.0%
25.0%
30.0%-1.00
0.00
1.00
2.00
3.00
4.00
5.00
6.00
2012 2013 2014 2015 2016 2017 2018 2019
Real Spread IDR (% YoY) [RHS]
7DRRR vs CPI
Source: Bank Indonesia, Sinarmas Investment Research
3.25 3.183.4 3.41
3.23 3.12 3.18 3.2
2.883.16 3.23 3.13
2.822.57 2.48
2.83
3.32 3.28 3.323.49 3.39
3.133.00
4.25 4.25 4.25 4.25
4.75
5.25 5.255.50
5.75 5.756.00 6.00 6.00 6.00 6.00 6.00 6.00 6.00
5.755.50
5.255.00 5.00
0
1
2
3
4
5
6
7
Jan-18 Feb-18 Mar-18 Apr-18 May-18 Jun-18 Jul-18 Aug-18 Sep-18 Oct-18 Nov-18 Dec-18 Jan-19 Feb-19 Mar-19 Apr-19 May-19 Jun-19 Jul-19 Aug-19 Sep-19 Oct-19 Nov-19
Inflation (%YoY) 7DRRR

6
Upside risk from Omnibus Law
As we have mentioned briefly in the paragraph above, the introduction of Omnibus
Law can be a key catalyst for investment and business confidence. One of the
structural issues in Indonesian economy has been the lack of FDI. Aside from the
lengthy paperwork and numerous permits/regulations required, the complexity of
layers in Indonesian bureaucracy has become a major pushback. The proposed
Omnibus Law will simplify a wide range of areas (labor laws, investment
requirements, land acquisition rules, and many others) and act as a replacement
to the current existing and overlapping laws. Moreover, MoF is also pushing for a
lower corporate tax and the removal of dividend tax to be included in the Omnibus
Bill in order to further improve the country’s attractiveness. This, however, will be
done in stages to safeguard the fiscal impacts. As for corporate tax, tax rate will
be reduced gradually from current 25% to 22% in FY21/22, and to 20% in FY23.
Furthermore, companies that go public in FY21-23 will get to enjoy an additional
benefit of 3 ppt income tax (PPh) reduction from 22% in FY21/22 and 20% in
FY23 to 19%/17% respectively. While timeline and details are still under
discussion, passing rate for the bill is expected to be high as, in terms of political
support, political parties from President Widodo’s coalition control more than 70%
of the parliament. Meanwhile, the execution of the bill will provide upside risks to
the JCI.
Downside risk from China’s bond defaults
While we are guiding for a brighter global economic picture, downside risk to our
call may come from China’s bond market. Following a record default in China’s
domestic bonds this year, there are USD 8.6bn offshore bonds that will be due
next year. Admittedly, these bonds have at least 15% yields as they are classified
as stressed. Accounted for almost 40% of the total outstanding corporate dollar
bonds, with policymakers continue limiting leverage, these bonds may stem risks
to EMs from many perspectives; tighter liquidity, FX volatility, and shift from
equities to save-haven assets.
U.S.-China: Prisoner’s Dilemma
Using the prisoner’s dilemma analogy in game theory, the U.S.-China trade talk
may have appeared to have thin chances of success at the beginning. Aside from
being the two largest economies in the world, the two countries have eloquent
ways of expressing differences. On one hand, U.S. taunted China with trade tariffs
on a wide range of Chinese products. On the contrary, China intimidated U.S. with
their ‘self-destructive nuclear option’ by selling U.S. treasuries. After months of
negotiation, however, the two countries finally managed to reach the ‘phase one’
trade deal just before the year ended. Though the tangible impact from this is not
enough to exempt both countries from heading into an economic slowdown, it
shows that neither country wants to continue a standoff due to respective
personal interests from both presidents: 2020 U.S. presidential election (Trump)
and political stability (Xi). To note, the state of the economy, normally portrayed
in the capital market performance, is a crucial determinant to the incumbent’s
electability to win the election votes. With the next U.S. presidential election is
approaching, this trade negotiation is very important for Trump’s political career.
Hence, it is Trump’s best interest to close this deal and use it for his 2020 re-
election campaign. On the flip side, while it is too early to assume what the final
outcome may be, ‘phase one’ trade deal has eliminated the worst possible
outcome for both countries.
Sinarmas Sekuritas | Market Outlook 2020

7
What to buy?
In all, we believe FY20F to be a year of stability as many indicators are signaling a
continuation of cyclical recovery for global trades and industrial activities. As such,
reduced tail risks should bring positive catalysts for stock prices primarily for EMs.
In addition, better earnings visibility and weaker USD are also the key factors to
our positive stance toward JCI. Lastly, from the domestic perspective, we see a
brighter macroeconomic picture for Indonesia given the less uncertainty in political
overhang as well as the proposed Omnibus Law, which will be a tailwind to JCI’s
performance in FY20F. With that being said, our top picks for this year are: BMRI
(BUY, FY20 TP: 8,650), BBNI (BUY, FY20 TP: 9,150), SMGR (BUY, FY20
TP: 15,400), WIKA (BUY, FY20 TP: 2,510), BSDE (BUY, FY20 TP: 1,500),
SMRA (BUY, FY20 TP: 1,300), MAPI (BUY, FY20 TP: 1,300), and TLKM
(BUY, FY20 TP: 4,950). From the commodity sector, we like LSIP (BUY, FY20
TP: 1,720) as we see recent rally in CPO price to sustain in FY20F. As for small-to
-mid cap, we continue to like WEGE (BUY, FY20 TP: 480) due to its
undemanding valuation, favorable sector outlook, and expansion in modular
segment. Still from small-to-mid cap, we also like DMAS (BUY, FY20 TP: 360)
as it captures the improving investment outlook in Indonesia. Lastly, we also see
defensive name such as INDF (BUY, FY20 TP: 9,200) is attractive supported by
its commodity-related business and cheap valuation.
Sinarmas Sekuritas | Market Outlook 2020
S&P 500 performance during previous presidential terms
Source: Bloomberg, Sinarmas Investment Research
0
500
1000
1500
2000
2500
3000
3500
1989 1990 1991 1992 1993 1994 1995 1996 1997 1998 1999 2000 2001 2002 2003 2004 2005 2006 2007 2008 2009 2010 2011 2012 2013 2014 2015 2016 2017 2018 2019
George H. W. Bush
Start, Total Index
Return 51%
Bill Clinton Start,
Total Index Return
210%
George W. Bush Start,
Total Index Return -
40%
Barack Obama Start,
Total Index Return
182%
Donald Trump Start,
Total Index Return 38%

8
Our view on commodities:
CPO: the arrival of long-awaited positive breeze
Although it might be a bit delayed, however CPO prices have started a rally since
end of 1H19 and currently still stands strong at MYR 2,850/ton on several reasons
such as supportive MPOB data, drop in CPO output, better demand from China
and India along with positive effect on phase one trade deal between US-China.
We expect the output drop in 2019 is only the beginning and will extend to 2020
onwards, on limited new plantings from the previous years plus more aggressive
replanting program undertaken by big CPO players. Meanwhile in the near-term,
production will also under pressure due to the cutback in fertilizer application and
recent drought and haze that may pose knock-on effect on production yield in
2020. Coupled with the expected strong incremental demand backed by the B30
implementation in Indonesia starting early 2020, we reiterate our bullish stance
on the industry and expect CPO price to trade at average of MYR 2,500 per ton in
FY20F.
Pulp and Paper: pulp price conundrum
2019 is a sloppy year for pulp and paper industry following pulp price slump since
end of FY18 and remains low at current moment. The bearish pulp price outlook
mainly came from weakening pulp demand that resulted in high inventories both
in China and European ports (two biggest users for pulp). We believe further
observation on pulp demand along with the inventory level is important to see
where price will be going on from current level. Overall, we expect pulp price to
recover in 2020, although only at moderate magnitude and will occur by fastest in
2H20. We are now seeing benchmark pulp price at USD 650/ton in FY20F.
Sinarmas Sekuritas | Market Outlook 2020
Inventory almost fall to its 5-years average level
Source: Bloomberg, Sinarmas Investment Research
-
500
1,000
1,500
2,000
2,500
3,000
3,500
Jun-18 Aug-18 Oct-18 Dec-18 Feb-19 Apr-19 Jun-19 Aug-19 Oct-19
MPOB Production MPOB Export MPOB Inventory 5Y Avg Inventory

9
Coal: weakness persists as demand fades
Global economy slowdown, fueled from US-China trade war, has impacted energy
demand, especially for China and India (two biggest consumers for coal). As a
result, coal price has moved in a continuous negative direction during 2019,
closing in at USD 67.9 per ton (Newcastle 6,322) as of Nov-19, or down by
33.5% compared to a year ago. Going forward to FY20, we believe that global coal
price could keep dimming as we see demand to remain weak while supplies grow.
Global economy slowdown will continue to weigh down on thermal demand,
particularly from China and India. On the other hand, current high inventories
level and additional local supplies from China’s new and more efficient mine this
year will likely drive up supplies, lowering their need of imports. Hence, we expect
global coal price to remain weak in FY20, averaging at USD 70 per ton, down by
10% from FY19 avg but up by 4% from 4Q19. Indonesia’s low coal price,
however, should be more resilient as we see improvement in demand/supply
balance driven by decelerating production growth and new power plant roll out.
Nickel: improving balance
After recent outperformance in 3Q19 boosted by the changes in Indonesia ore
export ban regulation, nickel stocks dived in recent months as nickel price pulled
back to USD 13,000 per ton from its highest level at USD 18,050 in Sep-19.
Recent nickel fallout was driven by weakness in the stainless steel and EV sales
department, as well as ramp-up ore export coming from Indonesia prior to the
ban deadline (Jan-20). Despite recent weakness, we forecast nickel price to
rebound in FY20 as we see the current inventory remains low while demand will
still grow modestly paired with a moderate supply growth as higher refined output
will be strained by lower ore availability from Indonesia’s ore export ban. Wood
Mackenzie forecasts demand to grow by 3.8% YoY in FY20, slowing down from
6.3% in FY19. Stainless steel and EV batteries remain to be the engine drivers for
nickel consumption growth. On the other hand, refined nickel output is forecasted
to grow by 5.3% in FY20, declining from 8.3% in FY19. Nickel mined production,
however, is expected to drop by 3% YoY. These should level out the demand/
supply balance in FY20, after posting a supply deficit in the past 4 years. We
forecast nickel price to average at USD 15,000 per ton in FY20, rising from USD
14,000 per ton average in FY19.
Sinarmas Sekuritas | Market Outlook 2020
China rising coal production and inventory
Source: Bloomberg, Sinarmas Investment Research
3000
3200
3400
3600
3800
4000
0
5
10
15
20
25
30
Inventory at 6 Major Power Plant (Mt) 12-month Production (Mt)
10
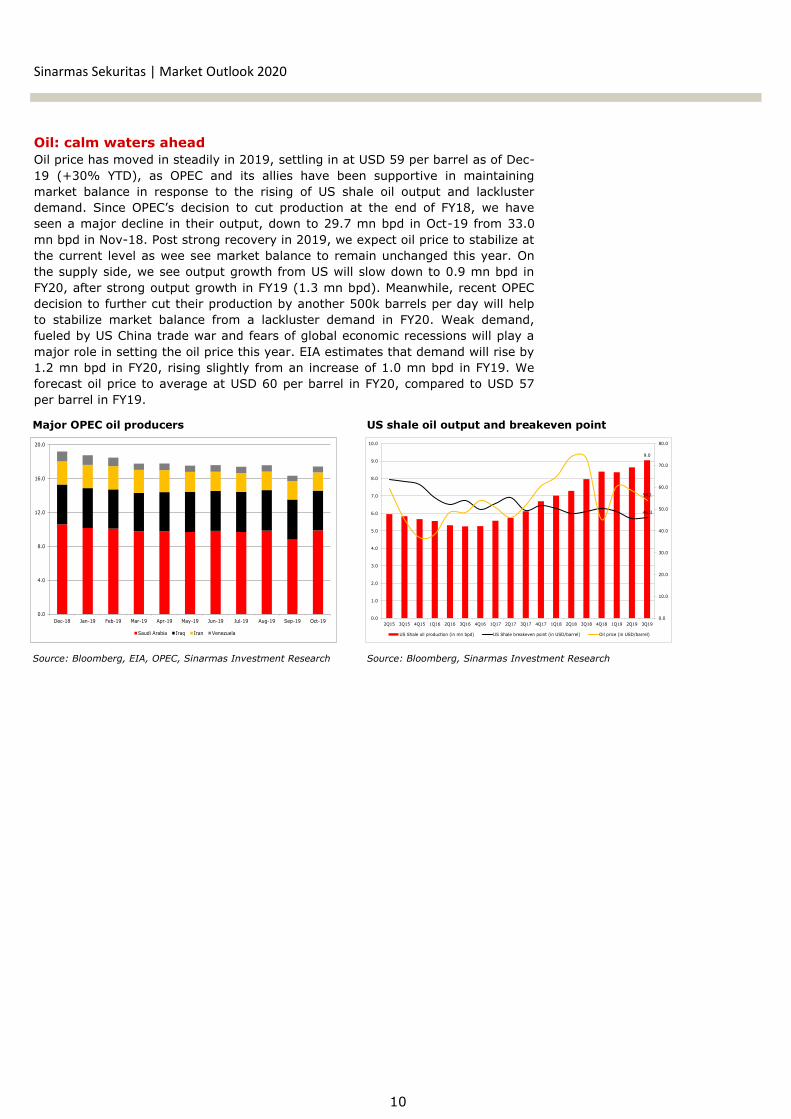
Oil: calm waters ahead
Oil price has moved in steadily in 2019, settling in at USD 59 per barrel as of Dec-
19 (+30% YTD), as OPEC and its allies have been supportive in maintaining
market balance in response to the rising of US shale oil output and lackluster
demand. Since OPEC’s decision to cut production at the end of FY18, we have
seen a major decline in their output, down to 29.7 mn bpd in Oct-19 from 33.0
mn bpd in Nov-18. Post strong recovery in 2019, we expect oil price to stabilize at
the current level as wee see market balance to remain unchanged this year. On
the supply side, we see output growth from US will slow down to 0.9 mn bpd in
FY20, after strong output growth in FY19 (1.3 mn bpd). Meanwhile, recent OPEC
decision to further cut their production by another 500k barrels per day will help
to stabilize market balance from a lackluster demand in FY20. Weak demand,
fueled by US China trade war and fears of global economic recessions will play a
major role in setting the oil price this year. EIA estimates that demand will rise by
1.2 mn bpd in FY20, rising slightly from an increase of 1.0 mn bpd in FY19. We
forecast oil price to average at USD 60 per barrel in FY20, compared to USD 57
per barrel in FY19.
Sinarmas Sekuritas | Market Outlook 2020
Major OPEC oil producers
Source: Bloomberg, EIA, OPEC, Sinarmas Investment Research
US shale oil output and breakeven point
0.0
4.0
8.0
12.0
16.0
20.0
Dec-18 Jan-19 Feb-19 Mar-19 Apr-19 May-19 Jun-19 Jul-19 Aug-19 Sep-19 Oct-19
Saudi Arabia Iraq Iran Venezuela
Source: Bloomberg, Sinarmas Investment Research
9.0
46.3
54.1
0.0
10.0
20.0
30.0
40.0
50.0
60.0
70.0
80.0
0.0
1.0
2.0
3.0
4.0
5.0
6.0
7.0
8.0
9.0
10.0
2Q15 3Q15 4Q15 1Q16 2Q16 3Q16 4Q16 1Q17 2Q17 3Q17 4Q17 1Q18 2Q18 3Q18 4Q18 1Q19 2Q19 3Q19
US Shale oil production (in mn bpd) US Shale breakeven point (in USD/barrel) Oil price (in USD/barrel)

11
Sinarmas Sekuritas | Rating Summary
2019E 2020F 2019E 2020F 2019E 2020F IDR Bn USD Mn
Automotive
1 ASII ADD 6,850 7,800 13.9% -1.1 10.4 14.7 13.4 2.1 1.9 277,312.3 19,776.9
Banking
2 BMRI BUY 7,375 8,650 17.3% 14.1 15.8 13.7 11.8 2.0 2.0 344,166.7 24,544.8
3 BBRI NEUTRAL 4,280 4,540 6.1% 5.3 8.7 16.4 15.1 2.8 2.6 527,920.1 37,649.4
4 BBCA ADD 31,800 35,675 12.2% 10.1 16.9 30.9 26.4 5.1 4.6 784,029.3 55,914.2
5 BBNI BUY 7,650 9,150 19.6% 0.7 20.1 11.2 9.4 1.4 1.4 142,662.2 10,174.2
6 BBTN NEUTRAL 2,170 2,300 6.0% -58.4 126.7 20.8 10.8 1.0 1.3 22,980.3 1,638.9
Cement
7 INTP NEUTRAL 20,000 20,200 1.0% 44.0 8.3 44.6 41.2 3.1 3.1 73,624.6 5,250.7
8 SMGR BUY 12,300 15,400 25.2% -28.9 58.2 41.6 26.3 2.6 2.5 72,957.7 5,203.1
Coal Mining
9 ITMG NEUTRAL 11,050 12,000 8.6% -48.5 -15.7 7.1 8.5 1.0 1.1 12,485.7 890.4
10 ADRO NEUTRAL 1,590 1,650 3.8% 17.8 -14.9 7.5 8.8 0.8 0.8 50,857.7 3,627.0
11 PTBA NEUTRAL 2,580 2,700 4.7% -19.5 -4.4 7.7 8.0 1.5 1.4 29,723.3 2,119.8
12 INDY BUY 1,160 1,400 20.7% -51.8 -14.8 6.4 7.4 0.4 0.4 6,043.8 431.0
13 UNTR BUY 21,175 25,700 21.4% -1.0 3.8 8.8 8.4 1.6 1.4 78,985.6 5,633.0
Construction
14 WIKA BUY 2,050 2,510 22.4% 19.3 5.1 10.9 10.4 1.4 1.4 18,388.4 1,311.4
15 PTPP BUY 1,650 1,900 15.2% -29.4 9.3 11.1 10.2 0.9 1.1 10,229.8 729.6
16 ADHI BUY 1,225 1,550 26.5% 1.0 6.1 8.5 8.0 0.8 0.9 4,362.0 311.1
17 WSKT NEUTRAL 1,445 1,570 8.7% -47.5 -48.5 10.2 19.9 1.1 1.1 19,614.4 1,398.8
18 WTON BUY 440 570 29.5% 7.0 9.1 9.6 8.8 1.4 1.3 3,834.8 273.5
19 WSBP NEUTRAL 324 350 8.0% -26.1 13.8 11.1 9.8 1.1 1.0 8,541.0 609.1
20 WEGE BUY 296 480 62.2% 3.8 14.2 10.0 8.8 1.9 1.8 2,833.3 202.1
Consumer Staples
21 UNVR NEUTRAL 41,225 43,900 6.5% -20.6 1.0 46.3 45.8 47.9 47.1 314,546.8 22,432.4
22 ICBP ADD 11,450 12,800 11.8% 10.2 5.3 29.6 28.1 5.9 5.3 133,528.8 9,522.8
23 KLBF NEUTRAL 1,600 1,680 5.0% 5.6 5.4 30.3 28.8 4.7 4.4 75,000.2 5,348.8
24 INDF BUY 7,750 9,200 18.7% 14.1 7.4 17.0 15.8 1.5 1.4 68,048.3 4,853.0
25 MYOR NEUTRAL 2,020 2,160 6.9% -2.3 7.9 28.8 26.7 5.0 4.5 45,164.6 3,221.0
26 SIDO ADD 1,275 1,400 9.8% 19.8 6.2 26.2 24.7 6.6 6.2 19,125.0 1,363.9
27 ROTI BUY 1,305 1,540 18.0% 61.0 20.5 34.3 30.2 2.6 2.8 8,073.4 575.8
28 UCID** BUY 1,500 1,900 26.7% 65.6 47.6 26.4 17.8 1.4 1.3 6,234.9 444.7
Industrial Estate
29 DMAS BUY 302 360 19.2% 84.0 12.9 19.0 16.8 2.4 2.4 14,555.8 1,038.1
30 BEST ADD 212 240 13.2% 12.9 25.8 6.3 8.5 0.5 0.5 2,045.2 145.9
31 SSIA NEUTRAL 700 700 0.0% 156.5 141.5 34.1 14.1 0.8 0.8 3,293.7 234.9
Media
32 SCMA ADD 1,445 1,650 14.2% -2.9 4.5 16.7 16.0 4.8 4.4 21,340.9 1,522.0
33 MNCN NEUTRAL 1,590 1,650 3.8% 30.5 2.8 11.8 11.5 1.9 1.7 22,699.0 1,618.8
No Ticker Rating Current Price* Target Price % ChgEPS Growth (%) PER (x) PBV (x) Market Capitalization

12
Sinarmas Sekuritas | Rating Summary
2019E 2020F 2019E 2020F 2019E 2020F IDR Bn USD Mn
Metal
34 INCO NEUTRAL 3,490 3,700 6.0% -34.2 135.1 67.1 28.5 1.4 1.3 34,677.8 2,473.1
35 ANTM ADD 850 970 14.1% -10.7 21.2 29.8 24.6 1.2 1.2 20,426.2 1,456.7
Oil and Gas
36 ELSA BUY 304 400 31.6% 17.0 9.1 9.0 8.3 0.8 0.8 2,218.7 158.2
37 PGAS ADD 2,130 2,350 10.3% -31.6 29.7 19.2 14.8 1.2 1.1 51,634.4 3,682.4
Plantation
38 AALI NEUTRAL 13,425 14,600 8.8% -82.9 417.8 114.4 22.1 1..4 1.4 25,838.9 1,842.7
39 LSIP BUY 1,420 1,720 21.1% -64.0 256.4 98.2 27.6 1.4 1.3 9,688.5 690.9
40 SIMP BUY 390 450 15.4% N/A N/A N/A 21.7 0.4 0.4 6,168.4 439.9
Property
41 BSDE BUY 1,255 1,500 19.5% 115.7 -43.9 10.3 18.4 0.9 0.8 24,154.6 1,722.6
42 SMRA BUY 1,030 1,300 26.2% 6.9 14.1 39.4 34.3 1.9 1.8 14,859.6 1,059.7
43 ASRI ADD 242 280 15.7% -63.3 15.3 15.4 13.4 0.6 0.5 4,755.2 339.1
44 PWON ADD 570 640 12.3% 5.7 -18.1 11.5 14.0 1.8 1.7 27,451.0 1,957.7
45 CTRA ADD 1,060 1,170 10.4% -24.9 -13.3 24.4 28.1 1.2 1.2 19,673.9 1,403.1
Pulp and Paper
46 INKP BUY 7,875 10,400 32.1% -45.1 17.9 12.4 10.5 1.0 0.9 43,084.0 3,072.6
47 TKIM NEUTRAL 11,300 12,350 9.3% -17.8 26.7 13.3 10.5 1.9 1.6 35,179.4 2,508.9
Retail
48 ACES NEUTRAL 1,550 1,730 11.6% 7.9 7.9 28.5 26.4 6.3 5.5 26,582.5 1,895.8
49 ERAA ADD 1,625 1,870 15.1% -68.8 89.1 22.5 11.9 1.2 1.1 5,183.8 369.7
50 LPPF NEUTRAL 3,700 4,030 8.9% 27.6 -0.4 8.4 8.4 4.9 4.3 10,378.1 740.1
51 MAPI BUY 1,030 1,300 26.2% 21.7 20.0 24.1 20.1 2.9 2.6 17,098.0 1,219.4
52 RALS NEUTRAL 1,035 1,140 10.1% 8.3 2.2 12.7 12.4 2.1 2.1 7,344.4 523.8
Telecommunication
53 TLKM BUY 3,990 4,950 24.1% 12.7 15.2 24.1 20.9 4.8 4.5 395,258.2 28,188.4
54 EXCL ADD 3,240 3,650 12.7% 3.3 4.5 45.6 31.4 2.0 1.9 34,629.0 2,469.6
55 ISAT ADD 3,120 3,600 15.4% N/A N/A N/A N/A 0.9 1.0 16,953.9 1,209.1
Tobacco
56 HMSP BUY 2,060 2,500 21.4% 6.2 -11.7 20.2 22.9 8.1 8.4 239,615.2 17,088.5
57 GGRM BUY 52,025 60,250 15.8% 23.2 -19.7 12.1 15.0 2.2 2.1 100,100.7 7,138.8
Miscellaneous
58 AKRA NEUTRAL 3,840 3,900 1.6% -1.4 37.0 22.1 16.3 1.9 1.8 15,416.4 1,099.4
59 BIRD BUY 2,890 3,500 21.1% -28.9 23.6 27.2 22.0 1.3 1.3 7,231.1 515.7
60 JSMR NEUTRAL 5,225 5,700 9.1% -13.1 6.6 21.6 20.3 2.2 2.1 37,922.4 2,704.5
* As of market closing on December 13,2019
** IPO price at IDR 1,500 per share
% ChgNo Ticker Rating Current Price* Target PriceEPS Growth (%) PER (x) PBV (x) Market Capitalization

13
This page is intentionally left blank

ƵƚŽŵŽƟǀĞ^ĞĐƚŽƌ ^ŚŝŌƚŽ>ŽǁĞƌ'ĞĂƌ
KsZt/',d
)<)7KHDGMXVWPHQWSHULRG0RYLQJLQWRWKH\HDUZHVHHWKDWWKHDXWRPRWLYHVHFWRUZLOOEHKDYLQJDQ DGMXVWPHQW SHULRG WR WKH QHZ UHJXODWLRQ FKDQJHVWKDW ZHUH VHW LQ QDPHO\ 33 7KLVUHJXODWLRQFKDQJHVWKHWD[VWUXFWXUHRQDYHKLFOHIURPHQJLQH-VL]HG-EDVHG WR FDUERQ-EDVHG 7KLV UHJXODWLRQZLOOEHHIIHFWLYHVWDUWLQJ2FWREHU:HVHHWKDWWKH*RYHUQPHQW RI ,QGRQHVLD LQWHQGV WR SURPRWH WKHDGRSWLRQRIHOHFWULFYHKLFOHV(9DQGHQKDQFHWKHIDVW-JURZLQJ ORFDO DXWR PDQXIDFWXULQJ EDVH IRU H[SRUWRULHQWDWLRQ:LWKWKDWEHLQJVDLGZHEHOLHYHWKDWDXWRPDQXIDFWXUHUV ZLOO SUHSDUH WR SXUVXH ORZHU FDUERQHPLVVLRQHQJLQHVDQGSRVVLEO\(9HOHFWULFYHKLFOHOLQH-XSVZKLOHFRQVXPHUVPLJKWSRVWSRQHEX\LQJQHZFDUVHVSHFLDOO\ZKHQWKHUHDUHQRWPDQ\QHZPRGHOVEHLQJODXQFKHGGXULQJWKH\HDU
)< ZHDN GHPDQG LQ WKH RYHUDOO VHFWRU $VRI0QDWLRQDO:VDOHVSRVWHGVOXJJLVKSHUIRUPDQFHDV LW ZHQW GRZQ E\ <R< DV XQLW VDOHV ZHUHUHFRUGHGDWN0HDQZKLOHGRPHVWLF:VDOHVDOVRUHFRUGHGDZHDNJURZWKRI<R<ZLWKPQXQLWVVROG GXULQJ WKH SHULRG 7KURXJKRXW WKH \HDU GHPDQGZDVZHDNLQZKLFKZHEHOLHYHZDVSDUWO\DWWULEXWDEOHWRWKH VRIW *'3 H[SDQVLRQ GHFOLQLQJ FRPPRGLW\ SULFHVDQG D QXPEHU RI SROLWLFDO HYHQWV :RUVHQHG E\ WKHLQWHQVH FRPSHWLWLRQ PRVW RI WKH DXWRPRWLYH EUDQGVH[SHULHQFHGDQHJDWLYHJURZWK LQ)<H[FHSW:XOLQJ<R<PDUNHWVKDUH')6.PDUNHWVKDUHDQGRWKHUDXWRPDNHUVZKLFKKDYHQLFKHPDUNHWVXFKDV1LVVDQ%0:DQG0,1,,QRXURSLQLRQSRVLWLYH<R<SHUIRUPDQFHIURP:XOLQJDQG')6.ZHUHDWWULEXWDEOHWRWKHPRUHIOH[LEOHSULFLQJVWUDWHJ\ZKLFKLVPRUHDIIRUGDEOHFRPSDUHGWRWKH-DSDQHVHEUDQGVLQDGGLWLRQ WR WKH ORZ EDVH LQ WKH SUHYLRXV \HDU $V IRU1LVVDQ $OO-1HZ /LYLQD ODXQFKLQJ KDG KHOSHG WKHEUDQG¶VVDOHVDV LW UHFRUGHGVLPLODUSHUIRUPDQFH WR LWVWZLQ 0LWVXELVKL ([SDQGHU 0HDQZKLOH WKH WRS-DXWRPDNHUV LQ ,QGRQHVLDQ PDUNHW ZKLFK DUH 7R\RWD'DLKDWVX +RQGD 0LWVXELVKL DQG 6X]XNL SRVWHG DQHJDWLYH \HDUO\ JURZWK RI UHVSHFWLYHO\ /RRNLQJ DW $VWUD¶VSHUIRUPDQFHFRPSDQ\PDQDJHGWRPDLQWDLQLWVPDUNHWVKDUHDWLQ0EHWWHUWKDQWKHVDPHSHULRGODVW \HDU 0 7KLV ZDV VXSSRUWHG E\7R\RWD-'DLKDWVXDVWKH\RXWSHUIRUPHGWKHLUSHHUV
6RXUFH*DLNLQGR6LQDUPDV,QYHVWPHQW5HVHDUFK
$XWRPRWLYHEUDQG0ZKROHVDOHV
Ra nk Bra nd Ma rke t Sha re YoY Growth
1 TOYOTA 32.4% - 6.2%
2 DAIHATSU 17.7% - 10.7%
3 HONDA 13.2% - 16.1%
4 MITSUBISHI MOTORS 11.8% - 19.0%
5 SUZUKI 9.4% - 19.5%
6 MITSUBISHI FUSO 4.3% - 18.0%
7 HINO 3.0% - 21.0%
8 ISUZU 2.4% - 5.0%
9 WULING 1.9% 17.8%
10 NISSAN 1.3% 98.0%
ƵƚŽŵŽƟǀĞ^ĞĐƚŽƌKƵƚůŽŽŬ
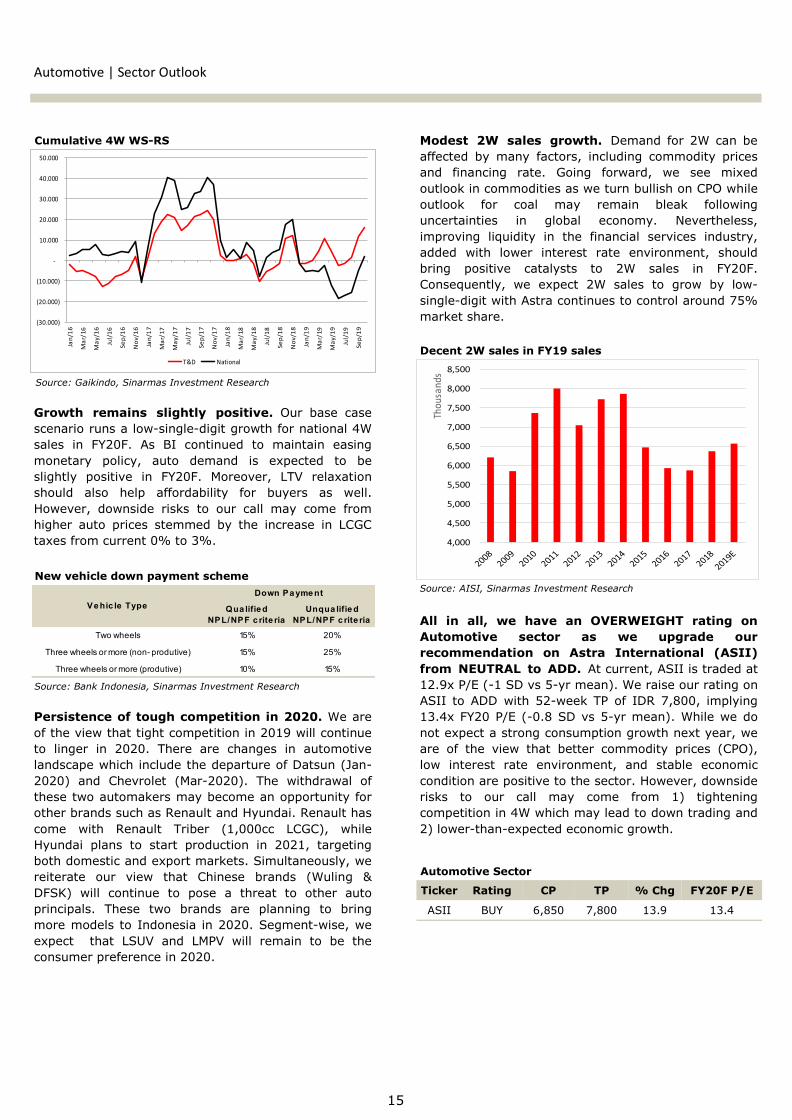
0RGHVW : VDOHV JURZWK 'HPDQG IRU : FDQ EHDIIHFWHG E\PDQ\ IDFWRUV LQFOXGLQJ FRPPRGLW\ SULFHVDQG ILQDQFLQJ UDWH *RLQJ IRUZDUG ZH VHH PL[HGRXWORRNLQFRPPRGLWLHVDVZHWXUQEXOOLVKRQ&32ZKLOHRXWORRN IRU FRDO PD\ UHPDLQ EOHDN IROORZLQJXQFHUWDLQWLHV LQ JOREDO HFRQRP\ 1HYHUWKHOHVVLPSURYLQJ OLTXLGLW\ LQ WKH ILQDQFLDO VHUYLFHV LQGXVWU\DGGHG ZLWK ORZHU LQWHUHVW UDWH HQYLURQPHQW VKRXOGEULQJ SRVLWLYH FDWDO\VWV WR : VDOHV LQ )<)&RQVHTXHQWO\ ZH H[SHFW : VDOHV WR JURZ E\ ORZ-VLQJOH-GLJLWZLWK$VWUDFRQWLQXHVWRFRQWURODURXQGPDUNHWVKDUH
$OO LQ DOO ZH KDYH DQ 29(5:(,*+7 UDWLQJ RQ$XWRPRWLYH VHFWRU DV ZH XSJUDGH RXUUHFRPPHQGDWLRQ RQ $VWUD ,QWHUQDWLRQDO $6,,IURP 1(875$/ WR $'' $WFXUUHQW$6,,LVWUDGHGDW[3(-6'YV-\UPHDQ:HUDLVHRXUUDWLQJRQ$6,, WR $''ZLWK -ZHHN 73 RI ,'5 LPSO\LQJ[)<3( -6'YV-\UPHDQ:KLOHZHGRQRWH[SHFWDVWURQJFRQVXPSWLRQJURZWKQH[W\HDUZHDUH RI WKH YLHZ WKDW EHWWHU FRPPRGLW\ SULFHV &32ORZ LQWHUHVW UDWH HQYLURQPHQW DQG VWDEOH HFRQRPLFFRQGLWLRQDUHSRVLWLYHWRWKHVHFWRU+RZHYHUGRZQVLGHULVNV WR RXU FDOO PD\ FRPH IURP WLJKWHQLQJFRPSHWLWLRQLQ:ZKLFKPD\OHDGWRGRZQWUDGLQJDQGORZHU-WKDQ-H[SHFWHGHFRQRPLFJURZWK
*URZWK UHPDLQV VOLJKWO\ SRVLWLYH 2XU EDVH FDVHVFHQDULRUXQVDORZ-VLQJOH-GLJLWJURZWKIRUQDWLRQDO:VDOHV LQ )<) $V %, FRQWLQXHG WR PDLQWDLQ HDVLQJPRQHWDU\ SROLF\ DXWR GHPDQG LV H[SHFWHG WR EHVOLJKWO\ SRVLWLYH LQ )<) 0RUHRYHU /79 UHOD[DWLRQVKRXOG DOVR KHOS DIIRUGDELOLW\ IRU EX\HUV DV ZHOO+RZHYHU GRZQVLGH ULVNV WR RXU FDOO PD\ FRPH IURPKLJKHU DXWR SULFHV VWHPPHG E\ WKH LQFUHDVH LQ /&*&WD[HVIURPFXUUHQWWR
3HUVLVWHQFHRIWRXJKFRPSHWLWLRQLQ:HDUHRIWKHYLHZWKDWWLJKWFRPSHWLWLRQLQZLOOFRQWLQXHWR OLQJHU LQ 7KHUH DUH FKDQJHV LQ DXWRPRWLYHODQGVFDSHZKLFKLQFOXGHWKHGHSDUWXUHRI'DWVXQ-DQ- DQG &KHYUROHW 0DU- 7KH ZLWKGUDZDO RIWKHVHWZRDXWRPDNHUVPD\EHFRPHDQRSSRUWXQLW\IRURWKHUEUDQGVVXFKDV5HQDXOWDQG+\XQGDL5HQDXOWKDVFRPH ZLWK 5HQDXOW 7ULEHU FF /&*& ZKLOH+\XQGDL SODQV WR VWDUW SURGXFWLRQ LQ WDUJHWLQJERWKGRPHVWLFDQGH[SRUWPDUNHWV6LPXOWDQHRXVO\ZHUHLWHUDWH RXU YLHZ WKDW &KLQHVH EUDQGV :XOLQJ ')6. ZLOO FRQWLQXH WR SRVH D WKUHDW WR RWKHU DXWRSULQFLSDOV 7KHVH WZR EUDQGV DUH SODQQLQJ WR EULQJPRUHPRGHOVWR ,QGRQHVLD LQ6HJPHQW-ZLVHZHH[SHFW WKDW /689 DQG /039 ZLOO UHPDLQ WR EH WKHFRQVXPHUSUHIHUHQFHLQ
6RXUFH$,6,6LQDUPDV,QYHVWPHQW5HVHDUFK
'HFHQW:VDOHVLQ)<VDOHV
7LFNHU 5DWLQJ &3 73 &KJ )<)3(
$6,, %8<
$XWRPRWLYH6HFWRU
6RXUFH*DLNLQGR6LQDUPDV,QYHVWPHQW5HVHDUFK
&XPXODWLYH::6-56
6RXUFH%DQN,QGRQHVLD6LQDUPDV,QYHVWPHQW5HVHDUFK
1HZYHKLFOHGRZQSD\PHQWVFKHPH
Qua lifie d NPL/NPF c rite ria
Unqua lifie d NPL/NPF c rite ria
Two wheels 15% 20%
Three wheels or more (non- produtive) 15% 25%
Three wheels or more (produtive) 10% 15%
Down Pa yme nt
Ve hic le Type
4,000
4,500
5,000
5,500
6,000
6,500
7,000
7,500
8,000
8,500
Thou
sand
s
(30.000)
(20.000)
(10.000)
-
10.000
20.000
30.000
40.000
50.000
Jan/
16
Mar
/16
May
/16
Jul/
16
Sep/
16
Nov
/16
Jan/
17
Mar
/17
May
/17
Jul/
17
Sep/
17
Nov
/17
Jan/
18
Mar
/18
May
/18
Jul/
18
Sep/
18
Nov
/18
Jan/
19
Mar
/19
May
/19
Jul/
19
Sep/
19T&D National

:H UDLVH RXU UDWLQJ RQ 37 $VWUD ,QWHUQDWLRQDO 7EN $6,,IURP1(875$/WR$''ZLWK)<73RI,'52XWWDUJHWSULFH LV GHULYHG IURP 6273 YDOXDWLRQ ZLWK LPSOLHG FRQVROLGDWHG)<) 3( DQG 3%9 RI [ DQG [ UHVSHFWLYHO\ 2YHUDOO ZHEHOLHYH$6,,WRKDYHDPRUHIDYRUDEOHRXWORRNLQGHVSLWHWKHFKDOOHQJLQJ FRPSHWLWLRQ ODQGVFDSH $PDLQWDLQHGPDUNHW VKDUH LQDXWREXVLQHVVLPSURYLQJ&32SULFHVDQG%DQN3HUPDWDGLYHVWPHQWVKRXOG EH WKH UHWDLQLQJ SRVLWLYH FDWDO\VWV IRU $6,, +RZHYHU WKHULVNV WR RXU FDOO DUH ZRUVH-WKDQ-H[SHFWHG FRPSHWLWLRQ LQ :EXVLQHVV IXUWKHU GHWHULRUDWLRQ LQ FRPPRGLW\ SULFHV DQG VORZHU-WKDQ-H[SHFWHGHFRQRPLFJURZWK 0RGHVW JURZWK LQ $XWRPRWLYH EXVLQHVV $V IRU )<) ZHH[SHFWQDWLRQDODXWRVDOHV WRJURZPRGHUDWHO\DWZLWK$VWUD¶VVKDUHEHLQJPDLQWDLQHGDW)URP:VHJPHQWZHIRUHFDVWWKHQDWLRQDO : VDOHV WR JURZ DW ORZ-VLQJOH-GLJLW UDWH 'HVSLWH WKHFKDOOHQJLQJ ODQGVFDSH VKRZQ LQ ZH UHPDLQ FDXWLRXVO\RSWLPLVWLF WRZDUG WKH RYHUDOO RXWORRN $GGLWLRQDOO\ ZH DUH PRUHFRQVWUXFWLYHRQ&32SULFHVGULYHQE\OLPLWHG&32SURGXFWLRQJURZWKZLWK LPSURYLQJ RYHUDOO GHPDQG VXSSRUWHG E\ % SURJUDP0RUHRYHU HDVLQJ PRQHWDU\ DQG PDFURSUXGHQWLDO SROLFLHV IURP %,VKRXOGDOVRKHOSVWLPXODWHFRQVXPHUV¶DSSHWLWHIRUDXWRVHFWRU 0DUJLQ LPSURYHPHQW$VRI4ZHVHHPDUJLQ LPSURYHPHQWDFURVV $VWUD¶V VXEVLGLDULHV $XWRPRWLYH PDQXIDFWXULQJ PDUJLQ'DLKDWVX VDZ DQ LPSURYHPHQW DVPDUJLQ UHFRYHUHG WR LQ4YVLQ+:HH[SHFWDXWRPDQXIDFWXULQJPDUJLQWRVWDELOL]H DW WKLV OHYHO LQ WKH QHDU-WR-PHGLXP WHUP 2Q WKH RWKHUKDQG8175¶VHDUQLQJVVKRXOGUHPDLQUHVLOLHQW&$*5)<(-)<)GHVSLWHWKHZHDNLQGXVWU\RXWORRNIURPPLQLQJVHFWRU:HH[SHFW0DUWDEHWRSRVWHDUQLQJVJURZWKLQ)<VXSSRUWHGE\KLJKHU $63 H[SLULQJ KHGJH SRVLWLRQZKLFKZLOO OLIW WKH JROG SULFHDVVXPSWLRQWR86'0HDQZKLOHZHH[SHFW$&67HDUQLQJVWRWXUQSRVLWLYHLQ)<DIWHUERRNLQJDORVVWKLV\HDU2QWRSRIWKDWZH H[SHFW &32SULFH WR VWDELOL]H DW 50WRQ LQ ZKLFKZLOOUHGXFHSUHVVXUHRQ$$/,¶VERWWRPOLQH
^ƚŽĐŬ/ŶĨŽƌŵĂƟŽŶ
ůŽŽŵďĞƌŐdŝĐŬĞƌ ^///:
ϱϮ-tĞĞŬ,ŝŐŚ ϴϱϱϬ
ϱϮ-tĞĞŬ>Žǁ ϲϮϱϬ
&zϮϬ&W ϭϯϰdž
&zϮϬ&Ws ϭϵdž
^ŚĂƌĞKƵƚƐƚĂŶĚŝŶŐ;DŶͿ ϰϬϰϴϯϲ
DĂƌŬĞƚĂƉ;/ZdŶͿ Ϯϳϳϯ
^ŚĂƌĞWƌŝĐĞWĞƌĨŽƌŵĂŶĐĞ
ƵƌƌĞŶƚWƌŝĐĞ ϲϴϱϬ
ϱϮ-tĞĞŬdĂƌŐĞƚWƌŝĐĞ ϳϴϬϬ
йŚĂŶŐĞ ϭϯϵй
ƵƚŽŵŽƟǀĞ^ĞĐƚŽƌ
WdƐƚƌĂ/ŶƚĞƌŶĂƟŽŶĂůdďŬ
+LJKOLJKWV,'5%Q ( ) ) )
5HYHQXH
*URVV3URILW
(%,7'$
JURZWK -
1HW3URILW
JURZWK -
(%,7'$0DUJLQ
1HW0DUJLQ
5HWXUQRQ$VVHW
5HWXUQRQ(TXLW\

ƵƚŽŵŽƟǀĞƐƚƌĂ/ŶƚĞƌŶĂƟŽŶĂů
,QFRPH6WDWHPHQW .H\$VVXPSWLRQV
%DODQFH6KHHW 5DWLR$QDO\VLV
( ) ) )
86','5
:6DOHV7KV8QLW
:6DOHV7KV8QLW
:0DUNHW6KDUH
:0DUNHW6KDUH
&RDO3ULFH0W
$YJ&RDO3ULFH0W
.RPDWVX6DOHV8QLW
3$0$3URG0Q7RQV
3$0$2%0Q7RQV
7703URG0Q7RQV
1HZ&RQWUDFW%Q
%XUQ5DWH
))%3URG7KV7RQV
))%<LHOG7RQV+D
&323URG7KV7RQV
([WUDFWLRQ5DWH
&326DOHV7KV7RQV
&32$63,'5NJ
,'57Q ( ) ) )
1HW5HYHQXH
-$XWRPRWLYH
-)LQDQFLDO -+HDY\(TXLSPHQW0LQLQJ&RQWUDFWLQJ
-$JULEXVLQHVV
&RVWRI5HYHQXH
-$XWRPRWLYH
-)LQDQFLDO -+HDY\(TXLSPHQW0LQLQJ&RQWUDFWLQJ
-$JULEXVLQHVV
*URVV3URILW
6HOOLQJ([SHQVHV
*$([SHQVHV
2SHUDWLQJ3URILW
(%,7'$
)LQDQFH,QFRPH
)LQDQFH&RVW 6KDUHRI3URILWRI$VVRFLDWHV
,QFRPH%HIRUH7D[([SHQVHV
1HW,QFRPH
( ) ) )
3URILWDELOLW\ 5HWXUQRQ$VVHW
5HWXUQRQ(TXLW\
*URVV0DUJLQ
2SHUDWLQJ0DUJLQ
(%,7'$0DUJLQ
1HW0DUJLQ
/LTXLGLW\ &XUUHQW5DWLR;
4XLFN5DWLR;
6ROYHQF\ 'HEW(TXLW\;
'HEW$VVHWV;
9DOXDWLRQV 3(;
3%9;
,'57Q ( ) ) )
&DVKDQG(TXLYDOHQWV
7UDGH5HFHLYDEOHV
)LQDQFLQJ5HFHLYDEOHV
2WKHU5HFHLYDEOHV
,QYHQWRULHV
7RWDO&$
1&5HFHLYDEOHV
,QYHVWPHQWV
3ODQWDWLRQV
0LQLQJ3URSHUWLHV
&RQFHVVLRQV
)L[HG$VVHWV
7RWDO$VVHWV
67%RUURZLQJV
/7%RUURZLQJV
$FFRXQW3D\DEOHV
7RWDO/LDELOLWLHV
7RWDO(TXLW\
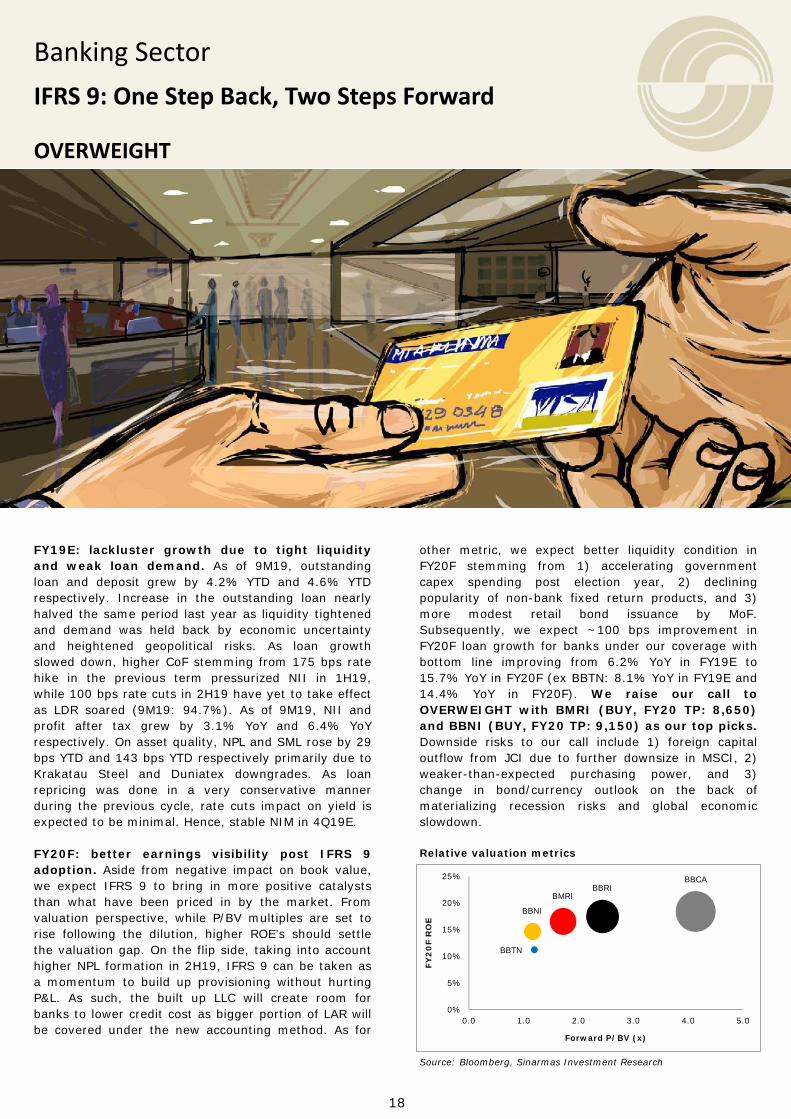
other metric, we expect better liquidity condition in FY20F stemming from 1) accelerating government capex spending post election year, 2) declining popularity of non-bank fixed return products, and 3) more modest retail bond issuance by MoF. Subsequently, we expect ~100 bps improvement in FY20F loan growth for banks under our coverage with bottom line improving from 6.2% YoY in FY19E to 15.7% YoY in FY20F (ex BBTN: 8.1% YoY in FY19E and 14.4% YoY in FY20F). We raise our call to OVERWEIGHT with BMRI (BUY, FY20 TP: 8,650) and BBNI (BUY, FY20 TP: 9,150) as our top picks. Downside risks to our call include 1) foreign capital outflow from JCI due to further downsize in MSCI, 2) weaker-than-expected purchasing power, and 3) change in bond/currency outlook on the back of materializing recession risks and global economic slowdown. Relative valuation metrics
FY19E: lackluster growth due to tight liquidity and weak loan demand. As of 9M19, outstanding loan and deposit grew by 4.2% YTD and 4.6% YTD respectively. Increase in the outstanding loan nearly halved the same period last year as liquidity tightened and demand was held back by economic uncertainty and heightened geopolitical risks. As loan growth slowed down, higher CoF stemming from 175 bps rate hike in the previous term pressurized NII in 1H19, while 100 bps rate cuts in 2H19 have yet to take effect as LDR soared (9M19: 94.7%). As of 9M19, NII and profit after tax grew by 3.1% YoY and 6.4% YoY respectively. On asset quality, NPL and SML rose by 29 bps YTD and 143 bps YTD respectively primarily due to Krakatau Steel and Duniatex downgrades. As loan repricing was done in a very conservative manner during the previous cycle, rate cuts impact on yield is expected to be minimal. Hence, stable NIM in 4Q19E. FY20F: better earnings visibility post IFRS 9 adoption. Aside from negative impact on book value, we expect IFRS 9 to bring in more positive catalysts than what have been priced in by the market. From valuation perspective, while P/BV multiples are set to rise following the dilution, higher ROE’s should settle the valuation gap. On the flip side, taking into account higher NPL formation in 2H19, IFRS 9 can be taken as a momentum to build up provisioning without hurting P&L. As such, the built up LLC will create room for banks to lower credit cost as bigger portion of LAR will be covered under the new accounting method. As for
18
Banking Sector
IFRS 9: One Step Back, Two Steps Forward
OVERWEIGHT
Source: Bloomberg, Sinarmas Investment Research
BMRIBBRI
BBCA
BBNI
BBTN
0%
5%
10%
15%
20%
25%
0.0 1.0 2.0 3.0 4.0 5.0
FY2
0F
RO
E
Forward P/BV (x)

Banking | Sector Outlook
Percentage of loans being financed by low cost deposits
BMRI (BUY, FY20 TP: 8,650) and BBNI (BUY, FY20 TP: 9,150) as our top picks. As we look beyond FY19, we find BMRI and BBNI to be good stock picks going into 2020 given the risk-reward associated with each bank. Aside from discounted valuations of 0.5 SD and 1.0 SD respectively, BMRI and BBNI offer clear earning visibility with comforting margin of error. Post IFRS 9, we expect CoC to decline by 50 bps YoY for BMRI (~15% of FY19E NPAT) and 37 bps YoY for BBNI (~15% of FY19E NPAT). Meanwhile, NII and NIM are likely to remain stable with mid-to-high single digit growth in FY20F supported by better loan demand as impact from monetary easing materializes and improving liquidity condition as competition from non-bank loosen.
Impact of IFRS 9 adoption
Minimal upside on NIM despite 100 bps 7DRRR cuts in 2H19. While OTC rates have been lowered by up to 50 bps for shorter tenor TD’s (1-6M), longer TD’s (12M), however, sees a little to no change across BUKU I-IV banks as liquidity has yet to ease. This paired with bigger third-party-fund contribution from institutions constrained banks’ ability to lower CoF. Thus, we expect 4Q19 NIM to give a better color for short- to medium-term NIM outlook as asset/liability growth consolidates in the quarter. In the meantime, we expect loan and deposit to grow at similar pace given that LDR and LFR are at the upper end of the spectrum. As for banks under our coverage, our model shows stable NIM outlook for BMRI, BBNI, and BBTN, while BBRI and BBCA may see slight margin deterioration (~20 bps vs our FY19E) on the back of new KUR scheme for BBRI and historical margin trend for BBCA during easing cycles. TD rate changes QoQ (bps)
Normalizing interest expense as liquidity eases. Banking interest expense in 9M19 soared by 24.9% YoY, much higher than the past 3-yr (FY16-18) average rise of 4.7% YoY. This was primarily caused by two things, 1) Big-4 banks grabbing TD market share aggressively from BUKU I-III to accommodate incoming loan demand, which is illustrated from the chart below as % of loans funded by CASA continued to drop as Big-4 banks dominate TD. 2) Pressure on CoF was amplified by the 175 bps 7DRRR hikes, which caused banks to raise TD rates even further. Onwards, we expect the trend to change course as tight liquidity calls for a more balanced growth between loan and deposit. Our model suggests interest expense to rise by 6.0%-8.8% in FY20F versus 16.5%-22.4% in FY19E for banks under our coverage.
19
Source: Bank Indonesia, Sinarmas Investment Research
Ticker Rating CP TP % Chg FY20F P/BV
BMRI BUY 7,375 8,650 17.3 2.0
BBRI NEUTRAL 4,280 4,540 6.1 2.6
BBCA ADD 31,800 35,675 12.2 4.6
BBNI BUY 7,650 9,150 19.6 1.4
BBTN NEUTRAL 2,170 2,300 6.0 1.3
Banking Sector
Ticker Equity (IDR Tn) BV Dilution (%)
BMRI 29.0 14.2
BBRI 8.0 3.9
BBCA 6.0 3.5
BBNI 12.5 10.3
BBTN 4.5 18.3
Source: Sinarmas Investment Research
IDR Time Deposit 1Q19 2Q19 3Q19
1 Month -13 -9 -38
3 Month +6 -9 -24
6 Month +30 -8 -15
12 Months +25 +16 +2
Source: Bank Indonesia, Sinarmas Investment Research
74 77 78 7874
72
46 4446
4745 46
58 5861 61
59 58
40
50
60
70
80
90
2015 2016 2017 2018 2019
Big-4 ex-Big-4 Industry

20
Share Price Performance
Current Price 7,375
52‐Week Target Price 8,650
% Change 17.3%
Banking Sector
PT Bank Mandiri Tbk.
Stock Informa on
Bloomberg Ticker BMRI IJ
52‐Week High 8,175
52‐Week Low 6,275
FY20F P/E 11.8x
FY20F P/BV 2.0x
Share Outstanding (Mn) 46,666.7
Market Cap. (IDR Tn) 344.2
FY19E: stable earnings growth backed by healthy NIM and prudent CoC. As of 10M19, total loan grew by 4.6% YoY (up 1.3% YTD), while customer deposit grew by 6.1% YoY (up 5.8% YTD). From liquidity perspective, LDR came down to 93.1% in 10M19 (dn 415 bps YTD, dn 131 bps YoY). To add, BMRI still has sizeable variable rate government bonds (yield: 5.8%) that will mature gradually until Jul-20 as liquidity buffer and can be used to support asset growth. As bank tries to avoid TD price war through other types of funding outside customer deposit, NIM is relatively stable compared to its peers. In the meantime, we expect no major downgrades in 4Q19 and credit cost should remain within management guidance of 1.5%-1.7% for FY19E (10M19: 1.4%). FY20F: an extension of FY19 with bottom line improvement stemming from lower credit cost. We expect FY20F growth rate to be similar to FY19E for BMRI with ~100 bps improvement driven by corporate segment. As for deposit collection, we expect stable CoF from FY19 as competition in TD pricing should further soften in FY20F catalyzed by 1) 100 bps 7DRRR cuts in 2H19 and 2) less competition from non-bank fixed return products as well as retail bonds. On profitability front, as NPL formation deteriorates and bank allocates required amount of provision to comply with IFRS 9, FY20F earning is expected to grow above industry rate benefiting from lower credit cost. Thus, we think the risk-reward for Bank Mandiri is attractive given the earning visibility and discounted valuation (-0.5 SD) at current market price. We reiterate our BUY rating on PT Bank Mandiri (Persero) Tbk (BMRI) with 52-week TP of IDR 8,650, implying 2.0x FY20F P/BV (17.3% upside potential). As for FY20F, we estimate BMRI’s NPAT at IDR 33.1tn (up 15.8% from our FY19E) with NIM, NPL, and credit cost at 538 bps (dn 5 bps YoY), 262 bps (dn 8 bps YoY), and 120 bps YoY (dn 50 bps YoY) respectively. Impact on equity from IFRS 9 adoption is estimated at IDR 29.0tn or equivalent to 14% BV dilution. Post IFRS 9, we expect credit cost to normalize at 120 bps baking in 1% new NPL formation and 120% coverage ratio.
Highlights (IDR Tn) 2018 2019E 2020F 2021F 2022F
Total Loans 799.6 855.5 941.1 1,032.6 1,133.1
Total Customer Deposits 840.9 894.5 988.0 1,095.2 1,208.8
Net Interest Income 54.6 59.1 62.7 67.2 73.8
Pre-provision Op. Profit 48.3 51.4 53.9 58.2 64.5
Net Income 25.0 28.5 33.1 35.6 39.5
Net Interest Margin (%) 5.4 5.4 5.4 5.4 5.4
Gross NPL (%) 2.8 2.7 2.6 2.5 2.5
Credit Cost (%) 1.9 1.7 1.2 1.2 1.2
Return on Equity (%) 14.6 15.0 16.5 16.9 16.6
Return on Assets (%) 2.2 2.4 2.6 2.5 2.6
BUY
‐
20,000
40,000
60,000
80,000
100,000
120,000
140,000
160,000
‐
1,000
2,000
3,000
4,000
5,000
6,000
7,000
8,000
9,000
Jan‐19 Feb‐19 Mar‐19 Apr‐19 May‐19 Jun‐19 Jul‐19 Aug‐19 Sep‐19 Oct‐19 Nov‐19 Dec‐19
Thousands
BMRI IJ Price Volume Graph
Volume BMRI

21
Income Statement Financial Ratios
Balance Sheet Loan Portfolio and NPL
Banking | Bank Mandiri
(IDR Tn) 2018 2019E 2020F 2021F 2022F
Interest Income 81.0 90.5 96.9 104.8 115.2
% change 11.8% 7.0% 8.2% 10.0%
Interest Expense 26.4 31.4 34.2 37.6 41.4
% change 19.2% 8.8% 10.0% 10.1%
Net Int. Income 54.6 59.1 62.7 67.2 73.8
% change 8.2% 6.0% 7.2% 9.9%
Other Op. Income 31.2 31.7 32.6 34.5 36.3
% change 1.4% 3.0% 5.7% 5.3%
Operating Expense 52.0 53.5 52.2 55.3 58.6
% change 3.0% -2.5% 6.0% 6.0%
PPOP 48.3 51.4 53.9 58.2 64.5
% change 6.3% 5.0% 8.0% 10.8%
Net Op. Income 33.9 37.3 43.1 46.4 51.5
% change 10.0% 15.7% 7.5% 11.1%
Pre-tax Income 33.9 37.2 43.1 46.4 51.5
% change 9.7% 15.8% 7.5% 11.1%
Net Income 25.0 28.5 33.1 35.6 39.5
% change 14.1% 15.8% 7.5% 11.1%
(IDR Tn) 2018 2019E 2020F 2021F 2022F
Cash 27.3 22.4 27.7 28.7 24.4
CA w/ Central Bank 59.9 52.1 51.0 53.6 56.3
CA w/ Other Banks 14.8 14.9 15.7 17.4 19.0
Interbank Placement 22.5 37.6 37.6 38.6 40.5
Total Loans - Net 767.8 822.1 875.3 963.2 1,059.8
Marketable Sec. 65.9 62.3 66.5 73.3 80.8
Government Bonds 114.3 142.4 152.0 167.6 184.8
Fixed Assets 38.4 40.4 42.2 43.9 45.4
Total Assets 1,202.3 1,290.5 1,379.7 1,517.3 1,666.3
Demand Deposits 200.5 213.5 239.2 267.9 294.6
Saving Deposits 338.6 350.5 382.0 420.2 462.2
Time Deposits 301.8 330.5 366.8 407.2 452.0
Total Deposits 840.9 894.5 988.0 1,095.2 1,208.8
Deposit from Others 16.9 18.4 19.5 21.4 23.5
Marketable Sec. 19.1 32.5 34.4 37.7 41.3
Fund Borrowings 51.7 54.1 56.7 59.4 62.3
Sub. Debts 0.7 0.7 0.7 0.7 0.7
Total Liabilities 1,017.3 1,082.1 1,175.2 1,285.9 1,404.8
Total Equity 185.0 208.4 204.5 231.4 261.6
(%) 2018 2019E 2020F 2021F 2022F
LDR 95.1 95.6 95.3 94.3 93.7
LFR 86.0 85.5 85.6 85.0 84.8
CASA 64.1 63.1 62.9 62.8 62.6
NIM 5.4 5.4 5.4 5.4 5.4
Avg. Loan Yield 9.5 9.5 9.4 9.4 9.4
Avg. CoF 2.6 2.9 2.8 2.8 2.8
Gross NPL 2.8 2.7 2.6 2.5 2.5
Credit Cost 1.9 1.7 1.2 1.2 1.2
Coverage Ratio 144.6 144.8 266.5 268.1 258.2
Cost to Income 69.8 69.5 66.7 66.7 66.0
Cost Efficiency 60.5 58.9 54.8 54.4 53.2
Return on Assets 2.2 2.4 2.6 2.5 2.6
Return on Equity 14.6 15.0 16.5 16.9 16.6
Profit Margin 31.9 32.6 35.3 35.1 35.4
Asset Turnover 7.0 7.3 7.3 7.2 7.2
Equity Multiplier (x) 6.6 6.3 6.5 6.6 6.5
PBV (x) 2.2 2.0 2.0 1.8 1.6
PE (x) 15.6 13.7 11.8 11.0 9.9
(%) 2018 2019E 2020F 2021F 2022F
Small 6.9 7.0 7.0 7.0 7.0
% NPL 2.8 1.9 1.9 1.9 1.9
Micro 12.5 13.9 13.9 13.9 13.9
% NPL 0.9 0.9 0.9 0.9 0.9
Consumer 10.7 10.5 11.3 11.3 11.3
% NPL 2.2 2.5 2.2 2.2 2.2
Commercial 17.4 16.6 15.7 15.7 15.7
% NPL 10.5 10.9 10.5 10.0 10.0
Corporate 39.7 39.2 39.2 39.2 39.2
% NPL 0.2 0.1 0.3 0.2 0.2
International 0.5 0.5 0.5 0.5 0.5
% NPL - - - - -
Subsidiaries 12.3 12.3 12.3 12.3 12.3
% NPL 2.5 2.9 2.9 2.9 2.9
Collectability 1 93.3 92.6 92.7 92.8 92.8
Collectability 2 3.9 4.7 4.7 4.7 4.7
Collectability 3-5 2.8 2.7 2.6 2.5 2.5

22
Share Price Performance
Current Price 4,280
52‐Week Target Price 4,540
% Change 6.1%
Banking Sector
PT Bank Rakyat Indonesia Tbk.
Stock Informa on
Bloomberg Ticker BBRI IJ
52‐Week High 4,730
52‐Week Low 3,520
FY20F P/E 15.1x
FY20F P/BV 2.6x
Share Outstanding (Mn) 123,345.8
Market Cap. (IDR Tn) 527.9
FY19E: inline performance though 4Q19 should see slower asset growth. As of 10M19, total loan portfolio grew by 8.7% YoY (up 5.8% YTD), whereas deposit grew by 6.1% YoY (up 50 bps YTD), causing LDR to rise to 94.3% (up 2.2% YoY, up 4.7% YTD). From micro segment, while deposit grew above industry rate (9.8% YoY vs 7.5% YoY), LDR rose to 107.0% in 9M19 as micro loans grew by 13.2% YoY during the period. Micro loans, however, are expected to slow down in 4Q19 as bank has fulfilled 95% of FY19 KUR quota by Oct-19. From asset quality perspective, we expect NPL to improve by 30 bps to 2.8% in 4Q19 following Krakatau Steel and Duniatex downgrades (63% and 100% LLC respectively). New KUR scheme may serve as headwinds for Micro and NIM. Government has decided to lower KUR lending rate for FY20 by 100 bps to 6%, while keeping interest subsidy unchanged at 10.5%/5.5%/14% for Micro/Retail/TKI KUR. Moreover, maximum ticket size for Micro KUR will be increased from IDR 25mn to IDR 50mn starting 2020. Higher credit limit for Micro KUR may pose a risk of cannibalization. The new asset yield from Micro KUR is at 6%+10.5%, whereas Kupedes’ asset yield is at 20%-22%. From ticket size perspective, while maximum credit limit for Kupedes is at IDR 250mn, average ticket size still stands at IDR 55mn, relatively close to Micro KUR maximum credit limit. Therefore, loan growth and NIM may get affected given the likelihood of shifting borrowers from Kupedes to KUR as it has 15% rate difference from borrowers’ point of view. We downgrade PT Bank Rakyat Indonesia (Persero) Tbk (BBRI) from ADD to NEUTRAL with 52-week TP of IDR 4,540, implying 2.6x FY20F P/BV (6.1% upside potential). As for FY20F, we forecast BBRI’s NPAT at IDR 37.0tn (up 8.7% from our FY19E) with NIM, NPL, and credit cost at 659 bps (dn 20 bps YoY), 278 bps (dn 2 bps YoY), and 180 bps (dn 50 bps YoY) respectively. Impact on equity from IFRS 9 adoption is estimated at IDR 8.0tn or equivalent to 4% BV dilution. Meanwhile, we expect credit cost to normalize at 180 bps post IFRS 9 taking into account new NPL formation and additional provisioning for secondary reserves and undisbursed loans.
NEUTRAL
Highlights (IDR Tn) 2018 2019E 2020F 2021F 2022F
Total Loans 840.2 932.6 1,035.2 1,158.0 1,296.5
Total Customer Deposits 944.3 999.3 1,118.4 1,266.5 1,424.7
Net Interest Income 77.7 81.0 83.7 91.1 100.4
Pre-provision Op. Profit 59.5 63.2 64.2 69.9 76.9
Net Income 32.4 34.1 37.0 40.0 43.7
Net Interest Margin (%) 7.1 6.8 6.6 6.6 6.6
Gross NPL (%) 2.1 2.8 2.8 2.7 2.6
Credit Cost (%) 2.3 2.3 1.8 1.8 1.8
Return on Equity (%) 18.4 17.5 17.5 17.3 17.1
Return on Assets (%) 2.7 2.6 2.6 2.6 2.5
‐
50,000
100,000
150,000
200,000
250,000
300,000
350,000
400,000
‐
500
1,000
1,500
2,000
2,500
3,000
3,500
4,000
4,500
5,000
Jan‐19 Feb‐19 Mar‐19 Apr‐19 May‐19 Jun‐19 Jul‐19 Aug‐19 Sep‐19 Oct‐19 Nov‐19 Dec‐19
Thousands
BBRI IJ Price Volume Graph
Volume BBRI

23
Banking | Bank Rakyat Indonesia
Income Statement Financial Ratios
Balance Sheet Loan Portfolio and NPL
(IDR Tn) 2018 2019E 2020F 2021F 2022F
Interest Income 111.6 120.5 126.5 138.2 152.4
% change 8.0% 5.0% 9.3% 10.3%
Interest Expense 33.9 39.5 42.7 47.1 52.0
% change 16.5% 8.2% 10.1% 10.4%
Net Int. Income 77.7 81.0 83.7 91.1 100.4
% change 4.2% 3.4% 8.8% 10.2%
Other Op. Income 24.4 26.8 28.5 30.5 32.2
% change 10.0% 6.2% 7.0% 5.7%
Operating Expense 60.3 65.0 65.7 71.5 77.8
% change 7.8% 1.1% 8.7% 8.9%
PPOP 59.5 63.2 64.2 69.9 76.9
% change 6.1% 1.6% 8.9% 10.0%
Net Op. Income 41.7 42.8 46.5 50.1 54.8
% change 2.5% 8.6% 7.9% 9.3%
Pre-tax Income 41.8 42.8 46.5 50.1 54.8
% change 2.4% 8.7% 7.9% 9.3%
Net Income 32.4 34.1 37.0 40.0 43.7
% change 5.3% 8.7% 7.9% 9.3%
(IDR Tn) 2018 2019E 2020F 2021F 2022F
Cash 27.4 13.1 28.5 42.3 48.1
CA w/ Central Bank 71.2 70.4 72.7 77.8 83.7
CA w/ Other Banks 12.7 15.0 15.8 16.6 17.4
Interbank Placement 87.0 74.0 77.7 81.5 85.6
Total Loans - Net 804.7 888.9 978.7 1,095.7 1,227.7
Marketable Sec. 184.3 175.1 170.7 170.7 170.7
Government Bonds 1.5 1.1 1.2 1.2 1.3
Fixed Assets 26.9 28.3 29.7 31.2 32.7
Total Assets 1,296.9 1,352.3 1,476.7 1,643.0 1,825.4
Demand Deposits 180.7 180.7 202.5 224.8 249.8
Saving Deposits 387.2 417.8 464.9 523.0 578.5
Time Deposits 376.4 400.9 451.0 518.6 596.4
Total Deposits 944.3 999.3 1,118.4 1,266.5 1,424.7
Deposit from Others 9.1 17.3 18.8 20.7 22.7
Marketable Sec. 37.4 19.9 22.3 24.0 25.8
Fund Borrowings 40.5 40.5 41.5 41.5 41.5
Sub. Debts 1.5 1.5 1.5 1.6 1.6
Total Liabilities 1,111.6 1,146.9 1,257.4 1,400.1 1,556.4
Total Equity 185.3 205.5 219.3 242.9 269.0
(%) 2018 2019E 2020F 2021F 2022F
LDR 89.0 93.3 92.6 91.4 91.0
LFR 81.4 86.5 86.1 85.5 85.5
CASA 60.1 59.9 59.7 59.0 58.1
NIM 7.1 6.8 6.6 6.6 6.6
Avg. Loan Yield 13.1 12.7 12.2 12.1 12.0
Avg. CoF 2.8 3.0 2.9 2.9 2.9
Gross NPL 2.1 2.8 2.8 2.7 2.6
Credit Cost 2.3 2.3 1.8 1.8 1.8
Coverage Ratio 197.3 159.9 188.6 193.0 198.6
Cost to Income 69.3 71.0 70.0 70.3 70.3
Cost Efficiency 59.1 60.3 58.6 58.8 58.7
Return on Assets 2.7 2.6 2.6 2.6 2.5
Return on Equity 18.4 17.5 17.5 17.3 17.1
Profit Margin 29.1 28.3 29.3 29.0 28.7
Asset Turnover 9.2 9.1 8.9 8.9 8.8
Equity Multiplier (x) 6.9 6.8 6.7 6.7 6.8
PBV (x) 3.1 2.8 2.6 2.3 2.1
PE (x) 17.3 16.4 15.1 14.0 12.8
(%) 2018 2019E 2020F 2021F 2022F
Micro 34.1 35.2 36.8 38.4 40.0
% NPL 1.0 1.3 1.3 1.3 1.3
Consumer 16.3 16.0 15.6 15.2 14.8
% NPL 1.0 1.4 1.4 1.4 1.4
Small Commercial 22.8 22.6 22.0 21.4 20.8
% NPL 3.1 3.7 4.0 4.0 4.0
Medium 2.3 2.6 2.5 2.5 2.4
% NPL 6.8 5.3 5.3 5.3 5.3
SOE 13.3 12.6 11.7 10.9 10.0
% NPL 1.1 1.0 1.5 1.5 1.5
Corporate Non-SOE 11.3 11.0 11.3 11.7 12.0
% NPL 5.5 10.5 9.5 8.5 7.5
Collectability 1 95.3 93.8 93.8 94.0 94.2
Collectability 2 2.5 3.4 3.4 3.3 3.2
Collectability 3-5 2.1 2.8 2.8 2.7 2.6

24
Share Price Performance
Current Price 31,800
52‐Week Target Price 35,675
% Change 12.2%
Banking Sector
PT Bank Central Asia Tbk.
Stock Informa on
Bloomberg Ticker BBCA IJ
52‐Week High 32,125
52‐Week Low 24,900
FY20F P/E 26.4x
FY20F P/BV 4.6x
Share Outstanding (Mn) 24,655.0
Market Cap. (IDR Tn) 784.0
FY19E: stellar performance supported by strong top line growth. As of 10M19, total loan portfolio grew by 8.4% YoY (up 5.3% YTD), whereas customer deposit grew by 10.2% YoY (up 7.8% YTD). Subsequently, LDR stood at 83.4% as of 10M19 (dn 1.4% YoY, dn 2.0% YTD) with healthy CASA ratio of 75.8%. Profitability wise, NII and profit after tax grew by 13.7% YoY and 13.9% YoY respectively. While asset quality remained robust with an NPL ratio of 1.6% (vs 2.7% industry) as of 3Q19, management raised bank-only credit cost from 101 bps in FY18 to 124 bps in 10M19 as they built provision for downgraded debtors that are previously in category 2 loans and have been in the watch list for awhile. NIM is expected to soften amid easing cycle. Margin-wise, BBCA is known to be one of the most resilient banks when it comes to key rate changes supported by ample liquidity and healthy CASA ratio. During easing cycle, however, NIM tends to soften due to bank’s asset and liability profile. Baking in 100 bps 7DRRR cuts in 2H19, we expect minor drop in NIM (~10 bps) in FY20F. Nonetheless, margin compression should remain minimal as we expect better loan demand in FY20F stemming from easing domestic political uncertainty and pick up in working capital as well as consumption loans. As for bank’s core performance, we expect similar trend in FY19E to be carried out in FY20F. We raise PT Bank Central Asia Tbk (BBCA) from NEUTRAL to ADD with 52-week TP of IDR 35,675, implying 4.6x FY20F P/BV (12.2% upside potential). As for FY20F, we forecast BBCA’s NPAT at IDR 33.3tn (up 16.9% YoY from our FY19E) with NIM, NPL, and credit cost at 657 bps (dn 12 bps YoY), 149 bps (dn 13 bps YoY), and 80 bps (dn 40 bps YoY) respectively. Impact on equity from IFRS 9 adoption is estimated at IDR 6.0tn or equivalent to 3% BV dilution. Simultaneously, we expect credit cost to normalize at 80 bps after the adjustment. While bank is traded at +2.0 SD, strong earning visibility with >18.0% ROE makes BBCA continuously attractive especially under low rate environment. Downside risk to our estimate includes IFRS 9 adjustment on non-loan earning assets and undisbursed loans.
ADD
Highlights (IDR Tn) 2018 2019E 2020F 2021F 2022F
Total Loans 543.0 597.3 657.0 735.1 821.3
Total Customer Deposits 635.0 695.4 763.5 845.6 939.4
Net Interest Income 45.3 50.6 54.3 60.1 67.2
Pre-provision Op. Profit 35.4 42.7 46.9 52.8 60.4
Net Income 25.9 28.5 33.3 37.5 43.0
Net Interest Margin (%) 6.5 6.7 6.6 6.6 6.6
Gross NPL (%) 1.4 1.6 1.5 1.5 1.5
Credit Cost (%) 0.5 1.2 0.8 0.8 0.8
Return on Equity (%) 18.3 17.6 18.4 18.5 18.6
Return on Assets (%) 3.3 3.3 3.5 3.6 3.7
‐
5,000
10,000
15,000
20,000
25,000
30,000
35,000
40,000
45,000
‐
5,000
10,000
15,000
20,000
25,000
30,000
35,000
Jan‐19 Feb‐19 Mar‐19 Apr‐19 May‐19 Jun‐19 Jul‐19 Aug‐19 Sep‐19 Oct‐19 Nov‐19 Dec‐19
Thousands
BBCA IJ Price Volume Graph
Volume bbca

25
Banking | Bank Central Asia
Income Statement Financial Ratios
Balance Sheet Loan Portfolio and NPL
(IDR Tn) 2018 2019E 2020F 2021F 2022F
Interest Income 56.8 64.1 68.9 76.2 85.0
% change 12.9% 7.5% 10.5% 11.6%
Interest Expense 11.5 13.4 14.6 16.1 17.8
% change 17.2% 8.5% 10.3% 10.9%
Net Int. Income 45.3 50.6 54.3 60.1 67.2
% change 11.8% 7.3% 10.6% 11.8%
Other Op. Income 17.7 21.9 24.9 27.6 30.7
% change 23.6% 13.4% 10.8% 11.4%
Operating Expense 30.3 36.8 37.3 40.4 43.7
% change 21.2% 1.5% 8.2% 8.1%
PPOP 35.4 42.7 46.9 52.8 60.4
% change 20.6% 9.9% 12.6% 14.4%
Net Op. Income 32.7 35.8 41.9 47.2 54.2
% change 9.5% 16.9% 12.8% 14.7%
Pre-tax Income 32.7 35.8 41.9 47.2 54.2
% change 9.5% 16.9% 12.8% 14.7%
Net Income 25.9 28.5 33.3 37.5 43.0
% change 10.1% 16.9% 12.8% 14.7%
(IDR Tn) 2018 2019E 2020F 2021F 2022F
Cash 21.7 29.1 32.7 35.3 41.7
CA w/ Central Bank 43.5 46.3 48.8 51.0 53.1
CA w/ Other Banks 8.5 11.0 11.6 12.2 12.7
Interbank Placement 31.7 34.4 36.1 38.5 40.8
Total Loans - Net 529.4 581.5 633.6 709.6 793.5
Marketable Sec. 109.1 118.0 132.8 146.5 163.2
Government Bonds - - - - -
Fixed Assets 19.3 20.3 21.3 22.4 23.5
Total Assets 824.8 908.9 996.1 1,105.4 1,231.0
Demand Deposits 166.8 182.3 204.3 230.7 260.3
Saving Deposits 316.8 339.0 367.7 404.2 443.2
Time Deposits 151.4 174.1 191.5 210.7 236.0
Total Deposits 635.0 695.4 763.5 845.6 939.4
Deposit from Others 6.5 8.5 9.8 11.1 12.7
Marketable Sec. 0.2 0.0 0.0 0.0 0.0
Fund Borrowings 2.1 3.0 3.1 3.3 3.5
Sub. Debts - - - - -
Total Liabilities 673.0 737.1 806.3 889.2 984.1
Total Equity 151.8 171.8 189.7 216.3 247.0
(%) 2018 2019E 2020F 2021F 2022F
LDR 85.5 85.9 86.1 86.9 87.4
LFR 84.3 84.5 84.6 85.5 86.0
CASA 76.2 75.0 74.9 75.1 74.9
NIM 6.5 6.7 6.5 6.5 6.5
Avg. Loan Yield 8.9 9.1 8.9 8.9 8.9
Avg. CoF 1.6 1.7 1.6 1.6 1.6
Gross NPL 1.4 1.6 1.5 1.5 1.5
Credit Cost 0.5 1.2 0.8 0.8 0.8
Coverage Ratio 178.7 163.6 239.5 232.9 227.1
Cost to Income 56.1 58.4 55.4 54.5 53.2
Cost Efficiency 48.1 50.7 47.1 46.1 44.6
Return on Assets 3.3 3.3 3.5 3.6 3.7
Return on Equity 18.3 17.6 18.4 18.5 18.6
Profit Margin 45.5 44.4 48.3 49.3 50.6
Asset Turnover 7.2 7.4 7.2 7.2 7.3
Equity Multiplier (x) 5.6 5.4 5.3 5.2 5.0
PBV (x) 5.8 5.1 4.6 4.1 3.6
PE (x) 34.0 30.9 26.4 23.4 20.4
(%) 2018 2019E 2020F 2021F 2022F
Corporate 39.7 41.0 41.0 41.0 41.0
% NPL 1.3 1.5 1.4 1.4 1.4
Commercial & SME 34.2 34.1 34.1 34.1 34.1
% NPL 1.6 1.9 1.6 1.6 1.6
Consumer 26.2 24.9 24.9 24.9 24.9
% NPL 1.2 1.5 1.5 1.5 1.5
Mortgage 16.3 16.1 16.1 16.1 16.1
Vehicle 7.4 6.5 6.5 6.5 6.5
Credit Card 2.4 2.3 2.3 2.3 2.3
Collectability 1 96.8 96.0 96.4 96.6 96.6
Collectability 2 1.8 2.3 2.1 1.9 1.9
Collectability 3-5 1.4 1.6 1.5 1.5 1.5
26
Share Price Performance
Current Price 7,650
52‐Week Target Price 9,150
% Change 19.6%
Banking Sector
PT Bank Negara Indonesia Tbk.
Stock Informa on
Bloomberg Ticker BBNI IJ
52‐Week High 10,250
52‐Week Low 6,650
FY20F P/E 9.4x
FY20F P/BV 1.4x
Share Outstanding (Mn) 18,648.7
Market Cap. (IDR Tn) 142.7
FY19E: slower growth capped by liquidity. As of 10M19, total outstanding loan grew by 12.5% YoY (up 7.9% YTD), while customer deposit increased by 3.2% YoY (up 1.7% YTD). Major drag on deposit collection came from saving deposit, which as of 10M19 dropped by 8.5% YTD (up 2.0% YoY) for the bank-only portion. Demand deposit, on the other hand, grew nicely at 4.2% YTD (up 12.4% YoY), keeping CASA ratio at 64.3% (up 222 bps YoY, dn 97 bps YTD). To date, LDR surged to 96.9% (up 800 bps YoY, up 811 bps YTD) as growth gap between loan and deposit widened. From asset quality perspective, we expect NPL to stay below 200 bps in 4Q19 following Krakatau Steel and Duniatex downgrades (26% LLC for both debtors). FY20F: better earning visibility on the back of stabilizing NIM and lower credit cost. Previously, management’s growth focus tilted more toward asset growth (lending) than it did to deposit, causing customer profile to be less sticky and price sensitive. Going forward, management aims to introduce more retail banking products in an effort to grow CASA deposit. Meanwhile, as one of the largest payroll banks, management believes that BBNI needs to work on retaining payrolls from fleeing to other transactional banks. On profitability front, as NPL formation deteriorates and higher LLC is allocated amid IFRS 9 adoption, we view FY20F earning to grow above industry level stemmed by stable and lower credit cost. With that being said, we think BBNI should outperform its peers given the earning visibility and discounted valuation (-1.0 SD). We raise our rating for PT Bank Negara Indonesia (Persero) Tbk (BBNI) from ADD to BUY with 52-week TP of IDR 9,150, implying 1.4x FY20F P/BV (19.6% upside potential). As for FY20F, we forecast BBNI’s NPAT at IDR 18.2tn (up 20.1% YoY from our FY19E) with NIM, NPL, and credit cost at 507 bps (up 13 bps YoY), 207 bps (up 21 bps YoY), and 120 bps (dn 37 bps YoY) respectively. Impact on equity from IFRS 9 adoption is estimated at IDR 12.5tn or equivalent to 10% BV dilution. Post IFRS 9, we expect credit cost to normalize at 120 bps baking in 1% new NPL formation and 120% coverage ratio.
BUY
Highlights (IDR Tn) 2018 2019E 2020F 2021F 2022F
Total Loans 512.8 569.2 637.5 719.3 812.7
Total Customer Deposits 578.8 594.6 661.4 751.1 853.1
Net Interest Income 35.4 35.6 38.8 42.9 48.7
Pre-provision Op. Profit 27.0 27.5 30.1 33.9 39.0
Net Income 15.0 15.1 18.2 20.5 23.7
Net Interest Margin (%) 5.3 4.9 5.1 5.1 5.2
Gross NPL (%) 2.0 1.9 2.1 2.0 2.0
Credit Cost (%) 1.5 1.6 1.2 1.2 1.2
Return on Equity (%) 14.3 13.0 14.7 15.4 15.8
Return on Assets (%) 2.0 1.8 2.1 2.2 2.2
‐
20,000
40,000
60,000
80,000
100,000
120,000
‐
2,000
4,000
6,000
8,000
10,000
12,000
Jan‐19 Feb‐19 Mar‐19 Apr‐19 May‐19 Jun‐19 Jul‐19 Aug‐19 Sep‐19 Oct‐19 Nov‐19 Dec‐19
Thousands
BBNI IJ Price Volume Graph
Volume BBNI
27
Banking | Bank Negara Indonesia
Income Statement Financial Ratios
Balance Sheet Loan Portfolio and NPL
(IDR Tn) 2018 2019E 2020F 2021F 2022F
Interest Income 54.1 57.6 62.7 68.7 76.9
% change 6.4% 8.9% 9.5% 11.9%
Interest Expense 18.7 22.0 23.9 25.8 28.2
% change 17.8% 8.5% 8.2% 9.0%
Net Int. Income 35.4 35.6 38.8 42.9 48.7
% change 0.3% 9.2% 10.3% 13.6%
Other Op. Income 17.6 18.9 20.4 22.4 24.6
% change 7.2% 8.2% 9.9% 9.8%
Operating Expense 33.5 35.4 36.5 39.6 43.5
% change 5.8% 3.0% 8.6% 9.9%
PPOP 27.0 27.5 30.1 33.9 39.0
% change 2.0% 9.1% 12.7% 15.2%
Net Op. Income 19.6 19.1 22.8 25.7 29.8
% change -2.8% 19.7% 12.7% 15.9%
Pre-tax Income 19.8 19.0 22.8 25.7 29.8
% change -4.2% 20.1% 12.7% 15.9%
Net Income 15.0 15.1 18.2 20.5 23.7
% change 0.7% 20.1% 12.7% 15.9%
(IDR Tn) 2018 2019E 2020F 2021F 2022F
Cash 14.0 8.9 12.2 17.0 25.9
CA w/ Central Bank 35.6 35.6 36.9 38.8 40.4
CA w/ Other Banks 13.1 13.1 13.6 14.3 14.9
Interbank Placement 39.3 23.6 24.7 26.4 28.1
Total Loans - Net 497.9 552.9 606.7 686.2 777.0
Marketable Sec. 32.0 28.8 28.8 28.8 28.8
Government Bonds 86.8 82.5 86.5 92.1 98.2
Fixed Assets 26.1 26.1 26.1 27.4 28.8
Total Assets 808.6 837.1 904.6 1,008.4 1,130.3
Demand Deposits 169.3 189.2 212.8 244.3 279.2
Saving Deposits 206.1 206.1 229.0 254.3 286.1
Time Deposits 203.4 199.4 219.6 252.5 287.9
Total Deposits 578.8 594.6 661.4 751.1 853.1
Deposit from Others 14.2 14.9 16.2 17.9 19.7
Marketable Sec. 3.0 3.0 3.0 3.0 3.0
Fund Borrowings 52.0 46.8 50.8 55.9 61.6
Sub. Debts - - - - -
Total Liabilities 698.2 713.5 779.1 866.6 969.6
Total Equity 110.4 123.6 125.5 141.8 160.8
(%) 2018 2019E 2020F 2021F 2022F
LDR 88.6 95.7 96.4 95.8 95.3
LFR 79.1 86.3 87.2 86.9 86.7
CASA 64.8 66.5 66.8 66.4 66.3
NIM 5.3 4.9 5.1 5.1 5.2
Avg. Loan Yield 10.1 9.7 9.7 9.7 9.7
Avg. CoF 2.7 3.1 3.2 3.1 3.0
Gross NPL 2.0 1.9 2.1 2.0 2.0
Credit Cost 1.5 1.6 1.2 1.2 1.2
Coverage Ratio 148.3 153.7 233.3 227.2 221.7
Cost to Income 72.7 75.1 72.6 71.8 70.6
Cost Efficiency 63.1 65.0 61.5 60.6 59.3
Return on Assets 2.0 1.8 2.1 2.2 2.2
Return on Equity 14.3 13.0 14.7 15.4 15.8
Profit Margin 27.9 26.4 29.1 29.9 31.0
Asset Turnover 7.1 7.0 7.2 7.2 7.2
Equity Multiplier (x) 7.2 7.0 7.0 7.2 7.1
PBV (x) 1.6 1.4 1.4 1.2 1.1
PE (x) 11.3 11.2 9.4 8.3 7.2
(%) 2018 2019E 2020F 2021F 2022F
Corporate 29.6 32.4 32.1 31.8 31.5
% NPL 1.7 1.4 1.6 1.5 1.4
SOE 21.6 19.8 19.0 18.2 17.4
% NPL 0.0 0.0 0.0 0.0 0.0
Medium 14.6 13.4 13.4 13.4 13.4
% NPL 2.6 3.9 4.4 4.4 4.4
Small 12.9 13.4 14.0 14.6 15.2
% NPL 1.6 2.2 2.4 2.4 2.4
Consumer 15.5 15.0 15.5 16.0 16.5
% NPL 2.1 2.1 2.1 2.1 2.1
Subsidiaries 5.8 6.0 6.0 6.0 6.0
% NPL - - - - -
Collectability 1 94.1 94.0 94.0 94.2 94.2
Collectability 2 3.9 4.1 3.9 3.8 3.8
Collectability 3-5 2.0 1.9 2.1 2.0 2.0
28
Share Price Performance
Current Price 2,170
52‐Week Target Price 2,300
% Change 6.0%
Banking Sector
PT Bank Tabungan Negara Tbk.
Stock Informa on
Bloomberg Ticker BBTN IJ
52‐Week High 2,860
52‐Week Low 1,780
FY20F P/E 10.8x
FY20F P/BV 1.3x
Share Outstanding (Mn) 10,590.0
Market Cap. (IDR Tn) 23.0
FY19E: a year of consolidation. As of 10M19, bank-only loan portfolio grew by 13.9% YoY (up 7.7% YTD), whereas customer deposit grew by 15.4% YoY (dn 2.9% YTD). As a result, LDR declined by 1.5% on a YoY basis to 113.1%, but increased by 11.1% on a YTD basis. On asset quality, NPL came down to 3.2% in 10M19 (9M19: 3.5%) and is at the upper range of management guidance of 3.1%-3.2% for FY19E. As a move towards IFRS 9, management aims to increase LLC above 70% by 2019 and 130% by 2020. Accordingly, credit cost stood at 128 bps as of 10M19 and is expected to reach 135 bps by year end. To add, asset growth is expected to slow down in 4Q19 as bank almost fulfilled One Million Housing program quota for this year (IDR 1.5tn remaining) and capital constrain due to postponed rights issue plan. As bank consolidates, management guided IDR 1.12tn NPAT (dn 60% YoY). FY20F: limited asset growth due to liquidity scarcity in the balance sheet. As bank’s plan for capital injection has been put on hold, management expects a modest 5%-7% loan growth in FY20F (from 17.1% FY15-19E CAGR) and 7%-9% YoY deposit growth. In the meantime, new management plans to enhance its retail banking business in order to get cheaper deposit. At current, aside from 42.9% CASA ratio (industry: 55.4%), 80% of bank’s TD came from institutions with higher CoF profile. As bank relies more on retail, CoF and NIM should be more stable going forward. Simultaneously, new management also guided that short-term focus will be on asset quality rather than asset growth. We reiterate our NEUTRAL call on PT Bank Tabungan Negara (Persero) Tbk (BBTN) with 52-week TP of IDR 2,300, implying 1.3x FY20F P/BV (6.0% upside potential). As for FY20F, we forecast BBTN’s NPAT at IDR 2.6tn (up 126.7% from our FY19E and ~20% lower than management guidance of IDR 3.0-3.5tn). Meanwhile, we expect FY20F NIM, NPL, and credit cost at 332 bps (up 4 bps YoY), 340 bps (up 9 bps YoY), and 90 bps (dn 45 bps YoY) respectively. Impact on equity from IFRS 9 adoption is estimated at IDR 4.5tn or equivalent to 18% BV dilution. Post IFRS 9, we expect credit cost to normalize at 80 bps to 90 bps.
NEUTRAL
Highlights (IDR Tn) 2018 2019E 2020F 2021F 2022F
Total Loans 237.8 261.5 281.1 314.9 353.2
Total Customer Deposits 229.8 250.8 269.3 300.6 340.0
Net Interest Income 10.1 9.6 10.5 11.4 12.7
Pre-provision Op. Profit 5.3 4.9 5.8 6.6 7.8
Net Income 2.8 1.2 2.6 3.2 3.8
Net Interest Margin (%) 4.0 3.3 3.3 3.4 3.4
Gross NPL (%) 2.9 3.3 3.4 3.1 2.9
Credit Cost (%) 0.8 1.4 0.9 0.9 0.9
Return on Equity (%) 12.3 4.8 11.2 12.7 13.3
Return on Assets (%) 1.0 0.4 0.8 0.9 0.9
‐
20,000
40,000
60,000
80,000
100,000
120,000
‐
500
1,000
1,500
2,000
2,500
3,000
Jan‐19 Feb‐19 Mar‐19 Apr‐19 May‐19 Jun‐19 Jul‐19 Aug‐19 Sep‐19 Oct‐19 Nov‐19 Dec‐19
Thousands
BBTN IJ Price Volume Graph
Volume BBTN

29
Banking | Bank Tabungan Negara
Income Statement Financial Ratios
Balance Sheet Loan Portfolio and NPL
(IDR Tn) 2018 2019E 2020F 2021F 2022F
Interest Income 22.9 25.2 27.1 29.1 32.4
% change 10.5% 7.2% 7.7% 11.0%
Interest Expense 12.8 15.6 16.6 17.7 19.7
% change 22.4% 6.0% 6.9% 11.1%
Net Int. Income 10.1 9.6 10.5 11.4 12.7
% change -4.7% 9.2% 9.0% 10.9%
Other Op. Income 2.1 2.2 2.4 2.5 2.7
% change 5.8% 7.9% 7.4% 6.5%
Operating Expense 8.6 10.3 9.5 10.0 10.6
% change 20.5% -7.5% 5.1% 5.8%
PPOP 5.3 4.9 5.8 6.6 7.8
% change -8.4% 18.7% 15.1% 17.5%
Net Op. Income 3.6 1.5 3.3 4.0 4.8
% change -58.5% 123.2% 18.9% 21.1%
Pre-tax Income 3.6 1.5 3.3 4.0 4.8
% change -59.4% 126.7% 18.9% 21.1%
Net Income 2.8 1.2 2.6 3.2 3.8
% change -58.4% 126.7% 18.9% 21.1%
(IDR Tn) 2018 2019E 2020F 2021F 2022F
Cash 1.2 1.8 2.2 1.7 3.0
CA w/ Central Bank 15.4 15.4 15.8 17.4 18.9
CA w/ Other Banks 1.6 1.1 1.1 1.3 1.4
Interbank Placement 26.5 26.0 26.0 28.0 29.4
Total Loans - Net 234.5 256.0 269.6 302.5 339.8
Marketable Sec. 5.8 6.8 7.2 7.5 7.9
Government Bonds 9.4 11.4 12.3 13.3 15.0
Fixed Assets 5.0 5.2 5.5 5.7 6.0
Total Assets 306.4 331.9 349.3 387.2 432.8
Demand Deposits 58.0 59.5 64.6 74.2 85.4
Saving Deposits 41.9 41.9 47.1 53.0 59.6
Time Deposits 129.9 149.4 157.6 173.4 195.0
Total Deposits 229.8 250.8 269.3 300.6 340.0
Deposit from Others 3.0 6.0 6.0 6.0 6.0
Marketable Sec. 20.6 20.8 21.0 21.1 21.3
Fund Borrowings 15.5 17.8 20.5 23.6 27.1
Sub. Debts - - - - -
Total Liabilities 282.6 307.3 326.7 360.1 402.5
Total Equity 23.8 24.6 22.6 27.1 30.3
(%) 2018 2019E 2020F 2021F 2022F
LDR 103.4 104.3 104.4 104.8 103.9
LFR 88.1 88.1 88.3 89.1 89.0
CASA 43.5 40.4 41.5 42.3 42.6
NIM 4.0 3.3 3.3 3.4 3.4
Avg. Loan Yield 10.2 9.9 9.7 9.7 9.7
Avg. CoF 4.6 4.9 4.8 4.6 4.6
Gross NPL 2.9 3.3 3.4 3.1 2.9
Credit Cost 0.8 1.4 0.9 0.9 0.9
Coverage Ratio 48.4 63.4 120.4 128.1 130.8
Cost to Income 85.6 94.6 88.7 87.5 86.3
Cost Efficiency 70.4 87.4 74.2 71.7 68.9
Return on Assets 1.0 0.4 0.8 0.9 0.9
Return on Equity 12.3 4.8 11.2 12.7 13.3
Profit Margin 12.3 4.6 9.8 10.8 11.8
Asset Turnover 8.0 7.9 7.9 7.9 7.9
Equity Multiplier (x) 12.5 13.2 14.4 14.8 14.3
PBV (x) 1.0 1.0 1.3 1.1 0.9
PE (x) 8.7 20.8 10.8 9.1 7.5
(%) 2018 2019E 2020F 2021F 2022F
Housing 89.6 90.0 90.0 90.0 90.0
% NPL 2.5 3.1 3.1 2.8 2.6
Consumer 2.4 2.1 1.8 1.8 1.8
% NPL 1.3 2.4 2.4 2.2 2.0
Commercial 8.0 8.0 8.2 8.2 8.2
% NPL 7.5 6.5 6.5 6.0 6.0
Subsidized Mortgage 41.1 43.5 43.5 43.5 43.5
% NPL 0.8 0.9 0.9 0.8 0.8
Non-sub Mortgage 32.7 32.0 32.0 32.0 32.0
% NPL 2.8 3.6 4.0 3.6 3.4
Other Housing Loans 3.5 3.2 3.2 3.2 3.2
% NPL 3.6 4.3 4.3 4.0 4.0
Construction 12.3 11.3 11.3 11.3 11.3
% NPL 7.1 9.4 9.0 8.0 7.0
Collectability 1 89.5 86.2 87.1 88.5 88.7
Collectability 2 7.7 10.4 9.4 8.4 8.4
Collectability 3-5 2.9 3.3 3.4 3.1 2.9

ĞŵĞŶƚ^ĞĐƚŽƌ ,ĞĂůƚŚŝĞƌŶǀŝƌŽŶŵĞŶƚWĂǀĞƐtĂLJĨŽƌZĞĐŽǀĞƌLJ
KsZt/',d
IRU VRPH QRWDEOH SURMHFWV ZLWKLQ WKH SLSHOLQH IRU-RNRZL¶VQGURXQGLQFOXGLQJ0573KDVH-,,DQG-DNDUWD-%DQGXQJ +65 :H EHOLHYH WKDW WKHVH XSFRPLQJFRQVWUXFWLRQDFWLYLWLHVZRXOGEHDEOHWRUHVWRUHFHPHQWGHPDQG SDUWLFXODUO\ EXON VDOHV ZKLFK FXUUHQWO\DFFRXQWHGIRUaRIWRWDOGRPHVWLFFHPHQWVDOHVSRWHQWLDO LPSURYHPHQW LQ SURSHUW\ VDOHV DV ZHDZDLWIRUWKHLQFHQWLYHVIURPILVFDODQGPRQHWDU\SROLFLHV WR WUDQVODWH LQWR UHFRYHU\ LQ GHPDQGWRZDUGV SURSHUW\ ,Q %, KDV FXW EHQFKPDUNUDWH'555E\ESVDQGUHOD[HG/79UDWLR+HQFHWKHVHPHDVXUHVRSHQURRPVIRUORZHUPRUWJDJHUDWHLQ :H H[SHFW WKDW WKH ORDQ UHOD[DWLRQ DQG ORZHUFRVW RI PRUWJDJH ZRXOG HQFRXUDJH PRUH KRXVLQJGHPDQG IURP HQG-XVHU EX\HUV ZKLFK KDYH EHHQGRPLQDWLQJ SURSHUW\ VDOHV IRU WKH SDVW IHZ \HDUV DQGSRVLWLYHO\LPSDFWEDJFHPHQWVDOHVDVDUHVXOW
RYHUYLHZZDVDIDYRUDEOH\HDUIRUFHPHQWFRPSDQLHV DV ERWK OHDGLQJ SOD\HUV PDQDJHG WR UDLVH$63VZKLOHLQSXWSULFHVZHUHPXFKORZHUGXHWRZHDNHURLO DQG FRDO SULFHV $V D UHVXOW FHPHQW FRPSDQLHVUHFRUGHG EHWWHU SURILWDELOLW\ ILJXUHV ZKHUH JURVVPDUJLQUHERXQGHGIURPDODFNOXVWHUWRIRU,173DQGIRU60*5DVRI02QWKHIOLSVLGHWKH LQGXVWU\ IDFHGDPXWHGVDOHVJURZWKDVHYLGHQFHGWKURXJK 0 GRPHVWLF VDOHV YROXPH ZKLFK VOLJKWO\GURSSHG E\ <R< FDXVHG E\ PRGHVW SURSHUW\VDOHV ZKLOH WKH RFFXUUHQFH RI SUHVLGHQWLDO DQGOHJLVODWLYHHOHFWLRQVSXWVRPHLQIUDVWUXFWXUHSURMHFWVRQKROG XQWLO 0 - <R< 7KH JURZWK UHDGLQJVKRZHYHU KDYH VLJQDOHG UHFRYHU\ VLQFH WKH IRUWKTXDUWHU DV SURMHFWV VWDUWHG WR UHVXPH :HVW -DYD<RJ\DNDUWD DQG (DVWHUQ ,QGRQHVLD DUH DPRQJ WKRVHUHFRUGLQJ WKH KLJKHVW GHPDQG JURZWK 7KH \HDU ZDVDOVRPDUNHGE\DPDMRUDFTXLVLWLRQRI+ROFLP,QGRQHVLD60&% E\ 60*5 ZKLFK OHG WR IXUWKHU GRPLQDQFH DVWKHFRXQWU\¶VOHDGLQJFHPHQWFRPSDQLHV ([SHFWLQJ XSWLFN LQ WKH GHPDQG JURZWK +HDGLQJLQWR ZH DVVXPH WKDW GRPHVWLF VDOHV YROXPHZRXOG EH JURZLQJ E\ <R< DV ZH DUH VHHLQJ WKDWVDOHVJURZWKKDYHEHHQERWWRPLQJDQGVKRXOGVWDUWWRSLFN XS QH[W \HDU JLYHQ UHVXPSWLRQ RIFRQVWUXFWLRQ SURMHFWV H[HFXWLRQ VXSSRUWHG E\JRYHUQPHQW¶V FRQWLQXRXV IRFXV RQ LQIUDVWUXFWXUHGHYHORSPHQW :H H[SHFW EXON FHPHQW VDOHV WR WXUQSRVLWLYHLQDVZHDUHHQWHULQJDVHFRQGSKDVHRIPDVVLYH LQIUD GHYHORSPHQW $3%1 VKRZHG LQIUDEXGJHW UHDFKHG ,'5 WQ <R< GHVLJQDWHG
6RXUFH&RPSDQ\GDWD6LQDUPDV,QYHVWPHQW5HVHDUFK
%DJDQGEXONFHPHQWVDOHV
75% 74%73%
25% 26% 27%
6%
3%
0%
10% 10%
-1%
FY17 FY18 Jan-19 Feb-19 Mar-19 Apr-19 May-19 Jun-19 Jul-19 Aug-19 Sep-19 Oct-19 Nov-19 11M19
Bag (Sales Proportion) Bulk (Sales Proportion) Bag (YoY Growth) Bulk (YoY Growth)
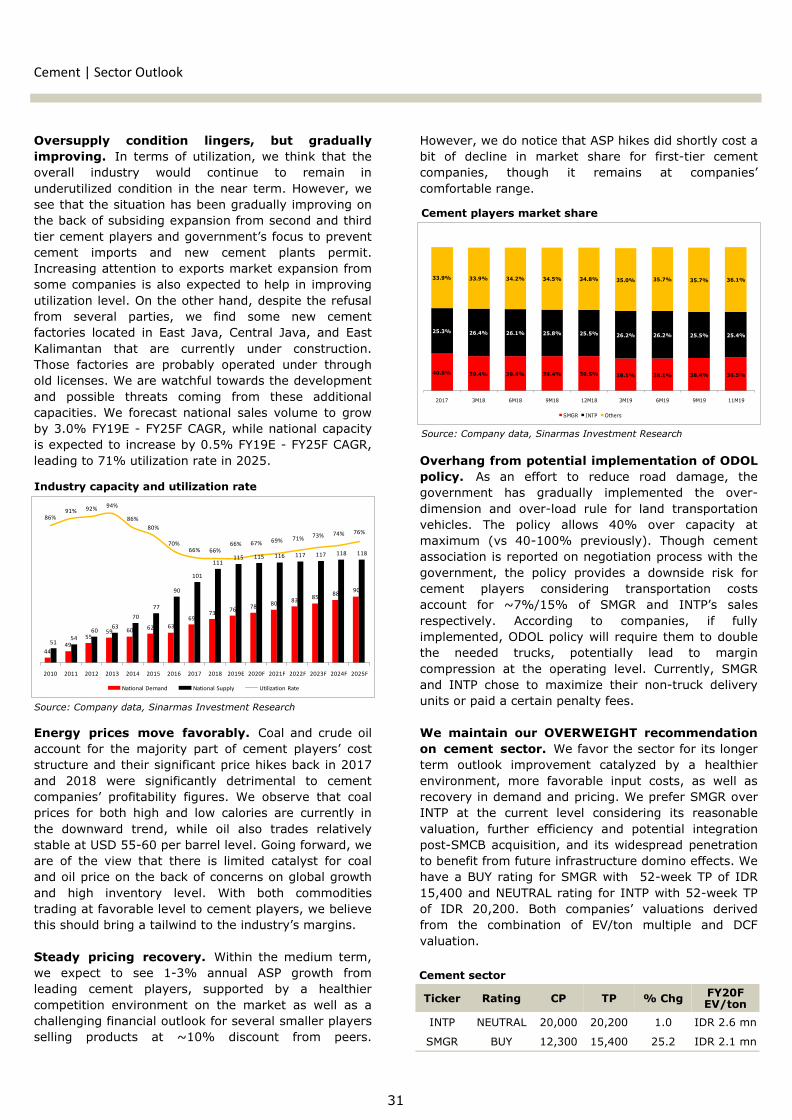
ĞŵĞŶƚ^ĞĐƚŽƌKƵƚůŽŽŬ
+RZHYHUZHGRQRWLFHWKDW$63KLNHVGLGVKRUWO\FRVWDELW RI GHFOLQH LQ PDUNHW VKDUH IRU ILUVW-WLHU FHPHQWFRPSDQLHV WKRXJK LW UHPDLQV DW FRPSDQLHV¶FRPIRUWDEOHUDQJH
2YHUKDQJIURPSRWHQWLDOLPSOHPHQWDWLRQRI2'2/SROLF\ $V DQ HIIRUW WR UHGXFH URDG GDPDJH WKHJRYHUQPHQW KDV JUDGXDOO\ LPSOHPHQWHG WKH RYHU-GLPHQVLRQ DQG RYHU-ORDG UXOH IRU ODQG WUDQVSRUWDWLRQYHKLFOHV 7KH SROLF\ DOORZV RYHU FDSDFLW\ DWPD[LPXP YV - SUHYLRXVO\ 7KRXJK FHPHQWDVVRFLDWLRQLVUHSRUWHGRQQHJRWLDWLRQSURFHVVZLWKWKHJRYHUQPHQW WKH SROLF\ SURYLGHV D GRZQVLGH ULVN IRUFHPHQW SOD\HUV FRQVLGHULQJ WUDQVSRUWDWLRQ FRVWVDFFRXQW IRU a RI 60*5 DQG ,173¶V VDOHVUHVSHFWLYHO\ $FFRUGLQJ WR FRPSDQLHV LI IXOO\LPSOHPHQWHG2'2/SROLF\ZLOO UHTXLUHWKHPWRGRXEOHWKH QHHGHG WUXFNV SRWHQWLDOO\ OHDG WR PDUJLQFRPSUHVVLRQ DW WKH RSHUDWLQJ OHYHO &XUUHQWO\ 60*5DQG ,173 FKRVH WR PD[LPL]H WKHLU QRQ-WUXFN GHOLYHU\XQLWVRUSDLGDFHUWDLQSHQDOW\IHHV :HPDLQWDLQ RXU 29(5:(,*+7 UHFRPPHQGDWLRQRQ FHPHQW VHFWRU:HIDYRUWKHVHFWRUIRULWVORQJHUWHUP RXWORRN LPSURYHPHQW FDWDO\]HG E\ D KHDOWKLHUHQYLURQPHQW PRUH IDYRUDEOH LQSXW FRVWV DV ZHOO DVUHFRYHU\LQGHPDQGDQGSULFLQJ:HSUHIHU60*5RYHU,173 DW WKH FXUUHQW OHYHO FRQVLGHULQJ LWV UHDVRQDEOHYDOXDWLRQ IXUWKHU HIILFLHQF\ DQG SRWHQWLDO LQWHJUDWLRQSRVW-60&%DFTXLVLWLRQDQG LWVZLGHVSUHDGSHQHWUDWLRQWREHQHILWIURPIXWXUHLQIUDVWUXFWXUHGRPLQRHIIHFWV:HKDYHD%8<UDWLQJ IRU60*5ZLWK -ZHHN73RI ,'5DQG1(875$/UDWLQJIRU,173ZLWK-ZHHN73RI ,'5 %RWK FRPSDQLHV¶ YDOXDWLRQV GHULYHGIURP WKH FRPELQDWLRQ RI (9WRQ PXOWLSOH DQG '&)YDOXDWLRQ
2YHUVXSSO\ FRQGLWLRQ OLQJHUV EXW JUDGXDOO\LPSURYLQJ ,Q WHUPV RI XWLOL]DWLRQZH WKLQN WKDW WKHRYHUDOO LQGXVWU\ ZRXOG FRQWLQXH WR UHPDLQ LQXQGHUXWLOL]HGFRQGLWLRQ LQ WKHQHDU WHUP+RZHYHUZHVHHWKDWWKHVLWXDWLRQKDVEHHQJUDGXDOO\LPSURYLQJRQWKHEDFNRIVXEVLGLQJH[SDQVLRQIURPVHFRQGDQGWKLUGWLHUFHPHQWSOD\HUVDQGJRYHUQPHQW¶VIRFXVWRSUHYHQWFHPHQW LPSRUWV DQG QHZ FHPHQW SODQWV SHUPLW,QFUHDVLQJDWWHQWLRQWRH[SRUWVPDUNHWH[SDQVLRQIURPVRPHFRPSDQLHV LVDOVRH[SHFWHGWRKHOS LQ LPSURYLQJXWLOL]DWLRQOHYHO2QWKHRWKHUKDQGGHVSLWHWKHUHIXVDOIURP VHYHUDO SDUWLHV ZH ILQG VRPH QHZ FHPHQWIDFWRULHV ORFDWHG LQ (DVW -DYD &HQWUDO -DYD DQG (DVW.DOLPDQWDQ WKDW DUH FXUUHQWO\ XQGHU FRQVWUXFWLRQ7KRVH IDFWRULHV DUH SUREDEO\ RSHUDWHG XQGHU WKURXJKROGOLFHQVHV:HDUHZDWFKIXOWRZDUGVWKHGHYHORSPHQWDQG SRVVLEOH WKUHDWV FRPLQJ IURP WKHVH DGGLWLRQDOFDSDFLWLHV:H IRUHFDVW QDWLRQDO VDOHV YROXPH WR JURZE\)<(-)<)&$*5ZKLOHQDWLRQDOFDSDFLW\LVH[SHFWHGWRLQFUHDVHE\)<(-)<)&$*5OHDGLQJWRXWLOL]DWLRQUDWHLQ
(QHUJ\ SULFHV PRYH IDYRUDEO\ &RDODQGFUXGHRLODFFRXQW IRU WKHPDMRULW\ SDUW RI FHPHQW SOD\HUV¶ FRVWVWUXFWXUHDQGWKHLUVLJQLILFDQWSULFHKLNHVEDFNLQDQG ZHUH VLJQLILFDQWO\ GHWULPHQWDO WR FHPHQWFRPSDQLHV¶ SURILWDELOLW\ ILJXUHV :H REVHUYH WKDW FRDOSULFHV IRU ERWK KLJK DQG ORZ FDORULHV DUH FXUUHQWO\ LQWKH GRZQZDUG WUHQG ZKLOH RLO DOVR WUDGHV UHODWLYHO\VWDEOHDW86'-SHUEDUUHOOHYHO*RLQJIRUZDUGZHDUH RI WKH YLHZ WKDW WKHUH LV OLPLWHG FDWDO\VW IRU FRDODQGRLOSULFHRQWKHEDFNRIFRQFHUQVRQJOREDOJURZWKDQG KLJK LQYHQWRU\ OHYHO :LWK ERWK FRPPRGLWLHVWUDGLQJDWIDYRUDEOHOHYHOWRFHPHQWSOD\HUVZHEHOLHYHWKLVVKRXOGEULQJDWDLOZLQGWRWKHLQGXVWU\¶VPDUJLQV 6WHDG\ SULFLQJ UHFRYHU\ :LWKLQ WKHPHGLXP WHUPZH H[SHFW WR VHH - DQQXDO $63 JURZWK IURPOHDGLQJ FHPHQW SOD\HUV VXSSRUWHG E\ D KHDOWKLHUFRPSHWLWLRQ HQYLURQPHQW RQ WKH PDUNHW DV ZHOO DV DFKDOOHQJLQJILQDQFLDORXWORRNIRUVHYHUDOVPDOOHUSOD\HUVVHOOLQJ SURGXFWV DW a GLVFRXQW IURP SHHUV
6RXUFH&RPSDQ\GDWD6LQDUPDV,QYHVWPHQW5HVHDUFK
,QGXVWU\FDSDFLW\DQGXWLOL]DWLRQUDWH
7LFNHU 5DWLQJ &3 73 &KJ
,173 1(875$/
60*5 %8<
)<)(9WRQ
,'5PQ
,'5PQ
&HPHQWVHFWRU
6RXUFH&RPSDQ\GDWD6LQDUPDV,QYHVWPHQW5HVHDUFK
&HPHQWSOD\HUVPDUNHWVKDUH
4449
5559 60 62 63
6973 76 78 80 83 85 88 90
5154
6063
7077
90
101
111115 115 116 117 117 118 118
86%91% 92% 94%
86%80%
70%66% 66%
66% 67% 69% 71% 73% 74% 76%
2010 2011 2012 2013 2014 2015 2016 2017 2018 2019E 2020F 2021F 2022F 2023F 2024F 2025F
National Demand National Supply Utilization Rate
40.8% 39.4% 39.4% 39.4% 39.5% 38.1% 38.1% 38.4% 38.5%
25.3% 26.4% 26.1% 25.8% 25.5% 26.2% 26.2% 25.5% 25.4%
33.9% 33.9% 34.2% 34.5% 34.8% 35.0% 35.7% 35.7% 36.1%
2017 3M18 6M18 9M18 12M18 3M19 6M19 9M19 11M19
SMGR INTP Others

ĞŵĞŶƚ^ĞĐƚŽƌ
Wd/ŶĚŽĐĞŵĞŶƚdƵŶŐŐĂůWƌĂŬĂƌƐĂdďŬ
EhdZ>
:H PDLQWDLQ RXU 1(875$/ UHFRPPHQGDWLRQ RQ 37,QGRFHPHQW 7XQJJDO 3UDNDUVD 7EN ,173 ZLWK D KLJKHUWDUJHWSULFHRI,'5LPSO\LQJWKHFRPELQDWLRQRIPQ (9WRQ DVVXPSWLRQ DQG '&) YDOXDWLRQ*UDQWHGZLWK]HURGHEW SRVLWLRQ DQG KLJK FDVK EDODQFH DORQJ ZLWK FRQWLQXRXVUHFRYHU\LQLWVLQGXVWU\ZHYLHZWKDW,173ZRXOGUHPDLQUHVLOLHQW1RQHWKHOHVV RXU QHXWUDO FDOO LV SULPDULO\ GXH WR FRPSDQ\¶VGHPDQGLQJ YDOXDWLRQ DV VKDUH SULFH LV WUDGHG DW PQ (9WRQ6'IURP-\UDYHUDJHVXJJHVWLQJSUHPLXPWR60*5¶V 6LJQLILFDQWUHFRYHU\ LQSURILWDELOLW\$PLGVWZHDNVDOHVYROXPH,173 UHFRUGHG D VDWLVI\LQJ ILQDQFLDO SHUIRUPDQFH LQ 0 DVFRPSDQ\ PDQDJHG WR LQFUHDVH VHOOLQJ SULFHV LQ FHUWDLQ DUHDVHYLGHQFHG E\ LQFUHDVH LQ EOHQGHG $63 0HDQZKLOH GHFOLQLQJFRDODQGRLOSULFHVWKURXJKRXW)<DOVRUHVXOWHGLQORZHUIXHODQGSRZHUFRVWV IXHO FRVWWRQ -<R<7KH WZR IDFWRUV UHVXOWHG LQESVDQGESVLQFUHDVHLQJURVVDQG(%,7'$PDUJLQ :KDW WR H[SHFW LQ 2QZDUGVZHH[SHFW WKDWDKHDOWKLHULQGXVWU\ FRQGLWLRQ DQG KLJKHU GHPDQG HQYLURQPHQW VXSSRUWHG E\FRQWLQXDWLRQ RI LQIUD GHYHORSPHQW DQG SRWHQWLDO UHFRYHU\ RQSURSHUW\PDUNHW VKRXOG SURYLGH RSSRUWXQLWLHV IRU WKH FRPSDQ\ WRUDLVH $63 DQG SRVW IDYRXUDEOH YROXPH JURZWK ,Q DGGLWLRQPDQDJHPHQWVWDWHVWKDWWKHFRPSDQ\LVRSHQWRSDUWLFLSDWHLQDQ\SRWHQWLDO0$GHDOV)URPH[SDQVLRQSHUVSHFWLYH ,173ZRXOGVWLOOEH IRFXVLQJ RQ PHHWLQJ GRPHVWLF GHPDQGV ZKLOH HYDOXDWLQJ WKHSRWHQWLDO IRU WDSSLQJEDFN LQWRH[SRUWVPDUNHW7KHFRPSDQ\DOVRFRQWLQXHVLWVELRIXHOXVDJHLQPDQXIDFWXULQJSURFHVVDQGWDUJHWVWRUHSODFHaRIFRDOFRQVXPSWLRQZLWKDOWHUQDWLYHHQHUJ\ 5HYLHZLQJLPSDFWVIURP2'2/SROLF\LPSOHPHQWDWLRQ'XHWRFRPSDQ\¶V FRQFHQWUDWHGSODQW ORFDWLRQ ,173 LQFXUV UHODWLYHO\KLJKORJLVWLF FRVWV DV LW DFFRXQWV IRU a WR UHYHQXH 0DQDJHPHQWH[SHFWVWKDWWKHIXOOHQIRUFHPHQWRIWKHUHJXODWLRQPLJKW LQFUHDVHWUDQVSRUWDWLRQFRVWVE\PRUHWKDQ,QWKHPHDQWLPHFRPSDQ\LV WU\LQJ WR JUDGXDOO\ WULP GHOLYHU\ H[SHQVHV E\ UHYLHZLQJDOWHUQDWLYH URXWHV DQG RWKHU WUDQVSRUWDWLRQ RSWLRQV DV ZHOO DVEXLOGLQJPRUHWHUPLQDODQGEDJSDFNLQJSODQWV,173DOORFDWHV,'5WQIRUFDSH[LQRUaKLJKHUIURP)<(UHDOL]DWLRQ
^ƚŽĐŬ/ŶĨŽƌŵĂƟŽŶ
ůŽŽŵďĞƌŐdŝĐŬĞƌ /EdW/:
ϱϮ-tĞĞŬ,ŝŐŚ ϮϮϴϳϱ
ϱϮ-tĞĞŬ>Žǁ ϭϳϬϬϬ
&zϮϬ&W ϯϳϬdž
&zϮϬ&Ws Ϯϴdž
^ŚĂƌĞKƵƚƐƚĂŶĚŝŶŐ;DŶͿ ϯϲϴϭϮ
DĂƌŬĞƚĂƉ;/ZdŶͿ ϳϯϲ
^ŚĂƌĞWƌŝĐĞWĞƌĨŽƌŵĂŶĐĞ
ƵƌƌĞŶƚWƌŝĐĞ ϮϬϬϬϬ
ϱϮ-tĞĞŬdĂƌŐĞƚWƌŝĐĞ ϮϬϮϬϬ
йŚĂŶŐĞ ϭй
+LJKOLJKWV,'5%Q ( ) ) )
5HYHQXH
JURZWK
*URVV3URILW
1HW3URILW
JURZWK -
*URVV0DUJLQ
1HW0DUJLQ
5HWXUQRQ(TXLW\
5HWXUQRQ$VVHWV
(36

,QFRPH6WDWHPHQW &DVK)ORZ
%DODQFH6KHHW 5DWLR$QDO\VLV
ĞŵĞŶƚ/ŶĚŽĐĞŵĞŶƚdƵŶŐŐĂůWƌĂŬĂƌƐĂ
,'5%Q ( ) ) )
&DVK
7UDGH5HFHLYDEOHV
,QYHQWRULHV
2WKHU&XUUHQW$VVHWV
7RWDO&XUUHQW$VVHWV
)L[HG$VVHWV
2WKHU1RQ-&$
7RWDO$VVHWV
7UDGH3D\DEOHV
%DQN/RDQV - - - - -
2WKHU&/
7RWDO&/
2WKHU1RQ-&/
7RWDO/LDELOLWLHV
6KDUH$3,&
5HWDLQHG(DUQLQJV
0LQRULW\,QWHUHVW - - - - -
2WKHU(TXLW\
7RWDO(TXLW\
,'5%Q ( ) ) )
5HYHQXH
JURZWK
&2*6
*URVV3URILW
JURZWK -
2SHUDWLQJ([SHQVHV
2SH[WR6DOHV
2SHUDWLQJ3URILW
JURZWK -
(%,7'$
JURZWK -
2WKHU,QFRPH
1HW)LQDQFLQJ
3%7
7D[
0LQRULW\,QWHUHVW - - - - -
1HW,QFRPH
JURZWK -
,'5%Q ( ) ) )
1HW,QFRPH
'HSUHFLDWLRQ
&KJLQ1:&
&KJLQ2WKHU&$ -
&KJLQ2WKHU&/
&)IURP2SHUDWLQJ
&DSLWDO([SHQGLWXUH
&KJLQ/7$VVHWV - - - -
&KJLQ/7/LDELOLWLHV - - - -
&)IURP,QYHVWLQJ
&KJLQ6KDUH$3,& - - - - -
&KJLQ'HEW - - - - -
'LYLGHQGV3DLG
2WKHUV - - - -
&)IURP)LQDQFLQJ
&KDQJHLQ&DVK
%HJLQQLQJ&DVK
(QGLQJ&DVK
( ) ) )
3URILWDELOLW\
52(
52$
*URVV0DUJLQ
2SHUDWLQJ0DUJLQ
(%,7'$0DUJLQ
1HW0DUJLQ
/LTXLGLW\ &XUUHQW5DWLR
9DOXDWLRQ
(9(%,7'$
6DOHV9ROXPH*URZWK
$63*URZWK<R<
.H\$VVXPSWLRQV
3ULFHWR(DUQLQJ3(
3ULFHWR%RRN3%9

ĞŵĞŶƚ^ĞĐƚŽƌ
Wd^ĞŵĞŶ/ŶĚŽŶĞƐŝĂdďŬ
hz
:H PDLQWDLQ RXU %8< UHFRPPHQGDWLRQ RQ 37 6HPHQ,QGRQHVLD 7EN 60*5 ZLWK -ZHHN WDUJHW SULFH RI ,'5 GHULYLQJ IURP WKH FRPELQDWLRQ RI PQ (9 WRQDVVXPSWLRQ DQG '&) YDOXDWLRQ $VLGH IURP LWV UHDVRQDEOHYDOXDWLRQZHDUHVHHLQJ WKH UHVXPSWLRQRI LQIUDVWUXFWXUHSURMHFWVDQG UHFRYHU\ RQ SURSHUW\ GHPDQG WR HQFRXUDJH FRPSDQ\¶V VDOHVJURZWK ZKLOH VXEVLGLQJ FRPSHWLWLRQ DOORZV IRU JUDGXDO $63LQFUHDVHV :H DOVR VHH SRWHQWLDO V\QHUJ\ XQORFNLQJ IURP 60&%DFTXLVLWLRQDQGGHEWUHVWUXFWXULQJ'RZQVLGHULVNVWRRXUFDOOSRRUV\QHUJ\ZLWK6&0%DQGKLJKHUWKDQH[SHFWHGILQDQFHFRVWV $FTXLVLWLRQ GHEW SUHVVXUHV ERWWRP OLQH UH-SURILOLQJ KHOSVVRRWKLQJ 60*5¶V '(5 LQFUHDVHG WR [ IURP [ VLQFH WKHFRPSDQ\WRRNRYHU60&%ZLWKGHEWILQDQFLQJ,'5WQ,QPLG WKHFRPSDQ\KDV WDNHQVRPHPHDVXUHV WR ORZHU LWVFRVW RI IXQGV E\ LVVXLQJ ,'5 WQ RI ORFDO ERQGV DQG WDNLQJGRPHVWLF ORDQVDPRXQWHG WR ,'5 WQDWD FRVWRIXSIURQWIHH:H H[SHFW WKDW GHEW UHILQDQFLQJZRXOG HDVH FRVW RI IXQG E\DURXQGESVUHGXFLQJLQWHUHVWFRVWEXUGHQ *UHDWHUHIILFLHQF\SRVW-FRQVROLGDWLRQ3RVWFRQVROLGDWLRQ60*5EHQHILWV IURPDZLGHU IRRWSULQWDVERWK60*5DQG60&%DUHQRZDEOH WRGRFURVV-SURGXFLQJDVZHOODVKDYLQJVWURQJHUGLVWULEXWLRQFKDQQHO 60&% DOVR ZRXOG HQMR\ EHWWHU HIILFLHQF\ DQG ODUJHUHFRQRPLHV RI VFDOH IURP LQWHJUDWHG UDZ PDWHULDOV SURFXUHPHQW7KLVKDVUHVXOWHGIURPDSURILWWXUQDURXQGIRU60&%DIWHUUHFRUGLQJ TXDUWHUV RI 13$7 ORVV +HDGLQJ LQWR 60*5 ZRXOG DOVRXQORFN DQRWKHU SURILWDELOLW\ SRWHQWLDO FRPLQJ IURP UR\DOW\ IHHUHYRFDWLRQVLQFH60&%KDVLQWURGXFHGLWVQHZEUDQG'\QDPL[ 8SFRPLQJ SODQV60&%¶VXWLOL]DWLRQUDWHVWDQGVDWIDUEHORZ60*5¶V ZKLFK LV UXQQLQJ DW OHYHO 7KH FRPSDQ\ SODQV WRPD[LPL]H60&%¶VXWLOL]DWLRQE\LQFUHDVLQJH[SRVXUHWRWKHH[SRUWVPDUNHW DQG OHYHUDJLQJ RQ 60&%¶V VWURQJ UHWDLO GLVWULEXWLRQFKDQQHOV ,Q WHUPV RI SURILWDELOLW\ WKH FRPSDQ\ KDV DGMXVWHG+ROFLP¶V$63WREHLQ-OLQHZLWKRWKHU60*5¶VEUDQGVDQGLVRSHQWRIXUWKHUSULFHDGMXVWPHQWLIGHPDQGDQGHQYLURQPHQWDUHVXSSRUWLYHDQGDLPVWRDFKLHYHDQGVXVWDLQ(%,7'$PDUJLQRIDURXQG
^ƚŽĐŬ/ŶĨŽƌŵĂƟŽŶ
ůŽŽŵďĞƌŐdŝĐŬĞƌ ^D'Z/:
ϱϮ-tĞĞŬ,ŝŐŚ ϭϰϰϱϬ
ϱϮ-tĞĞŬ>Žǁ ϭϬϬϳϱ
&zϮϬ&W Ϯϲϯdž
&zϮϬ&Ws Ϯϱdž
^ŚĂƌĞKƵƚƐƚĂŶĚŝŶŐ;DŶͿ ϱϵϯϭϱ
DĂƌŬĞƚĂƉ;/ZdŶͿ ϳϯϬ
^ŚĂƌĞWƌŝĐĞWĞƌĨŽƌŵĂŶĐĞ
ƵƌƌĞŶƚWƌŝĐĞ ϭϮϯϬϬ
ϱϮ-tĞĞŬdĂƌŐĞƚWƌŝĐĞ ϭϱϰϬϬ
йŚĂŶŐĞ ϮϱϮй
+LJKOLJKWV,'5%Q ( ) ) )
5HYHQXH
JURZWK
*URVV3URILW
1HW3URILW
JURZWK -
*URVV0DUJLQ
1HW0DUJLQ
5HWXUQRQ(TXLW\
5HWXUQRQ$VVHWV
(36,'5
-
5,000
10,000
15,000
20,000
25,000
30,000
35,000
40,000
-
2,000
4,000
6,000
8,000
10,000
12,000
14,000
16,000
Jan-19 Feb-19 Mar-19 Apr-19 May-19 Jun-19 Jul-19 Aug-19 Sep-19 Oct-19 Nov-19 Dec-19
Tho
usa
nd
s
SMGR IJ Price Volume Graph
Volume SMGR

,QFRPH6WDWHPHQW &DVK)ORZ
%DODQFH6KHHW 5DWLR$QDO\VLV
ĞŵĞŶƚ^ĞŵĞŶ/ŶĚŽŶĞƐŝĂ
,'5%Q ( ) ) )
&DVK
7UDGH5HFHLYDEOHV
,QYHQWRULHV
2WKHU&XUUHQW$VVHWV
7RWDO&XUUHQW$VVHWV
)L[HG$VVHWV
2WKHU1RQ-&$
7RWDO$VVHWV
7UDGH3D\DEOHV
2WKHU&/
7RWDO&/
%DQN/RDQV
2WKHU1RQ-&/
7RWDO/LDELOLWLHV
6KDUH$3,&
5HWDLQHG(DUQLQJV
0LQRULW\,QWHUHVW
2WKHU(TXLW\
7RWDO(TXLW\
,'5%Q ( ) ) )
5HYHQXH
JURZWK
&2*6
*URVV3URILW
JURZWK
2SHUDWLQJ([SHQVHV
2SH[WR6DOHV
2SHUDWLQJ3URILW
JURZWK
(%,7'$
JURZWK
2WKHU,QFRPH
1HW)LQDQFLQJ
3%7
7D[
0LQRULW\,QWHUHVW
1HW,QFRPH
JURZWK -
( ) ) )
3URILWDELOLW\
52(
52$
*URVV0DUJLQ
(%,7'$0DUJLQ
/LTXLGLW\
&XUUHQW5DWLR
6ROYHQF\
'HEWWR(TXLW\
'HEWWR$VVHWV
,QWHUHVW&RYHUDJH
1HW'HEWWR(%,7'$
9DOXDWLRQ
(9(%,7'$
.H\$VVXPSWLRQV
9ROXPH*URZWK
$63*URZWK
3ULFHWR(DUQLQJ3(
3ULFHWR%RRN3%9
,'5%Q ( ) ) )
1HW,QFRPH
'HSUHFLDWLRQ
&KJLQ1:&
&KJLQ2WKHU&$ - - - - -
&KJLQ2WKHU&/ - - - - -
&)IURP2SHUDWLQJ
&DSLWDO([SHQGLWXUH
&KJLQ/7$VVHWV - - -
&KJLQ/7/LDELOLWLHV
&)IURP,QYHVWLQJ
&KJLQ6KDUH$3,& - - - - -
&KJLQ'HEW
'LYLGHQGV3DLG
2WKHUV - - - -
&)IURP)LQDQFLQJ
&KDQJHLQ&DVK
%HJLQQLQJ&DVK
(QGLQJ&DVK

Coal Mining Sector
Weakness Persists as Demand Fades
NEUTRAL
What do we expect in FY20? Going forward to FY20,
we believe that global coal price could keep dimming as
we see demand to remain weak while supplies grow.
Global economy slowdown will continue to weigh down
on thermal demand, particularly from China and India.
On the other hand, current high inventories level and
additional local supplies from China’s new and more
efficient mine this year will likely drive up supplies,
lowering their need of imports. Hence, we expect global
coal price to weaken further, especially for high CV
coal. Meanwhile, Indonesia’s low CV coal price should
be more resilient as we see an improvement in
demand/supply balance driven by decelerating
production growth and new power plant roll out.
China: economy slowdown has impacted energy
demand. Prolonged trade war between US and China
has directly hit China’s economy, which leads to lower
manufacturing activities and energy demands. China’s
industrial output growth has declined to its lowest level
of all time (below 5% growth in Oct-19) while
manufacturing PMI has struggled in the contraction
area for the past 6 consecutive months. As a result,
electricity consumption growth has fallen to its 3 years
low at 3-5% YoY growth. In addition, falling gas price
and higher hydro output have also taken a small
portion of thermal demand. All of these should
translate to a weaker demand for coal in coming
months. From the supply side, the new and more
efficient mines have started to come online since 2H19,
resulting in higher supplies (+9.5% YoY). We expect
this trend to continue forward in FY20. Higher local
FY19 in a nutshell. 2019 has been a rough year for
coal sector, as coal price has moved in a continuous
negative direction during the year, closing in at USD
67.9 per ton (XW1) as of Nov-19 or down by 33.5%
from a year ago. This has led to ~30% share price
decline YTD for coal stocks under our coverage over the
past 12 months, underperforming JCI index by more
than 27%. Global economy slowdown, fueled from US-
China trade war has impacted energy demand, hitting
thermal power the most, especially in China and India,
the two biggest coal consumers in the world. On the
other hand, production growth trend remained high,
particularly in China and Indonesia, resulting in an
abundant of supplies and a high inventory level. At the
same time, the drop in gas price and the recovery of
hydropower plant in China have also taken some
portion from thermal demand.
36
-40.0%
-35.0%
-30.0%
-25.0%
-20.0%
-15.0%
-10.0%
-5.0%
0.0%
5.0%
10.0%
15.0%
Dec-18 Jan-19 Feb-19 Mar-19 Apr-19 May-19 Jun-19 Jul-19 Aug-19 Sep-19 Oct-19
XW1 Newcastle Coal sectors (weighted) JCI Index
Source: Bloomberg, Sinarmas Investment Research
Coal sector underperform JCI index
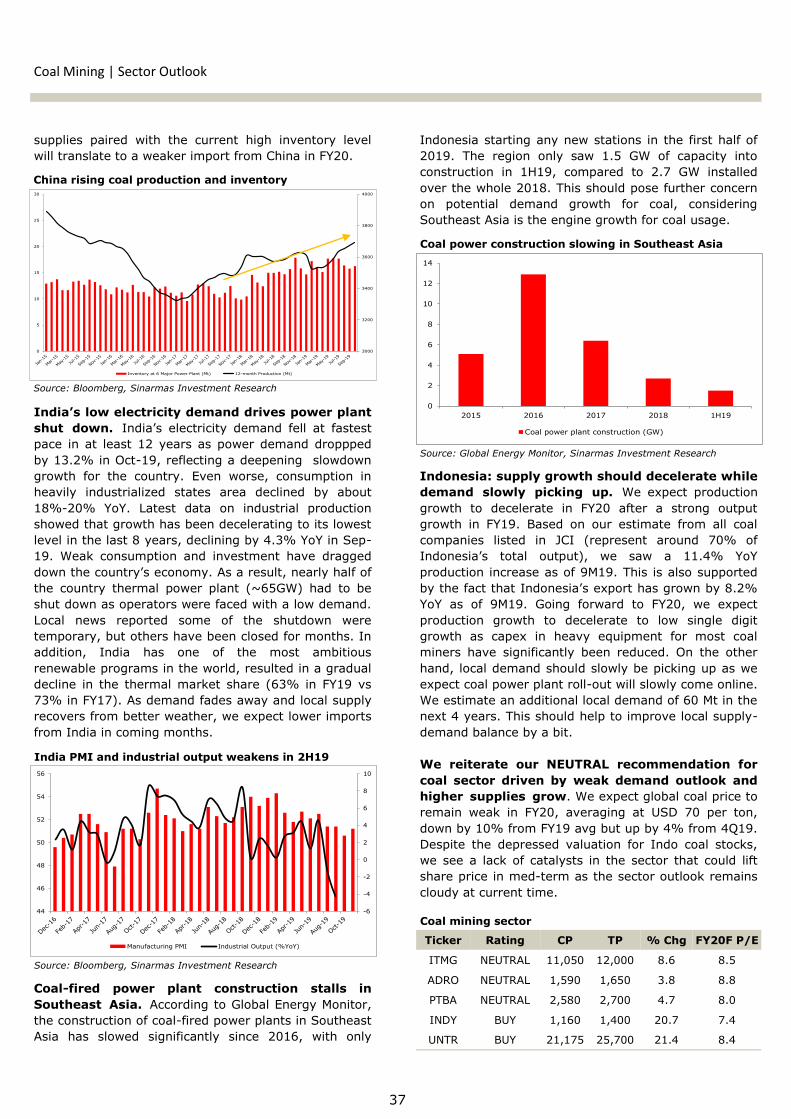
Coal Mining | Sector Outlook
Indonesia starting any new stations in the first half of
2019. The region only saw 1.5 GW of capacity into
construction in 1H19, compared to 2.7 GW installed
over the whole 2018. This should pose further concern
on potential demand growth for coal, considering
Southeast Asia is the engine growth for coal usage.
Indonesia: supply growth should decelerate while
demand slowly picking up. We expect production
growth to decelerate in FY20 after a strong output
growth in FY19. Based on our estimate from all coal
companies listed in JCI (represent around 70% of
Indonesia’s total output), we saw a 11.4% YoY
production increase as of 9M19. This is also supported
by the fact that Indonesia’s export has grown by 8.2%
YoY as of 9M19. Going forward to FY20, we expect
production growth to decelerate to low single digit
growth as capex in heavy equipment for most coal
miners have significantly been reduced. On the other
hand, local demand should slowly be picking up as we
expect coal power plant roll-out will slowly come online.
We estimate an additional local demand of 60 Mt in the
next 4 years. This should help to improve local supply-
demand balance by a bit.
We reiterate our NEUTRAL recommendation for
coal sector driven by weak demand outlook and
higher supplies grow. We expect global coal price to
remain weak in FY20, averaging at USD 70 per ton,
down by 10% from FY19 avg but up by 4% from 4Q19.
Despite the depressed valuation for Indo coal stocks,
we see a lack of catalysts in the sector that could lift
share price in med-term as the sector outlook remains
cloudy at current time.
supplies paired with the current high inventory level
will translate to a weaker import from China in FY20.
India’s low electricity demand drives power plant
shut down. India’s electricity demand fell at fastest
pace in at least 12 years as power demand droppped
by 13.2% in Oct-19, reflecting a deepening slowdown
growth for the country. Even worse, consumption in
heavily industrialized states area declined by about
18%-20% YoY. Latest data on industrial production
showed that growth has been decelerating to its lowest
level in the last 8 years, declining by 4.3% YoY in Sep-
19. Weak consumption and investment have dragged
down the country’s economy. As a result, nearly half of
the country thermal power plant (~65GW) had to be
shut down as operators were faced with a low demand.
Local news reported some of the shutdown were
temporary, but others have been closed for months. In
addition, India has one of the most ambitious
renewable programs in the world, resulted in a gradual
decline in the thermal market share (63% in FY19 vs
73% in FY17). As demand fades away and local supply
recovers from better weather, we expect lower imports
from India in coming months.
Coal-fired power plant construction stalls in
Southeast Asia. According to Global Energy Monitor,
the construction of coal-fired power plants in Southeast
Asia has slowed significantly since 2016, with only
37
Ticker Rating CP TP % Chg FY20F P/E
ITMG NEUTRAL 11,050 12,000 8.6 8.5
ADRO NEUTRAL 1,590 1,650 3.8 8.8
PTBA NEUTRAL 2,580 2,700 4.7 8.0
INDY BUY 1,160 1,400 20.7 7.4
UNTR BUY 21,175 25,700 21.4 8.4
Coal mining sector
China rising coal production and inventory
Source: Bloomberg, Sinarmas Investment Research
3000
3200
3400
3600
3800
4000
0
5
10
15
20
25
30
Inventory at 6 Major Power Plant (Mt) 12-month Production (Mt)
India PMI and industrial output weakens in 2H19
Source: Bloomberg, Sinarmas Investment Research
Coal power construction slowing in Southeast Asia
Source: Global Energy Monitor, Sinarmas Investment Research
-6
-4
-2
0
2
4
6
8
10
44
46
48
50
52
54
56
Manufacturing PMI Industrial Output (%YoY)
0
2
4
6
8
10
12
14
2015 2016 2017 2018 1H19
Coal power plant construction (GW)

Coal Mining Sector
PT Indo Tambangraya Megah Tbk.
NEUTRAL
We maintain our NEUTRAL rating on PT Indo Tambangraya
Megah Tbk. (ITMG) with 52-week target price at IDR
12,000. Our TP represent 8.6% potential upside and implies 8.5x
FY20 PE, -0.2SD from its 5 years average. Despite attractive
valuation (7.7x FY20F forward PE) with a potential high dividend
yield (14% annualized yield), we see higher earnings risk next year
as we expect high CV coal price to trade lower in FY20, resulting in
a negative earnings growth YoY. In addition, the cloudy sector
outlook for high CV coal poses an additional risk for the company.
To note, during coal price downturn in FY14-16, ITMG was traded
at around 7-9x PE, hence we see limited upside for the stock at
current time. Upside risks to our call are higher than expected coal
price and better than expected global economic data.
Expecting flat output with weaker ASP. As of 9M19, ITMG
posted a total production of 18.2 Mt, 16% higher than last year.
The company guide FY19E production at 23.5 Mt (+6.3% YoY).
After a decent output recovery, we expect FY20F production to
remain flat due to reserve concern and limited capex in additional
heavy equipment. In addition, we are baking in a lower coal price
which translate to 6.6% lower ASP in FY20F. All of these should
translate to FY20F revenue at USD 1.59 bn, drop by 5.7% from
FY19E. Meanwhile, on the bottom line level, we forecasted ITMG to
record FY20F net profit of USD 112.4 mn, down by 16% YoY,
mainly due to lower coal price assumptions. Moreover, we have
baked in lower SR at 10.0x in our model (vs 11.3x in 9M19) which
should slightly offset the decline in coal price.
Potential dividend of 14% yield. Despite potentially lower
earnings next year, ITMG should still be able to distribute 14% of
dividend yield in FY20, which should give a slight relieve to
shareholders. Note that, ITMG always pay out 100% of its earnings
to shareholders.
Valuation. Our target price of IDR 12,000 per share is derived
from DCF based valuation (14% WACC) throughout its life of mine.
ITMG is currently traded at 7.7x FY20F forward PE, -0.3SD from its
5 years average.
38
Stock Information
Bloomberg Ticker ITMG IJ
52-Week High 24,475
52-Week Low 10,050
FY20F P/E 8.5x
FY20F P/BV 1.1x
Share Outstanding (Mn) 1,129.9
Market Cap. (IDR Tn) 12.5
Share Price Performance
Current Price 11,050
52-Week Target Price 12,000
% Change 8.6%
Highlights (USD Mn) 2018 2019E 2020F 2021F 2022F
Revenue 2,008 1,649 1,555 1,561 1,566
% growth 18.8% -17.9% -5.7% 0.4% 0.3%
Gross Profit 584 308 278 293 281
Net Profit 259 133 112 116 107
% growth 2.4% -48.5% -15.7% 3.2% -7.9%
Gross Margin (%) 29.1% 18.7% 17.9% 18.8% 17.9%
Net Margin (%) 12.9% 8.1% 7.2% 7.4% 6.8%
Return on Equity (%) 26.6% 14.6% 12.5% 12.9% 11.9%
Return on Assets (%) 17.9% 9.8% 8.3% 8.5% 7.7%
EPS (USD) 0.23 0.12 0.10 0.10 0.09

39
Income Statement Cash Flow
Balance Sheet Ratio Analysis
Coal Mining | Indo Tambangraya Megah
(USD Mn) 2018 2019E 2020F 2021F 2022F
Cash & Equivalent 377 396 442 488 538
Trade Receivables 217 179 168 169 170
Other CA 172 157 149 149 150
Total CA 766 732 759 807 857
Fixed Assets 227 219 213 214 218
Deferred Exploration 123 121 122 122 114
Others 326 291 256 223 191
Total Assets 1,443 1,363 1,350 1,366 1,380
Trade Payables 194 183 174 173 175
Accrued Expense 146 138 131 130 132
Other CL 50 40 39 40 40
Total CL 390 361 344 343 347
Mine Rehabilitation 38 52 66 82 97
Others 45 44 43 42 42
Total Liabilities 473 456 454 467 486
Share & APIC 393 393 393 393 393
Retained Earnings 600 538 527 529 525
Other Equity (23) (23) (23) (23) (23)
Total Equity 973 910 900 901 897
Total Equity & Lia-bilities
1,443 1,363 1,350 1,366 1,380
2018 2019E 2020F 2021F 2022F
Profitability
ROE 26.6% 14.6% 12.5% 12.9% 11.9%
ROA 17.9% 9.8% 8.3% 8.5% 7.7%
Gross Margin 29.1% 18.7% 17.9% 18.8% 17.9%
Operating Margin 18.3% 11.5% 10.3% 10.6% 9.7%
EBITDA Margin 26.2% 15.9% 15.1% 15.7% 15.2%
Net Profit Margin 12.9% 8.1% 7.2% 7.4% 6.8%
Liquidity
Current Ratio 2.0 2.0 2.2 2.4 2.5
Solvency
Debt to Equity 0.5 0.5 0.5 0.5 0.5
Debt to Assets 0.3 0.3 0.3 0.3 0.4
Valuation
Price to Earning (PE) 3.9 7.1 8.5 8.2 8.9
Price to Book (PBV) 1.0 1.0 1.1 1.1 1.1
Assumptions
Coal Price ($/ton) 100.0 75.0 70.0 70.0 70.0
Coal production 22.1 23.6 23.6 24.1 24.1
Stripping Ratio 11.0 10.8 10.0 10.0 10.0
(USD Mn) 2018 2019E 2020F 2021F 2022F
Revenue 2,008 1,649 1,555 1,561 1,566
Cost of Revenue (1,424) (1,341) (1,277) (1,268) (1,285)
Gross Profit 584 308 278 293 281
Selling Expense (122) (104) (97) (99) (99)
G&A Expense (30) (30) (31) (32) (34)
Net Financing 4 5 6 7 7
Other Expense (68) 11 5 (3) (3)
EBT 367 190 161 166 153
EBITDA 526 262 234 245 238
Tax (109) (57) (48) (50) (46)
Net Profit 259 133 112 116 107
(USD Mn) 2018 2019E 2020F 2021F 2022F
Net Income 259 133 112 116 107
Dep & Amo 94 88 84 83 89
Chg. in NWC 96 24 2 (2) 3
Others (11) (0) (0) (0) (0)
CF from Operating 438 244 198 197 198
Capital Expenditure (49) (35) (36) (43) (45)
Chg. in LT Assets 9 5 4 3 2
Chg. in LT Liabilities 10 12 14 15 15
Others (158) (12) (11) (10) (10)
CF from Investing (188) (30) (30) (36) (38)
Chg. in Share & APIC - - - - -
Chg. in ST loans - - - - -
Chg. in LT loans - - - - -
Dividends Paid (243) (196) (123) (114) (111)
Others (1) 0 0 0 0
CF from Financing (244) (196) (123) (114) (111)
Beginning Cash 374 377 396 442 488
Change in Cash 6 19 46 47 49
Ending Cash 380 396 442 488 538

Coal Mining Sector
PT Adaro Energy Tbk.
NEUTRAL
We maintain our NEUTRAL rating on PT Adaro Energy Tbk.
(ADRO) with 52-week target price of IDR 1,650. Our TP
implies 8.8x FY20 PE, -0.5SD from its 5 years average. After a
strong earnings performance in FY19 boosted by Kestrel
acquisitions, we expect earnings momentum to turn negative in
FY20, mainly driven by weaker thermal and coking coal price. We
forecast ADRO’s EPS to decline by 15% as ASP fall by 6% YoY in
FY20. Given the potential decline in earnings and cloudy industry
outlook (higher China’s supply, weak demand, and high inventory
level), we expect valuation to de-rate from its historical mean.
During coal price downturn in FY14-16, ADRO was traded at around
8-10x PE, hence we see limited upside for the stock at current
time. Upside risks to our call are higher than expected coal price,
better than expected global economic data and potential corporate
action.
Weak coal price will lead to an earnings decline. We forecast
ADRO’s earnings to fall to USD 418 mn in FY20F, down by 15%
from our FY19 estimate. Weaker thermal and coking coal price will
drag down blended ASP next year, where we expect it will fall by
6% to USD 50.7 per ton in FY20F. Meanwhile, we expect production
to increase slightly to 57 Mt while keeping our stripping ratio flat at
4.4x, a similar level to FY16 when coal price bottomed.
Lower earnings contribution from Kestrel mines. As of 9M19,
Kestrel book a revenue and net profit of USD 603 mn and USD 89
mn respectively, on track to meet our FY19 estimates (~80%
achievement). However, we note that Kestrel ASP in 3Q19 dropped
to USD 107 per ton from USD 139 per ton in 2Q19. This was due to
significant drop in coking coal price benchmark from USD 200 per
ton in 1H19 to USD 170 per ton in 2H19, partly due to the muted
demand and the decline in steel prices. We expect price trend to
continue in FY20, resulting in a lower contribution from Kestrel to
ADRO (-37% YoY) despite potentially higher output.
Valuation. Our target price of IDR 1,650 is based on DCF derived
valuation (12.5% WACC and 0.5% terminal growth). ADRO is
currently trading at 8.5x FY20 forward PE, -0.6 SD from its 5 years
average.
40
Stock Information
Bloomberg Ticker ADRO IJ
52-Week High 1,715
52-Week Low 1,010
FY20F P/E 8.8x
FY20F P/BV 0.8x
Share Outstanding (Mn) 31,985.9
Market Cap. (IDR Tn) 50.9
Share Price Performance
Current Price 1,590
52-Week Target Price 1,650
% Change 3.8%
Highlights (USD Mn) 2018 2019E 2020F 2021F 2022F
Revenue 3,620 3,410 3,234 3,257 3,245
% growth 11.1% -5.8% -5.2% 0.7% -0.4%
EBITDA 1,240 1,107 1,053 1,042 1,007
Net Profit 418 492 419 406 385
% growth -13.6% 17.8% -14.9% -3.0% -5.2%
EBITDA Margin (%) 34.3% 32.5% 32.6% 32.0% 31.0%
Net Margin (%) 11.5% 14.4% 13.0% 12.5% 11.9%
Return on Equity (%) 9.7% 10.7% 8.7% 8.1% 7.3%
Return on Assets (%) 5.9% 6.9% 5.8% 5.4% 5.0%
EPS 0.013 0.015 0.013 0.013 0.012

41
Income Statement Cash Flow
Balance Sheet Ratio Analysis
Coal Mining | Adaro Energy
(USD Mn) 2018 2019E 2020F 2021F 2022F
Cash & Equivalent 928 1,046 1,087 1,424 1,756
Trade Receivables 377 355 337 339 338
Other CA 206 184 180 179 175
Total CA 1,600 1,585 1,603 1,942 2,269
Mining Properties 2,297 2,182 2,071 1,963 1,857
Fixed Assets 1,610 1,845 2,028 2,030 2,009
Other LT Assets 1,554 1,559 1,567 1,581 1,593
Total Assets 7,061 7,171 7,269 7,515 7,728
Bank Loans 183 172 163 164 164
Other CL 634 602 568 570 567
Total CL 816 774 731 734 731
Bank Loans 1,211 1,091 1,035 1,042 1,039
Others 730 723 689 700 707
Total Liabilities 2,758 2,588 2,455 2,476 2,476
Share & APIC 1,497 1,497 1,497 1,497 1,497
Retained Earnings 2,161 2,390 2,586 2,775 2,954
NCI 652 695 732 767 800
Other Equity (8) - - - -
Total Equity 4,303 4,583 4,814 5,039 5,252
Total Equity & Lia-bilities
7,061 7,171 7,269 7,515 7,728
2018 2019E 2020F 2021F 2022F
Profitability
ROE 9.7% 10.7% 8.7% 8.1% 7.3%
ROA 5.9% 6.9% 5.8% 5.4% 5.0%
Gross Margin 33.4% 29.1% 28.7% 27.9% 26.7%
Operating Margin 24.6% 22.7% 22.1% 21.1% 19.7%
EBITDA Margin 34.3% 32.5% 32.6% 32.0% 31.0%
Net Profit Margin 11.5% 14.4% 13.0% 12.5% 11.9%
Liquidity
Current Ratio 1.1 1.4 1.5 1.9 2.4
Solvency
Debt to Equity 0.3 0.3 0.3 0.2 0.2
Debt to Assets 0.2 0.2 0.2 0.2 0.2
Valuation
Price to Earning (PE) 8.8 7.5 8.8 9.1 9.6
Price to Book (PBV) 0.9 0.8 0.8 0.7 0.7
Assumptions
Coal Price ($/ton) 100.0 75.0 70.0 70.0 70.0
Coal production 54.0 56.8 57.5 58.4 58.9
Stripping Ratio 5.1 4.5 4.4 4.4 4.4
(USD Mn) 2018 2019E 2020F 2021F 2022F
Revenue 3,620 3,410 3,234 3,257 3,245
Cost of Revenue (2,410) (2,417) (2,307) (2,347) (2,378)
Gross Profit 1,210 993 927 910 868
Operating Expense (194) (218) (214) (221) (228)
Other (124) - - - -
EBIT 892 775 713 689 640
EBITDA 1,240 1,107 1,053 1,042 1,007
Net Financing (41) (40) (33) (33) (23)
Gain/(loss) of JV (29) 77 61 62 63
EBT 821 811 741 718 680
Tax (343) (277) (286) (276) (261)
NCI 60 43 36 35 34
Net Profit 418 492 419 406 385
(USD Mn) 2018 2019E 2020F 2021F 2022F
Net Income 418 492 419 406 385
Dep & Amo 412 391 414 432 451
Chg. in NWC 160 104 (10) 1 2
CF from Operating 990 986 822 839 839
Capital Expenditure (398) (512) (485) (326) (325)
Mining properties (59) - - - -
Chg. in LT Assets (581) (5) (8) (14) (13)
Chg. in LT Liabilities (63) (8) (34) 11 7
CF from Investing (1,100) (524) (527) (328) (330)
Chg. in Share & APIC - - - - -
Chg. in ST Loans (17) (13) (11) 1 (1)
Chg. in LT Loans 55 (120) (56) 7 (4)
Dividends Paid (223) (263) (224) (217) (206)
Others 17 51 36 35 34
CF from Financing (168) (344) (255) (173) (177)
Beginning Cash 1,207 928 1,046 1,086 1,424
Change in Cash (279) 118 41 338 332
Ending Cash 928 1,046 1,086 1,424 1,756
Coal Mining Sector
PT Bukit Asam Tbk.
NEUTRAL
We maintain our NEUTRAL rating for PT Bukit Asam Tbk.
(PTBA) with 52-week target price of IDR 2,700. Our TP
implies 8.0x FY20F PE, -0.5SD from its 5 years average. Our
neutral rating on the stock is supported by limited upside risk from
coal price (higher China’s supply, weak demand and high inventory
level) which will lead to muted earnings growth ahead. We forecast
PTBA’s EPS to decline by 4.4% in FY20 due to lower average coal
price. Given potential earnings decline and cloudy sector outlook,
we expect valuation to de-rate from its historical mean. During coal
price downturn, PTBA was traded at 6-9x PE, hence we see limited
upside for the stock at current time. Upside risks to our call are
higher than expected coal price and better than expected global
economic data.
Higher output help offset ASP decline. We forecast PTBA’s
revenue to decline by 3% YoY in FY20 to IDR 20.8 tn, as slight
increase in output (2% YoY) should help in offsetting a bit of ASP
decline (-5% YoY). Moreover, given its high exposure to domestic
sales (~60%), its ASP should be more resilient compared to other
miners who are more exposed to global coal price. Nonetheless, we
still expect PTBA earnings to decline slightly by 4.4% in FY20 to
IDR 3.9 tn due to a lower average coal price next year before
recovering in FY21 (+8% YoY) driven by stable long term output
growth. Furthermore, we also expect the company to slightly lower
their strip ratio next year to 4.5x to mitigate the impact of a lower
ASP.
Strong cash balance and high dividend payout ratio. Despite
weaker earnings outlook, we do note that PTBA currently holds a
strong balance sheet with a high cash balance (post treasury sales
of ~USD 150 mn), which should keep supporting high dividend
payout ratio for shareholders. With a similar 75% payout ratio in
FY20, it should translate to 10% of dividend yield at current price.
Valuation. Our target price of IDR 2,700 is based on DCF derived
valuation (12.9% WACC and 0.5% terminal growth). PTBA is
currently trading at 7.7x FY20 forward PE, -0.6SD from its 5 years
average. Given the weak sector outlook, we see current valuation
has been fairly valued.
42
Stock Information
Bloomberg Ticker PTBA IJ
52-Week High 4,510
52-Week Low 2,110
FY20F P/E 8.0x
FY20F P/BV 1.4x
Share Outstanding (Mn) 11,520.7
Market Cap. (IDR Tn) 29.7
Share Price Performance
Current Price 2,580
52-Week Target Price 2,700
% Change 4.6%
Highlights (IDR Bn) 2018 2019E 2020F 2021F 2022F
Revenue 21,167 21,458 20,829 21,765 22,708
% growth 8.7% 1.4% -2.9% 4.5% 4.3%
EBITDA 7,002 5,916 5,555 5,959 6,039
Net Profit 5,024 4,046 3,868 4,192 4,250
% growth 12.2% -19.5% -4.4% 8.4% 1.4%
EBITDA Margin (%) 33.1% 27.6% 26.7% 27.4% 26.6%
Net Margin (%) 24.2% 19.2% 18.9% 19.6% 19.1%
Return on Equity (%) 30.9% 19.7% 17.9% 18.4% 17.8%
Return on Assets (%) 20.8% 13.4% 12.6% 13.1% 12.5%
EPS (IDR) 436 351 336 364 369

43
Income Statement Cash Flow
Balance Sheet Ratio Analysis
Coal Mining | Bukit Asam
(IDR Bn) 2018 2019E 2020F 2021F 2022F
Cash & Equivalent 6,301 9,396 9,579 9,627 10,796
Trade Receivables 2,782 4,409 4,280 4,472 4,666
Other CA 2,657 2,756 2,727 2,878 3,089
Total CA 11,739 16,561 16,585 16,977 18,550
Fixed Assets 6,548 6,983 7,148 7,321 7,502
Other LT Assets 5,886 6,644 6,988 7,696 7,871
Total Assets 24,173 30,187 30,722 31,995 33,923
Trade Payables 2,322 2,937 2,483 2,696 2,890
Bank Loans 85 315 306 320 334
Other CL 2,528 2,264 2,319 2,374 2,496
Total CL 4,936 5,516 5,108 5,390 5,719
Other non current 2,968 4,079 3,981 3,842 4,297
Total Liabilities 7,903 9,595 9,088 9,232 10,016
Share & APIC 1,183 3,103 3,103 3,103 3,103
Treasury Shares (2,302) (990) (990) (990) (990)
Retained Earnings 16,815 17,826 18,793 19,841 20,904
NCI 255 333 408 489 571
Other Equity 320 320 320 320 320
Total Equity 16,270 20,592 21,634 22,763 23,908
Total Equity & Lia-bilities
24,173 30,187 30,722 31,995 33,923
2018 2019E 2020F 2021F 2022F
Profitability
ROE 30.9% 19.7% 17.9% 18.4% 17.8%
ROA 20.8% 13.4% 12.6% 13.1% 12.5%
Gross Margin 40.4% 35.0% 34.2% 35.4% 34.8%
Operating Margin 29.7% 24.1% 23.0% 23.9% 23.1%
EBITDA Margin 33.1% 27.6% 26.7% 27.4% 26.6%
Net Profit Margin 24.2% 19.2% 18.9% 19.6% 19.1%
Liquidity
Current Ratio 2.4 3.0 3.2 3.1 3.2
Solvency
Debt to Equity 0.5 0.5 0.4 0.4 0.4
Debt to Assets 0.3 0.3 0.3 0.3 0.3
Valuation
Price to Earning (PE) 6.2 7.7 8.0 7.4 7.3
Price to Book (PBV) 1.9 1.5 1.4 1.4 1.3
Key Assumptions
Coal Price ($/ton) 100.0 75.0 70.0 70.0 70.0
Coal Production 26.4 27.3 27.9 29.4 30.7
Stripping Ratio 4.1 4.7 4.5 4.5 4.5
(IDR Bn) 2018 2019E 2020F 2021F 2022F
Revenue 21,167 21,458 20,829 21,765 22,708
Cost of Revenue (12,621) (13,954) (13,704) (14,059) (14,815)
Gross Profit 8,546 7,504 7,125 7,706 7,894
G&A Expense (1,756) (1,720) (1,658) (1,758) (1,865)
Selling & Marketing (841) (858) (879) (927) (977)
Others 335 253 199 184 197
EBIT 6,283 5,179 4,788 5,204 5,249
EBITDA 7,002 5,916 5,555 5,959 6,039
Net Financing 223 247 366 369 399
Profit from JV 352 129 155 183 187
EBT 6,858 5,555 5,310 5,755 5,835
Tax (1,737) (1,430) (1,367) (1,482) (1,502)
NCI 97 78 75 81 82
Net Profit 5,024 4,046 3,868 4,192 4,250
(IDR Bn) 2018 2019E 2020F 2021F 2022F
Net Income 5,024 4,046 3,868 4,192 4,250
Depreciation 504 658 688 718 748
Amortization 64 80 80 38 43
Chg. in NWC 2,616 (1,246) (237) (82) (96)
CF from Operating 8,207 3,538 4,398 4,865 4,945
Capital Expenditure (894) (1,073) (833) (871) (908)
Chg. in LT Assets (1,238) (857) (445) (766) (238)
Chg. in LT Liabilities (635) 810 (76) (172) 421
CF from Investing (2,766) (1,120) (1,354) (1,808) (725)
Chg. in Share & APIC - 1,920 - - -
Chg. in ST Loans (69) 100 (14) 21 21
Chg. in LT Loans (72) 302 (22) 33 33
Dividends Paid (2,774) (3,035) (2,901) (3,144) (3,188)
Others 220 1,390 75 81 82
CF from Financing (2,695) 677 (2,862) (3,009) (3,051)
Beginning Cash 3,555 6,301 9,396 9,579 9,627
Change in Cash 2,746 3,095 183 48 1,169
Ending Cash 6,301 9,396 9,579 9,627 10,796

Coal Mining Sector
PT Indika Energy Tbk.
BUY
We raise our call on PT Indika Energy Tbk. (INDY) from
NEUTRAL to BUY with 52-week target price of IDR 1,400,
derived from DCF based valuation (9.4% WACC). Our TP provides
21% potential upside and implies 7.4x FY20F core PE (exc. Kideco’s
amortization expense of USD 135 mn). INDY’s share price has
declined by 27% YTD and 75% from its peak in Jan-18 with its
valuation that is now depressed to 6.0x forward PE and 0.4x
forward PBV, far below its peers at 7.7x-8.5x PE and 0.7-1.4x PBV.
Though we note that industry outlook remains challenging at this
time, we see trading opportunity on the stock as valuation has
become undemanding. With an annual EBITDA at ~USD 400 mn, a
cash level of ~750 mn and USD 1.1 bn of equity, INDY’s current
market cap of USD 420 mn provides an attractive risk/reward, in
our view. Downside risks to our call are lower than expected coal
price and higher than expected cash cost.
Still expecting lower earnings due to weaker coal price. We
forecast INDY to book USD 69 mn of core profit in FY20F, down by
14% from our FY19 estimate. This was mainly driven by a lower
selling price (-2.5% YoY) paired with a flat production growth next
year (34 Mt). For Kideco, we expect the company to book a profit
of USD 102 mn in FY20 (vs USD 121 mn in FY19E). Meanwhile, we
expect earnings growth to slow down for the other businesses
(Petrosea, MBSS and Tripatra), after posting a strong recovery in
FY19. On EBITDA level, we expect the company to book FY20
EBITDA at USD 410 mn, 5% lower as compared to the previous
year.
Diversification to non-coal business. The company is targeting
to diversify its business from coal-business related. Management
mentions that they are targeting contributions from the non-coal
business to reach 25% in the next 5 years. Since 2 years ago, the
company has actively engaged in M&A activities on non-coal assets
such as adding their stakes in Nusantara Resources (gold mine
company) and building a fuel storage in East Kalimantan. We could
expect further investments in non-coal related business. The
company currently holds a cash balance of USD 750 mn (20% of
total assets) and a net debt to equity of 0.8x, which we believe is
enough to support the expansion.
44
Stock Information
Bloomberg Ticker INDY IJ
52-Week High 2,260
52-Week Low 1,050
FY20F P/E (Core) 7.4x
FY20F P/BV 0.4x
Share Outstanding (Mn) 5,210.2
Market Cap. (IDR Tn) 6.0
Share Price Performance
Current Price 1,160
52-Week Target Price 1,400
% Change 20.7%
Highlights (USD Mn) 2018 2019E 2020F 2021F 2022F
Revenue 2,963 2,675 2,606 2,598 2,613
% growth 169.7% -9.7% -2.6% -0.3% 0.6%
Gross Profit 641 434 387 383 386
Net Profit 80 (6) (18) (17) 3
Core Profit 168 81 69 70 90
Gross Margin (%) 21.6% 16.2% 14.8% 14.7% 14.8%
Net Margin (%) 2.7% -0.2% -0.7% -0.6% 0.1%
Return on Equity (%) 7.1% -0.5% -1.5% -1.5% 0.3%
Return on Assets (%) 2.2% -0.2% -0.5% -0.5% 0.1%
EPS (USD) 0.015 -0.001 -0.003 -0.003 0.000

45
Income Statement Cash Flow
Balance Sheet Ratio Analysis
Coal Mining | Indika Energy
(USD Mn) 2018 2019E 2020F 2021F 2022F
Cash & Equivalent 613 499 475 469 569
Trade Receivables 429 494 502 530 520
Other CA 417 416 451 484 436
Total CA 1,460 1,406 1,424 1,481 1,522
Mining Properties 11 10 10 10 10
Fixed Assets 627 769 813 832 846
Other LT Assets 1,572 1,473 1,344 1,209 1,073
Total Assets 3,670 3,658 3,591 3,531 3,451
Loans Payable 84 51 50 50 50
Other CL 587 595 653 654 612
Total CL 670 645 703 704 662
Loans Payable 1,377 1,395 1,330 1,324 1,320
Others 496 444 400 360 324
Total Liabilities 2,543 2,485 2,433 2,388 2,305
Share & APIC 311 311 311 311 311
Retained Earnings 570 595 584 574 576
NCI 179 200 195 191 192
Others 68 68 68 68 68
Total Equity 1,127 1,173 1,158 1,143 1,146
Total Equity & Lia-bilities
3,670 3,658 3,591 3,531 3,451
2018 2019E 2020F 2021F 2022F
Profitability
ROE 7.1% -0.5% -1.5% -1.5% 0.3%
ROA 2.2% -0.2% -0.5% -0.5% 0.1%
Gross Margin 21.6% 16.2% 14.8% 14.7% 14.8%
EBITDA Margin 19.9% 16.1% 15.7% 16.3% 16.6%
Net Profit Margin 2.7% -0.2% -0.7% -0.6% 0.1%
Liquidity/Solvency
Current Ratio 0.5 0.5 0.5 0.5 0.4
Debt to Equity 1.6 1.5 1.2 1.2 1.2
Debt to Assets 0.5 0.5 0.4 0.4 0.4
Valuation
Core PE 3.1 6.4 7.4 7.4 5.7
Price to Book (PBV) 0.5 0.4 0.4 0.4 0.0
Assumptions
Coal price 100.0 75.0 70.0 70.0 70.0
Coal production 34.0 34.0 34.0 34.0 34.0
Stripping Ratio 6.3 6.4 6.4 6.4 6.4
(USD Mn) 2018 2019E 2020F 2021F 2022F
Revenue 2,963 2,675 2,606 2,598 2,613
Cost of Revenue (2,322) (2,241) (2,220) (2,215) (2,228)
Gross Profit 641 434 387 383 386
Operating Expense (133) (128) (130) (132) (135)
Others (164) (146) (134) (129) (127)
EBIT 344 160 124 122 124
EBITDA 588 430 410 423 434
Net Financing (8) (19) (6) (6) (6)
Gain from JV 21 31 34 36 39
EBT 386 182 145 146 151
Tax (167) (61) (68) (69) (73)
NCI 18 21 (4) (4) 1
Net Profit 80 (6) (18) (17) 3
Core Profit 168 81 69 70 90
(USD Mn) 2018 2019E 2020F 2021F 2022F
Net Income 80 (6) (18) (17) 3
Dep. & Amo. 223 239 253 265 271
Chg. in NWC 75 53 (16) 60 (15)
CF from Operating 228 180 251 188 289
Capital Expenditure 102 241 156 143 144
Chg. in Intangible 3 - - - -
Chg. in LT Assets 46 39 11 6 5
Chg. in LT Liabilities (61) (52) (44) (41) (36)
CF from Investing (212) (332) (212) (190) (185)
Chg. in Share & APIC - - - - -
Chg. in ST Loans (29) (33) (1) (0) 0
Chg. in LT Loans 72 19 (65) (6) (4)
Dividends Paid 32 (2) (7) (7) 1
Chg. in Others (8) 21 (4) (4) 1
CF from Financing 3 10 (64) (3) (5)
Beginning Cash 622 641 499 475 469
Change in Cash 19 (142) (24) (5) 99
Ending Cash 641 499 475 469 569

Coal Mining Sector
PT United Tractors Tbk.
BUY
We upgrade our recommendation on PT United Tractors Tbk
(UNTR) from NEUTRAL to BUY with 52 week target price of
IDR 25,700. Our TP provides 21% upside and implies 8.4x FY20F
PE (-1SD from 5-years average). Recent price correction provides a
good opportunity to collect the stock, in our view, given UNTR
share price has declined by 22% YTD with its valuation de-rate to
its all time low (6.9x FY20 forward PE, -2SD). Despite the weak
industry outlook from the coal business, we believe earnings should
remain resilient (+4% CAGR FY19E-FY21F) supported by the gold
segments (Martabe) and improvements in ACST. In addition, the
stock now provides 5.8% dividend yield at current price. Downside
risks to our call are lower than expected coal price and lower than
expected operational numbers.
Resilient earnings. Despite weakening industry, we still expect
UNTR to book a slight positive earnings growth in FY20 (+3% YoY)
supported by the non-coal business segments (Martabe and ACST).
We expect Martabe to post 25% earnings growth in FY20 due to a
higher ASP (Gold assumption at USD 1,500), expired hedge
position, and better cost control from operational efficiency.
Meanwhile, we expect ACST earnings to turn positive in FY20 after
booking a loss in the previous year. On the coal business segments,
we forecast Komatsu heavy equipment sales to drop to 3k units
from 3.2k units in FY19E, PAMA’s SR to fall to 7.5x with flat OB
growth output, and slight increase in coal output (2% YoY).
Update on management key takeaways. During the company’s
latest analyst meeting, management highlighted their view on FY20
outlook. Management expects capex to decline in FY20, as
equipment replacement has been done in FY19. On the other hand,
the company will continue to observe potential opportunities in the
non-coal business as they are targeting higher contributions from
the non-coal segments in years ahead.
Valuation. Our target price of IDR 25,700 per share is derived
from DCF based valuation (13% WACC and 1% terminal growth).
UNTR is currently trading at 6.9x FY20 forward PE, -2SD from its
five years average PE. We see attractive risk/reward on the stock
at current point.
46
Stock Information
Bloomberg Ticker UNTR IJ
52-Week High 29,525
52-Week Low 19,650
FY20F P/E 8.4x
FY20F P/BV 1.4x
Share Outstanding (Mn) 3,730.1
Market Cap. (IDR Tn) 80.0
Share Price Performance
Current Price 21,175
52-Week Target Price 25,700
% Change 21.4%
Highlights (IDR Bn) 2018 2019E 2020F 2021F 2022F
Revenue 84,625 87,366 87,058 89,756 92,318
% growth 31.1% 3.2% -0.4% 3.1% 2.9%
Gross Profit 21,110 21,683 22,084 22,985 23,906
EBITDA 20,700 22,005 23,074 24,585 26,145
% growth 50.9% 6.3% 4.9% 6.5% 6.3%
Pre-Tax Profit 15,709 15,491 16,075 16,832 17,508
Net Profit 11,126 11,010 11,425 11,963 12,444
% growth 50.3% -1.0% 3.8% 4.7% 4.0%
Return on Asset 11.6% 9.4% 9.1% 9.0% 8.7%
Return on Equity 22.0% 18.7% 17.4% 16.4% 15.5%
47
Income Statement Cash Flow
Balance Sheet Ratio Analysis
Coal Mining | United Tractors
(IDR Bn) 2018 2019E 2020F 2021F 2022F
Cash & Equivalents 13,438 21,281 25,324 29,485 32,203
Trade Receivables 20,610 21,278 21,203 21,860 22,484
Inventories 13,618 14,083 13,931 14,316 14,668
Fixed Assets 24,585 25,551 27,437 29,646 31,810
Mining Properties 15,889 15,612 15,533 15,253 14,974
Total Assets 116,281 125,057 132,632 142,530 152,432
Trade Payables 32,691 33,807 33,442 34,367 35,212
Accruals 3,763 3,951 4,149 4,356 4,574
ST Bank Loans 6,857 3,428 3,428 3,428 3,428
Current LT Loans 164 607 1,047 1,904 2,407
LT Loans 3,286 6,571 6,571 6,571 6,571
Total Liabilities 59,230 61,136 61,416 63,616 65,546
Total Equity 57,051 63,921 71,216 78,914 86,886
2018 2019E 2020F 2021F 2022F
Profitability
ROE 11.6 9.4 9.1 9.0 8.7
ROA 22.0 18.7 17.4 16.4 15.5
Gross Margin 24.9 24.8 25.4 25.6 25.9
Operating Margin 19.0 19.2 19.7 19.9 20.1
EBITDA Margin 24.5 25.2 26.5 27.4 28.3
Net Profit Margin 13.6 13.0 13.5 13.7 13.9
Liquidity
Current Ratio 1.1 1.4 1.5 1.5 1.5
Solvency
Debt to Equity 0.2 0.2 0.2 0.2 0.1
Debt to Assets 0.1 0.1 0.1 0.1 0.1
Valuation
Price to Earning (PE) 8.7 8.8 8.4 8.1 7.7
Price to Book (PBV) 1.8 1.6 1.4 1.3 1.2
Assumptions
USD/IDR 14,247 14,300 14,300 14,300 14,300
Komatsu Sales (unit) 4,879 3,200 3,000 3,000 3,000
PAMA OB (Mn ton) 979 1,026 1,025 1,055 1,087
PAMA Coal Production (Mn ton)
125.2 133.2 136.7 140.8 145.0
(IDR Bn) 2018 2019E 2020F 2021F 2022F
Net Revenue 84,625 87,366 87,058 89,756 92,318
- Heavy Equipment 29,615 23,853 23,038 23,662 24,335
- Mining Contracting 40,559 40,160 40,120 41,324 42,564
- Coal Mining 10,727 11,083 10,603 10,868 11,139
- Construction 3,724 3,997 4,092 4,166 4,224
- Gold Mining - 8,273 9,204 9,736 10,057
Cost of Revenue 63,515 65,683 64,974 66,771 68,412
Gross Profit 21,110 21,683 22,084 22,985 23,906
Selling Expenses 968 826 813 835 859
G&A Expenses 3,371 4,242 4,289 4,481 4,686
Impairment - - - - -
Other Expense 977 158 156 160 165
Other Income 282 316 311 320 329
Operating Profit 16,075 16,774 17,138 17,828 18,526
EBITDA 20,700 22,005 23,074 24,585 26,145
Finance Income 764 493 781 929 1,082
Finance Cost 1,438 2,267 2,334 2,430 2,619
Profit from JV 307 491 490 505 519
Income Before Tax Expenses
15,709 15,491 16,075 16,832 17,508
Net Income 11,126 11,010 11,425 11,963 12,444
(IDR Bn) 2018 2019E 2020F 2021F 2022F
Net Income 11,126 11,010 11,425 11,963 12,444
Dep. & Amo. 4,625 5,231 5,936 6,757 7,619
Chg. in NWC 3,462 (285) 17 321 150
Others 1,965 460 405 441 457
CF from Operating 21,177 16,417 17,783 19,482 20,670
Capital Expenditure (12,835) (6,198) (7,822) (8,965) (9,783)
Chg. in LT Assets (21,360) 2,010 (1,689) (2,445) (3,798)
Chg. in LT Liabilities 3,574 (88) (133) (61) 55
CF from Investing (30,620) (4,275) (9,644) (11,472) (13,526)
Chg. in Share & APIC - - - - -
Chg. in ST Loans 5,105 (2,985) 440 857 503
Chg. in LT Loans 523 3,286 - - -
Dividends Paid (3,578) (4,599) (4,536) (4,707) (4,928)
Others - - - - -
CF from Financing 2,050 (4,299) (4,096) (3,850) (4,425)
Beginning Cash 20,831 13,438 21,281 25,324 29,485
Change in Cash (7,393) 7,843 4,043 4,161 2,719
Ending Cash 13,438 21,281 25,324 29,485 32,203
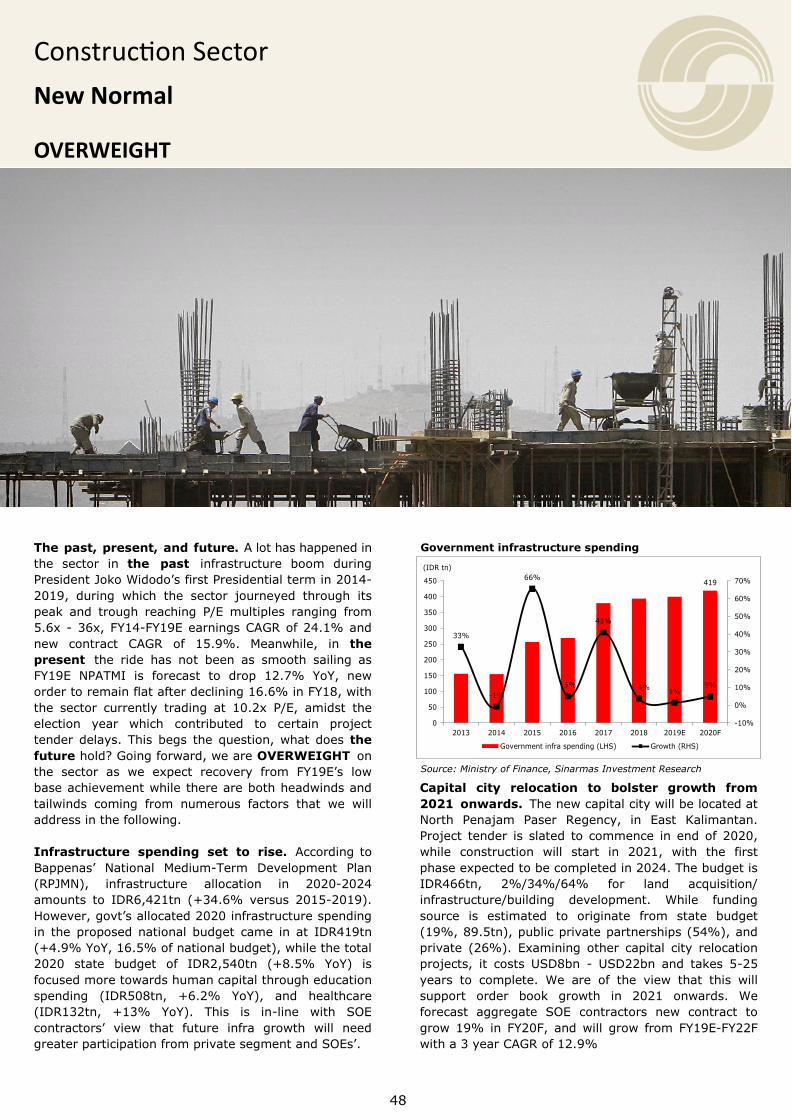
Construction Sector New Normal
OVERWEIGHT
Capital city relocation to bolster growth from 2021 onwards. The new capital city will be located at North Penajam Paser Regency, in East Kalimantan. Project tender is slated to commence in end of 2020, while construction will start in 2021, with the first phase expected to be completed in 2024. The budget is IDR466tn, 2%/34%/64% for land acquisition/infrastructure/building development. While funding source is estimated to originate from state budget (19%, 89.5tn), public private partnerships (54%), and private (26%). Examining other capital city relocation projects, it costs USD8bn - USD22bn and takes 5-25 years to complete. We are of the view that this will support order book growth in 2021 onwards. We forecast aggregate SOE contractors new contract to grow 19% in FY20F, and will grow from FY19E-FY22F with a 3 year CAGR of 12.9%
The past, present, and future. A lot has happened in the sector in the past infrastructure boom during President Joko Widodo’s first Presidential term in 2014-2019, during which the sector journeyed through its peak and trough reaching P/E multiples ranging from 5.6x - 36x, FY14-FY19E earnings CAGR of 24.1% and new contract CAGR of 15.9%. Meanwhile, in the present the ride has not been as smooth sailing as FY19E NPATMI is forecast to drop 12.7% YoY, new order to remain flat after declining 16.6% in FY18, with the sector currently trading at 10.2x P/E, amidst the election year which contributed to certain project tender delays. This begs the question, what does the future hold? Going forward, we are OVERWEIGHT on the sector as we expect recovery from FY19E’s low base achievement while there are both headwinds and tailwinds coming from numerous factors that we will address in the following. Infrastructure spending set to rise. According to Bappenas’ National Medium-Term Development Plan (RPJMN), infrastructure allocation in 2020-2024 amounts to IDR6,421tn (+34.6% versus 2015-2019). However, govt’s allocated 2020 infrastructure spending in the proposed national budget came in at IDR419tn (+4.9% YoY, 16.5% of national budget), while the total 2020 state budget of IDR2,540tn (+8.5% YoY) is focused more towards human capital through education spending (IDR508tn, +6.2% YoY), and healthcare (IDR132tn, +13% YoY). This is in-line with SOE contractors’ view that future infra growth will need greater participation from private segment and SOEs’.
48
Source: Ministry of Finance, Sinarmas Investment Research
Government infrastructure spending
419
33%
-1%
66%
5%
41%
4% 1%5%
-10%
0%
10%
20%
30%
40%
50%
60%
70%
0
50
100
150
200
250
300
350
400
450
2013 2014 2015 2016 2017 2018 2019E 2020F
Government infra spending (LHS) Growth (RHS)
(IDR tn)

Construction | Sector Outlook
over to the buyer. Thus, historical income from high-rise presales that were already recorded will have to be impaired from retained earnings until hand over of those properties. The net impact from both these standards will reduce contractors’ retained earnings under our coverage by IDR220bn - IDR3tn based on our channel checks. As a rule of thumb, most contractors are impairing ~1% - 2% of their accounts receivable for PSAK 71. While for PSAK 72, the most impacted are PTPP and ADHI (IDR1.8tn and IDR900bn respectively). We upgrade our stance on the sector to OVERWEIGHT and prefer selective picking on the back of higher quality earnings from new accounting regulations paired with earnings recovery post FY19E. Major overhangs namely new accounting standards and government’s future stance on the sector has mainly been cleared and the sector is on track to recover after two slow years. Growth opportunities are plenty, the question is whether contractors’ have the capacity to take them on. Weighted SOE contractors’ P/E currently stands at 10.2x, roughly –1 SD of its 5 years average. Our pecking order is as follows: WIKA > WEGE > WTON > PTPP > ADHI > WSKT > WSBP. We prefer companies that have a healthier cash flow and balance sheet capacity to seize new orders. If all is well, we believe a new normal is going to be formed with valuations rationalizing to 10x-12x P/E multiple in the long run.
Leverage will still expand with more investments, but CoF set to improve. As new projects are increasingly funded by the contractors’ themselves through minority investments, we predict that gearing ratio will peak at 1.7x in FY21F, coinciding with the capital city relocation, before slowly improving thereafter. On the positive side, since Bank Indonesia cut rates by 100 bps in 2019, contractors have managed to decrease CoF from new loans by up to 50 bps. This is impactful as interest expense is 3% - 6% of revenue. In the long run, these investments will be divested as part of contractors’ asset recycling program to free up cash for future investments and deleveraging. Previous and upcoming successful divestments include WIKA’s Surabaya - Mojokerto toll road at 2.4x P/BV, Waskita Toll Road’s (WTR) JSN and JKNN at 1.5x P/BV, ASII’s Cikampek - Palimanan toll at 3.2x P/BV, and JSMR’s TMJ stake sale at 3.0x P/BV.
New accounting standards (PSAK 71-72) to improve contractor’s receivable quality and cash flow. PSAK 71 relates to provision of receivables whereby contractors will need to impair receivables based on their age and expected future losses. While PSAK 72 impacts the property business of SOE contractors. It states that revenue recognition of high-rise presales is allowed once the property is handed
49
Ticker Rating CP TP % Chg FY20F P/E
WIKA BUY 2,050 2,510 22.4% 10.4x
PTPP BUY 1,650 1,900 15.2% 10.2x
WSKT NEUTRAL 1,445 1,570 8.7% 19.9x
ADHI BUY 1,225 1,550 26.5% 8.0x
WEGE BUY 296 480 62.2% 8.8x
WTON BUY 440 570 29.5% 8.8x
WSBP NEUTRAL 324 350 8.0% 9.8x
Construction Sector
Source: Company Data, Sinarmas Investment Research
SOE contractors debt to equity ratio
Source: Company Data, Sinarmas Investment Research
SOE contractors new contract
Source: Bloomberg, Sinarmas Investment Research
SOE contractors P/E band
-5
0
5
10
15
20
25
30
35
40
Dec-14 Jul-15 Feb-16 Sep-16 Apr-17 Nov-17 Jun-18 Jan-19 Aug-19
PE -2 SD -1 SD Average +1 SD +2 SD
0.8
1.0
0.7
0.9
1.2
1.41.5
1.71.6
1.4
0.0
0.2
0.4
0.6
0.8
1.0
1.2
1.4
1.6
1.8
0
20
40
60
80
100
120
140
2013 2014 2015 2016 2017 2018 2019E 2020F 2021F 2022F
Debt Equity DER
(IDR tn)
15%
42%
70%
4%
-17%
-3%
19%10%
10%
-30%
-20%
-10%
0%
10%
20%
30%
40%
50%
60%
70%
80%
0
50
100
150
200
250
2014 2015 2016 2017 2018 2019E 2020F 2021F 2022F
WIKA PTPP ADHI WSKT YoY
(IDR tn)(IDR tn)

Construction Sector
PT Wijaya Karya Tbk.
BUY
Steady order book expansion. WIKA booked IDR32tn new contracts in 11M19 (63%/52% of ours/company’s target). If FY19E contract target is a miss, it should translate to greater NC booking in FY20F as it means some of the project booking will be shifted. We bake in 0.1%/12.5%/10% YoY growth for NC in FY19E/FY20F/FY21F with transportation projects being the growth driver for FY20F, i.e. MRT phase 2 and LRT phase 2 totaling up to IDR10tn, as well as toll roads. As order book remains massive at IDR144tn in FY19E (+16.4% YoY), we calculate WIKA’s earnings will rise by 19.3%/5.1%/19.0% in FY19E/FY20F/FY21F. Note that core NPATMI in FY20F represents a 20.8% YoY growth as FY19E NPATMI includes IDR351bn gain on divestment of Surabaya - Mojokerto toll road. New accounting regulations will improve balance sheet quality. We bake in IDR2tn of impairment for PSAK 71 and 72 compliance, in-line with management guidance and implies ~10% dilution of FY19E BV. We are of the view that the new regulations provide contractors an opportunity to kitchen sink and clean their balance sheet, which will provide a clearer and smoother cash flow picture from thereafter. In the long run, we estimate 2% receivable impairment with 30% recovery rate for the time being till further color can be provided by management. Heading into the year end with positive OCF. As turnkey payment for Balikpapan - Samarinda toll road worth IDR5tn will be received in end of 2019, company expects to book positive OCF in FY19E similar to FY18 amount, which was IDR2.7tn. WIKA targets to sustain gearing at 1.1x versus 9M19 level of 1.2x due to existing turnkey projects, namely Kunciran - Cengkareng toll road worth IDR2.5tn and Sumatra Padang - Pekanbaru worth IDR8.7tn. We pick PT Wijaya Karya Tbk. (WIKA) as our top pick in the sector with a BUY rating and a slightly lower end-of-FY20 target price of IDR2,510. Our TP represents 10.4x PE, -1 SD from its 5 years average PE. We like WIKA due to their consistent outperformance in the sector, diverse construction capabilities, and order book growth. Downside risks to our call are: 1) Excessive gearing ramp up, 2) rail projects cancellation or lost tender, and 3) missed payments.
50
Stock Information
Bloomberg Ticker WIKA IJ
52-Week High 2,500
52-Week Low 1,635
FY20F P/E 10.4x
FY20F P/BV 1.4x
Share Outstanding (Mn) 8,970.0
Market Cap. (IDR Tn) 18.4
Share Price Performance
Current Price 2,050
52-Week Target Price 2,510
% Change 22.4%
Highlights (IDR Bn) 2018 2019E 2020F 2021F 2022F
Revenue 31,158 30,443 37,773 44,547 50,533
% growth 19.0% -2.3% 24.1% 17.9% 13.4%
Gross Profit 3,605 3,630 4,377 5,191 5,918
Net Profit 1,730 2,064 2,168 2,580 2,999
% growth 43.9% 19.3% 5.1% 19.0% 16.2%
Gross Margin (%) 11.6% 11.9% 11.6% 11.7% 11.7%
Net Margin (%) 5.6% 6.8% 5.7% 5.8% 5.9%
Return on Equity (%) 12.6% 13.2% 13.1% 14.7% 15.1%
Return on Assets (%) 3.3% 3.5% 3.4% 3.5% 3.6%
EPS (IDR) 193 230 242 288 335

51
Income Statement Cash Flow
Balance Sheet Ratio Analysis
Construction | Wijaya Karya
(IDR Bn) 2018 2019E 2020F 2021F 2022F
Cash & equivalents 13,974 10,537 11,840 12,327 12,994
Receivables 5,351 5,577 5,023 6,138 7,066
Other CA 24,231 22,703 27,796 32,686 37,106
Total CA 43,555 38,817 44,659 51,151 57,165
Fixed assets 4,676 9,164 10,378 11,745 13,256
Intangible Assets 714 714 714 714 714
Other LT Assets 10,284 11,399 13,111 14,570 16,631
Total Assets 59,230 60,095 68,863 78,181 87,767
Payables 13,183 9,917 12,352 14,557 16,501
ST loans 4,497 5,568 13,458 14,628 16,228
Other CL 10,572 10,320 12,724 14,906 16,842
Total CL 28,252 25,804 38,534 44,090 49,572
LT loans 9,092 10,989 5,876 6,147 6,414
Other 4,671 3,932 4,821 5,617 6,324
Total Liabilities 42,015 40,725 49,230 55,854 62,310
Share & APIC 7,453 7,453 7,453 7,453 7,453
Retained Earnings 5,480 7,241 7,091 9,294 11,853
Others & NCI 4,293 4,686 5,099 5,590 6,162
Total Equity 14,804 16,565 16,415 18,617 21,177
Total Liabilities & Equity 59,230 60,095 68,863 78,181 87,767
2018 2019E 2020F 2021F 2022F
Profitability
ROE 12.6% 13.2% 13.1% 14.7% 15.1%
ROA 3.3% 3.5% 3.4% 3.5% 3.6%
Gross Margin 11.6% 11.9% 11.6% 11.7% 11.7%
Operating Margin 9.0% 9.2% 9.2% 9.4% 9.5%
Net Profit Margin 5.6% 6.8% 5.7% 5.8% 5.9%
Liquidity & Solvency
Current Ratio 1.5 1.5 1.2 1.2 1.2
Debt to Equity 0.8 0.9 1.0 0.9 0.9
Debt to Assets 0.2 0.3 0.3 0.3 0.3
Int. Coverage Ratio 3.3 3.9 4.0 4.2 4.4
Valuation
Price to Earnings (P/E) 13.0 10.9 10.4 8.7 7.5
Price to Book (P/BV) 1.5 1.4 1.4 1.2 1.1
Key Assumptions (IDR Bn)
Order Book 123,513 143,769 169,283 191,832 214,353
New Contract 50,560 50,629 56,958 62,654 68,919
Burn Rate 27.1% 24.6% 25.2% 25.5% 25.5%
(IDR Bn) 2018 2019E 2020F 2021F 2022F
Revenue 31,158 30,443 37,773 44,547 50,533
% growth 19.0% -2.3% 24.1% 17.9% 13.4%
Cost of Revenue (27,553) (26,813) (33,396) (39,357) (44,615)
Gross Profit 3,605 3,630 4,377 5,191 5,918
% growth 25.3% 0.7% 20.6% 18.6% 14.0%
Operating Expense (786) (818) (918) (1,019) (1,117)
Others 615 1,665 1,392 1,533 1,721
EBIT 3,434 4,477 4,850 5,705 6,522
% growth 35.9% 30.4% 8.3% 17.6% 14.3%
EBITDA 3,242 4,877 5,329 6,256 7,154
% growth 5.5% 50.4% 9.3% 17.4% 14.4%
Net Financing (349) (868) (977) (1,105) (1,210)
EBT 3,086 3,609 3,874 4,600 5,312
Tax (1,012) (1,152) (1,293) (1,528) (1,741)
NCI 343 393 413 492 571
Net Profit 1,730 2,064 2,168 2,580 2,999
% growth 43.9% 19.3% 5.1% 19.0% 16.2%
(IDR Bn) 2018 2019E 2020F 2021F 2022F
Net Income 1,730 2,064 2,168 2,580 2,999
Depreciation (192) 400 479 551 632
Chg. in NWC 1,151 2,217 (300) 1,618 1,466
CF from Operating 388 246 2,947 1,514 2,165
Capital Expenditure (552) (4,888) (1,693) (1,918) (2,144)
Chg. in LT Assets (4,727) (1,115) (1,712) (1,459) (2,062)
Chg in LT Liabilities 1,608 (739) 889 796 707
CF from Investing (3,095) (6,742) (2,516) (2,581) (3,498)
Chg. in Share & APIC - - - - -
Chg. in ST Loans (2,410) 1,071 7,890 1,170 1,600
Chg. in LT Loans 6,984 1,897 (5,114) 272 267
Dividends Paid 254 302 2,318 378 439
Others 1,107 393 413 492 571
CF from Financing 5,427 3,059 872 1,555 1,999
Beginning Cash 11,254 13,974 10,537 11,840 12,327
Change in Cash 2,720 (3,437) 1,303 488 667
Ending Cash 13,974 10,537 11,840 12,327 12,994
Construction Sector
PT Pembangunan Perumahan Tbk.
BUY
Full recovery eyed in FY21F. PTPP successfully secured IDR27.8tn of new orders as of 11M19 (67%/60% of ours/company’s estimate). This came in better than its peers, although the possibility of falling short still lingers. We expect performance to pick up starting from FY20F with full recovery in FY21F. Our new contract forecast remains conservative and indicates -4.9%/7.5%/10% YoY change in FY19E/FY20F/FY21F. The NC outlook paired with PSAK 71 and 72 impact results in EPS forecast cut of 26.1%/32.8%/32.8% respectively, and -29.4%/9.3%/16.6% YoY change. Eyeing positive OCF in FY19E and divesting assets in FY20F. Management stays confident that FY19E OCF will be +ve with IDR7.2tn of payments to be received in December. For FY20F - FY21F, minimal turnkey exposure and PTPP’s prudent receivables management should result in +ve OCF. Aside from managing its cash flow cautiously, PTPP also aims to divest assets in FY20F in minority investments such as Pandaan - Malang toll road and Medan - Kualanamu - Tebingtinggi toll road to name a few, which we have not included in our model due to divestment uncertainty. Temporary slowdown amidst new accounting regulations. We bake in IDR3tn of retained earnings reduction (17% of FY19E equity) for PSAK 71 and 72 implementation, which is in-line with management’s plan. It comprises of IDR1.2tn for receivable impairment and IDR1.8tn for property net profit reversal. To reduce the impact of PSAK 72 towards earnings volatility, company will shift focus towards landed housing business. As a result, we expect property revenue to drop 50% in FY19E before picking up again by 14%/40% in FY20F/FY21F. As property segment has higher margin, GPM will drop accordingly before picking up in FY21F. We maintain our BUY stance on PT Pembangunan Perumahan Tbk. with a lower end-of-FY20 target price of IDR1,900. Our TP implies 10.2x FY20F P/E, -1 SD from 7 years average, and 1.1x P/BV. Despite the slowdown in the near-term, we like PTPP for their steady order book expansion, reasonable leverage level, and positive OCF. Downside risks to our call stems from: 1) burn rate deceleration, and 2) contract booking delays
52
Stock Information
Bloomberg Ticker PTPP IJ
52-Week High 2,550
52-Week Low 1,340
FY20F P/E 10.2x
FY20F P/BV 1.1x
Share Outstanding (Mn) 6,199.9
Market Cap. (IDR Tn) 10.2
Share Price Performance
Current Price 1,650
52-Week Target Price 1,900
% Change 15.2%
Highlights (IDR Bn) 2018 2019E 2020F 2021F 2022F
Revenue 25,120 26,535 30,200 35,250 40,256
% growth 16.8% 5.6% 13.8% 16.7% 14.2%
Gross Profit 3,546 3,466 3,978 4,803 5,521
Net Profit 1,502 1,060 1,159 1,351 1,651
% growth 3.4% -29.4% 9.3% 16.6% 22.2%
Gross Margin (%) 14.1% 13.1% 13.2% 13.6% 13.7%
Net Margin (%) 6.0% 4.0% 3.8% 3.8% 4.1%
Return on Equity (%) 11.8% 7.8% 10.4% 11.0% 12.2%
Return on Assets (%) 2.9% 1.9% 1.9% 2.0% 2.2%
EPS (IDR) 242 171 187 218 266

53
Construction | Pembangunan Perumahan
(IDR Bn) 2018 2019E 2020F 2021F 2022F
Cash & equivalents 8,647 8,457 3,639 4,557 5,845
Receivables 22,145 23,118 23,376 25,490 26,998
Other CA 6,742 6,729 7,266 8,048 8,775
Total CA 37,534 38,304 34,280 38,095 41,618
Fixed assets 6,605 10,210 17,378 20,158 23,123
Intangible Assets 353 353 353 353 353
Other LT Assets 8,056 8,243 8,564 9,130 9,699
Total Assets 52,549 57,110 60,575 67,736 74,793
Payables 19,571 19,593 22,271 25,859 29,501
ST loans 4,014 4,761 6,621 7,987 8,364
Other CL 2,003 1,730 1,939 2,255 2,637
Total CL 26,523 27,348 32,268 37,768 42,406
LT loans 8,217 10,223 10,655 10,486 10,583
Other 513 673 765 888 1,013
Total Liabilities 36,234 39,593 45,135 50,765 55,951
Share & APIC 5,330 5,330 5,330 5,330 5,330
Retained Earnings 5,274 6,122 3,659 4,740 6,060
Others & NCI 5,711 6,065 6,451 6,901 7,451
Total Equity 16,316 17,517 15,440 16,971 18,842
Total Liabilities & Equity 52,549 57,110 60,575 67,736 74,793
2018 2019E 2020F 2021F 2022F
Profitability
ROE 11.8% 7.8% 10.4% 11.0% 12.2%
ROA 2.9% 1.9% 1.9% 2.0% 2.2%
Gross Margin 14.1% 13.1% 13.2% 13.6% 13.7%
Operating Margin 10.5% 9.4% 9.7% 10.3% 10.5%
Net Profit Margin 6.0% 4.0% 3.8% 3.8% 4.1%
Liquidity
Current Ratio 1.4 1.4 1.1 1.0 1.0
Debt to Equity 0.7 0.8 1.1 1.1 1.0
Debt to Assets 0.2 0.3 0.3 0.3 0.3
Int. Coverage Ratio 3.9 2.8 3.0 3.4 3.9
Valuation
Price to Earning (P/E) 7.8 11.1 10.2 8.7 7.1
Price to Book (P/BV) 0.9 0.9 1.1 1.0 0.9
Key Assumptions (IDR Bn)
Order Book 96,065 108,750 126,108 144,207 162,633
New Contract 43,490 41,355 44,457 48,902 53,793
Burn Rate 29.6% 28.3% 27.0% 27.0% 27.0%
(IDR Bn) 2018 2019E 2020F 2021F 2022F
Revenue 25,120 26,535 30,200 35,250 40,256
% growth 16.8% 5.6% 13.8% 16.7% 14.2%
Cost of Revenue (21,574) (23,070) (26,222) (30,446) (34,735)
Gross Profit 3,546 3,466 3,978 4,803 5,521
% growth 9.1% -2.3% 14.8% 20.7% 14.9%
Operating Expenses 2,628 2,499 2,917 3,630 4,230
Others 184 (480) (710) (1,056) (1,086)
EBIT 2,958 2,362 2,777 3,318 3,814
% growth 11.6% -20.2% 17.6% 19.5% 15.0%
EBITDA 3,383 2,893 3,611 4,450 5,152
% growth -1.0% -14.5% 24.8% 23.2% 15.8%
Net Financing (145) (343) (569) (744) (670)
EBT 2,813 2,019 2,207 2,573 3,144
Tax (854) (606) (662) (772) (943)
NCI 457 353 386 450 550
Net Profit 1,502 1,060 1,159 1,351 1,651
% growth 3.4% -29.4% 9.3% 16.6% 22.2%
(IDR Bn) 2018 2019E 2020F 2021F 2022F
Net Income 1,502 1,060 1,159 1,351 1,651
Depreciation 425 531 834 1,132 1,338
Chg. in NWC 3,040 882 (2,265) (1,238) (2,025)
CF from Operating (1,113) 709 4,258 3,722 5,013
Capital Expenditure 1,276 4,136 8,002 3,912 4,303
Chg. in LT Assets 2,288 186 321 566 569
Chg in LT Liabilities 111 305 234 339 445
CF from Investing (3,453) (4,017) (8,090) (4,139) (4,428)
Chg. in Share & APIC - - - - -
Chg. in ST Loans 500 747 1,860 1,365 378
Chg. in LT Loans 2,759 2,230 389 (210) 104
Dividends Paid 291 212 3,622 270 330
Others 861 353 386 450 550
CF from Financing 3,830 3,118 (987) 1,336 702
Beginning Cash 9,383 8,647 8,457 3,639 4,557
Change in Cash (736) (190) (4,818) 918 1,287
Ending Cash 8,647 8,457 3,639 4,557 5,845
Income Statement Cash Flow
Balance Sheet Ratio Analysis

Construction Sector
PT Waskita Karya Tbk.
NEUTRAL
Order book and core earnings bottoming. WSKT’s mid Nov19 new contract (NC) stood at ~IDR20tn (59%/50% of our/company’s lowered NC target). Despite the potential miss, order book will remain large at IDR101tn (+7.3% YoY) in FY19E. The two drags of NC acquirement are the election year and stretched balance sheet capacity that limits investment and leverage. 2019 should be the bottom as WSKT will receive the below mentioned payments and recycle assets, improving balance sheet capacity to invest in projects. We lower our NC forecast to +24.9%/+16.5%/+10% YoY in FY19E/FY20F/FY21F, which translates to core earnings estimate changes of -47.5%/-67.3%/-59.5% respectively. Note that we are only forecasting core earnings excluding divestment from FY20F onwards as divestment gains are tentative on valuation and timeline. Divestment pipeline and massive cash payment due. The final signing for Solo - Ngawi (JSN) dan Ngawi - Kertosono (JNKK) toll concession sale was completed in Dec19. The assets are valued at 1.5x P/BV (9M19 BV was IDR1,638bn), implying IDR2.5tn payment and IDR819bn gain. Company plans to divest an additional 4 toll roads in 2020 at a minimum 1.5x P/BV. Any future successful divestment is an upside risk to our earnings estimate. On the other hand, WSKT expects to receive IDR26tn of turnkey payments and IDR14tn - IDR18tn of normal payment by 2019 year end. These cash inflow will enable company to reduce leverage to 2.3x in FY19E versus 2.8x in 9M19, while management guides lower gearing ratio at 2.1x in FY20F. We downgrade PT Waskita Karya Tbk. (WSKT) to NEUTRAL with a lower end-of-FY20 target price of IDR1,570. Our TP implies 1.1x P/BV, -1SD of its 5 year average, and 19.9x core P/E. The reasoning behind our valuation is WSKT’s weak core earnings in the short-term. While future successful asset divestments provides an upside risk, there is always the possibility of fall through. Management has not shared color on PSAK 71 and 72 impairment, however, we estimate WSKT will need to impair IDR400bn - IDR600bn, roughly 6% of accounts receivable and gross amount due from customer, similar to its peers. Downside risks are: 1) divestment failure and 2) payment delays.
54
Stock Information
Bloomberg Ticker WSKT IJ
52-Week High 2,230
52-Week Low 1,215
FY20F P/E 19.9x
FY20F P/BV 1.1x
Share Outstanding (Mn) 13,574.0
Market Cap. (IDR Tn) 19.6
Share Price Performance
Current Price 1,445
52-Week Target Price 1,570
% Change 8.7%
Highlights (IDR Bn) 2018 2019E 2020F 2021F 2022F
Revenue 48,789 34,462 40,692 44,323 48,625
% growth 7.9% -29.4% 18.1% 8.9% 9.7%
Gross Profit 8,863 6,484 7,730 8,579 9,590
Net Profit 3,963 2,082 1,073 1,373 1,743
% growth 2.1% -47.5% -48.5% 27.9% 26.9%
Gross Margin (%) 18.2% 18.8% 19.0% 19.4% 19.7%
Net Margin (%) 8.1% 6.0% 2.6% 3.1% 3.6%
Return on Equity (%) 22.0% 10.6% 5.4% 6.5% 7.7%
Return on Assets (%) 3.2% 1.6% 0.8% 1.0% 1.2%
EPS (IDR) 292 153 79 101 128

55
Construction | Waskita Karya
2018 2019E 2020F 2021F 2022F
Profitability
ROE 22.0% 10.6% 5.4% 6.5% 7.7%
ROA 2.6% 2.6% 2.6% 2.6% 2.6%
Gross Margin 18.2% 18.8% 19.0% 19.4% 19.7%
Operating Margin 14.7% 15.0% 15.3% 15.7% 15.9%
Net Profit Margin 8.1% 6.0% 2.6% 3.1% 3.6%
Liquidity
Current Ratio 1.2 0.8 0.7 0.7 0.6
Debt to Equity 2.2 2.3 2.3 2.3 2.1
Debt to Assets 0.5 0.6 0.6 0.6 0.5
Int. Coverage Ratio 3.6 1.9 1.5 1.6 1.8
Valuation
Price to Earning (P/E) 5.4 10.2 19.9 15.5 12.2
Price to Book (P/BV) 1.2 1.1 1.1 1.0 0.9
Key Assumptions (IDR Bn)
Order Book 94,576 101,483 106,846 111,418 117,545
New Contract 27,216 34,000 39,600 43,560 47,916
Burn Rate 44.6% 34.0% 38.0% 40.0% 42.0%
(IDR Bn) 2018 2019E 2020F 2021F 2022F
Revenue 48,789 34,462 40,692 44,323 48,625
% growth 7.9% -29.4% 18.1% 8.9% 9.7%
Cost of Revenue (39,926) (27,978) (32,962) (35,744) (39,035)
Gross Profit 8,863 6,484 7,730 8,579 9,590
% growth -6.3% -26.8% 19.2% 11.0% 11.8%
Operating Expenses (1,668) (1,302) (1,500) (1,630) (1,881)
Others 1,642 1,081 (93) 73 29
EBIT 8,837 6,264 6,137 7,022 7,737
% growth 15.5% -29.1% -2.0% 14.4% 10.2%
EBITDA 9,864 7,091 7,035 7,983 8,764
% growth 14.5% -28.1% -0.8% 13.5% 9.8%
Net Financing (1,811) (2,474) (3,419) (3,803) (3,906)
EBT 7,026 3,790 2,718 3,219 3,831
Tax (2,406) (1,413) (1,493) (1,652) (1,842)
NCI 657 295 152 194 247
Net Profit 3,963 2,082 1,073 1,373 1,743
% growth 105.3% -55.1% -48.5% 27.9% 26.9%
(IDR Bn) 2018 2019E 2020F 2021F 2022F
Net Income 3,963 2,082 1,073 1,373 1,743
Depreciation 631 827 899 961 1,027
Chg. in NWC 9,394 (4,189) (5,703) 962 (7,154)
CF from Operating (4,800) 7,099 7,675 1,372 9,924
Capital Expenditure 9,280 16,874 9,443 7,659 8,080
Chg. in LT Assets 3,284 (24) 17 2 9
Chg in LT Liabilities 682 (2,797) 70 201 473
CF from Investing (11,883) (19,647) (9,389) (7,460) (7,616)
Chg. in Share & APIC 85 - - - -
Chg. in ST Loans 4,079 18,723 1,398 2,057 (3,120)
Chg. in LT Loans 15,191 (8,753) (214) 2,300 247
Dividends Paid 297 416 715 275 349
Others 2,381 860 (60) 785 746
CF from Financing 21,439 10,414 411 4,868 (2,475)
Beginning Cash 6,089 10,846 8,711 7,407 6,187
Change in Cash 4,757 (2,135) (1,304) (1,220) (167)
Ending Cash 10,846 8,711 7,407 6,187 6,020
Income Statement Cash Flow
Balance Sheet Ratio Analysis
(IDR Bn) 2018 2019E 2020F 2021F 2022F
Cash & equivalents 10,846 8,711 7,407 6,187 6,020
Receivables 46,880 38,417 35,236 36,496 33,971
Other CA 9,263 7,398 8,735 9,515 7,688
Total CA 66,989 54,527 51,378 52,198 47,678
Fixed assets 7,091 7,704 7,767 7,585 7,381
Intangible Assets 42,229 57,663 66,145 73,024 80,281
Other LT Assets 8,082 8,058 8,075 8,077 8,086
Total Assets 124,392 127,952 133,365 140,884 143,427
Payables 23,411 18,979 23,297 24,301 26,557
ST loans 28,376 47,099 48,497 50,554 47,434
Other CL 2,202 3,306 2,846 2,921 3,466
Total CL 56,800 69,384 74,641 77,776 77,457
LT loans 32,902 24,148 23,935 26,234 26,482
Other 3,578 3,006 3,077 3,278 3,751
Total Liabilities 95,504 96,539 101,652 107,288 107,690
Share & APIC 6,909 6,909 6,909 6,909 6,909
Retained Earnings 10,347 12,013 12,372 13,470 14,864
Others & NCI 11,630 12,491 12,431 13,216 13,963
Total Equity 28,887 31,413 31,712 33,596 35,736
Total Liabilities & Equity 124,392 127,952 133,365 140,884 143,427

Construction Sector
PT Adhi Karya Tbk.
BUY
Recovery impending post FY19E lackluster achievement. ADHI managed to book IDR9.1tn new contracts in 11M19 (58%/35% of ours/company’s lowered estimates), which are dominated by construction projects. The reason for the missed achievement was several delayed and lost project tenders including Jogja - Solo toll road worth ~IDR8tn postponed to 2020 and others. On the bright side, we forecast ADHI will secure IDR27.3tn (+75% YoY) new contracts in FY20F (78% of company guidance), which is attainable as Jogja - Solo toll road itself is roughly 29% of FY20F target and LRT phase 2 will be tendered in 2H20 with a total contract size of around IDR23tn. While for the medium term, we estimate new contracts to grow at 28.4% FY19E - FY22F CAGR. We cut FY19E/FY20F NPATMI forecast by 7.5%/29% and our new numbers signify a YoY growth of 6.1%/21.4%. PSAK 71 and 72 to reduce equity by IDR1.1tn. ADHI will be impairing ~IDR200bn (1.1% of 9M19 trade receivables and gross amount due from customers) for PSAK 71 and another ~IDR900bn to comply with PSAK 72 from property segment net profit reversal. We forecast property revenue to drop 62% YoY in FY20F (4.3% of revenue in FY20F) prior to rebounding to 10% of revenue by FY20F - FY21F. Note that 9M19 property revenue is 11.6% of total revenue. Due to PSAK 71 regulation being new, management is not yet able to provide color on recovery rate and the new normal for future impairment of receivable rate. We estimate net impairment of receivables to be 0.8% - 1.2% of receivables in FY19E - FY22F We maintain our BUY call on Adhi Karya Tbk. (ADHI) with a lower end-of-FY20 target price of IDR1,550. Our TP implies 8.0x FY20F P/E and , -1 SD of its 5 years average P/E. Our stance is built on the consideration that valuation is currently undemanding as ADHI will generate 10.9% ROE with our TP representing 0.9x P/BV and the medium-long term growth outlook in the sector remains favorable. Upside risks to our call are: 1) significant new order growth in FY20F post FY19E delayed tenders, 2) obtaining LRT phase 2 project, 3) timely payments. Downside risks are: 1) Slower burn rate, 2) missed new contract achievement, and 3) low receivable recovery rate.
56
Stock Information
Bloomberg Ticker ADHI IJ
52-Week High 1,845
52-Week Low 1,060
FY20F P/E 8.0x
FY20F P/BV 0.9x
Share Outstanding (Mn) 3,560.8
Market Cap. (IDR Tn) 4.4
Share Price Performance
Current Price 1,225
52-Week Target Price 1,550
% Change 26.5%
Highlights (IDR Bn) 2018 2019E 2020F 2021F 2022F
Revenue 15,655 15,574 17,819 20,859 24,207
% growth 3.3% -0.5% 14.4% 17.1% 16.1%
Gross Profit 2,507 2,346 2,567 3,027 3,493
Net Profit 644 651 690 838 1,013
% growth 25.0% 1.0% 6.1% 21.4% 20.9%
Gross Margin (%) 16.0% 15.1% 14.4% 14.5% 14.4%
Net Margin (%) 4.1% 4.2% 3.9% 4.0% 4.2%
Return on Equity (%) 10.3% 9.6% 10.9% 11.9% 12.9%
Return on Assets (%) 2.1% 2.1% 2.0% 2.1% 2.5%
EPS (IDR) 181 183 194 235 285
57
Construction | Adhi Karya
(IDR Bn) 2018 2019E 2020F 2021F 2022F
Cash & equivalents 3,263 2,613 3,953 4,534 5,340
Receivables 15,351 16,576 17,257 19,915 20,459
Other CA 6,815 6,641 7,598 8,828 9,250
Total CA 25,430 25,830 28,809 33,277 35,050
Fixed assets 1,573 1,658 1,821 2,011 2,224
Intangible Assets - - - - -
Other LT Assets 3,116 3,857 3,630 3,715 3,803
Total Assets 30,119 31,345 34,260 39,003 41,077
Payables 12,548 12,175 14,037 16,412 19,064
ST loans 3,914 4,785 5,484 8,948 6,780
Other CL 2,503 2,377 2,736 3,200 3,716
Total CL 18,964 19,336 22,258 28,560 29,560
LT loans 4,640 5,031 5,455 3,200 3,437
Other 229 170 188 210 236
Total Liabilities 23,833 24,537 27,900 31,971 33,233
Share & APIC 2,945 2,945 2,945 2,945 2,945
Retained Earnings 2,993 3,513 3,066 3,737 4,547
Others & NCI 348 350 349 351 353
Total Equity 6,285 6,808 6,360 7,032 7,845
Total Liabilities & Equity 30,119 31,345 34,260 39,003 41,077
2018 2019E 2020F 2021F 2022F
Profitability
ROE 10.3% 9.6% 10.9% 11.9% 12.9%
ROA 2.1% 2.1% 2.0% 2.1% 2.5%
Gross Margin 16.0% 15.1% 14.4% 14.5% 14.4%
Operating Margin 11.5% 10.0% 9.9% 10.0% 9.9%
Net Profit Margin 4.1% 4.2% 3.9% 4.0% 4.2%
Liquidity
Current Ratio 1.3 1.3 1.3 1.2 1.2
Debt to Equity 1.4 1.4 1.7 1.7 1.3
Debt to Assets 0.3 0.3 0.3 0.3 0.2
Int. Coverage Ratio 3.2 2.7 2.7 2.9 3.3
Valuation
Price to Earning (P/E) 8.6 8.5 8.0 6.6 5.4
Price to Book (P/BV) 0.9 0.8 0.9 0.8 0.7
Key Assumptions (IDR Bn)
Order Book 61,131 51,938 73,120 85,021 96,850
New Contract 24,819 15,600 27,300 30,030 33,033
Burn Rate 40.3% 30.0% 28.0% 27.5% 27.5%
(IDR Bn) 2018 2019E 2020F 2021F 2022F
Revenue 15,655 15,574 17,819 20,859 24,207
% growth 3.3% -0.5% 14.4% 17.1% 16.1%
Cost of Revenue (13,149) (13,228) (15,252) (17,832) (20,714)
Gross Profit 2,507 2,346 2,567 3,027 3,493
% growth 21.8% -6.4% 9.4% 17.9% 15.4%
Operating Expenses (708) (786) (811) (949) (1,101)
Others (323) (619) (688) (850) (885)
EBIT 1,692 1,685 1,845 2,144 2,384
% growth 20.6% -0.4% 9.5% 16.2% 11.2%
EBITDA 1,868 1,860 2,048 2,378 2,655
% growth 22.4% -0.4% 10.1% 16.1% 11.6%
Net Financing (524) (566) (619) (678) (643)
EBT 1,168 1,119 1,226 1,466 1,741
Tax (523) (467) (535) (626) (726)
NCI 1 1 1 1 2
Net Profit 644 651 690 838 1,013
% growth 25.0% 1.0% 6.1% 21.4% 20.9%
(IDR Bn) 2018 2019E 2020F 2021F 2022F
Net Income 644 651 690 838 1,013
Depreciation 176 175 203 235 271
Chg. in NWC 276 1,549 (584) 1,050 (2,202)
CF from Operating 545 (723) 1,477 23 3,487
Capital Expenditure 229 260 366 425 484
Chg. in LT Assets 1,121 742 (227) 85 88
Chg in LT Liabilities 1,121 742 (227) 85 88
CF from Investing (1,285) (1,061) (121) (487) (547)
Chg. in Share & APIC - - - - -
Chg. in ST Loans 127 871 699 3,464 (2,169)
Chg. in LT Loans (26) 391 424 (2,254) 237
Dividends Paid 97 130 1,138 168 203
Others (132) 2 - 2 2
CF from Financing (128) 1,134 (16) 1,044 (2,133)
Beginning Cash 4,131 3,263 2,613 3,953 4,534
Change in Cash (868) (650) 1,340 580 807
Ending Cash 3,263 2,613 3,953 4,534 5,340
Income Statement Cash Flow
Balance Sheet Ratio Analysis

Construction Sector
PT Wijaya Karya Bangunan Gedung Tbk.
BUY
Potential new order realization delay, but long-term outlook still highly attractive. WEGE acquired IDR5.5tn of NC as of 11M19 (54%/46% of ours/company’s estimate). One large sized project worth ~IDR2tn in 2019’s pipeline may potentially be secured in 2020 instead. We forecast NC will grow by 15% in FY20F to reach IDR 11.7tn and bake in a 10% annual NC growth per annum thereafter. We made some adjustments to our model and cut FY19E/FY20F/FY21F earnings by 8.4%/9.5%/2.5% respectively. Even then, WEGE will still produce solid NPATMI growth of 3.8%/14.2%/23.5%. Improving OCF and leveraging up. Company targets year end OCF to be roughly +ve IDR100bn on the back of better receivable collection strategy. To fuel its upcoming concession projects, WEGE has increased gearing to 0.2x from zero. We view that a certain level of leverage is preferable to fuel progress especially for a rapidly growing company such as WEGE. Capital city relocation opportunity and modular growth. WEGE is strategically positioned to benefit from the capital city relocation due to its expertise. One opportunity that can be seized is the presidential palace project, which is funded by the national budget, is WEGE’s specialty segment. Additionally, management mentioned that the demand and interest for modular construction, which has higher margin and is one of WEGE’s business strategy going forward, has been positive and is gaining traction. Undemanding valuation amidst favorable sector outlook, capital city relocation, and modular expansion. We maintain our BUY call with a TP of IDR480, implying 8.7x FY20F P/E, which is a 15% discount from WIKA’s target P/E. We believe our valuation multiple is warranted as WEGE’s ROE is the highest in the sector at 20.8% in FY20F post IDR220bn of PSAK 71 impairment taken from retained earnings. WEGE’s core business, which is building construction will benefit from BI easing cycle. As company’s long term growth outlook is still highly attractive, WEGE is one of our top picks in the construction sector. Downside risks to our call are: 1) lower than expected NC achievement, and 2) higher than expected impairment of receivables.
58
Stock Information
Bloomberg Ticker WEGE IJ
52-Week High 434
52-Week Low 236
FY20F P/E 8.8x
FY20F P/BV 1.8x
Share Outstanding (Mn) 9,572.0
Market Cap. (IDR Tn) 2.8
Share Price Performance
Current Price 296
52-Week Target Price 480
% Change 62.2%
Highlights (IDR Bn) 2018 2019E 2020F 2021F 2022F
Revenue 5,823 6,169 7,567 9,559 11,263
% growth 49.3% 6.0% 22.7% 26.3% 17.8%
Gross Profit 597 622 772 977 1,173
Net Profit 444 461 527 650 772
% growth 50.6% 3.8% 14.2% 23.5% 18.8%
Gross Margin (%) 10.2% 10.1% 10.2% 10.2% 10.4%
Net Margin (%) 7.6% 7.5% 7.0% 6.8% 6.9%
Return on Equity (%) 23.3% 20.2% 20.8% 23.0% 23.2%
Return on Assets (%) 8.5% 7.6% 7.5% 7.5% 7.4%
EPS (IDR) 46 48 55 68 81

59
Construction | Wijaya Karya Bangunan Gedung
(IDR Bn) 2018 2019E 2020F 2021F 2022F
Cash & Equivalents 1,766 703 888 731 1,069
Receivables 2,806 3,549 3,939 4,976 5,863
Other CA 702 1,103 1,353 1,709 2,014
Total CA 5,275 5,355 6,180 7,416 8,946
Fixed Assets 222 343 451 567 686
Intangible Assets - - - - -
Other LT Assets 393 595 1,201 1,610 1,617
Total Assets 5,890 6,293 7,833 9,593 11,249
Payables 2,696 2,154 2,824 3,567 4,194
ST Loans - 357 577 667 751
Other CL 184 513 627 791 930
Total CL 2,880 3,023 4,029 5,024 5,875
LT Loans - - - - -
Other 873 787 1,173 1,482 1,746
Total Liabilities 3,753 3,811 5,202 6,506 7,621
Share & APIC 1,480 1,480 1,480 1,480 1,480
Retained Earnings 523 523 523 523 523
Others & NCI 34 34 34 34 35
Total Equity 2,137 2,483 2,632 3,087 3,628
Total Equity & Lia-bilities 5,890 6,293 7,833 9,593 11,249
2018 2019E 2020F 2021F 2022F
Profitability
ROE 23.3% 20.2% 20.8% 23.0% 23.2%
ROA 8.5% 7.6% 7.5% 7.5% 7.4%
Gross Margin 10.2% 10.1% 10.2% 10.2% 10.4%
Operating Margin 8.9% 8.8% 9.0% 9.1% 9.3%
Net Profit Margin 7.6% 7.5% 7.0% 6.8% 6.9%
Liquidity
Current Ratio 1.8 1.8 1.5 1.5 1.5
Debt to Equity N/A 0.1 0.2 0.2 0.2
Debt to Assets N/A 0.1 0.1 0.1 0.1
ICR 1330.5 61.3 24.1 22.5 23.4
Valuation
Price to Earnings (P/E) 10.3 10.0 8.8 7.1 5.9
Price to Book (P/BV) 2.2 1.9 1.8 1.5 1.3
Key Assumptions (IDR Bn)
Order Book 16,416 23,166 28,841 33,340 37,539
New Contract 7,454 10,186 11,714 12,886 14,174
Burn Rate 44.5% 31.0% 29.0% 30.0% 30.0%
(IDR Bn) 2018 2019E 2020F 2021F 2022F
Revenue 5,823 6,169 7,567 9,559 11,263
% growth 49.3% 6.0% 22.7% 26.3% 17.8%
Cost of Revenue (5,226) (5,547) (6,795) (8,582) (10,091)
Gross Profit 597 622 772 977 1,173
% growth 28.7% 4.3% 24.0% 26.6% 20.0%
Operating Expense (78) (76) (93) (108) (122)
Others 87 62 58 68 79
EBIT 619 657 786 981 1,160
EBITDA 638 678 822 1,032 1,229
% growth 44.0% 6.4% 21.2% 25.5% 19.1%
Net Financing 48 20 (13) (23) (27)
Profit from JV 51 90 95 97 100
EBT 618 646 754 937 1,110
Tax (174) (185) (227) (287) (338)
NCI - - - - -
Net Profit 444 461 527 650 772
% growth 50.6% 3.8% 14.2% 23.5% 18.8%
(IDR Bn) 2018 2019E 2020F 2021F 2022F
Net Income 444 461 527 650 772
Depreciation 19 21 36 51 69
Chg. in NWC (304) 1,357 (146) 487 425
CF from Operating 767 (875) 708 214 416
Capital Expenditure 41 142 144 167 188
Chg. In LT Assets 155 202 606 409 7
Chg. in LT Liabilities 141 (86) 386 309 264
CF from Investing (55) (430) (365) (267) 69
Chg. In Share & APIC - - - - -
Chg. in ST Loans (613) 357 220 90 84
Chg. in LT Loans - - - - -
Dividends Paid 57 115 378 195 232
Others 25 - - - -
CF from Financing (645) 242 (158) (105) (147)
Beginning Cash 1,699 1,766 703 888 731
Change in Cash 67 (1,063) 186 (157) 338
Ending Cash 1,766 703 888 731 1,069
Income Statement Cash Flow
Balance Sheet Ratio Analysis

Construction Sector
PT Wijaya Karya Beton Tbk.
BUY
Fair new contract achievement. WTON managed to secure IDR5.2tn new contracts (60%/57% of our/company’s estimate) as of 10M19. Top three projects obtained YTD are Pekanbaru - Padang toll road (IDR692bn), Bogor Outer Ring Road (IDR221bn), and Balikpapan - Samarinda toll road (IDR215bn). We expect WTON to continue its performance and grow its new contract achievement by 12.5% in FY20F and expand at a 11.6% CAGR in FY19E - FY22F. Even though NC obtained might miss in FY19E, top line will still grow healthily at a 14.2% FY19E - FY22F CAGR due to contract carryover of IDR6.4tn in FY19E. Robust earnings growth despite PSAK 71 impairment. Effective starting from 1 January 2020, WTON will impair IDR280bn (12.8% of receivables) to comply with the new accounting regulation. WTON will deduct IDR200bn of retained earnings and record an additional IDR80bn impairment expense on the income statement. Going forward, we forecast 7% impairment of receivables annually post the initial impairment based on the company’s provision policy according to receivables aging schedule. Despite the additional impairment expense from PSAK 71, we estimate WTON’s earnings to rise 7.0% YoY in FY19E and by 13.3% CAGR in FY19E - FY22F. Capacity expansion and ending the year with +ve OCF. WTON plans to expand its capacity to 4mn tons/year in FY20F as currently utilization rate is over 99% amidst high demand. Despite having recorded –ve OCF of IDR797bn in 9M19, company expects year end OCF to be approximately +ve IDR400bn. This consistent end of year +ve OCF balance should assist in keeping gearing ratio under control below 1.0x We upgrade PT Wijaya Karya Beton Tbk. (WTON) to BUY from ADD with end-of-FY20 target price of IDR570. Our TP implies 8.8x FY20F PE, which is a 15% discount from our target P/E for its parent and reflects –0.8 SD its 3 years average. WTON’s performance remains solid despite a challenging year for the whole sector while its future outlook remains promising. Risks to our call are: 1) missed new contract growth, 2) payment and project delays, and 3) worse than expected receivables impairment.
60
Stock Information
Bloomberg Ticker WTON IJ
52-Week High 680
52-Week Low 366
FY20F P/E 8.8x
FY20F P/BV 1.3x
Share Outstanding (Mn) 8,715.5
Market Cap. (IDR Tn) 3.8
Share Price Performance
Current Price 440
52-Week Target Price 570
% Change 29.5%
Highlights (IDR Bn) 2018 2019E 2020F 2021F 2022F
Revenue 6,931 7,353 8,732 9,668 10,950
% growth 29.2% 6.1% 18.8% 10.7% 13.3%
Gross Profit 882 965 1,120 1,226 1,406
Net Profit 486 520 567 645 755
% growth 44.2% 7.0% 9.1% 13.7% 17.1%
Gross Margin (%) 12.7% 13.1% 12.8% 12.7% 12.8%
Net Margin (%) 7.0% 7.1% 6.5% 6.7% 6.9%
Return on Equity (%) 15.9% 14.8% 15.2% 15.3% 15.8%
Return on Assets (%) 5.5% 5.8% 5.5% 5.7% 6.0%
EPS (IDR) 56 60 65 74 87

61
Construction | Wijaya Karya Beton
(IDR Bn) 2018 2019E 2020F 2021F 2022F
Cash & equivalents 865 914 1,157 974 1,053
Receivables 1,213 1,213 1,093 1,346 1,501
Other CA 3,467 3,071 3,603 3,997 4,493
Total CA 5,871 5,544 6,264 6,772 7,561
Fixed assets 2,948 3,430 3,946 4,432 5,035
Intangible Assets - - - - -
Other LT Assets 63 62 62 62 62
Total Assets 8,882 9,036 10,272 11,266 12,658
Payables 1,146 1,278 1,522 1,688 1,909
ST loans 1,455 1,721 2,149 2,099 2,396
Other CL 2,647 1,998 2,337 2,735 3,047
Total CL 5,248 4,996 6,009 6,523 7,352
LT loans 350 350 350 350 350
Other 107 107 107 107 107
Total Liabilities 5,745 5,454 6,466 6,980 7,809
Share & APIC 1,845 1,845 1,845 1,845 1,845
Retained Earnings 1,278 1,668 1,894 2,378 2,944
Others & NCI 14 70 67 64 60
Total Equity 3,137 3,583 3,805 4,286 4,849
Total Liabilities & Equity 8,882 9,036 10,272 11,266 12,658
2018 2019E 2020F 2021F 2022F
Profitability
ROE 15.9% 14.8% 15.2% 15.3% 15.8%
ROA 5.5% 5.8% 5.5% 5.7% 6.0%
Gross Margin 12.7% 13.1% 12.8% 12.7% 12.8%
Operating Margin 10.6% 10.9% 10.8% 10.7% 10.9%
Net Profit Margin 7.0% 7.1% 6.5% 6.7% 6.9%
Liquidity
Current Ratio 1.1 1.1 1.0 1.0 1.0
Debt to Equity 0.6 0.6 0.7 0.6 0.6
Debt to Assets 0.2 0.2 0.2 0.2 0.2
Int. Coverage Ratio 7.5 5.7 5.8 5.8 6.5
Valuation
Price to Earning (P/E) 10.2 9.6 8.8 7.7 6.6
Price to Book (P/BV) 1.6 1.4 1.3 1.2 1.0
Key Assumptions (IDR Bn)
Order Book 12,784 15,014 16,630 18,344 20,958
New Contract 7,664 8,623 9,485 10,434 11,999
Burn Rate 61.7% 53.5% 55.0% 55.0% 55.0%
(IDR Bn) 2018 2019E 2020F 2021F 2022F
Revenue 6,931 7,353 8,732 9,668 10,950
% growth 29.2% 6.1% 18.8% 10.7% 13.3%
Cost of Revenue (6,048) (6,388) (7,612) (8,442) (9,544)
Gross Profit 882 965 1,120 1,226 1,406
% growth 32.4% 9.4% 16.0% 9.5% 14.7%
Operating Expenses (150) (163) (177) (192) (207)
Others (23) (12) (84) (57) (77)
EBIT 709 790 859 977 1,121
% growth 40.6% 11.4% 8.8% 13.8% 14.7%
EBITDA 935 1,036 1,155 1,323 1,515
% growth 36.9% 10.8% 11.5% 14.5% 14.5%
Net Financing (90) (131) (141) (160) (165)
EBT 619 658 718 817 956
Tax (133) (141) (154) (175) (205)
NCI 382 (2,587) (2,823) (3,211) (3,758)
Net Profit 486 520 567 645 755
% growth 44.2% 7.0% 9.1% 13.7% 17.1%
(IDR Bn) 2018 2019E 2020F 2021F 2022F
Net Income 486 520 567 645 755
Depreciation 226 246 296 346 394
Chg. in NWC 270 141 (107) 128 178
CF from Operating 442 625 970 863 971
Capital Expenditure 471 729 812 832 997
Chg. in LT Assets 26 (1) - - -
Chg in LT Liabilities 43 (40) - - -
CF from Investing (454) (767) (812) (832) (997)
Chg. in Share & APIC - - - - -
Chg. in ST Loans 10 266 429 (51) 297
Chg. in LT Loans 350 - - - -
Dividends Paid 122 130 142 161 189
Others - 58 - - -
CF from Financing 239 191 284 (215) 104
Beginning Cash 638 865 914 1,157 974
Change in Cash 227 49 443 (183) 79
Ending Cash 865 914 1,357 974 1,053
Income Statement Cash Flow
Balance Sheet Ratio Analysis

Construction Sector
PT Waskita Beton Precast Tbk.
NEUTRAL
Soft FY19E new contract accomplishment. As of 11M19, WSBP recorded IDR5.9tn (+21% YoY, 84% of our estimate and company's lowered guidance). This year’s underperformance was caused by the election year and also partly due to its reliance to internal contracts from WSKT. 11M19’s NC was 60% contributed externally and 40% internally from WSKT. Regardless of FY19E’s flattish new order growth, we see the company’s strategy to steadily diversify its contract source to be a positive in the long run. We estimate NC to grow by 36% in FY20F to IDR9.5tn (80% of company’s guidance) from FY19E’s low base. Low teens earnings growth caused by PSAK 71 impairment. WSBP plans to impair IDR150bn of receivables as an expense in the income statement to comply with PSAK 71. This drags earnings to grow only by 13.8% YoY in FY20F, however NPATMI will jump 21.4% in FY21F. Company shares that receivable impairment in PSAK 71 depends on days past due according to each project’s payment scheme. For turnkey projects, even if receivables has been outstanding for over a year, it might not need be impaired if the project agreement specifies that payment will be received after project completion. However, the exact details is yet to be clear. Margin to normalize due to reduced turnkey projects. We estimate that gross margin will drop 290 bps in FY19E and normalize to 21.5% in FY22F as there is only one turnkey project left in the order book set to finish in 1H20. Management prefers more turnkey projects due to its higher GPM but it seems unlikely in the near term as turnkey projects are mostly internal from WSKT and WSKT’s balance sheet is not able to support more turnkey projects at the moment. We maintain our NEUTRAL call on PT Waskita Beton Precast Tbk. (WSBP) with an end-of-FY20 target price of IDR350. Our TP implies 9.8x FY20F P/E and 1.0x P/BV. We believe this is fair given WSBP’s ROE of 10.2% in FY20F. Upside risk to our call is a surprise beat on new contract achievement as our estimates are conservative given historic performance. Downside risks to our call are: 1) unsuccessful diversification of project source, and 2) another lackluster year.
62
Stock Information
Bloomberg Ticker WSBP IJ
52-Week High 452
52-Week Low 288
FY20F P/E 9.8x
FY20F P/BV 1.0x
Share Outstanding (Mn) 26,361.2
Market Cap. (IDR Tn) 8.5
Share Price Performance
Current Price 324
52-Week Target Price 350
% Change 8.0%
Highlights (IDR Bn) 2018 2019E 2020F 2021F 2022F
Revenue 8,000 7,867 8,891 9,617 10,491
% growth 12.6% -1.7% 13.0% 8.2% 9.1%
Gross Profit 1,846 1,587 1,889 2,076 2,260
Net Profit 1,103 815 927 1,126 1,215
% growth 10.3% -26.1% 13.8% 21.4% 8.0%
Gross Margin (%) 23.1% 20.2% 21.2% 21.6% 21.5%
Net Margin (%) 13.8% 10.4% 10.4% 11.7% 11.6%
Return on Equity (%) 14.0% 9.6% 10.2% 11.4% 11.3%
Return on Assets (%) 7.2% 4.7% 5.1% 5.5% 5.4%
EPS (IDR) 43 31 36 43 47

63
Construction | Waskita Beton Precast
(IDR Bn) 2018 2019E 2020F 2021F 2022F
Cash & equivalents 1,299 968 1,390 1,448 1,696
Receivables 5,518 7,338 8,079 9,542 10,351
Other CA 3,440 2,813 2,812 3,092 3,356
Total CA 10,236 11,106 12,268 14,066 15,387
Fixed assets 4,726 5,077 4,921 5,367 5,820
Intangible Assets - - - - -
Other LT Assets 260 1,126 1,126 1,126 1,126
Total Assets 15,222 17,309 18,315 20,559 22,333
Payables 1,688 2,806 3,542 3,879 4,206
ST loans 5,463 5,379 4,989 6,093 6,673
Other CL 176 160 171 187 203
Total CL 7,327 8,346 8,702 10,159 11,082
LT loans - 496 496 496 496
Other 10 14 14 14 14
Total Liabilities 7,340 8,856 9,213 10,669 11,593
Share & APIC 6,581 6,581 6,581 6,581 6,581
Retained Earnings 1,770 2,341 2,990 3,778 4,629
Others & NCI (469) (469) (469) (469) (469)
Total Equity 7,882 8,453 9,102 9,890 10,741
Total Liabilities & Equity 15,222 17,309 18,315 20,559 22,333
2018 2019E 2020F 2021F 2022F
Profitability
ROE 14.0% 9.6% 10.2% 11.4% 11.3%
ROA 7.2% 4.7% 5.1% 5.5% 5.4%
Gross Margin 23.1% 20.2% 21.2% 21.6% 21.5%
Operating Margin 20.6% 17.3% 17.1% 18.7% 18.7%
Net Profit Margin 13.8% 10.4% 10.4% 11.7% 11.6%
Liquidity
Current Ratio 1.4 1.3 1.4 1.4 1.4
Debt to Equity 0.7 0.7 0.6 0.7 0.7
Debt to Assets 0.4 0.3 0.3 0.3 0.3
Int. Coverage Ratio 5.2 4.7 5.1 5.7 5.4
Valuation
Price to Earning (P/E) 8.2 11.1 9.8 8.1 7.5
Price to Book (P/BV) 1.2 1.1 1.0 0.9 0.8
Key Assumptions (IDR Bn)
Order Book 17,345 16,810 19,955 21,759 23,832
New Contract 6,665 6,998 9,518 10,469 11,516
Burn Rate 47.5% 44.5% 46.0% 46.0% 46.0%
(IDR Bn) 2018 2019E 2020F 2021F 2022F
Revenue 8,000 7,867 8,891 9,617 10,491
% growth 12.6% -1.7% 13.0% 8.2% 9.1%
Cost of Revenue (6,154) (6,280) (7,002) (7,541) (8,231)
Gross Profit 1,846 1,587 1,889 2,076 2,260
% growth -5.2% -14.0% 19.0% 9.9% 8.9%
Operating Expenses (196) (224) (373) (280) (301)
Others 64,870 70,801 80,022 86,555 94,417
EBIT 1,715 1,434 1,596 1,883 2,053
% growth 12.0% -16.4% 11.3% 17.9% 9.1%
EBITDA 2,103 1,924 2,152 2,525 2,791
% growth 10.4% -8.5% 11.8% 17.4% 10.5%
Net Financing (321) (295) (301) (318) (363)
EBT 1,394 1,139 1,296 1,565 1,691
Tax (252) (285) (324) (391) (423)
NCI - - - - -
Net Profit 1,103 815 927 1,126 1,215
% growth 10.3% -26.1% 13.8% 21.4% 8.0%
(IDR Bn) 2018 2019E 2020F 2021F 2022F
Net Income 1,103 815 927 1,126 1,215
Depreciation 389 490 555 642 738
Chg. in NWC (868) 99 (8) 1,389 728
CF from Operating 2,360 1,206 1,490 379 1,225
Capital Expenditure 1,966 840 399 1,088 1,192
Chg. in LT Assets 64 866 - - -
Chg in LT Liabilities 3 2 - - -
CF from Investing (2,027) (1,705) (399) (1,088) (1,192)
Chg. in Share & APIC - - - - -
Chg. in ST Loans 475 (84) (390) 1,104 580
Chg. in LT Loans - 496 - - -
Dividends Paid 747 245 278 338 365
Others 210 - - - -
CF from Financing (63) 167 (668) 766 216
Beginning Cash 1,028 1,299 968 1,390 1,448
Change in Cash 271 (331) 423 57 249
Ending Cash 1,299 968 1,390 1,448 1,696
Income Statement Cash Flow
Balance Sheet Ratio Analysis

Consumer Staples Sector
Potential Shrinking Pocket Size
NEUTRAL
Flattish social welfare budget allocation. The 2020
allocation for social welfare programs remains ample,
accounted for IDR 372.5tn, however only grow by 1%
YoY. We believe the flattish growth is pointing to the
shifting government’s focus more toward human capital
development through education and healthcare.
Education budget remains the same at 20% to total
budget while healthcare’s sees a bigger portion of 5.2%
next year (from previously 5%), equivalent to IDR
508.1tn and IDR 132.2tn respectively (+6.2% and
+13% YoY growth).
Shifting more to non-cash assistance. Regarding to
social assistance, government also puts more emphasis
on food subsidies (BPNT) rather than the conditional
cash transfer (PKH) next year, which is reflected by the
rising BPNT budget to IDR 28tn (+34.6% YoY) while
FY19E: not bad but not impressive as well.
Initially, we have high hopes for consumption recovery
to be more sound in 2019 following the abundant social
assistance budget (+32.8% from initial budget)
coupled with the legislative and presidential election
taking place in 1H19. However, household consumption
turned out to be growing moderately at 5.17%/5.01%
in 2Q/3Q19 respectively, did not show much changes
from the previous year. The modest consumption
recovery was also indicated by Nielsen’s 1H19 finding
of limited 1.8% YoY FMCG growth that all came from
ASP, as volume saw a 3.5% YoY decline. The staples
under our coverage managed to record sales growth of
7.6% as of 9M19, however we noticed it mostly came
from the companies that were innovative and actively
launching many new products in 2019. Another positive
thing in 2019 was most commodity based staples have
experienced mounting margins on the back of subdued
soft commodity prices along the year.
Anticipating spending constraint. Looking forward,
we foresee that next year’s consumption level will not
be too much different from 2019’s. This is due to the
concern on potential weakening purchasing power
driven by: 1) lower direct stimulus from government in
term of cash transfer, 2) higher living expenses, and 3)
moderate province minimal wage growth. All those
factors if we conclude may dampen purchasing power
and limit spending, particularly for low to middle
income classes, which may provide headwinds for the
overall staples sector.
64
Source: APBN 2020, MoF, Sinarmas Investment Research
Social welfare budget allocation (IDR Tn)
247.6258.4
271.5
346.3369.1 372.5
2015 2016 2017 2018 Outlook 2019 APBN 2020
+4.4% +5.1% +27.6% +6.6% +0.9%

Consumer Staples | Sector Outlook
low at least until 9M19, consequently most staples such
as ICBP, MYOR, and ROTI have experienced peaking
margins until 3Q19. However with the soft commodities
started signaling price uptrend (e.q. CPO and skim milk
powder have jumped by ~30-40%) and commodity
prices that will not be forever low, we expect margin
expansion ahead is unlikely and may normalize at any
time soon. Shrinking margins may as well come from a
lack of price adjustment options for staples amidst the
weak demand and intense competition environment.
We lower our stance to NEUTRAL for staples
sector. Our call is mainly on the concern that
consumption level will be nowhere from 2019’s. In
addition, staples’ margins are expected to normalize
following the soft commodities prices uptrend. Hence,
staples will face difficulties in bringing out satisfying
both top and bottom-line growth next year. Our top
picks in the sector are INDF and ROTI. We favor INDF
due to its exposure to commodity-related businesses
(Bogasari and agribusiness) which will be beneficial for
rising wheat and CPO prices, while ICBP normalizes.
INDF remains attractive on valuation perspective.
Meanwhile for ROTI, robust top-line growth may persist
on 2 additional new plants, strong GT distribution and
ASP adjustment next year. At the same time, ROTI’s
EBIT margin will keep on expanding on operating
efficiency.
PKH budget is scaled down by 15.4% to IDR 29.1tn.
The implication is that the 15.6mn food subsidy
recipients will be given daily staples consisting of rice,
eggs and other sources of nutrition worth of IDR 150k
monthly starting next year (vs IDR 100k per month in
2019). Meanwhile on the PKH program, government
decides to remove the fixed/regular assistance worth of
IDR 550k per household, means that each household
will only get PKH disbursement if they meet the
components such as pregnant mother, school children,
elderly, and etc. Although food subsidy may as well aid
purchasing power, yet we believe the impact may not
be as direct as cash transfers.
Shrinking pocket as living expenses rise. Low to
middle income classes’ purchasing power may be
pressurized by the potential higher living expenses in
2020. First, government decides to revoke electricity
subsidy for 900VA capable households, meaning the
group will face higher electricity tariff next year.
Second, the adjustment of BPJS Kesehatan premium
effectively starting 1 January 2020 with increases
ranging between 65% - 116% depend on the classes.
Third, the significant cigarette prices hike, could be
more than 20%. The excessive cigarette prices hike on
our view may have a meaningful impact to purchasing
power as in 2018, it contributes ~5.9% to the average
monthly spending per capita in Indonesia. While on the
income side, minimum wage is set to up by only 8.51%
in 2020, which may be insufficient to compensate the
surging expenses. As consumers’ pocket size only
increases moderately in 2020, hence FMCG spending
such as for F&B, confectioneries, personal care may be
at risk next year. Therefore, we conservatively assume
the staples within our coverage will book a mild top-
line growth of 6% in FY20F (vs 6.9% in FY19E).
Peaking margins, normalization should happen
soon. Ruling out the mild top-line growth, 2019 is
actually a good year for staples’ profitability, thanks to
the subdued soft commodity prices. Although recently
have picked up, soft commodity prices were staying
65
Ticker Rating CP TP % Chg FY20F P/E
UNVR NEUTRAL 41,225 43,900 6.5 45.8
ICBP ADD 11,450 12,800 11.7 28.1
KLBF NEUTRAL 1,600 1,680 5.0 28.8
INDF BUY 7,750 9,200 18.7 15.8
MYOR NEUTRAL 2,020 2,160 6.9 26.7
SIDO ADD 1,275 1,400 9.8 24.5
ROTI BUY 1,300 1,540 18.5 30.2
UCID BUY 1,500 1,900 26.7 17.8
Consumer Staples sector
Source: Badan Pusat Statistik, Sinarmas Investment Research
HH Consumption may drop on rising living expenses
Source: Bloomberg, Sinarmas Investment Research
Soft commodities uptrend signal
4.94%4.95%
4.93%
4.97%
1Q16 2Q16 3Q16 4Q16 1Q17 2Q17 3Q17 4Q17 1Q18 2Q18 3Q18 4Q18 1Q19 2Q19 3Q19
HH Consumption
HH consumption dropped in 2017
on rising living expenses
-40.0%
-20.0%
0.0%
20.0%
40.0%
60.0%
80.0%
100.0%
1/1/2018 5/1/2018 9/1/2018 1/1/2019 5/1/2019 9/1/2019
CPO Wheat Skim Milk Powder Sugar

Consumer Staples Sector
PT Unilever Indonesia Tbk.
NEUTRAL
We reiterate our NEUTRAL call on PT Unilever Indonesia Tbk
(UNVR) with 52-week target price of IDR 43,900. Our TP
represents 6.5% potential upside, pegged to 45.8x FY20F PE (-
0.5SD from its 5-year average PE). We like UNVR’s strong
innovation and product portfolio, though only expect top-line to
grow moderately as slower consumption baked in next year.
Margins may contract on higher commodity prices (CPO and skim
milk powder) and product mix that involves more economically-
priced products. Considering the moderate growth and potential
margin shrinkage, we think UNVR is closely fairly valued at current
valuation. Upside risk to our call is robust consumption level.
Enriching product portfolio. We agree that UNVR’s strategy of
continuous innovation, enriching product portfolio is positive to
explore opportunities, bolster growth, and deal with competition. In
2019, UNVR was quite active on launching new products, for
instance “Nameera” as well as “Love Beauty and Planet” for skin
and personal care. For F&R, UNVR brought in the well-known
“Hellmann’s” mayonnaise. New ice cream line under “Seru!” brand
was also launched to cater low-end demand, priced at IDR 2-3k.
We also see that “Seru!” brand is to tackle the intensifying
competition in the ice cream segment since few years ago.
Mild sales on consumption downturn. Our concern on soft
consumption in 2020 could hold back UNVR’s sales volume growth,
while limited ASP adjustment may be applied as competition in
both segments keep on intensifying. In addition, UNVR’s growth
driver may as well come from newly launched products with low
price. Consequently, we only see UNVR’s FY20F top-line growth at
4.0%, slightly lower than GDP growth.
Potential margins shrinkage on higher soft commodity
prices. In 3Q19, UNVR experienced more than 240bps drop in both
HPC and F&R segment, which we believe was in-line with rising
CPO and milk powder prices. As we think that those soft
commodities price may not fall any time soon, GPM may potentially
decline further. We also note that F&R GPM drop on quarterly basis
may be on more on the low-priced products. We assume UNVR’s
GPM dilutes to 50.1% in FY20F, down 50bps from 2019E’s.
66
Stock Information
Bloomberg Ticker UNVR IJ
52-Week High 50,525
52-Week Low 40,350
FY20F P/E 45.8x
FY20F P/BV 47.1x
Share Outstanding (Mn) 7,630.0
Market Cap. (IDR Tn) 314.5
Share Price Performance
Current Price 41,225
52-Week Target Price 43,900
% Change 6.5%
Highlights (IDR Bn) 2018 2019E 2020F 2021F 2022F
Revenue 41,802 42,963 44,660 47,259 50,196
% growth 1.5% 2.8% 3.9% 5.8% 6.2%
Gross Profit 21,092 21,737 22,396 23,497 24,980
Net Profit 9,109 7,236 7,311 7,651 8,125
% growth 30.1% -20.6% 1.0% 4.7% 6.2%
Gross Margin (%) 50.5% 50.6% 50.1% 49.7% 49.8%
Net Margin (%) 21.8% 16.8% 16.4% 16.2% 16.2%
Return on Equity (%) 142.9% 99.3% 103.7% 105.7% 107.8%
Return on Assets (%) 47.4% 36.3% 35.7% 36.2% 36.6%
EPS (IDR) 1,194 948 958 1,003 1,065

67
Income Statement Cash Flow
Balance Sheet Ratio Analysis
Consumer Staples | Unilever Indonesia
(IDR Bn) 2018 2019E 2020F 2021F 2022F
Revenue 41,802 42,963 44,660 47,259 50,196
% growth 1.5% 2.8% 3.9% 5.8% 6.2%
COGS (20,710) (21,226) (22,264) (23,762) (25,216)
% growth 3.6% 2.5% 4.9% 6.7% 6.1%
Gross Profit 21,092 21,737 22,396 23,497 24,980
% growth -0.6% 3.1% 3.0% 4.9% 6.3%
Operating Expenses (11,636) (11,955) (12,469) (13,131) (13,977)
Opex to Sales (%) -27.8% -27.8% -27.9% -27.8% -27.8%
Other Inc (Exp) 2,823 (10) (10) (11) (11)
EBIT 12,279 9,772 9,917 10,356 10,991
% growth 29.3% -20.4% 1.5% 4.4% 6.1%
EBITDA 13,033 10,409 10,576 11,065 11,739
% growth 28.7% -20.1% 1.6% 4.6% 6.1%
Net Financing (93) (93) (137) (121) (122)
EBT 12,186 9,679 9,780 10,235 10,869
% growth 30.0% -20.6% 1.0% 4.7% 6.2%
Tax Expenses (3,076) (2,444) (2,469) (2,584) (2,744)
Net Income 9,109 7,236 7,311 7,651 8,125
% growth 30.1% -20.6% 1.0% 4.7% 6.2%
EPS (IDR) 1,194 948 958 1,003 1,065
(IDR Bn) 2018 2019E 2020F 2021F 2022F
Net Income 9,109 7,236 7,311 7,651 8,125
Dep. & Amortization 755 637 659 709 748
Chg. In NWC 1,156 (1,125) 788 40 17
CF from Operating 11,020 6,748 8,758 8,399 8,890
Capital Expenditure (960) (1,285) (1,138) (1,011) (1,029)
Chg. in LT Assets (28) 1 (23) (34) (32)
Chg. in LT Liabs (391) 301 (4) (4) 135
CF from Investing (1,378) (983) (1,165) (1,049) (926)
Chg. in Share & APIC - - - - -
Chg. in Debt (2,990) 2,000 (400) - -
Dividends Paid (6,981) (7,824) (7,197) (7,389) (7,785)
Others 277 - - - -
CF from Financing (9,695) (5,824) (7,597) (7,389) (7,785)
Chg. in Cash (53) (60) (4) (39) 179
Beginning Cash 405 352 292 289 250
Ending Cash 352 292 289 250 429
(IDR Bn) 2018 2019E 2020F 2021F 2022F
Cash & Equivalents 352 292 289 250 429
Trade Receivables 5,103 5,513 5,215 5,726 6,119
Inventories 2,658 2,524 2,661 2,796 2,980
Other Current Assets 212 143 166 191 185
Total CA 8,325 8,472 8,330 8,963 9,714
Fixed Assets 10,627 11,276 11,755 12,057 12,338
Other Non CA 571 570 593 627 658
Total Assets 19,523 20,318 20,677 21,647 22,711
Short Term Debt 460 2,460 2,060 2,060 2,060
Trade Payables 6,684 6,613 6,870 7,369 7,818
Other CL 3,991 3,143 3,536 3,748 3,888
Total CL 11,135 12,217 12,466 13,177 13,766
Long Term Debt - - - - -
Other Non CL 810 1,111 1,107 1,103 1,238
Total Liabilities 11,945 13,328 13,573 14,280 15,004
Share & APIC 172 172 172 172 172
Retained Earnings 7,406 6,818 6,932 7,194 7,535
Others - - - - -
Total Equity 7,578 6,990 7,104 7,367 7,707
Total Liabilities & Equity
19,523 20,318 20,677 21,647 22,711
2018 2019E 2020F 2021F 2022F
Profitability
Return on Equity 142.9% 99.3% 103.7% 105.7% 107.8%
Return on Assets 47.4% 36.3% 35.7% 36.2% 36.6%
Gross Margin 50.5% 50.6% 50.1% 49.7% 49.8%
Operating Margin 29.4% 22.7% 22.2% 21.9% 21.9%
EBITDA Margin 31.2% 24.2% 23.7% 23.4% 23.4%
Net Margin 21.8% 16.8% 16.4% 16.2% 16.2%
Liquidity
Current Ratio (x) 0.7 0.7 0.7 0.7 0.7
Quick Ratio (x) 0.5 0.5 0.4 0.5 0.5
Solvency
Debt to Equity (x) 0.1 0.4 0.3 0.3 0.3
Debt to Assets (x) 0.0 0.1 0.1 0.1 0.1
Interest Cov. (x) 113.0 95.6 67.5 77.3 82.1
Valuation
Price to Earnings (x) 36.8 46.3 45.8 43.8 41.2
Price to Book (x) 44.2 47.9 47.1 45.5 43.5
Consumer Staples Sector
PT Indofood CBP Sukses Makmur Tbk.
ADD
We maintain our ADD call on PT Indofood CBP Sukses
Makmur Tbk (ICBP) with 52-week target price of IDR
12,800. Our TP represents a potential upside of 11.7%, derived via
28.1x FY20F PE (its 5-year average PE). Waning consumption may
potentially affect ICBP’s top-line next year, not to mention the high
base in 2019. Competition outside noodles may still tough
especially from dairy, snack and beverage. Margins have seen the
peak in 2019, hence should normalize on rising input costs. Despite
the headwinds, we still like ICBP for being one of the best
consumption proxies in Indonesia, though it may provide only
limited upside from current price. Downside risk to our call is worse
than expected margins drop and competition.
Noodles to remain resilient, tough competition in other
segments. We view ICBP’s strategy for noodles by introducing new
products that follow the latest trend such as “ayam geprek” flavor
along with active engagements on social medias and marketing
activities have worked out very well. Consequently, sales volume
growth for noodles were up impressively by ~7% in 9M19, stronger
than the last few years. Not much issue in noodles we believe, as
ICBP manages to adjust its ASP by ~4% annually. On the flip side,
competitions in dairy, snack and beverage remain concerning, as
several newly launched products from local FMCG players have
flooded the market, which may threaten ICBP’s market share. If
competition heats up, ICBP may have to raise its promotional
expenses which may end up in a lower operating margin ahead.
Margins may normalize in the upcoming quarters. The recent
uptrend signal of soft commodities may raise a concern on ICBP’s
margins onwards as it translate into higher costs. From end of
3Q19 to current, commodities such as wheat/CPO/sugar have seen
significant hikes of ~14.8%/39%/16.4%. We now assume declining
margins starting 4Q19 and last in the upcoming quarters on our
bullish view on soft commodity ahead.
Prefer taking exposure on ICBP through INDF at current.
Until mid Dec-19, ICBP has outperformed INDF by 5.6%, and we
believe INDF now bears more potential upside as the uptrend in
soft commodity prices such as wheat and CPO will benefit INDF.
68
Stock Information
Bloomberg Ticker ICBP IJ
52-Week High 12,550
52-Week Low 8,950
FY20F P/E 28.1x
FY20F P/BV 5.3x
Share Outstanding (Mn) 11,661.9
Market Cap. (IDR Tn) 133.5
Share Price Performance
Current Price 11,450
52-Week Target Price 12,800
% Change 11.7%
Highlights (IDR Bn) 2018 2019E 2020F 2021F 2022F
Revenue 38,413 42,899 45,599 48,842 52,318
% growth 7.9% 11.7% 6.3% 7.1% 7.1%
Gross Profit 12,266 14,690 15,422 16,353 17,475
Net Profit 4,576 5,044 5,311 5,565 5,937
% growth 20.5% 10.2% 5.3% 4.8% 6.7%
Gross Margin (%) 31.9% 34.2% 33.8% 33.5% 33.4%
Net Margin (%) 11.9% 11.8% 11.6% 11.4% 11.3%
Return on Equity (%) 21.3% 20.9% 19.8% 18.9% 18.4%
Return on Assets (%) 13.9% 13.9% 13.4% 12.9% 12.7%
EPS (IDR) 392 432 455 477 509
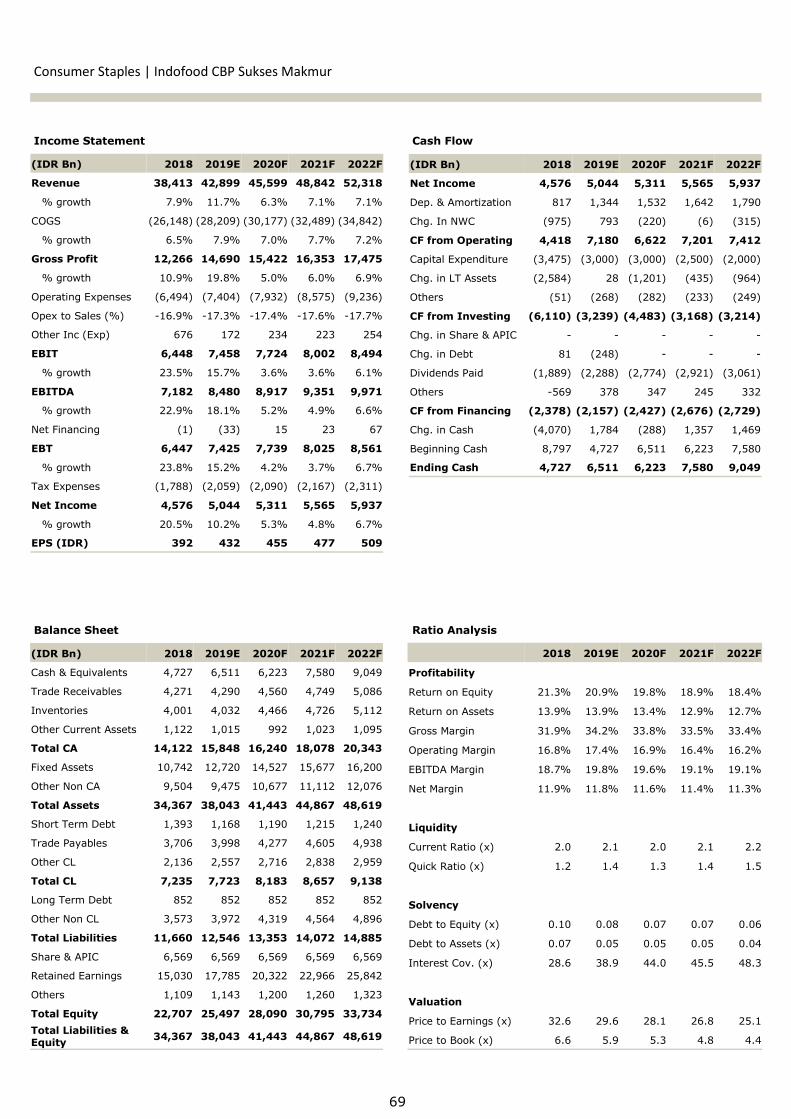
69
Income Statement Cash Flow
Balance Sheet Ratio Analysis
Consumer Staples | Indofood CBP Sukses Makmur
(IDR Bn) 2018 2019E 2020F 2021F 2022F
Revenue 38,413 42,899 45,599 48,842 52,318
% growth 7.9% 11.7% 6.3% 7.1% 7.1%
COGS (26,148) (28,209) (30,177) (32,489) (34,842)
% growth 6.5% 7.9% 7.0% 7.7% 7.2%
Gross Profit 12,266 14,690 15,422 16,353 17,475
% growth 10.9% 19.8% 5.0% 6.0% 6.9%
Operating Expenses (6,494) (7,404) (7,932) (8,575) (9,236)
Opex to Sales (%) -16.9% -17.3% -17.4% -17.6% -17.7%
Other Inc (Exp) 676 172 234 223 254
EBIT 6,448 7,458 7,724 8,002 8,494
% growth 23.5% 15.7% 3.6% 3.6% 6.1%
EBITDA 7,182 8,480 8,917 9,351 9,971
% growth 22.9% 18.1% 5.2% 4.9% 6.6%
Net Financing (1) (33) 15 23 67
EBT 6,447 7,425 7,739 8,025 8,561
% growth 23.8% 15.2% 4.2% 3.7% 6.7%
Tax Expenses (1,788) (2,059) (2,090) (2,167) (2,311)
Net Income 4,576 5,044 5,311 5,565 5,937
% growth 20.5% 10.2% 5.3% 4.8% 6.7%
EPS (IDR) 392 432 455 477 509
(IDR Bn) 2018 2019E 2020F 2021F 2022F
Net Income 4,576 5,044 5,311 5,565 5,937
Dep. & Amortization 817 1,344 1,532 1,642 1,790
Chg. In NWC (975) 793 (220) (6) (315)
CF from Operating 4,418 7,180 6,622 7,201 7,412
Capital Expenditure (3,475) (3,000) (3,000) (2,500) (2,000)
Chg. in LT Assets (2,584) 28 (1,201) (435) (964)
Others (51) (268) (282) (233) (249)
CF from Investing (6,110) (3,239) (4,483) (3,168) (3,214)
Chg. in Share & APIC - - - - -
Chg. in Debt 81 (248) - - -
Dividends Paid (1,889) (2,288) (2,774) (2,921) (3,061)
Others -569 378 347 245 332
CF from Financing (2,378) (2,157) (2,427) (2,676) (2,729)
Chg. in Cash (4,070) 1,784 (288) 1,357 1,469
Beginning Cash 8,797 4,727 6,511 6,223 7,580
Ending Cash 4,727 6,511 6,223 7,580 9,049
(IDR Bn) 2018 2019E 2020F 2021F 2022F
Cash & Equivalents 4,727 6,511 6,223 7,580 9,049
Trade Receivables 4,271 4,290 4,560 4,749 5,086
Inventories 4,001 4,032 4,466 4,726 5,112
Other Current Assets 1,122 1,015 992 1,023 1,095
Total CA 14,122 15,848 16,240 18,078 20,343
Fixed Assets 10,742 12,720 14,527 15,677 16,200
Other Non CA 9,504 9,475 10,677 11,112 12,076
Total Assets 34,367 38,043 41,443 44,867 48,619
Short Term Debt 1,393 1,168 1,190 1,215 1,240
Trade Payables 3,706 3,998 4,277 4,605 4,938
Other CL 2,136 2,557 2,716 2,838 2,959
Total CL 7,235 7,723 8,183 8,657 9,138
Long Term Debt 852 852 852 852 852
Other Non CL 3,573 3,972 4,319 4,564 4,896
Total Liabilities 11,660 12,546 13,353 14,072 14,885
Share & APIC 6,569 6,569 6,569 6,569 6,569
Retained Earnings 15,030 17,785 20,322 22,966 25,842
Others 1,109 1,143 1,200 1,260 1,323
Total Equity 22,707 25,497 28,090 30,795 33,734
Total Liabilities & Equity
34,367 38,043 41,443 44,867 48,619
2018 2019E 2020F 2021F 2022F
Profitability
Return on Equity 21.3% 20.9% 19.8% 18.9% 18.4%
Return on Assets 13.9% 13.9% 13.4% 12.9% 12.7%
Gross Margin 31.9% 34.2% 33.8% 33.5% 33.4%
Operating Margin 16.8% 17.4% 16.9% 16.4% 16.2%
EBITDA Margin 18.7% 19.8% 19.6% 19.1% 19.1%
Net Margin 11.9% 11.8% 11.6% 11.4% 11.3%
Liquidity
Current Ratio (x) 2.0 2.1 2.0 2.1 2.2
Quick Ratio (x) 1.2 1.4 1.3 1.4 1.5
Solvency
Debt to Equity (x) 0.10 0.08 0.07 0.07 0.06
Debt to Assets (x) 0.07 0.05 0.05 0.05 0.04
Interest Cov. (x) 28.6 38.9 44.0 45.5 48.3
Valuation
Price to Earnings (x) 32.6 29.6 28.1 26.8 25.1
Price to Book (x) 6.6 5.9 5.3 4.8 4.4
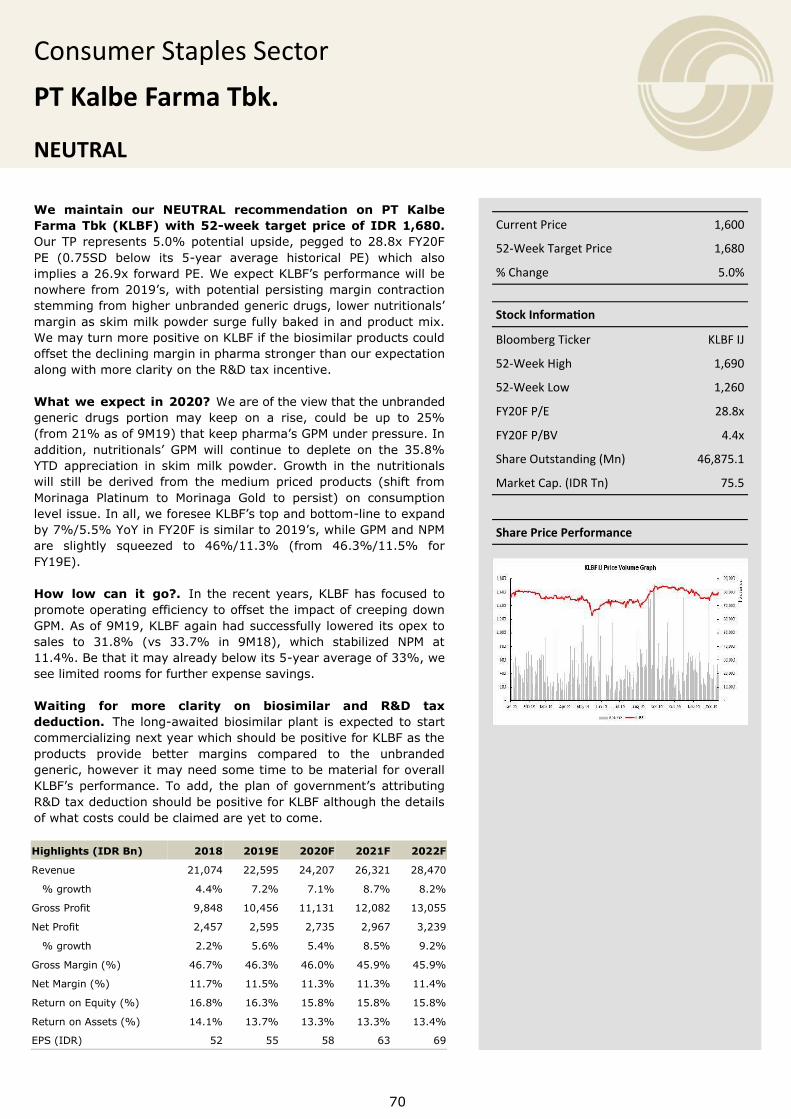
Consumer Staples Sector
PT Kalbe Farma Tbk.
NEUTRAL
We maintain our NEUTRAL recommendation on PT Kalbe
Farma Tbk (KLBF) with 52-week target price of IDR 1,680.
Our TP represents 5.0% potential upside, pegged to 28.8x FY20F
PE (0.75SD below its 5-year average historical PE) which also
implies a 26.9x forward PE. We expect KLBF’s performance will be
nowhere from 2019’s, with potential persisting margin contraction
stemming from higher unbranded generic drugs, lower nutritionals’
margin as skim milk powder surge fully baked in and product mix.
We may turn more positive on KLBF if the biosimilar products could
offset the declining margin in pharma stronger than our expectation
along with more clarity on the R&D tax incentive.
What we expect in 2020? We are of the view that the unbranded
generic drugs portion may keep on a rise, could be up to 25%
(from 21% as of 9M19) that keep pharma’s GPM under pressure. In
addition, nutritionals’ GPM will continue to deplete on the 35.8%
YTD appreciation in skim milk powder. Growth in the nutritionals
will still be derived from the medium priced products (shift from
Morinaga Platinum to Morinaga Gold to persist) on consumption
level issue. In all, we foresee KLBF’s top and bottom-line to expand
by 7%/5.5% YoY in FY20F is similar to 2019’s, while GPM and NPM
are slightly squeezed to 46%/11.3% (from 46.3%/11.5% for
FY19E).
How low can it go?. In the recent years, KLBF has focused to
promote operating efficiency to offset the impact of creeping down
GPM. As of 9M19, KLBF again had successfully lowered its opex to
sales to 31.8% (vs 33.7% in 9M18), which stabilized NPM at
11.4%. Be that it may already below its 5-year average of 33%, we
see limited rooms for further expense savings.
Waiting for more clarity on biosimilar and R&D tax
deduction. The long-awaited biosimilar plant is expected to start
commercializing next year which should be positive for KLBF as the
products provide better margins compared to the unbranded
generic, however it may need some time to be material for overall
KLBF’s performance. To add, the plan of government’s attributing
R&D tax deduction should be positive for KLBF although the details
of what costs could be claimed are yet to come.
70
Stock Information
Bloomberg Ticker KLBF IJ
52-Week High 1,690
52-Week Low 1,260
FY20F P/E 28.8x
FY20F P/BV 4.4x
Share Outstanding (Mn) 46,875.1
Market Cap. (IDR Tn) 75.5
Share Price Performance
Current Price 1,600
52-Week Target Price 1,680
% Change 5.0%
Highlights (IDR Bn) 2018 2019E 2020F 2021F 2022F
Revenue 21,074 22,595 24,207 26,321 28,470
% growth 4.4% 7.2% 7.1% 8.7% 8.2%
Gross Profit 9,848 10,456 11,131 12,082 13,055
Net Profit 2,457 2,595 2,735 2,967 3,239
% growth 2.2% 5.6% 5.4% 8.5% 9.2%
Gross Margin (%) 46.7% 46.3% 46.0% 45.9% 45.9%
Net Margin (%) 11.7% 11.5% 11.3% 11.3% 11.4%
Return on Equity (%) 16.8% 16.3% 15.8% 15.8% 15.8%
Return on Assets (%) 14.1% 13.7% 13.3% 13.3% 13.4%
EPS (IDR) 52 55 58 63 69

71
Income Statement Cash Flow
Balance Sheet Ratio Analysis
Consumer Staples | Kalbe Farma
(IDR Bn) 2018 2019E 2020F 2021F 2022F
Revenue 21,074 22,595 24,207 26,321 28,470
% growth 4.4% 7.2% 7.1% 8.7% 8.2%
COGS (11,226) (12,140) (13,076) (14,238) (15,415)
% growth 8.3% 8.1% 7.7% 8.9% 8.3%
Gross Profit 9,848 10,456 11,131 12,082 13,055
% growth 0.4% 6.2% 6.5% 8.5% 8.0%
Operating Expenses (6,534) (7,024) (7,521) (8,180) (8,818)
Opex to Sales (%) -31.0% -31.1% -31.1% -31.1% -31.0%
Other Inc (Exp) (103) (82) (90) (91) (103)
EBIT 3,210 3,349 3,520 3,811 4,135
% growth 1.7% 4.2% 5.1% 8.3% 8.5%
EBITDA 3,563 3,845 4,053 4,375 4,715
% growth 1.0% 7.9% 5.4% 7.9% 7.8%
Net Financing 96 106 118 135 167
EBT 3,306 3,455 3,639 3,946 4,301
% growth 2.0% 4.5% 5.3% 8.4% 9.0%
Tax Expenses (809) (818) (859) (930) (1,009)
Net Income 2,457 2,595 2,735 2,967 3,239
% growth 2.2% 5.6% 5.4% 8.5% 9.2%
EPS (IDR) 52 55 58 63 69
(IDR Bn) 2018 2019E 2020F 2021F 2022F
Net Income 2,457 2,595 2,735 2,967 3,239
Dep. & Amortization 380 538 577 612 634
Chg. In NWC (78) (408) (432) (562) (551)
CF from Operating 2,758 2,726 2,880 3,018 3,321
Capital Expenditure (1,343) (1,100) (1,100) (1,000) (600)
Chg. in LT Assets (14) (86) (113) (114) (129)
Others 111 (42) (45) (48) (53)
CF from Investing (1,246) (1,228) (1,258) (1,163) (781)
Chg. in Share & APIC - - - - -
Chg. in Debt 16 - - - -
Dividends Paid (1,172) (1,229) (1,298) (1,367) (1,484)
Others 12 (36) 28 35 31
CF from Financing (1,144) (1,264) (1,269) (1,332) (1,452)
Chg. in Cash 369 233 353 522 1,088
Beginning Cash 2,785 3,153 3,386 3,739 4,261
Ending Cash 3,153 3,386 3,739 4,261 5,349
(IDR Bn) 2018 2019E 2020F 2021F 2022F
Cash & Equivalents 3,153 3,386 3,739 4,261 5,349
Trade Receivables 3,256 3,491 3,739 4,066 4,398
Inventories 3,475 3,757 4,047 4,407 4,771
Other Current Assets 765 895 937 1,018 1,111
Total CA 10,648 11,529 12,462 13,752 15,629
Fixed Assets 6,253 6,857 7,424 7,861 7,880
Other Non CA 1,245 1,331 1,444 1,559 1,687
Total Assets 18,146 19,717 21,330 23,172 25,196
Short Term Debt 69 69 69 69 69
Trade Payables 1,700 1,838 1,980 2,156 2,334
Other CL 517 619 626 656 716
Total CL 2,286 2,526 2,674 2,881 3,118
Long Term Debt 260 260 260 260 260
Other Non CL 306 338 367 402 433
Total Liabilities 2,852 3,125 3,301 3,542 3,811
Share & APIC 435 435 435 435 435
Retained Earnings 14,073 15,440 16,877 18,477 20,232
Others 787 718 718 718 718
Total Equity 15,295 16,592 18,029 19,629 21,385
Total Liabilities & Equity
18,146 19,717 21,330 23,172 25,196
2018 2019E 2020F 2021F 2022F
Profitability
Return on Equity 16.8% 16.3% 15.8% 15.8% 15.8%
Return on Assets 14.1% 13.7% 13.3% 13.3% 13.4%
Gross Margin 46.7% 46.3% 46.0% 45.9% 45.9%
Operating Margin 15.2% 14.8% 14.5% 14.5% 14.5%
EBITDA Margin 16.9% 17.0% 16.7% 16.6% 16.6%
Net Margin 11.7% 11.5% 11.3% 11.3% 11.4%
Liquidity
Current Ratio (x) 4.7 4.6 4.7 4.8 5.0
Quick Ratio (x) 2.8 2.7 2.8 2.9 3.1
Solvency
Debt to Equity (x) 0.02 0.02 0.02 0.02 0.02
Debt to Assets (x) 0.02 0.02 0.02 0.01 0.01
Interest Cov. (x) 108.0 95.7 103.8 104.4 106.6
Valuation
Price to Earnings (x) 32.0 30.3 28.8 26.5 24.2
Price to Book (x) 5.1 4.7 4.4 4.0 3.7

Consumer Staples Sector
PT Indofood Sukses Makmur Tbk.
BUY
We reiterate our BUY call on PT Indofood Sukses Makmur
Tbk (INDF) with 52-week target price of IDR 9,200. Our
SOTP based TP represents 18.8% potential upside, implying 15.8x
FY20F PE. On the concern of waning consumption and potential
pick up in soft commodity prices, we prefer INDF than ICBP. While
ICBP’s performance may normalize in the upcoming quarters,
Bogasari and agribusiness’ could be prominent for INDF. INDF
currently trades at 13.3x forward PE which we believe is a good
consumer name at bargain price. Therefore, INDF should re-rate
following the spike in CPO price and lessen its discount toward
ICBP. Downside risks to our call are IDR depreciation and M&A
action that could weaken liquidity and leverage position.
ICBP’s performance may normalize next year. ICBP remained
the backbone for INDF in 2019. However, we are anticipating for
ICBP’s performance to be less exciting on 1) modest growth as
consumption dips, 2) potential margins normalizing on higher soft
commodity prices and 3) competition remains tough, especially in
dairy, snack and beverage. All things considered, we have a
stronger conviction on INDF expecting a more stable performance
supported by the uprising of commodity-related businesses.
Blessings from commodity-related businesses. Throughout
2019, INDF’s agribusiness performance was dragged down severely
by the sluggish CPO price. Up to 9M19, CPO price was averaging at
MYR 2,050/ton before started crawling up to the current level of
MYR 2,850/ton. Following our bullish stance on CPO with an
assumption of average MYR 2,500/ton for next year (+16.2% from
FY19E’s), an uptick in agribusiness’ EBIT margin should be visible
starting 4Q19 and afterwards. Furthermore, brighter outlook will as
well come from Bogasari following the 13% rise in wheat price
since end of 3Q19, that could lead Bogasari resuming ASP increase
ahead (after 3-4% cut in Jul-19). We are now seeing 7%/5% YoY
growth for agribusiness/Bogasari top-line with both EBIT margins
at 6% (1.8%/6.5% in FY19E for agribusiness/Bogasari).
Favorable CPO proxy. We believe that investors with liquity and
size concern on CPO stocks could favor INDF on its exposure to
agribusiness.
72
Stock Information
Bloomberg Ticker INDF IJ
52-Week High 8,050
52-Week Low 5,850
FY20F P/E 15.8x
FY20F P/BV 1.4x
Share Outstanding (Mn) 8,780.4
Market Cap. (IDR Tn) 68.0
Share Price Performance
Current Price 7,750
52-Week Target Price 9,200
% Change 18.7%
Highlights (IDR Bn) 2018 2019E 2020F 2021F 2022F
Revenue 73,395 77,857 82,557 87,418 92,363
% growth 4.6% 6.1% 6.0% 5.9% 5.7%
Gross Profit 20,212 22,657 23,976 25,299 26,753
Net Profit 4,166 4,752 5,104 5,489 5,843
% growth 0.2% 14.1% 7.4% 7.5% 6.5%
Gross Margin (%) 27.5% 29.1% 29.0% 28.9% 29.0%
Net Margin (%) 5.7% 6.1% 6.2% 6.3% 6.3%
Return on Equity (%) 8.6% 9.2% 9.2% 9.3% 9.3%
Return on Assets (%) 4.5% 4.9% 5.1% 5.3% 5.4%
EPS (IDR) 474 541 581 625 666
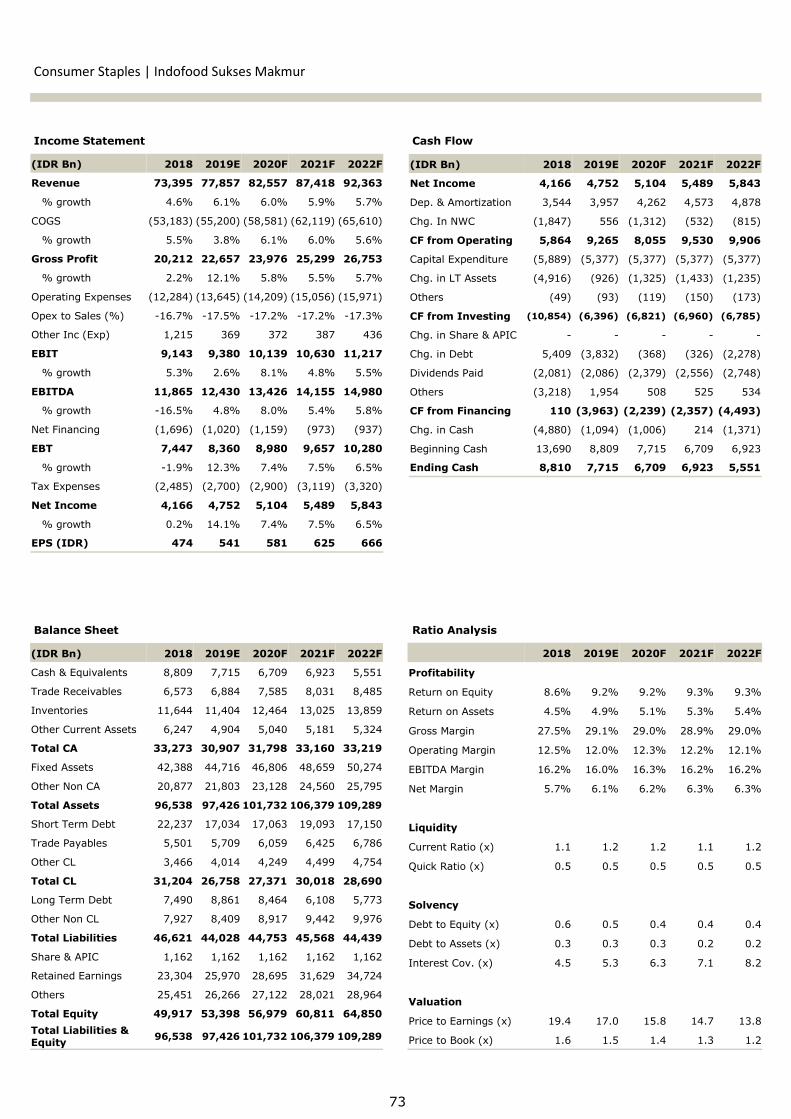
73
Income Statement Cash Flow
Balance Sheet Ratio Analysis
Consumer Staples | Indofood Sukses Makmur
(IDR Bn) 2018 2019E 2020F 2021F 2022F
Revenue 73,395 77,857 82,557 87,418 92,363
% growth 4.6% 6.1% 6.0% 5.9% 5.7%
COGS (53,183) (55,200) (58,581) (62,119) (65,610)
% growth 5.5% 3.8% 6.1% 6.0% 5.6%
Gross Profit 20,212 22,657 23,976 25,299 26,753
% growth 2.2% 12.1% 5.8% 5.5% 5.7%
Operating Expenses (12,284) (13,645) (14,209) (15,056) (15,971)
Opex to Sales (%) -16.7% -17.5% -17.2% -17.2% -17.3%
Other Inc (Exp) 1,215 369 372 387 436
EBIT 9,143 9,380 10,139 10,630 11,217
% growth 5.3% 2.6% 8.1% 4.8% 5.5%
EBITDA 11,865 12,430 13,426 14,155 14,980
% growth -16.5% 4.8% 8.0% 5.4% 5.8%
Net Financing (1,696) (1,020) (1,159) (973) (937)
EBT 7,447 8,360 8,980 9,657 10,280
% growth -1.9% 12.3% 7.4% 7.5% 6.5%
Tax Expenses (2,485) (2,700) (2,900) (3,119) (3,320)
Net Income 4,166 4,752 5,104 5,489 5,843
% growth 0.2% 14.1% 7.4% 7.5% 6.5%
EPS (IDR) 474 541 581 625 666
(IDR Bn) 2018 2019E 2020F 2021F 2022F
Net Income 4,166 4,752 5,104 5,489 5,843
Dep. & Amortization 3,544 3,957 4,262 4,573 4,878
Chg. In NWC (1,847) 556 (1,312) (532) (815)
CF from Operating 5,864 9,265 8,055 9,530 9,906
Capital Expenditure (5,889) (5,377) (5,377) (5,377) (5,377)
Chg. in LT Assets (4,916) (926) (1,325) (1,433) (1,235)
Others (49) (93) (119) (150) (173)
CF from Investing (10,854) (6,396) (6,821) (6,960) (6,785)
Chg. in Share & APIC - - - - -
Chg. in Debt 5,409 (3,832) (368) (326) (2,278)
Dividends Paid (2,081) (2,086) (2,379) (2,556) (2,748)
Others (3,218) 1,954 508 525 534
CF from Financing 110 (3,963) (2,239) (2,357) (4,493)
Chg. in Cash (4,880) (1,094) (1,006) 214 (1,371)
Beginning Cash 13,690 8,809 7,715 6,709 6,923
Ending Cash 8,810 7,715 6,709 6,923 5,551
(IDR Bn) 2018 2019E 2020F 2021F 2022F
Cash & Equivalents 8,809 7,715 6,709 6,923 5,551
Trade Receivables 6,573 6,884 7,585 8,031 8,485
Inventories 11,644 11,404 12,464 13,025 13,859
Other Current Assets 6,247 4,904 5,040 5,181 5,324
Total CA 33,273 30,907 31,798 33,160 33,219
Fixed Assets 42,388 44,716 46,806 48,659 50,274
Other Non CA 20,877 21,803 23,128 24,560 25,795
Total Assets 96,538 97,426 101,732 106,379 109,289
Short Term Debt 22,237 17,034 17,063 19,093 17,150
Trade Payables 5,501 5,709 6,059 6,425 6,786
Other CL 3,466 4,014 4,249 4,499 4,754
Total CL 31,204 26,758 27,371 30,018 28,690
Long Term Debt 7,490 8,861 8,464 6,108 5,773
Other Non CL 7,927 8,409 8,917 9,442 9,976
Total Liabilities 46,621 44,028 44,753 45,568 44,439
Share & APIC 1,162 1,162 1,162 1,162 1,162
Retained Earnings 23,304 25,970 28,695 31,629 34,724
Others 25,451 26,266 27,122 28,021 28,964
Total Equity 49,917 53,398 56,979 60,811 64,850
Total Liabilities & Equity
96,538 97,426 101,732 106,379 109,289
2018 2019E 2020F 2021F 2022F
Profitability
Return on Equity 8.6% 9.2% 9.2% 9.3% 9.3%
Return on Assets 4.5% 4.9% 5.1% 5.3% 5.4%
Gross Margin 27.5% 29.1% 29.0% 28.9% 29.0%
Operating Margin 12.5% 12.0% 12.3% 12.2% 12.1%
EBITDA Margin 16.2% 16.0% 16.3% 16.2% 16.2%
Net Margin 5.7% 6.1% 6.2% 6.3% 6.3%
Liquidity
Current Ratio (x) 1.1 1.2 1.2 1.1 1.2
Quick Ratio (x) 0.5 0.5 0.5 0.5 0.5
Solvency
Debt to Equity (x) 0.6 0.5 0.4 0.4 0.4
Debt to Assets (x) 0.3 0.3 0.3 0.2 0.2
Interest Cov. (x) 4.5 5.3 6.3 7.1 8.2
Valuation
Price to Earnings (x) 19.4 17.0 15.8 14.7 13.8
Price to Book (x) 1.6 1.5 1.4 1.3 1.2

Consumer Staples Sector
PT Mayora Indah Tbk.
NEUTRAL
We lower our rating from ADD to NEUTRAL on PT Mayora
Indah Tbk (MYOR) with 52-week target price of IDR 2,160.
Our TP which represents 6.9% limited potential upside, is pegged
to 26.7x FY20F PE (-1SD from its 5-year average PE). MYOR’s
outlook turns less attractive as it now faces difficulty to see double-
digit volume growth, both in domestic and export market. Margins
contraction will be an issue next year due to the recent surge in
wheat and coffee prices. A&P expenses may remain high as
competition is not loosening up in the near time. Positives on MYOR
are the healthy balance sheet position and strong brand equity.
Expecting mid single-digit top-line growth in 2020. We do not
see MYOR being able to return to its best performance soon as
competition seems to step up rapidly both in domestic and export
market. For domestic, local players have tapped into the instant
coffee segment such as “Neo Coffee” and “Delizio Caffino” from
Wings and Djarum Group respectively. In addition, coffee war is
also brewing in Philippines with the two coffee makers there, Nestle
and Universal Robina, post MYOR’s plan to invest US$ 80mn over 5
years for a new plant in Philippines. In addition to competition, the
potential domestic consumption dip may also restrain MYOR volume
growth, as most its products are well-targeted the low to middle
income. For FY20F, we forecast MYOR’s top-line grow by 5.9% YoY,
quite evenly between domestic and export.
Expecting profitability normalization ahead. MYOR’s GPM is
expected to drop in 4Q19 onwards on the recent surge in wheat
and coffee prices (+14%/+23.5% from end 3Q19). In the
meantime, opex will remain elevated at ~18% (above 13.8% for
FY14-18 average; 19.6% for 9M19) to tackle competition and
maintan market share. As a result, we see FY20F GPM/OPM at
29%/11% (vs 30%/11.6% in FY19E).
De-rating on growth uncertainty. Historically, MYOR was traded
premium at >30x PE on robust volume growth, at 14.7% CAGR
FY14-18. However, the doubt on robust volume growth visibility
ahead has led MYOR to de-rate throughout 2019. Though current
valuation may already seem attractive, yet we still wait for more
clarity on future volume outlook for MYOR.
74
Stock Information
Bloomberg Ticker MYOR IJ
52-Week High 2,750
52-Week Low 1,950
FY20F P/E 26.7x
FY20F P/BV 4.5x
Share Outstanding (Mn) 22,358.7
Market Cap. (IDR Tn) 45.2
Share Price Performance
Current Price 2,020
52-Week Target Price 2,160
% Change 6.9%
Highlights (IDR Bn) 2018 2019E 2020F 2021F 2022F
Revenue 24,061 24,676 26,122 28,290 30,717
% growth 15.6% 2.6% 5.9% 8.3% 8.6%
Gross Profit 6,397 7,422 7,564 7,957 8,570
Net Profit 1,716 1,677 1,810 2,064 2,271
% growth 7.6% -2.3% 7.9% 14.0% 10.1%
Gross Margin (%) 26.6% 30.1% 29.0% 28.1% 27.9%
Net Margin (%) 7.1% 6.8% 6.9% 7.3% 7.4%
Return on Equity (%) 21.6% 18.5% 17.7% 18.0% 17.6%
Return on Assets (%) 10.6% 9.5% 9.9% 10.5% 11.0%
EPS (IDR) 77 75 81 92 102

75
Income Statement Cash Flow
Balance Sheet Ratio Analysis
Consumer Staples | Mayora Indah
(IDR Bn) 2018 2019E 2020F 2021F 2022F
Revenue 24,061 24,676 26,122 28,290 30,717
% growth 15.6% 2.6% 5.9% 8.3% 8.6%
COGS (17,664) (17,255) (18,558) (20,333) (22,147)
% growth 11.5% -2.3% 7.6% 9.6% 8.9%
Gross Profit 6,397 7,422 7,564 7,957 8,570
% growth 28.6% 16.0% 1.9% 5.2% 7.7%
Operating Expenses (3,769) (4,568) (4,701) (4,759) (5,151)
Opex to Sales (%) -15.7% -18.5% -18.0% -16.8% -16.8%
EBIT 2,628 2,854 2,863 3,198 3,419
% growth 6.8% 8.6% 0.3% 11.7% 6.9%
EBITDA 3,177 3,432 3,481 3,857 4,121
% growth 5.9% 8.0% 1.4% 10.8% 6.8%
Net Financing (446) (455) (394) (375) (315)
Others 200 (108) 3 (3) (1)
EBT 2,382 2,291 2,472 2,820 3,103
% growth 8.9% -3.8% 7.9% 14.1% 10.0%
Tax Expenses (622) (573) (618) (705) (776)
Net Income 1,716 1,677 1,810 2,064 2,271
% growth 7.6% -2.3% 7.9% 14.0% 10.1%
EPS (IDR) 77 75 81 92 102
(IDR Bn) 2018 2019E 2020F 2021F 2022F
Net Income 1,716 1,677 1,810 2,064 2,271
Dep. & Amortization 581 599 645 690 736
Chg. In NWC (1,791) 866 (492) (639) (635)
CF from Operating 507 3,142 1,963 2,115 2,372
Capital Expenditure (819) (864) (849) (849) (921)
Chg. in LT Assets (433) 207 (44) (118) 5
Chg. in LT Liabs 45 57 65 66 104
CF from Investing (1,206) (600) (828) (900) (812)
Chg. in Share & APIC - - - - -
Chg. in Debt 1,553 (1,128) (147) (185) (1,271)
Dividends Paid (604) (687) (671) (724) (826)
Others 44 67 - - -
CF from Financing 994 (1,747) (818) (909) (2,097)
Chg. in Cash 294 795 317 306 (536)
Beginning Cash 2,202 2,496 3,291 3,608 3,914
Ending Cash 2,496 3,291 3,608 3,914 3,378
(IDR Bn) 2018 2019E 2020F 2021F 2022F
Cash & Equivalents 2,496 3,291 3,608 3,914 3,378
Trade Receivables 6,075 6,085 6,617 7,099 7,687
Inventories 3,352 2,528 2,648 2,935 3,149
Other Current Assets 725 770 762 853 927
Total CA 12,648 12,674 13,635 14,801 15,140
Fixed Assets 4,258 4,544 4,774 4,964 5,184
Other Non CA 686 479 523 640 635
Total Assets 17,592 17,697 18,932 20,406 20,960
Short Term Debt 2,630 1,866 1,866 2,914 2,365
Trade Payables 1,625 1,692 1,841 1,999 2,182
Other CL 509 540 542 606 664
Total CL 4,765 4,098 4,249 5,519 5,211
Long Term Debt 3,377 3,014 2,867 1,634 911
Other Non CL 907 964 1,029 1,096 1,200
Total Liabilities 9,049 8,076 8,145 8,249 7,322
Share & APIC 448 448 448 448 448
Retained Earnings 7,901 8,953 10,092 11,432 12,878
Others 194 220 246 278 312
Total Equity 8,543 9,621 10,786 12,157 13,637
Total Liabilities & Equity
17,592 17,697 18,932 20,406 20,960
2018 2019E 2020F 2021F 2022F
Profitability
Return on Equity 21.6% 18.5% 17.7% 18.0% 17.6%
Return on Assets 10.6% 9.5% 9.9% 10.5% 11.0%
Gross Margin 26.6% 30.1% 29.0% 28.1% 27.9%
Operating Margin 10.9% 11.6% 11.0% 11.3% 11.1%
EBITDA Margin 13.2% 13.9% 13.3% 13.6% 13.4%
Net Margin 7.1% 6.8% 6.9% 7.3% 7.4%
Liquidity
Current Ratio (x) 2.7 3.1 3.2 2.7 2.9
Quick Ratio (x) 1.8 2.3 2.4 2.0 2.1
Solvency
Debt to Equity (x) 0.7 0.5 0.4 0.4 0.2
Debt to Assets (x) 0.3 0.3 0.2 0.2 0.2
Interest Cov. (x) 5.3 5.9 6.6 7.8 9.6
Valuation
Price to Earnings (x) 28.1 28.8 26.7 23.4 21.3
Price to Book (x) 5.7 5.0 4.5 4.0 3.5

Consumer Staples Sector
PT Industri Jamu dan Farmasi Sido Muncul Tbk.
ADD
We reiterate our ADD rating on PT Sido Muncul Tbk (SIDO)
with 52-week target price of IDR 1,400. Our TP represents
9.8% potential upside, deriving from FY20F PE of 24.5x (+1.75SD
from its 2-year historical average PE). SIDO’s share price has
experienced significant appreciation at ~50% YTD due to its robust
performance, yet still leaves some room for re-rating considering
its healthy balance sheet and appealing profitability. SIDO’s ROE
could hit 26.2%/25.9% in FY19E/FY20F, higher than 19.3% the
average ROE of the staples under our coverage. Therefore, we
expect SIDO which now trades at 22.5x forward PE to move toward
twenties mid times PE. Upside risk is continuing margin expansion.
Growth visibility is there, but may be moderate on potential
sluggish consumption next year. We are of the view that SIDO
still carries potential volume growth ahead, as its COD II plant
currently still runs at ~55-60% utilization rate. For the domestic
market, SIDO will maintain its focus on the eastern part of
Indonesia as growth is stronger there. However in the event of
potential weakening consumption next year we believe it could
pose risks to SIDO’s domestic sales. Consequently, we turn more
conservative and forecast SIDO’s top-line to grow by 7.9% YoY in
FY20F, lower than management’s annual guidance of 10% growth.
Keeping an eye on export market. Being successfully tapped
into the export market through three main destination countries
(Philippines, Malaysia and Nigeria), SIDO aims to widen its export
to other countries such as Myanmar, Vietnam, Arab etc. So far, it
has been fruitful for SIDO’s export contribution to sales have
escalated rapidly to 5% as of 9M19 (vs 2% in FY18). However, the
worrying thing is that fierce competition is seen in Philippines
(SIDO’s biggest export contributor) whereas “Tolak Angin”
competes head-to-head with the market leader “Lola Remedios”
who is very aggressive in marketing activities.
Peaking margins, less room to expand. As of 9M19, SIDO’s
GPM reached 54.4% (+290bps from FY18) which may be on the
continuation of production efficiency. Afterwards, we expect it to be
stable at ~54%, utilizing less volatility in raw materials as most are
sourced domestically.
76
Stock Information
Bloomberg Ticker SIDO IJ
52-Week High 1,355
52-Week Low 750
FY20F P/E 24.5x
FY20F P/BV 6.2x
Share Outstanding (Mn) 15,000.0
Market Cap. (IDR Tn) 19.1
Share Price Performance
Current Price 1,275
52-Week Target Price 1,400
% Change 9.8%
Highlights (IDR Bn) 2018 2019E 2020F 2021F 2022F
Revenue 2,763 2,981 3,216 3,451 3,707
% growth 7.4% 7.9% 7.9% 7.3% 7.4%
Gross Profit 1,424 1,620 1,736 1,863 2,001
Net Profit 664 795 844 902 968
% growth 24.4% 19.8% 6.2% 6.8% 7.3%
Gross Margin (%) 51.5% 54.3% 54.0% 54.0% 54.0%
Net Margin (%) 24.0% 26.7% 26.2% 26.1% 26.1%
Return on Equity (%) 22.9% 26.2% 25.9% 26.0% 26.2%
Return on Assets (%) 20.4% 23.3% 23.3% 23.2% 23.3%
EPS (IDR) 45 53 57 61 65
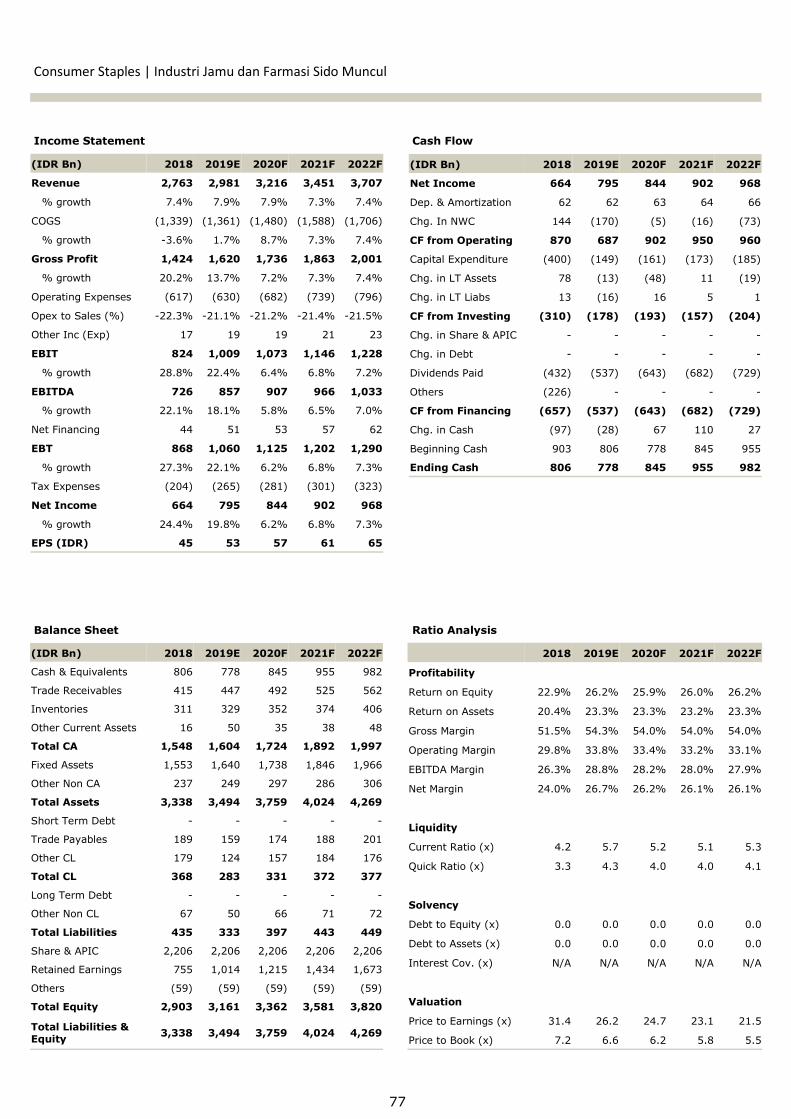
77
Income Statement Cash Flow
Balance Sheet Ratio Analysis
Consumer Staples | Industri Jamu dan Farmasi Sido Muncul
(IDR Bn) 2018 2019E 2020F 2021F 2022F
Revenue 2,763 2,981 3,216 3,451 3,707
% growth 7.4% 7.9% 7.9% 7.3% 7.4%
COGS (1,339) (1,361) (1,480) (1,588) (1,706)
% growth -3.6% 1.7% 8.7% 7.3% 7.4%
Gross Profit 1,424 1,620 1,736 1,863 2,001
% growth 20.2% 13.7% 7.2% 7.3% 7.4%
Operating Expenses (617) (630) (682) (739) (796)
Opex to Sales (%) -22.3% -21.1% -21.2% -21.4% -21.5%
Other Inc (Exp) 17 19 19 21 23
EBIT 824 1,009 1,073 1,146 1,228
% growth 28.8% 22.4% 6.4% 6.8% 7.2%
EBITDA 726 857 907 966 1,033
% growth 22.1% 18.1% 5.8% 6.5% 7.0%
Net Financing 44 51 53 57 62
EBT 868 1,060 1,125 1,202 1,290
% growth 27.3% 22.1% 6.2% 6.8% 7.3%
Tax Expenses (204) (265) (281) (301) (323)
Net Income 664 795 844 902 968
% growth 24.4% 19.8% 6.2% 6.8% 7.3%
EPS (IDR) 45 53 57 61 65
(IDR Bn) 2018 2019E 2020F 2021F 2022F
Net Income 664 795 844 902 968
Dep. & Amortization 62 62 63 64 66
Chg. In NWC 144 (170) (5) (16) (73)
CF from Operating 870 687 902 950 960
Capital Expenditure (400) (149) (161) (173) (185)
Chg. in LT Assets 78 (13) (48) 11 (19)
Chg. in LT Liabs 13 (16) 16 5 1
CF from Investing (310) (178) (193) (157) (204)
Chg. in Share & APIC - - - - -
Chg. in Debt - - - - -
Dividends Paid (432) (537) (643) (682) (729)
Others (226) - - - -
CF from Financing (657) (537) (643) (682) (729)
Chg. in Cash (97) (28) 67 110 27
Beginning Cash 903 806 778 845 955
Ending Cash 806 778 845 955 982
(IDR Bn) 2018 2019E 2020F 2021F 2022F
Cash & Equivalents 806 778 845 955 982
Trade Receivables 415 447 492 525 562
Inventories 311 329 352 374 406
Other Current Assets 16 50 35 38 48
Total CA 1,548 1,604 1,724 1,892 1,997
Fixed Assets 1,553 1,640 1,738 1,846 1,966
Other Non CA 237 249 297 286 306
Total Assets 3,338 3,494 3,759 4,024 4,269
Short Term Debt - - - - -
Trade Payables 189 159 174 188 201
Other CL 179 124 157 184 176
Total CL 368 283 331 372 377
Long Term Debt - - - - -
Other Non CL 67 50 66 71 72
Total Liabilities 435 333 397 443 449
Share & APIC 2,206 2,206 2,206 2,206 2,206
Retained Earnings 755 1,014 1,215 1,434 1,673
Others (59) (59) (59) (59) (59)
Total Equity 2,903 3,161 3,362 3,581 3,820
Total Liabilities & Equity
3,338 3,494 3,759 4,024 4,269
2018 2019E 2020F 2021F 2022F
Profitability
Return on Equity 22.9% 26.2% 25.9% 26.0% 26.2%
Return on Assets 20.4% 23.3% 23.3% 23.2% 23.3%
Gross Margin 51.5% 54.3% 54.0% 54.0% 54.0%
Operating Margin 29.8% 33.8% 33.4% 33.2% 33.1%
EBITDA Margin 26.3% 28.8% 28.2% 28.0% 27.9%
Net Margin 24.0% 26.7% 26.2% 26.1% 26.1%
Liquidity
Current Ratio (x) 4.2 5.7 5.2 5.1 5.3
Quick Ratio (x) 3.3 4.3 4.0 4.0 4.1
Solvency
Debt to Equity (x) 0.0 0.0 0.0 0.0 0.0
Debt to Assets (x) 0.0 0.0 0.0 0.0 0.0
Interest Cov. (x) N/A N/A N/A N/A N/A
Valuation
Price to Earnings (x) 31.4 26.2 24.7 23.1 21.5
Price to Book (x) 7.2 6.6 6.2 5.8 5.5

Consumer Staples Sector
PT Nippon Indosari Corpindo Tbk.
NEUTRAL
We upgrade our ADD to BUY call on PT Nippon Indosari
Corpindo Tbk (ROTI) with 52-week target price of IDR
1,540. Our TP represents 18.2% potential upside, pegged to 30.2x
PE (-0.5SD from its 5-year historical average PE). We expect ROTI
to extend its robust growth utilizing its newly established plants
(Gresik and Balikpapan) and 2 additional new plants in 2020, along
with further GT channel enhancement. Profitability improvement
will as well be visible on better operating efficiency. All things
considered, ROTI’s valuation at 25.6x forward PE is justified.
Downside risks are weak volume and delay in opex efficiency.
Robust top-line growth to persist in 2020. ROTI is one among
the other staples that was able to book an impressive volume
growth in 2019. In 2020, ROTI plans to add another 2 new facilities
located in Banjarmasin and Pekanbaru with the idea to cater the
demand from previously unreachable areas, especially in
Kalimantan and Sumatra regions. Coupled with the continuing GT
channel enhancement, we believe the other round of robust volume
growth should be reachable next year. ROTI will also adjust ASP by
5% in 2020, which have been gradually done ~3% on selective
products since Sep-19. Consequently, we foresee ROTI’s top-line
reaching IDR 3.9tn (+18.3% YoY) next year.
More room for OPM improvement. On the back of the
supportive flour price, ROTI saw a record high GPM of 55.5% in
9M19 (vs average of 49.6% for FY10-18). Although GPM is unlikely
to expand further and may normalize on potential rising wheat
price onwards, however ROTI may still be able to improve its
profitability through operating efficiency, one of which is
normalizing marketing activities. To add, savings will come from
logistic costs as it currently supplies the demand in Kalimantan
through its latest and forthcoming Kalimantan plants (previously
from Java’s plants). As a result, we forecast ROTI’s OPM improving
to 11.3% in FY20F, leading to net profit of IDR 334bn (+20.5%
YoY, 8.5% NPM).
Valuation. ROTI trades at 25.6x forward PE which actually is not
undemanding. However, we believe it is justified by ROTI’s strong
top-line generation and potential further margin expansion.
78
Stock Information
Bloomberg Ticker ROTI IJ
52-Week High 1,395
52-Week Low 1,165
FY20F P/E 30.2x
FY20F P/BV 2.8x
Share Outstanding (Mn) 6,186.5
Market Cap. (IDR Tn) 8.1
Share Price Performance
Current Price 1,305
52-Week Target Price 1,540
% Change 18.2%
Highlights (IDR Bn) 2018 2019E 2020F 2021F 2022F
Revenue 2,767 3,322 3,929 4,408 4,834
% growth 11.1% 20.1% 18.3% 12.2% 9.7%
Gross Profit 1,492 1,846 2,160 2,411 2,630
Net Profit 173 278 335 384 420
% growth 18.3% 61.0% 20.5% 14.7% 9.4%
Gross Margin (%) 53.9% 55.6% 55.0% 54.7% 54.4%
Net Margin (%) 6.2% 8.4% 8.5% 8.7% 8.7%
Return on Equity (%) 5.9% 8.9% 9.9% 10.5% 10.7%
Return on Assets (%) 3.9% 5.9% 7.3% 7.7% 7.9%
EPS (IDR) 28 45 51 60 66
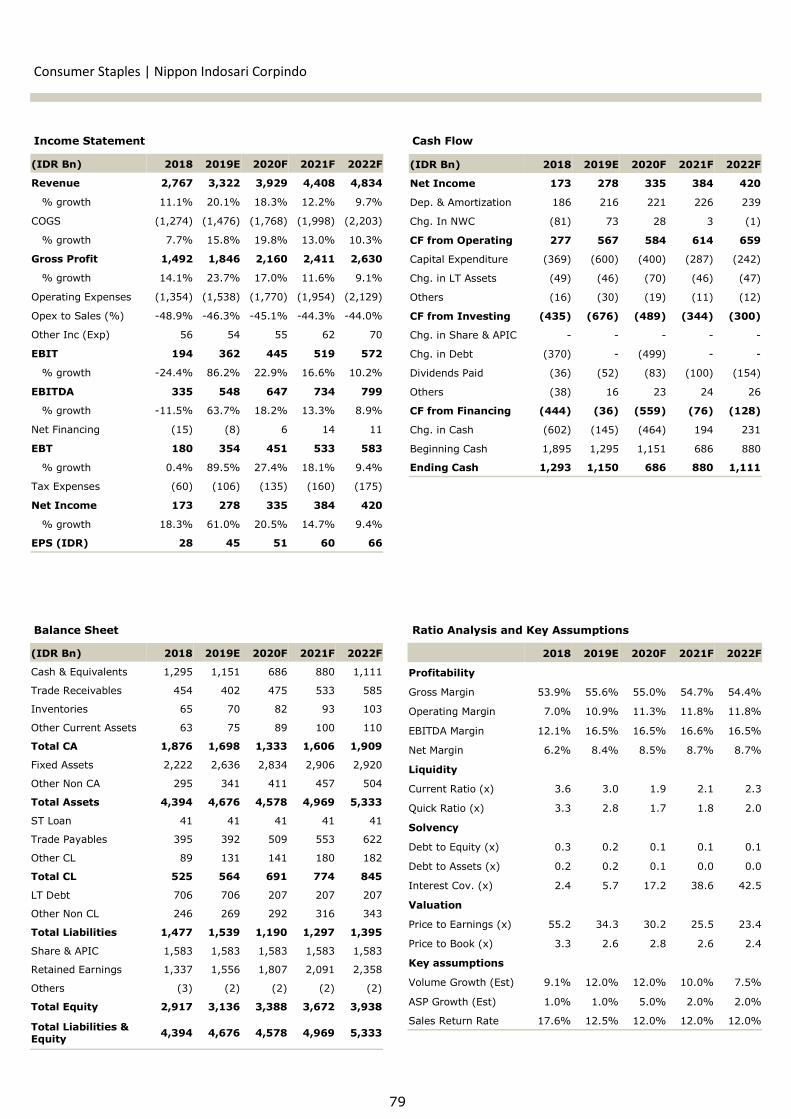
79
Income Statement Cash Flow
Balance Sheet Ratio Analysis and Key Assumptions
Consumer Staples | Nippon Indosari Corpindo
(IDR Bn) 2018 2019E 2020F 2021F 2022F
Revenue 2,767 3,322 3,929 4,408 4,834
% growth 11.1% 20.1% 18.3% 12.2% 9.7%
COGS (1,274) (1,476) (1,768) (1,998) (2,203)
% growth 7.7% 15.8% 19.8% 13.0% 10.3%
Gross Profit 1,492 1,846 2,160 2,411 2,630
% growth 14.1% 23.7% 17.0% 11.6% 9.1%
Operating Expenses (1,354) (1,538) (1,770) (1,954) (2,129)
Opex to Sales (%) -48.9% -46.3% -45.1% -44.3% -44.0%
Other Inc (Exp) 56 54 55 62 70
EBIT 194 362 445 519 572
% growth -24.4% 86.2% 22.9% 16.6% 10.2%
EBITDA 335 548 647 734 799
% growth -11.5% 63.7% 18.2% 13.3% 8.9%
Net Financing (15) (8) 6 14 11
EBT 180 354 451 533 583
% growth 0.4% 89.5% 27.4% 18.1% 9.4%
Tax Expenses (60) (106) (135) (160) (175)
Net Income 173 278 335 384 420
% growth 18.3% 61.0% 20.5% 14.7% 9.4%
EPS (IDR) 28 45 51 60 66
(IDR Bn) 2018 2019E 2020F 2021F 2022F
Net Income 173 278 335 384 420
Dep. & Amortization 186 216 221 226 239
Chg. In NWC (81) 73 28 3 (1)
CF from Operating 277 567 584 614 659
Capital Expenditure (369) (600) (400) (287) (242)
Chg. in LT Assets (49) (46) (70) (46) (47)
Others (16) (30) (19) (11) (12)
CF from Investing (435) (676) (489) (344) (300)
Chg. in Share & APIC - - - - -
Chg. in Debt (370) - (499) - -
Dividends Paid (36) (52) (83) (100) (154)
Others (38) 16 23 24 26
CF from Financing (444) (36) (559) (76) (128)
Chg. in Cash (602) (145) (464) 194 231
Beginning Cash 1,895 1,295 1,151 686 880
Ending Cash 1,293 1,150 686 880 1,111
(IDR Bn) 2018 2019E 2020F 2021F 2022F
Cash & Equivalents 1,295 1,151 686 880 1,111
Trade Receivables 454 402 475 533 585
Inventories 65 70 82 93 103
Other Current Assets 63 75 89 100 110
Total CA 1,876 1,698 1,333 1,606 1,909
Fixed Assets 2,222 2,636 2,834 2,906 2,920
Other Non CA 295 341 411 457 504
Total Assets 4,394 4,676 4,578 4,969 5,333
ST Loan 41 41 41 41 41
Trade Payables 395 392 509 553 622
Other CL 89 131 141 180 182
Total CL 525 564 691 774 845
LT Debt 706 706 207 207 207
Other Non CL 246 269 292 316 343
Total Liabilities 1,477 1,539 1,190 1,297 1,395
Share & APIC 1,583 1,583 1,583 1,583 1,583
Retained Earnings 1,337 1,556 1,807 2,091 2,358
Others (3) (2) (2) (2) (2)
Total Equity 2,917 3,136 3,388 3,672 3,938
Total Liabilities & Equity
4,394 4,676 4,578 4,969 5,333
2018 2019E 2020F 2021F 2022F
Profitability
Gross Margin 53.9% 55.6% 55.0% 54.7% 54.4%
Operating Margin 7.0% 10.9% 11.3% 11.8% 11.8%
EBITDA Margin 12.1% 16.5% 16.5% 16.6% 16.5%
Net Margin 6.2% 8.4% 8.5% 8.7% 8.7%
Liquidity
Current Ratio (x) 3.6 3.0 1.9 2.1 2.3
Quick Ratio (x) 3.3 2.8 1.7 1.8 2.0
Solvency
Debt to Equity (x) 0.3 0.2 0.1 0.1 0.1
Debt to Assets (x) 0.2 0.2 0.1 0.0 0.0
Interest Cov. (x) 2.4 5.7 17.2 38.6 42.5
Valuation
Price to Earnings (x) 55.2 34.3 30.2 25.5 23.4
Price to Book (x) 3.3 2.6 2.8 2.6 2.4
Key assumptions
Volume Growth (Est) 9.1% 12.0% 12.0% 10.0% 7.5%
ASP Growth (Est) 1.0% 1.0% 5.0% 2.0% 2.0%
Sales Return Rate 17.6% 12.5% 12.0% 12.0% 12.0%

Consumer Staples Sector
PT Unicharm Indonesia Tbk.
BUY
We initiate our coverage on PT Unicharm Indonesia Tbk.
(UCID) with a BUY recommendation and target price of IDR
1,900, implying 17.8x FY20F P/E. Began operating in 1997,
UCID managed to establish a nationwide existence and strong
brand equity that led to company’s dominance in all diaper
categories: MamyPoko in baby care, Charm in feminine care, and
LiFree in adult care. Leveraging on company’s synergy with UC
Japan, UCID benefits from a low R&D cost while enjoying parent’s
innovation capabilities and know-how. We believe that would
enable company to maintain its leading position, ride the wave of
growing diaper industry, and ultimately meet its premiumization
strategy. Risks to our call: intensifying competition, Rupiah
depreciation, and dependency on third party distributors.
Premiumization and product mix lead to improving
profitability. UCID is currently focusing to capture opportunities
arising from expanding middle income class by promoting higher
usage of premium products, mainly targeted on feminine care. The
company sees increasing women’s need for comfort as the main
idea to encourage the thinner and night time napkin usage, that
also provides company with higher margins. At the same time,
adult healthcare that provides lucrative margin is also expected to
grow rapidly in the next few years due to the early adoption stage.
The combination of premiumization and product mix should lead to
better profitability ahead. We forecast company’s GPM to expand
from 25.3% in FY18 to 26.3% in FY21F, while NPM improved from
2.2% in FY18 to 5.5% FY21F. In-line, ROE would also rise from
6.7% as of FY18 to 11.0% in FY21F.
Healthy balance sheet and strong FCF generation. UCID owns
a strong balance sheet, as seen from its manageable leverage and
high cash level. Based on our estimate, we see the company to
turn net cash in FY19E as we forecast DER to decline from 0.8x in
FY18 to 0.4x in FY19E and cash from IPO proceeds booked. In
addition to minimum working capital required, company has passed
its heavy capex cycle, thus providing high FCF. However, we expect
a jump in capex in the next two years as it plans to utilize IPO
proceeds to increase capacity for night time feminine napkin and
adult diaper, which are part of company’s area of focus.
80
Stock Information
Bloomberg Ticker UCID IJ
52-Week High N/A
52-Week Low N/A
FY20F P/E 17.8x
FY20F P/BV 1.6x
Share Outstanding (Mn) 4,156.6
Market Cap. (IDR Tn) 6.2
Current Price 1,500
52-Week Target Price 1,900
% Change 26.7%
Highlights (IDR Bn) 2018 2019E 2020F 2021F 2022F
Net Revenue 8,351 8,749 9,454 10,172 10,794
% growth 14.7% 4.8% 8.1% 7.6% 6.1%
Gross Profit 2,110 2,205 2,459 2,673 2,826
Net Profit 181 300 443 557 617
% growth 64.5% 65.6% 47.6% 25.7% 10.7%
Gross Margin (%) 25.3% 25.2% 26.0% 26.3% 26.2%
Net Margin (%) 2.2% 3.4% 4.7% 5.5% 5.7%
Return on Equity (%) 6.7% 8.3% 9.6% 11.0% 11.1%
Return on Assets (%) 2.5% 3.8% 5.0% 6.5% 7.3%
EPS 44 72 107 134 148

81
Income Statement Cash Flow
Balance Sheet Ratio Analysis
Consumer Staples | Unicharm Indonesia
(IDR Bn) 2018 2019E 2020F 2021F 2022F
Net Revenue 8,351 8,749 9,454 10,172 10,794
% growth 14.7% 4.8% 8.1% 7.6% 6.1%
COGS (6,241) (6,544) (6,995) (7,499) (7,968)
Gross Profit 2,110 2,205 2,459 2,673 2,826
% growth 11.4% 4.5% 11.6% 8.7% 5.7%
Operating Expenses (1,607) (1,751) (1,761) (1,910) (2,019)
Opex to Sales 19.2% 20.0% 18.6% 18.8% 18.7%
Operating Profit 503 453 698 763 808
% growth 64.6% -10.0% 54.2% 9.2% 5.9%
EBITDA 819 770 1,037 1,112 1,162
% growth 20.4% -6.0% 34.6% 7.3% 4.5%
Net Financing (24) (8) 10 51 43
Other Expenses (189) (17) (118) (71) (29)
Profit Before Tax 290 429 591 743 822
Tax Expense (109) (129) (148) (186) (205)
Tax Rate 37.5% 30.0% 25.0% 25.0% 25.0%
Net Income 181 300 443 557 617
% growth 64.5% 65.6% 47.6% 25.7% 10.7%
(IDR Bn) 2018 2019E 2020F 2021F 2022F
Net Income 181 300 443 557 617
Depreciation 316 317 338 350 354
Chg. in NWC 128 106 58 74 70
CF from Operating 370 511 724 832 901
Capital Expenditure 22 25 351 184 74
Chg. in LT Assets 1 24 7 10 9
Chg in LT Liabilities (6) 8 7 9 9
CF from Investing (29) (41) (351) (184) (74)
Chg. in Share & APIC - 1,330 - - -
Chg. in Debt (329) (246) (243) (1,506) (61)
Dividends Paid (18) - 60 89 111
Others (0.1) - - - -
CF from Financing (311) 1,084 (303) (1,595) (172)
Change in Cash 29 1,554 70 (946) 654
Beginning Cash 1,111 1,140 2,694 2,764 1,818
Ending Cash 1,140 2,694 2,764 1,818 2,472
(IDR Bn) 2018 2019E 2020F 2021F 2022F
Cash 1,140 2,694 2,764 1,818 2,472
Trade Receivables 1,790 1,967 2,093 2,257 2,411
Inventories 724 713 759 819 875
Total Current Assets 4,145 5,915 6,185 5,496 6,394
Fixed Assets 2,941 2,649 2,661 2,495 2,214
Other Non CA 94 118 125 135 144
Total Assets 7,180 8,681 8,971 8,126 8,752
Trade Payables 932 966 1,028 1,109 1,184
Loans 295 48 48 43 13
Total CL 2,394 2,256 2,398 2,577 2,721
Intercompany Loan 1,884 1,886 1,642 141 110
Other Non-CL 104 112 119 128 137
Total Liabilities 4,382 4,253 4,160 2,847 2,968
Share & APIC 324 1,654 1,654 1,654 1,654
Retained Earnings 2,462 2,762 3,145 3,614 4,118
Minority Interest 0.2 0.2 0.2 0.2 0.2
Other Equity 11.5 11.5 11.5 11.5 11.5
Total Equity 2,798 4,428 4,811 5,279 5,784
2018 2019E 2020F 2021F 2022F
Profitability
ROE 6.7% 8.3% 9.6% 11.0% 11.1%
ROA 2.5% 3.8% 5.0% 6.5% 7.3%
Gross Margin 25.3% 25.2% 26.0% 26.3% 26.2%
Operating Margin 6.0% 5.2% 7.4% 7.5% 7.5%
EBITDA Margin 9.8% 8.8% 11.0% 10.9% 10.8%
Net Margin 2.2% 3.4% 4.7% 5.5% 5.7%
Liquidity
Current Ratio 1.7 2.6 2.6 2.1 2.4
Quick Ratio 1.2 2.1 2.0 1.6 1.8
Solvency
Debt to Equity Ratio 0.8 0.4 0.4 0.0 0.0
Debt to Asset Ratio 0.3 0.2 0.2 0.0 0.0
Int. Coverage Ratio 15.9 23.7 36.5 331.2 493.9
Net Debt to EBITDA 1.3 -1.0 -1.0 -1.5 -2.0

/ŶĚƵƐƚƌŝĂůƐƚĂƚĞ^ĞĐƚŽƌ ĞƩĞƌ/ŶǀĞƐƚŵĞŶƚůŝŵĂƚĞ
KsZt/',d
)RUHLJQ DQG GRPHVWLF LQYHVWPHQW LQ 0 $V RI0 WKH WRWDO '', DQG )', UHDOL]DWLRQ LPSURYHGVLJQLILFDQWO\ IURP <R< LQ 0 WR <R<UHDFKLQJRIWKHWDUJHWRI,'5WQ'XULQJWKH ILUVW VHPHVWHU RI ZKHUH WKHSUHVLGHQWLDO DQGOHJLVODWLYH HOHFWLRQ WRRN SODFH ZH VDZ WKDW '', ZDVTXLWH SHUVLVWHQW LQ JURZWK DV LW FRQWLQXHG WR KDYH DTXDUWHUO\ SRVLWLYH JURZWK VLQFH 4 2Q WKH RWKHUKDQG )', LQ 86' WHUP SRVWHG D ZHDNHU TXDUWHUO\JURZWK XQWLO 4 DQGPDQDJHG WR UHFRUG D IODW4R4JURZWK LQ 4 ,Q 4 DORQH'',ZDV UHSRUWHG DW,'5WQ4R4<R<ZKLOH)',LQ86'WHUPZDVEQ4R4<R<$VWKHHOHFWLRQKDVFRPSOHWHGZHDUHH[SHFWLQJWKHEXVLQHVVHQYLURQPHQW DQG SROLWLFDO VWDELOLW\ WR LPSURYH JRLQJIRUZDUG ZKLFK VKRXOG OHDG WR D EHWWHU LQYHVWPHQWFOLPDWH
'HFHQW SHUIRUPDQFH GHVSLWH PDQ\XQFHUWDLQWLHV 'HVSLWHWKHXQFHUWDLQW\LQWKHEXVLQHVVHQYLURQPHQW ZKLFK ZDV DIIHFWHG E\ WKH SUHVLGHQWLDOHOHFWLRQLQ+LQGXVWULDOODQGVDOHVGXULQJZHUHQRW WKDWZHDN 37 3XUDGHOWD /HVWDUL 7EN '0$6 DQG37 6XU\D 6HPHVWD ,QWHUQXVD 66,$ VXFFHVVIXOO\ERRNHGDQH[FHOOHQW LQGXVWULDO ODQGVDOHV$VRI0'0$666,$DQG%(67UHFRUGHGODQGVDOHVRIKDKDDQGKDUHVSHFWLYHO\)RU'0$6DQG66,$WKH0 ODQG VDOHV DFKLHYHPHQW KDV H[FHHGHG WKH )<ODQG VDOHV UHFRUG +RZHYHU %HNDVL )DMDU %(67SDUWLFXODUO\VKRZHGYHU\ZHDN ODQGVDOHV%HVLGHVZHVHH ODQG LQTXLULHV UHPDLQ KLJK ZKLFK VKRXOG ERRVWIXWXUHVDOHV ,QDGGLWLRQ WKHUHFHQWVL]HDEOH LQGXVWULDOODQGGHPDQGVXUJHZDVDULVLQJ IURPWKHDXWRDXWR-UHODWHG)%DQGH-FRPPHUFHVHFWRUV
6RXUFH%.306LQDUPDV,QYHVWPHQW5HVHDUFK
,QGRQHVLD)',DQG'',UHDOL]DWLRQJURZWK
6RXUFH&RPSDQ\GDWD6LQDUPDV,QYHVWPHQW5HVHDUFK
'HYHORSHUV¶LQGXVWULDOODQGVDOHVKD
65
47
91 90
53 59
33 43
103
60
36
18
31 42
35
1
99
42
23 21 10
2 8
17
-
20
40
60
80
100
120
2012 2013 2014 2015 2016 2017 2018 9M19
DMAS BEST SSIA
20.1%
26.1%
16.5%
-0.3%2.6%
-1.1%
11.7%
-9.4%
8.2%
25.4%
21.3%
39.0%
21.8%
14.9%
20.5% 21.3%
25.3%
17.3%
-20%
-10%
0%
10%
20%
30%
40%
50%
2011 2012 2013 2014 2015 2016 2017 2018 9M19
FDI (USD Mn) DDI (IDR Bn)

/ŶĚƵƐƚƌŝĂůƐƚĂƚĞ^ĞĐƚŽƌKƵƚůŽŽŬ
VKRZQ FRQYLQFLQJ SURJUHVV ,Q (DVW -DNDUWD FRUULGRU-DNDUWD-&LNDPSHN (OHYDWHG 7ROO 5RDG KDV FRPSOHWHGDQG FXUUHQWO\ RSHUDWLQJ WR LPSURYH WUDIILF 0RUHRYHU3DWLPEDQ3RUWZKLFKZRXOGEHDQDXWRPRWLYHLQGXVWU\H[SRUWKXEZRXOGFRPPHQFHLWVRSHUDWLRQLQPLG-ZKHQ WKH ILUVW VWDJH RI FRQVWUXFWLRQ LV FRPSOHWH0HDQZKLOH WKH ILUVW SKDVH RI -DERGHWDEHN /LJKW 5DLO7UDQVLW/57LVH[SHFWHGWRILQLVKE\DQG-DNDUWD-%DQGXQJ +LJK-6SHHG 5DLO +65 LV WDUJHWHG WR IXOO\RSHUDWHE\PLG-:HEHOLHYHWKDWWKHUHDOL]DWLRQRIWKHVH SURMHFWV ZRXOG LQFUHDVH WKH DFFHVVLELOLW\ RI WKHVXUURXQGLQJ DUHDV DQG HVVHQWLDOO\ IXUWKHU EROVWHUEXVLQHVVDFWLYLWLHV:LWKDQRYHUDOOEHWWHULQIUDVWUXFWXUHLQ ,QGRQHVLD LQYHVWRUVZRXOGQRWKHVLWDQW WR LQYHVW LQ,QGRQHVLD
$OOLQDOOZHDUHPRUHSRVLWLYHRQWKHLQGXVWULDOHVWDWHGHYHORSHUVLQ:HEHOLHYHWKHIRFXVDQGLQLWLDWLYHIURPWKHJRYHUQPHQWZRXOGOHDGWRDEHWWHULQYHVWPHQWFOLPDWH LQ ,QGRQHVLD %HLQJ VDLG WKDW WKH LQGXVWULDOHVWDWHVKRXOGKDYHDEHWWHUSHUIRUPDQFHDVLQYHVWPHQWDFWLYLWLHV ULVH 6WRFN SLFN ZLVH ZH GR KDYH '0$6 DVRXUWRSSLFNIRUWKHVHFWRUDVLWZDVEHQHILWWHGIURPLWVELJJHVW XQ-VFDWWHUHG ODQG EDQN GHEW-IUHH DQGLPSURYLQJUHVLGHQWLDO-FRPPHUFLDOVHJPHQW:HEHOLHYH'0$6ZLOOFRQWLQXHSRUWUD\LQJDVWURQJSHUIRUPDQFHLQODQG VDOHVZKLFKZDV VXSSRUWHG E\ LWV SURPLVLQJ ODQGLQTXLU\:HXSJUDGHRXUUHFRPPHQGDWLRQRQ%(67ZLWKDQ$''UDWLQJDV LWSURYLGHVDQXSVLGHSRWHQWLDO IURPWKHYDOXDWLRQSHUVSHFWLYHGHVSLWHLWVVRIWSUH-VDOHV2QWKH RWKHU KDQG ZH PDLQWDLQ 1(875$/ RQ 66,$ ZLWKKLJKHU73RI,'5:HEHOLHYHGYDOXDWLRQKDVSULFHGLQ WKH HDUO\ SURVSHFW RI LWV IXWXUH 6XEDQJ HVWDWH IRU66,$
*RYHUQPHQW¶V IRFXV WR LPSURYH LQYHVWPHQWFOLPDWH ,Q3UHVLGHQW-RNR:LGRGR¶VVHFRQGWHUPKHKDV SURPLVHG WR LPSURYH ,QGRQHVLD¶V LQYHVWPHQWFOLPDWH E\ EULQJLQJ FKDQJHV WR ODERXU UXOHV SXUVXLQJGHUHJXODWLRQ DQG RSHQLQJ XS PRUH HFRQRPLF VHFWRUVIRU IRUHLJQ LQYHVWRUV /DWHO\ WKH ,QGRQHVLDQJRYHUQPHQW LVVXHG D JRYHUQPHQW GHFUHH 33QRWRSURYLGHIXUWKHULQFHQWLYHVIRUSLRQHHULQGXVWULHVWRHQWLFHPRUHIRUHLJQFRPSDQLHVWRLQYHVWLQ,QGRQHVLD )RU H[DPSOH FRPSDQLHV WKDW LQYHVWEHWZHHQ,'5ELOOLRQDQG,'5WULOOLRQFDQHQMR\\HDUVRIWKHWD[KROLGD\ZKLOHLQYHVWLQJDERYH,'5WULOOLRQDOORZV\HDUVRIWKHWD[KROLGD\
)XUWKHUPRUH-RNRZLSODQVWRVKLIWDOORISHUPLW-UHODWHGUHTXLUHPHQWV DQG DXWKRULWLHV EDFN WR ,QGRQHVLD,QYHVWPHQW &RRUGLQDWLQJ %RDUG %.30 ZKLFK ZHUHSUHYLRXVO\ GHFHQWUDOL]HG DW WKH UHODWHG PLQLVWHUV DQGUHJLRQDO JRYHUQPHQW LQ KLV HIIRUW WR LPSURYH,QGRQHVLD¶V UDQNLQJ LQ WKH (DVH RI 'RLQJ %XVLQHVV(R'% LQGH[ WR WK SRVLWLRQ E\ 0HDQZKLOHWKHUHZLOOEHDQ2PQLEXV/DZEHLQJLPSOHPHQWHGLQWKHFRPLQJ \HDUV WR GHUHJXODWH DERXW JRYHUQPHQWSROLFLHVWKDWFDQKLQGHUIRUHLJQLQYHVWRUVZKLFKLQFOXGHWKH DVSHFWV RI ODERXU IOH[LELOLW\ DQG WKH FRUSRUDWH WD[FXWZKLFKZLOOEHSURSRVHGLQ-DQXDU\ ZKLFK VKRXOG OHDG WR WKH LPSURYHPHQW RI,QGRQHVLD¶V DWWUDFWLYHQHVV DV DQ LQYHVWPHQWGHVWLQDWLRQ 7KHUHIRUH ZH H[SHFW WKDW ,QGRQHVLDZRXOG EH VHHQ DV DQ DSSHDOLQJ WDUJHW IRU IRUHLJQLQYHVWRUV -RNRZL¶V VHFRQG WHUP PDLQ SULRULW\ WRLPSURYHKXPDQFDSLWDOZRXOG IXUWKHUDVVLVW LQDOOXULQJLQYHVWRUV %\ KDYLQJ DWWUDFWLYH UHJXODWLRQV DQGGHYHORSHG KXPDQ UHVRXUFHV ,QGRQHVLD ZRXOG KDYHWRXJK-WR-EHDW FRPSHWLWLYH DGYDQWDJHV DPRQJ RWKHUFRXQWULHV 7KHPDVVLYHFRQVWUXFWLRQRILQIUDVWUXFWXUHZRXOGEH EHQHILFLDO IRU WKH QHDUE\ LQGXVWULDO HVWDWHV3UHVLGHQW -RNR :LGRGR ZDQWV WR FRQWLQXH KLVLQIUDVWUXFWXUH YLVLRQ LQ KLV VHFRQG WHUP $V RI QRZPDQ\ LQIUDVWUXFWXUH SURMHFWV DFURVV ,QGRQHVLD KDYH
7LFNHU 5DWLQJ &3 73 &KJ 'LVFWR1$9
'0$6 %8<
%(67 $''
66,$ 1(875$/ -
,QGXVWULDO(VWDWH6HFWRU
6RXUFH$17$5$)2725LVN\$QGULDQWR
-DNDUWD-&LNDPSHNHOHYDWHG
6XSHUGHGXFWLRQWD[IURP33QR
6RXUFH33QR6LQDUPDV,QYHVWPHQW5HVHDUFK
Article Criteria of Taxpayer Tax Relief
29A Labor intensive industry60% deduction on taxable income, calculated from total investment in fixed assets for basic
activities (expensed under certain period)
29BVocational activity (on-
the-job training & internship)
200% deduction on revenue, calculated from total expenses spent on vocational
activity/human resources development
29CResearch &
development
300% deduction on revenue, calculated from 300% (the highest) to total expenses spent on
R&D (expensed in certain period)
XVH6273YDOXDWLRQPHWKRG

/ŶĚƵƐƚƌŝĂůƐƚĂƚĞ^ĞĐƚŽƌ
WdWƵƌĂĚĞůƚĂ>ĞƐƚĂƌŝdďŬ
hz
:HUHLWHUDWHRXU%8<FDOORQ'0$6ZLWK)<73RI,'52XU WDUJHW SULFH UHIOHFWV D GLVFRXQW WR 1$9 DQGLPSOLHVD[3%9 LQ)<).RWD'HOWDPDVKDVEHHQRQHRIWKH PRVW SUHIHUUHG LQGXVWULDO HVWDWHV LQ (DVW -DNDUWD FRUULGRUSURYLGLQJ VL]HDEOH XQ-VFDWWHUHG ODQGV ZLWK FRPSOHWH VXSSRUWLQJIDFLOLWLHV:HFRQWLQXHWRIDYRU'0$6DVLWFDSWXUHVWKHSURVSHFWRILPSURYLQJLQYHVWPHQWRXWORRNLQ,QGRQHVLDDVVHHQIURPKLJKODQGLQTXLULHV2QWKHRWKHUKDQG'0$6¶V IXQGDPHQWDO UHPDLQVUREXVWDVLWKDVPDLQWDLQHGDGHEW-IUHHEDODQFHVKHHWDVWURQJUHFXUULQJLQFRPH JURZWK D SRVLWLYH RSHUDWLQJ FDVK IORZ DQG D KLJK-SURILWPDUJLQ+RZHYHUWKHULVNWRRXUFDOOLVVORZHUWKDQH[SHFWHGODQGVDOHVLQWKHXSFRPLQJSHULRG RQHRI WKHEHVW\HDUV IRU.RWD'HOWDPDV$VRI 0'0$6 PDQDJHG WR UHFRUG SUH-VDOHV RI ,'5 WQ <R<ZKLFKH[FHHGHGLWV)<WDUJHWRI,'5WQ,QGXVWULDOODQGVDOHVRI KD DQG KD FRPPHUFLDO ODQG VDOHV ZHUH ERRNHG LQ WKHSHULRG0RUHRYHULQ4+\XQGDLKDVUHDOL]HGLWVSODQWREX\DQLQGXVWULDO ODQG SORW LQ .RWD 'HOWDPDV 7KH ODQG VL]H ZDV KXJHKD ZKLFK VKRXOG WUDQVODWH WR a,'5 WQ LQ VDOHV )RU WKHUHYHQXH UHFRJQLWLRQ RI +\XQGDL ODQG VDOHV LW FRXOG EH IXOO\UHFRJQL]HGLQRUSDUWO\LQDQG $PSOHODQGLQTXLU\$VRIQRZWKHFRPSDQ\KROGVKDRIODQGLQTXLU\7KH-KDDUHFRPLQJIURPWKHDXWRPRWLYHVHFWRUKDIURPWKHORJLVWLFH-FRPPHUFHDQGWKHUHVWKDDUHPRVWO\IURPWKH FRQVXPHU VHFWRU 1H[W \HDU ZH VHW DQ RSWLPLVWLF ODQG VDOHVWDUJHW RI PRUH WKDQ KD FRQVLGHULQJ WKH LQTXLU\ IURP WKH DXWRVHFWRUDQGVRPHRWKHUVWREHUHDOL]HGLQWKH\HDU *URZLQJ FRPPHUFLDO DUHD WR VXSSRUW WKH UHVLGHQWLDOVHJPHQW 7KHFRPPHUFLDODUHDLQ'HOWDPDVKDVEHHQH[SHULHQFLQJD ORW RI LPSURYHPHQW ODWHO\ 7KHUH ZHUH 0F'RQDOG¶V VHUYLFHGDSDUWPHQW VFKRRODQGXQLYHUVLW\KRWHO DQGPDQ\RWKHUV*RLQJIRUZDUG $(21 PDOO DQG D KRVSLWDO ZLOO VWDUW WKHLU FRQVWUXFWLRQSURJUHVV:HDUHRIWKHYLHZWKDWWKHLPSURYHPHQWLQFRPPHUFLDOZLOOOHDGWREHWWHUVDOHVLQWKHUHVLGHQWLDOSURGXFWLQ'HOWDPDV
^ƚŽĐŬ/ŶĨŽƌŵĂƟŽŶ
ůŽŽŵďĞƌŐdŝĐŬĞƌ D^/:
ϱϮ-tĞĞŬ,ŝŐŚ ϯϱϲ
ϱϮ-tĞĞŬ>Žǁ ϭϱϮ
&zϮϬ&W ϭϲϴdž
&zϮϬ&Ws Ϯϰdž
^ŚĂƌĞKƵƚƐƚĂŶĚŝŶŐ;DŶͿ ϰϴϭϵϴϭ
DĂƌŬĞƚĂƉ;/ZdŶͿ ϭϰϲ
^ŚĂƌĞWƌŝĐĞWĞƌĨŽƌŵĂŶĐĞ
ƵƌƌĞŶƚWƌŝĐĞ ϯϬϮ
ϱϮ-tĞĞŬdĂƌŐĞƚWƌŝĐĞ ϯϲϬ
йŚĂŶŐĞ ϭϵϮй
+LJKOLJKWV,'5%Q ( ) ) )
3UH-VDOHV
JURZWK - - - -
5HYHQXH
5HYHQXHJURZWK - - -
(%,7'$
1HW3URILW
(36,'5
(36JURZWK - - -
3([
3%9[
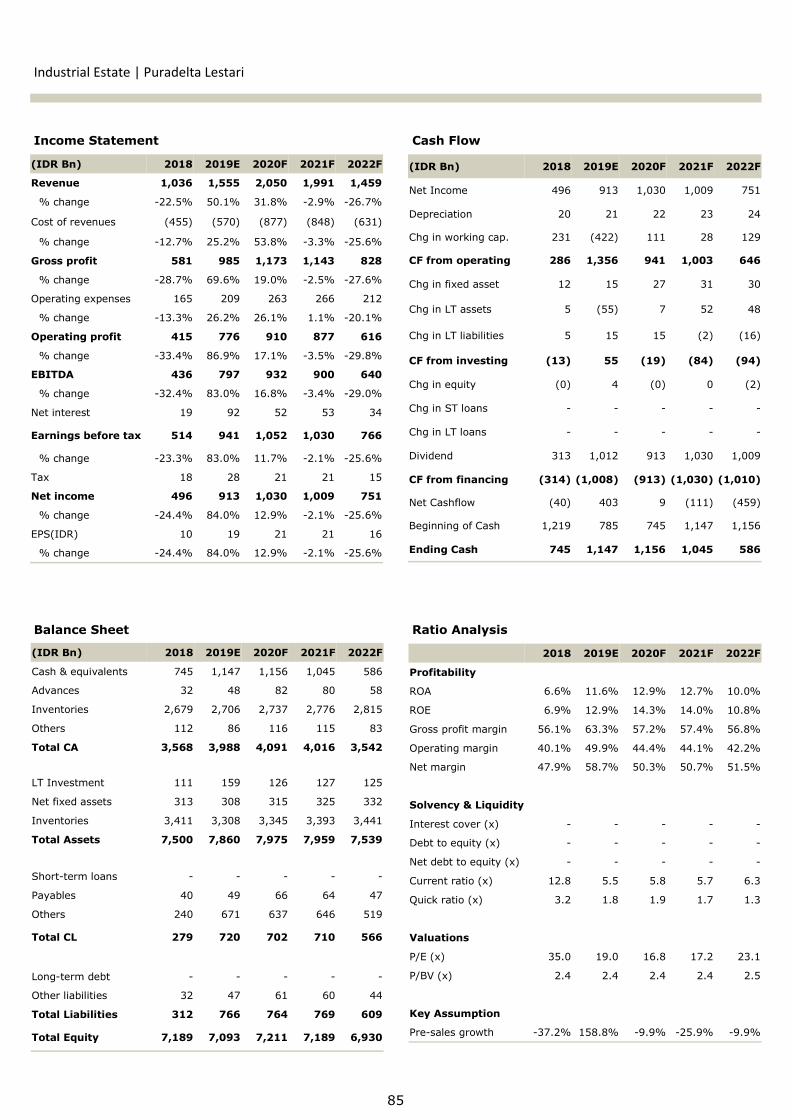
,QFRPH6WDWHPHQW &DVK)ORZ
%DODQFH6KHHW 5DWLR$QDO\VLV
/ŶĚƵƐƚƌŝĂůƐƚĂƚĞWƵƌĂĚĞůƚĂ>ĞƐƚĂƌŝ
,'5%Q ( ) ) )
5HYHQXH
FKDQJH - - -
&RVWRIUHYHQXHV
FKDQJH - - -
*URVVSURILW
FKDQJH - - -
2SHUDWLQJH[SHQVHV
FKDQJH - -
2SHUDWLQJSURILW
FKDQJH - - -
(%,7'$
FKDQJH - - -
1HWLQWHUHVW
(DUQLQJVEHIRUHWD[
FKDQJH - - -
7D[
1HWLQFRPH
FKDQJH - - -
(36,'5
FKDQJH - - -
,'5%Q ( ) ) )
&DVKHTXLYDOHQWV
$GYDQFHV
,QYHQWRULHV
2WKHUV
7RWDO&$
/7,QYHVWPHQW
1HWIL[HGDVVHWV
,QYHQWRULHV
7RWDO$VVHWV
6KRUW-WHUPORDQV - - - - -
3D\DEOHV
2WKHUV
7RWDO&/
/RQJ-WHUPGHEW - - - - -
2WKHUOLDELOLWLHV
7RWDO/LDELOLWLHV
7RWDO(TXLW\
( ) ) )
3URILWDELOLW\ 52$
52(
*URVVSURILWPDUJLQ
2SHUDWLQJPDUJLQ
1HWPDUJLQ
6ROYHQF\/LTXLGLW\ ,QWHUHVWFRYHU[ - - - - -
'HEWWRHTXLW\[ - - - - -
1HWGHEWWRHTXLW\[ - - - - -
&XUUHQWUDWLR[
4XLFNUDWLR[
9DOXDWLRQV 3([
3%9[
.H\$VVXPSWLRQ 3UH-VDOHVJURZWK - - - -
,'5%Q ( ) ) )
1HW,QFRPH
'HSUHFLDWLRQ
&KJLQZRUNLQJFDS
&)IURPRSHUDWLQJ
&KJLQIL[HGDVVHW
&KJLQ/7DVVHWV
&KJLQ/7OLDELOLWLHV
&)IURPLQYHVWLQJ
&KJLQHTXLW\
&KJLQ67ORDQV - - - - -
&KJLQ/7ORDQV - - - - -
'LYLGHQG
&)IURPILQDQFLQJ
1HW&DVKIORZ
%HJLQQLQJRI&DVK
(QGLQJ&DVK
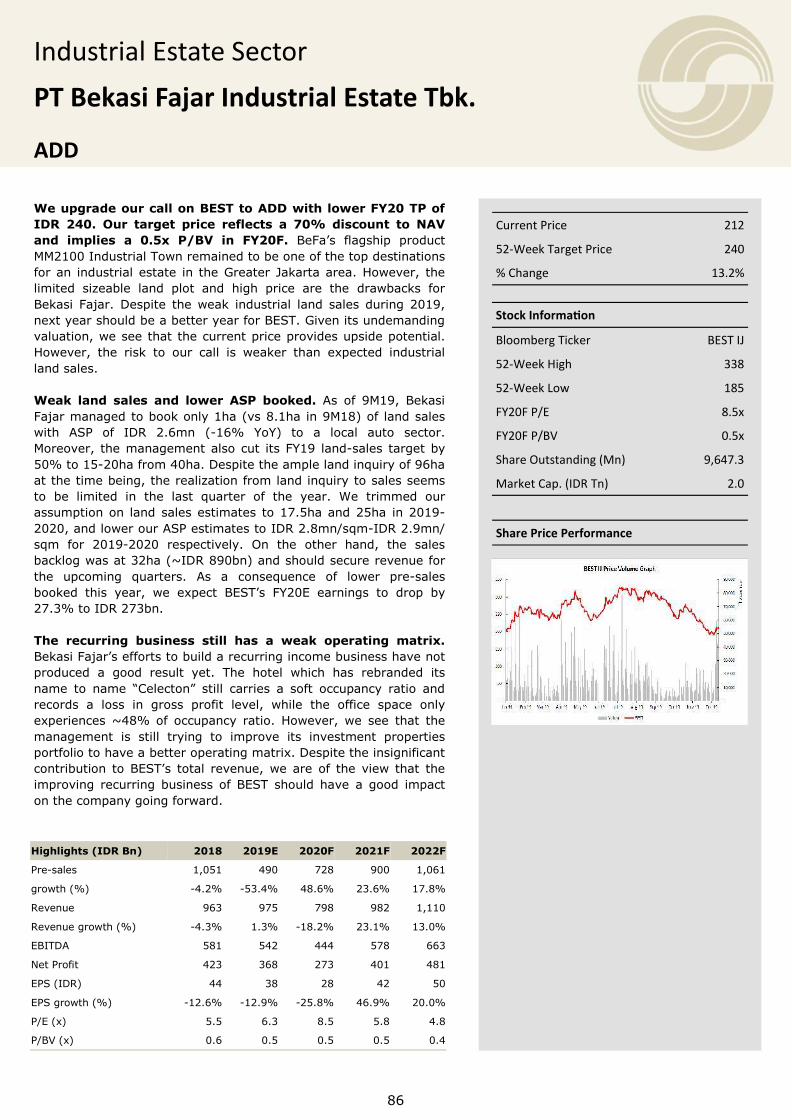
/ŶĚƵƐƚƌŝĂůƐƚĂƚĞ^ĞĐƚŽƌ
WdĞŬĂƐŝ&ĂũĂƌ/ŶĚƵƐƚƌŝĂůƐƚĂƚĞdďŬ
:HXSJUDGHRXUFDOORQ%(67WR$''ZLWKORZHU)<73RI,'5 2XU WDUJHW SULFH UHIOHFWV D GLVFRXQW WR 1$9DQG LPSOLHV D [ 3%9 LQ )<) %H)D¶V IODJVKLS SURGXFW00,QGXVWULDO7RZQUHPDLQHGWREHRQHRIWKHWRSGHVWLQDWLRQVIRUDQ LQGXVWULDOHVWDWH LQ WKH*UHDWHU -DNDUWDDUHD+RZHYHU WKHOLPLWHG VL]HDEOH ODQG SORW DQG KLJK SULFH DUH WKH GUDZEDFNV IRU%HNDVL )DMDU'HVSLWH WKHZHDN LQGXVWULDO ODQG VDOHV GXULQJ QH[W\HDUVKRXOGEHDEHWWHU\HDUIRU%(67*LYHQLWVXQGHPDQGLQJYDOXDWLRQZHVHHWKDWWKHFXUUHQWSULFHSURYLGHVXSVLGHSRWHQWLDO+RZHYHU WKH ULVN WR RXU FDOO LV ZHDNHU WKDQ H[SHFWHG LQGXVWULDOODQGVDOHV :HDN ODQG VDOHV DQG ORZHU $63 ERRNHG $V RI 0 %HNDVL)DMDUPDQDJHGWRERRNRQO\KDYVKD LQ0RI ODQGVDOHVZLWK $63 RI ,'5 PQ - <R< WR D ORFDO DXWR VHFWRU0RUHRYHU WKHPDQDJHPHQWDOVRFXW LWV)< ODQG-VDOHV WDUJHWE\WR-KDIURPKD'HVSLWHWKHDPSOHODQGLQTXLU\RIKDDWWKHWLPHEHLQJWKHUHDOL]DWLRQIURPODQGLQTXLU\WRVDOHVVHHPVWR EH OLPLWHG LQ WKH ODVW TXDUWHU RI WKH \HDU :H WULPPHG RXUDVVXPSWLRQRQ ODQGVDOHVHVWLPDWHV WRKDDQGKD LQ-DQGORZHURXU$63HVWLPDWHVWR,'5PQVTP-,'5PQVTP IRU - UHVSHFWLYHO\ 2Q WKH RWKHU KDQG WKH VDOHVEDFNORJZDVDWKDa,'5EQDQGVKRXOGVHFXUHUHYHQXHIRUWKH XSFRPLQJ TXDUWHUV $V D FRQVHTXHQFH RI ORZHU SUH-VDOHVERRNHG WKLV \HDU ZH H[SHFW %(67¶V )<( HDUQLQJV WR GURS E\WR,'5EQ 7KH UHFXUULQJ EXVLQHVV VWLOO KDV D ZHDN RSHUDWLQJ PDWUL[%HNDVL)DMDU¶VHIIRUWVWREXLOGDUHFXUULQJLQFRPHEXVLQHVVKDYHQRWSURGXFHG D JRRG UHVXOW \HW 7KH KRWHO ZKLFK KDV UHEUDQGHG LWVQDPH WR QDPH ³&HOHFWRQ´ VWLOO FDUULHV D VRIW RFFXSDQF\ UDWLR DQGUHFRUGV D ORVV LQ JURVV SURILW OHYHO ZKLOH WKH RIILFH VSDFH RQO\H[SHULHQFHVaRI RFFXSDQF\ UDWLR +RZHYHU ZH VHH WKDW WKHPDQDJHPHQW LV VWLOO WU\LQJ WR LPSURYH LWV LQYHVWPHQW SURSHUWLHVSRUWIROLRWRKDYHDEHWWHURSHUDWLQJPDWUL['HVSLWHWKHLQVLJQLILFDQWFRQWULEXWLRQ WR%(67¶V WRWDO UHYHQXHZHDUHRI WKHYLHZ WKDW WKHLPSURYLQJ UHFXUULQJ EXVLQHVV RI %(67 VKRXOG KDYH D JRRG LPSDFWRQWKHFRPSDQ\JRLQJIRUZDUG
^ƚŽĐŬ/ŶĨŽƌŵĂƟŽŶ
ůŽŽŵďĞƌŐdŝĐŬĞƌ ^d/:
ϱϮ-tĞĞŬ,ŝŐŚ ϯϯϴ
ϱϮ-tĞĞŬ>Žǁ ϭϴϱ
&zϮϬ&W ϴϱdž
&zϮϬ&Ws Ϭϱdž
^ŚĂƌĞKƵƚƐƚĂŶĚŝŶŐ;DŶͿ ϵϲϰϳϯ
DĂƌŬĞƚĂƉ;/ZdŶͿ ϮϬ
^ŚĂƌĞWƌŝĐĞWĞƌĨŽƌŵĂŶĐĞ
ƵƌƌĞŶƚWƌŝĐĞ ϮϭϮ
ϱϮ-tĞĞŬdĂƌŐĞƚWƌŝĐĞ ϮϰϬ
йŚĂŶŐĞ ϭϯϮй
+LJKOLJKWV,'5%Q ( ) ) )
3UH-VDOHV
JURZWK - -
5HYHQXH
5HYHQXHJURZWK - -
(%,7'$
1HW3URILW
(36,'5
(36JURZWK - - -
3([
3%9[
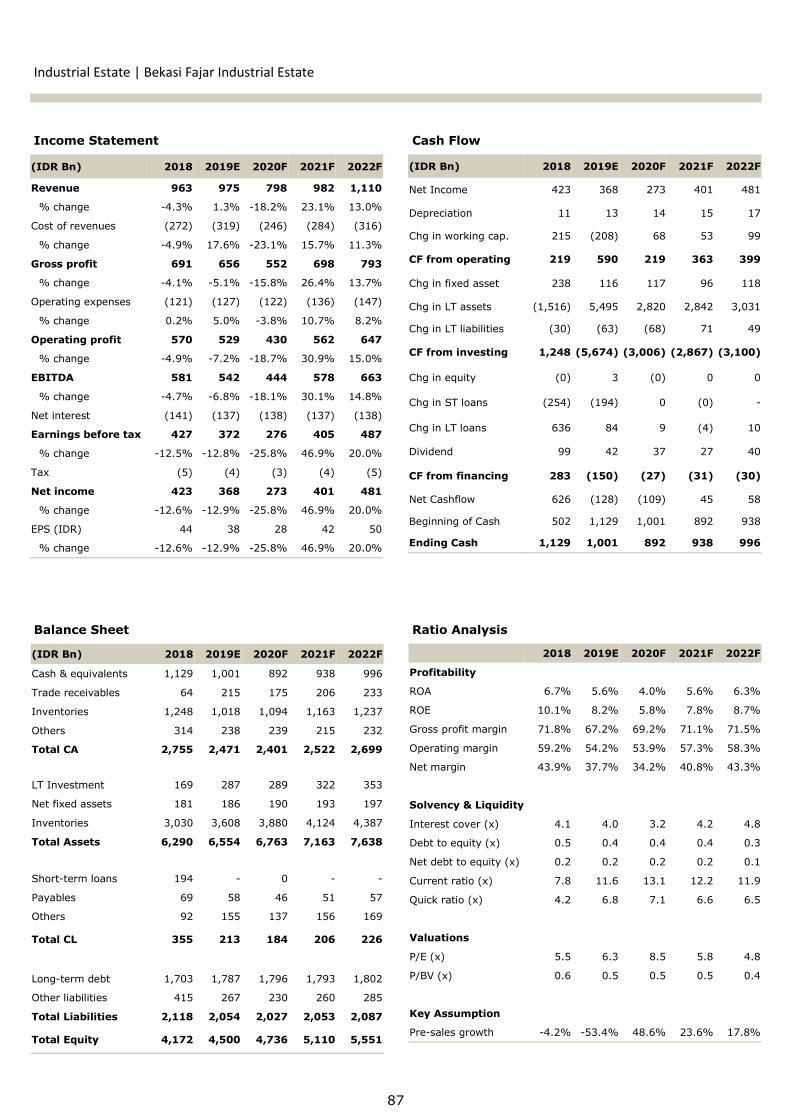
,QFRPH6WDWHPHQW &DVK)ORZ
%DODQFH6KHHW 5DWLR$QDO\VLV
/ŶĚƵƐƚƌŝĂůƐƚĂƚĞĞŬĂƐŝ&ĂũĂƌ/ŶĚƵƐƚƌŝĂůƐƚĂƚĞ
,'5%Q ( ) ) )
5HYHQXH
FKDQJH - -
&RVWRIUHYHQXHV
FKDQJH - -
*URVVSURILW
FKDQJH - - -
2SHUDWLQJH[SHQVHV
FKDQJH -
2SHUDWLQJSURILW
FKDQJH - - -
(%,7'$
FKDQJH - - -
1HWLQWHUHVW
(DUQLQJVEHIRUHWD[
FKDQJH - - -
7D[
1HWLQFRPH
FKDQJH - - -
(36,'5
FKDQJH - - -
,'5%Q ( ) ) )
&DVKHTXLYDOHQWV
7UDGHUHFHLYDEOHV
,QYHQWRULHV
2WKHUV
7RWDO&$
/7,QYHVWPHQW
1HWIL[HGDVVHWV
,QYHQWRULHV
7RWDO$VVHWV
6KRUW-WHUPORDQV - - -
3D\DEOHV
2WKHUV
7RWDO&/
/RQJ-WHUPGHEW
2WKHUOLDELOLWLHV
7RWDO/LDELOLWLHV
7RWDO(TXLW\
( ) ) )
3URILWDELOLW\
52$
52(
*URVVSURILWPDUJLQ
2SHUDWLQJPDUJLQ
1HWPDUJLQ
6ROYHQF\/LTXLGLW\
,QWHUHVWFRYHU[
'HEWWRHTXLW\[
1HWGHEWWRHTXLW\[
&XUUHQWUDWLR[
4XLFNUDWLR[
9DOXDWLRQV
3([
3%9[
.H\$VVXPSWLRQ
3UH-VDOHVJURZWK - -
,'5%Q ( ) ) )
1HW,QFRPH
'HSUHFLDWLRQ
&KJLQZRUNLQJFDS
&)IURPRSHUDWLQJ
&KJLQIL[HGDVVHW
&KJLQ/7DVVHWV
&KJLQ/7OLDELOLWLHV
&)IURPLQYHVWLQJ
&KJLQHTXLW\
&KJLQ67ORDQV -
&KJLQ/7ORDQV
'LYLGHQG
&)IURPILQDQFLQJ
1HW&DVKIORZ
%HJLQQLQJRI&DVK
(QGLQJ&DVK
/ŶĚƵƐƚƌŝĂůƐƚĂƚĞ^ĞĐƚŽƌ
Wd^ƵƌLJĂ^ĞŵĞƐƚĂ/ŶƚĞƌŶƵƐĂdďŬ
EhdZ>
:HUHLWHUDWHRXU1(875$/FDOORQ66,$ZLWKKLJKHU)<73RI,'52XU73LPSOLHV[)<)3%97KHQH[WJURZWKHQJLQHVRI6XU\D6HPHVWDDUHFRPLQJIURPLWV6XEDQJHVWDWHDQGWKH 3DWLPEDQ 3RUW¶V DFFHVV WROO URDG SURMHFW +RZHYHU DV LWFRQWLQXHV WR SUHSDUH WKH 6XEDQJ HVWDWH WR EH UHDG\ IRUPRQHWL]DWLRQLWVHHPVWKDW66,$ZLOOEHKDYLQJDQHZFRPSHWLWLRQLQ WKH DUHD JRLQJ IRUZDUG 2Q WKH RWKHU KDQG .DUDZDQJ ODQGGLYHVWPHQWDQG LPSURYLQJRFFXSDQF\UDWH LQ LWVKRVSLWDOLW\VHUYLFHEXVLQHVVKDYHOHGWREHWWHUSURILWDELOLW\ *HWWLQJ 6XEDQJ LQGXVWULDO HVWDWH UHDG\ 66,$ ZDV KROGLQJ +D ORFDWLRQ SHUPLW LQ 6XEDQJ DQG KDG DFTXLUHG XS WRKD RI ODQG LQ 0 66,$ DOVR RSHQV IRU D SDUWQHUVKLS WRGHYHORSKDRIWKHHVWDWH$VRIQRZJURXQGZRUN LVDOUHDG\ LQSURJUHVVDV66,$SODQVWRKDYHDJURXQGEUHDNLQJFHUHPRQ\LQ-XO\7KHFRPSDQ\VDLG WKDW LWDOUHDG\UHFHLYHGVRPH LQTXLU\ IRU6XEDQJ LQGXVWULDO ODQG IURP -DSDQHVH )% FRPSDQ\ 2WKHU WKDQWKDW66,$PLJKWKDYHD FRPSHWLWLRQ LQ WKH IXWXUH /DWHO\:LMD\D.DU\D :,.$ 3731 9,, DQG 51, VLJQHG DQ 0R8 WR GHYHORSKD LQGXVWULDO HVWDWHV LQ6XEDQJ1HYHUWKHOHVV WKHGHOD\RILQIUDVWUXFWXUH SURMHFWV LQ 6XEDQJ DQG ZHDNHU WKDQ H[SHFWHGLQGXVWULDOODQGVDOHVDUHULVNVWRRXUFDOO 7KH SURVSHFW RI 3DWLPEDQ VHDSRUW WROO-URDG DFFHVV 6XU\D6HPHVWD,QWHUQXVDKDVMRLQHGLQDFRQVRUWLXPOHGE\37-DVD0DUJD3HUVHUR7EN-605ZLWKDSRUWLRQRIRZQHUVKLS,QWKHQHDUIXWXUH WKH FRQVRUWLXPZLOO WDNH SDUW LQ WKH 3DWLPEDQ 3RUW DFFHVVWROOURDGDXFWLRQ%HLQJVDLGWKDWZHDUHSRVLWLYHWKDWWKHSURMHFWLVJRLQJ WR EH WKH FDWDO\VW IRU 66,$ DV LW FRXOG ERRVW WKH UHYHQXHVIURP WKH QHZ FRQWUDFW SURYLGHG WR 15&$ +RZHYHU ZH DUH VWLOOZDLWLQJRQIXUWKHULQIRUPDWLRQRQWKHSURMHFW¶VDXFWLRQSURFHVV 3URPLVLQJ RXWORRN EXW YDOXDWLRQ SULFHG LQ *LYHQ WKH VKDUHSULFH DSSUHFLDWLRQ ZKLFK ZDV DFFRPSDQLHG E\ WKH SHUIRUPDQFHLPSURYHPHQW RI WKH FRPSDQ\ ZH UHLWHUDWH RXU 1(875$/ FDOO RQ66,$:H UDLVHRXU)<73 WR ,'5ZKLFK LV EDVHGRQ6273YDOXDWLRQPHWKRG:H YDOXH 66,$ SURSHUW\ EXVLQHVV ZLWK D GLVFRXQW WR 1$9 DQG D '&) PHWKRG WR YDOXH LWV FRQVWUXFWLRQEXVLQHVV
^ƚŽĐŬ/ŶĨŽƌŵĂƟŽŶ
ůŽŽŵďĞƌŐdŝĐŬĞƌ ^^//:
ϱϮ-tĞĞŬ,ŝŐŚ ϴϱϱ
ϱϮ-tĞĞŬ>Žǁ ϰϱϬ
&zϮϬ&W ϭϰϭdž
&zϮϬ&Ws Ϭϴdž
^ŚĂƌĞKƵƚƐƚĂŶĚŝŶŐ;DŶͿ ϰϳϬϱϮ
DĂƌŬĞƚĂƉ;/ZdŶͿ ϯϯ
^ŚĂƌĞWƌŝĐĞWĞƌĨŽƌŵĂŶĐĞ
ƵƌƌĞŶƚWƌŝĐĞ ϳϬϬ
ϱϮ-tĞĞŬdĂƌŐĞƚWƌŝĐĞ ϳϬϬ
йŚĂŶŐĞ ϬϬй
+LJKOLJKWV,'5%Q ( ) ) )
3UH-VDOHV
JURZWK
5HYHQXH
5HYHQXHJURZWK
(%,7'$
1HW3URILW
(36,'5
(36JURZWK -
3([
3%9[

,QFRPH6WDWHPHQW &DVK)ORZ
%DODQFH6KHHW 5DWLR$QDO\VLV
/ŶĚƵƐƚƌŝĂůƐƚĂƚĞ^ƵƌLJĂ^ĞŵĞƐƚĂ/ŶƚĞƌŶƵƐĂ
,'5%Q ( ) ) )
5HYHQXH
FKDQJH
&RVWRIUHYHQXHV
FKDQJH
*URVVSURILW
FKDQJH
2SHUDWLQJH[SHQVHV
FKDQJH
2SHUDWLQJSURILW
FKDQJH
(%,7'$
FKDQJH
1HWLQWHUHVW
(DUQLQJVEHIRUHWD[
FKDQJH -
7D[
1HWLQFRPH
FKDQJH -
(36,'5
FKDQJH -
,'5%Q ( ) ) )
&DVKHTXLYDOHQWV
7UDGHUHFHLYDEOHV
,QYHQWRULHV
2WKHUV
7RWDO&$
/7,QYHVWPHQW
1HWIL[HGDVVHWV
,QYHQWRULHV
7RWDO$VVHWV
6KRUW-WHUPORDQV
3D\DEOHV
2WKHUV
7RWDO&/
/RQJ-WHUPGHEW
2WKHUOLDELOLWLHV
7RWDO/LDELOLWLHV
7RWDO(TXLW\
( ) ) )
3URILWDELOLW\ 52$
52(
*URVVSURILWPDUJLQ
2SHUDWLQJPDUJLQ
1HWPDUJLQ
6ROYHQF\/LTXLGLW\ ,QWHUHVWFRYHU[
'HEWWRHTXLW\[
1HWGHEWWRHTXLW\[
&XUUHQWUDWLR[
4XLFNUDWLR[
9DOXDWLRQV 3([
3%9[
.H\$VVXPSWLRQ 3UH-VDOHVJURZWK
,'5%Q ( ) ) )
1HW,QFRPH
'HSUHFLDWLRQ
&KJLQZRUNLQJFDS
&)IURPRSHUDWLQJ
&KJLQIL[HGDVVHW
&KJLQ/7DVVHWV
&KJLQ/7OLDELOLWLHV
&)IURPLQYHVWLQJ
&KJLQHTXLW\ - - - - -
&KJLQ67ORDQV
&KJLQ/7ORDQV
'LYLGHQG
&)IURPILQDQFLQJ
1HW&DVKIORZ
%HJLQQLQJRI&DVK
(QGLQJ&DVK

Media Sector
Transforming to Digital
NEUTRAL
Normalizing audience shares. Following a high base
in FY18, SCMA’s prime time audience shares fell by
350bps to date, but are still higher by 420bps than that
of in FY17. The robust achievement in prime time was
driven by the company’s strong presence in drama
series (e.g. Samudra Cinta, Cinta Anak Muda, and Anak
Langit). On the flip side, MNCN’s prime time shares
increased by 250bps to date from FY18 and relatively
stable compared to FY17. One of its drama series,
Tukang Ojek Pengkolan, has received an award as the
best drama series in FY19.
Transformation to digital. Given the strong growth
of the internet and/or other online advertisements,
media companies are forced to tap into digital business
in order to offset the shifting trend. While the two
companies under our coverage have one of its own
(MNCN: RCTI+, SCMA: Vidio), the two digital platforms
have an exact opposite business model. RCTI+,
leveraging MNC Group’s vast contents, serves as the
extension of company’s FTAs, while also offering an
advertising video on demand (AVOD) concept. This will
be an added value for MNCN’s consolidated
performance given that the cost embedded in the
contents have been incurred as company uses its own
library. On the flip side, Vidio runs a subscription based
business model as it charges monthly subscription fee
of IDR 12.9k-50k. From the contents perspective, Vidio
requires a bigger capital compared to RCTI+ as
contents provided are original contents. We view
subscription based business model can be prospective
in the long run once MAU reaches a certain scale.
FY19 in a nutshell. Overall media industry indicated
slowdown in FTA business remains as it online platform
dominates ad spend. Media companies under our
coverage: MNCN and SCMA recorded a soft top-line
growth for TV advertisements where MNCN booked a
5.3% YoY increase while SCMA posted a 3.7% YoY hike
as of 9M19. For TV advertisements, we see a lack of
growth drivers in FY19 compared to FY18 given the
absence of Asian Games and FIFA World Cup.
Meanwhile, consolidated revenue grew by 13.4% YoY
for MNCN and 4.0% YoY for SCMA. Disparity in the top-
line growth was primarily engineered by the existence
of digital business and contents in which MNCN benefits
as an early mover. Moreover, MNCN booked 68.3% YoY
hike on NPAT while SCMA recorded 16.6% YoY decline
on NPAT. SCMA’s sluggish bottom-line figure was due
to the consolidation of its digital business (Vidio).
90
Soft TV advertisement growth
Source: Company data, Sinarmas Investment Research
-
2,000
4,000
6,000
8,000
10,000
12,000
14,000
2014 2015 2016 2017 2018 9M18 9M19
SCMA MNCN
+5.3%
+3.7%
Media | Sector Outlook
adoption of digital business, 2) Negative earnings
contribution from Vidio, and 3) MSCI exclusion in Nov-
19. Onwards, we expect diminishing pressure from
Vidio to SCMA’s bottom-line will uplift the company’s
valuation as premium to MNCN is at 3-years low.
We reiterate our NEUTRAL call on the sector with
SCMA as our top pick (ADD, FY20 TP: 1,650),
while maintaining our neutral stance on MNCN
(NEUTRAL, FY20 TP: 1,650). We prefer SCMA over
MNCN as we believe, aside from undemanding
valuation, positive catalysts ahead derived from better
visibility on rate cards and steady top-line growth with
reduced cost pressure from digital will provide
attractive risk-reward. Our 52-week TP for SCMA
assumes 4.5% FY20F EPS growth with 16.8x FY20F P/E
(-1.0 SD). Be that as it may, upside risks for our sector
call and valuation may come from the rate card hike
should the collaboration works as intended.
Collaboration between MNCN and SCMA. Heading
into 2020, MNCN and SCMA have signed an MoU for
future collaboration for contents production in OTT and
movies. According to our latest discussion with the
management, one of the most immediate impacts on
this collaboration is from the cost/capex side as the two
companies can share the capital needed to produce
contents. While same content may be displayed in both
platforms, management views a greater value accretion
due to the large market size for OTT. This collaboration
is expected to materialize sooner than later as both
companies are eager to expand in digital business.
Nonetheless, details are still under discussion as this
collaboration opens a wide range of opportunities. This
includes increasing rate cards and shortening A/R cycle
to-and-for advertisers. In addition, both managements
also consider cross-selling non-prime time ads slot and
share swap agreement. All of these are intended to
encourage a healthy competition and environment for
the industry.
Converging trend between the two media players.
We have seen a narrowing gap in valuation between
MNCN and SCMA. At the time of this writing, MNCN is
traded at 11.0 forward P/E, while SCMA is traded at
14.0x forward P/E, implying 44.8% discount vs 81.8%
3-yr average. From the historical perspective, MNCN is
traded at +0.9SD, whereas SCMA is traded at –0.8SD.
We think SCMA’s underperformance was due to 1) Late
91
Ticker Rating CP TP % Chg FY20F P/E
SCMA ADD 1,445 1,650 14.2 16.0
MNCN NEUTRAL 1,590 1,650 3.8 11.5
Media sector
30.1
35.8
20
25
30
35
40
45
Jan-17 Apr-17 Jul-17 Oct-17 Jan-18 Apr-18 Jul-18 Oct-18 Jan-19 Apr-19 Jul-19 Oct-19
SCMA MNCN
Prime time audience share rating performance
Source: Company data, Sinarmas Investment Research
RCTI+ and Vidio platform
Source: Company data, Sinarmas Investment Research
0.0%
20.0%
40.0%
60.0%
80.0%
100.0%
120.0%
140.0%
160.0%
180.0%
200.0%
0
5
10
15
20
25
Apr-17 Jul-17 Oct-17 Jan-18 Apr-18 Jul-18 Oct-18 Jan-19 Apr-19 Jul-19 Oct-19
SCMA PE MNCN PE %Discount Average
Valuation gap are at 3-years low
Source: Bloomberg data, Sinarmas Investment Research
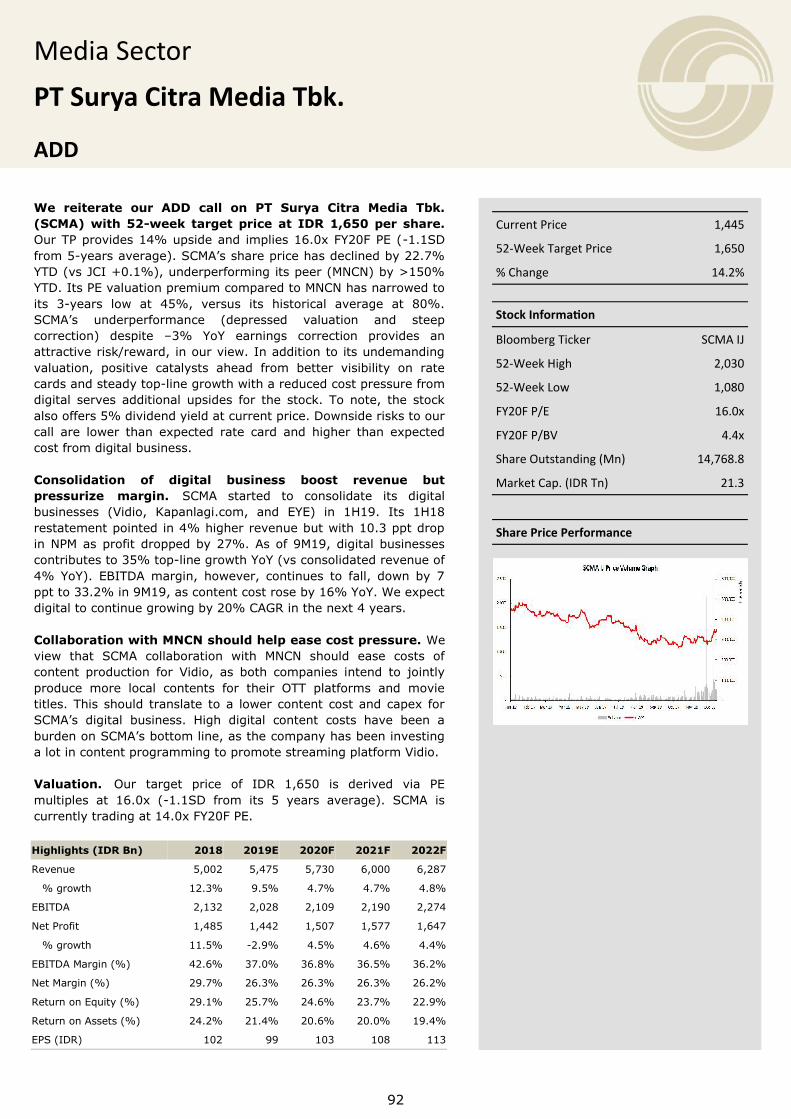
Media Sector
PT Surya Citra Media Tbk.
ADD
We reiterate our ADD call on PT Surya Citra Media Tbk.
(SCMA) with 52-week target price at IDR 1,650 per share.
Our TP provides 14% upside and implies 16.0x FY20F PE (-1.1SD
from 5-years average). SCMA’s share price has declined by 22.7%
YTD (vs JCI +0.1%), underperforming its peer (MNCN) by >150%
YTD. Its PE valuation premium compared to MNCN has narrowed to
its 3-years low at 45%, versus its historical average at 80%.
SCMA’s underperformance (depressed valuation and steep
correction) despite –3% YoY earnings correction provides an
attractive risk/reward, in our view. In addition to its undemanding
valuation, positive catalysts ahead from better visibility on rate
cards and steady top-line growth with a reduced cost pressure from
digital serves additional upsides for the stock. To note, the stock
also offers 5% dividend yield at current price. Downside risks to our
call are lower than expected rate card and higher than expected
cost from digital business.
Consolidation of digital business boost revenue but
pressurize margin. SCMA started to consolidate its digital
businesses (Vidio, Kapanlagi.com, and EYE) in 1H19. Its 1H18
restatement pointed in 4% higher revenue but with 10.3 ppt drop
in NPM as profit dropped by 27%. As of 9M19, digital businesses
contributes to 35% top-line growth YoY (vs consolidated revenue of
4% YoY). EBITDA margin, however, continues to fall, down by 7
ppt to 33.2% in 9M19, as content cost rose by 16% YoY. We expect
digital to continue growing by 20% CAGR in the next 4 years.
Collaboration with MNCN should help ease cost pressure. We
view that SCMA collaboration with MNCN should ease costs of
content production for Vidio, as both companies intend to jointly
produce more local contents for their OTT platforms and movie
titles. This should translate to a lower content cost and capex for
SCMA’s digital business. High digital content costs have been a
burden on SCMA’s bottom line, as the company has been investing
a lot in content programming to promote streaming platform Vidio.
Valuation. Our target price of IDR 1,650 is derived via PE
multiples at 16.0x (-1.1SD from its 5 years average). SCMA is
currently trading at 14.0x FY20F PE.
92
Stock Information
Bloomberg Ticker SCMA IJ
52-Week High 2,030
52-Week Low 1,080
FY20F P/E 16.0x
FY20F P/BV 4.4x
Share Outstanding (Mn) 14,768.8
Market Cap. (IDR Tn) 21.3
Share Price Performance
Current Price 1,445
52-Week Target Price 1,650
% Change 14.2%
Highlights (IDR Bn) 2018 2019E 2020F 2021F 2022F
Revenue 5,002 5,475 5,730 6,000 6,287
% growth 12.3% 9.5% 4.7% 4.7% 4.8%
EBITDA 2,132 2,028 2,109 2,190 2,274
Net Profit 1,485 1,442 1,507 1,577 1,647
% growth 11.5% -2.9% 4.5% 4.6% 4.4%
EBITDA Margin (%) 42.6% 37.0% 36.8% 36.5% 36.2%
Net Margin (%) 29.7% 26.3% 26.3% 26.3% 26.2%
Return on Equity (%) 29.1% 25.7% 24.6% 23.7% 22.9%
Return on Assets (%) 24.2% 21.4% 20.6% 20.0% 19.4%
EPS (IDR) 102 99 103 108 113
93
Income Statement Cash Flow
Balance Sheet Ratio Analysis
Media | Surya Citra Media
(IDR Bn) 2018 2019E 2020F 2021F 2022F
Cash & equivalents 830 1,260 1,725 2,218 2,726
Trade receivables 1,555 1,728 1,798 1,866 1,914
Other CA 1,042 1,134 1,179 1,224 1,269
Total CA 3,427 4,122 4,702 5,308 5,909
PPE 1,050 1,071 1,089 1,103 1,113
Other LT assets 1,662 1,555 1,520 1,487 1,458
Total Assets 6,138 6,748 7,311 7,898 8,480
Payables 486 544 586 627 639
Short-term loans 16 12 10 10 10
Others 301 344 361 377 393
Total CL 804 901 957 1,015 1,043
Long term liabilities 231 231 231 231 231
Total Liabilities 1,035 1,132 1,188 1,245 1,274
Share & APIC 1,010 1,010 1,010 1,010 1,010
Retained earnings 3,552 3,985 4,437 4,910 5,404
NCI 531 602 656 713 772
Other 10 20 20 20 20
Total Equity 5,103 5,616 6,123 6,653 7,206
Total Equity & Lia-bilities
6,138 6,748 7,311 7,898 8,480
2018 2019E 2020F 2021F 2022F
Profitability
ROE 29.1% 25.7% 24.6% 23.7% 22.9%
ROA 24.2% 21.4% 20.6% 20.0% 19.4%
EBITDA Margin 42.6% 37.0% 36.8% 36.5% 36.2%
Net profit margin 29.7% 26.3% 26.3% 26.3% 26.2%
Liquidity & Solvency
Current Ratio 4.3 4.6 4.9 5.2 5.7
Debt to Equity 0.0 0.0 0.0 0.0 0.0
Debt to Assets 0.0 0.0 0.0 0.0 0.0
Valuation
Price to Earning (PE) 16.2 16.7 16.0 15.3 14.6
Price to Book (PBV) 5.3 4.8 4.4 4.1 3.7
(IDR Bn) 2018 2019E 2020F 2021F 2022F
Revenue 5,002 5,475 5,730 6,000 6,287
Prog. & broadcasting (2,157) (2,521) (2,646) (2,784) (2,938)
Operating exp (906) (1,019) (1,071) (1,122) (1,170)
Other income/exp (1) (20) (21) (24) (29)
Operating Profit 1,938 1,914 1,992 2,069 2,150
EBITDA 2,132 2,028 2,109 2,190 2,274
Profit/loss from JV 9 - - - -
Finance income(exp) 22 39 53 68 83
EBT 1,969 1,953 2,045 2,137 2,233
Tax (494) (497) (523) (544) (569)
NCI 10 (15) (15) (16) (17)
Net profit 1,485 1,442 1,507 1,577 1,647
(IDR Bn) 2018 2019E 2020F 2021F 2022F
Net Income 1,485 1,442 1,507 1,577 1,647
Depreciation 185 113 117 121 124
Chg. in NWC 13 164 57 55 65
CF from Operating 1,657 1,391 1,568 1,642 1,706
Capital Expenditure 159 88 88 88 88
Chg. in LT Assets 61 (60) 12 15 17
Chg in LT Liabilities (4) - - - -
CF from Investing (224) (27) (100) (102) (105)
Chg. in Share & APIC - - - - -
Chg. in Bank Loans (50) (5) (2) - -
Dividends Paid 804 1,010 1,055 1,104 1,153
Others 17 81 54 57 59
CF from Financing (837) (934) (1,003) (1,047) (1,093)
Change in Cash 596 430 465 493 508
Beginning Cash 234 830 1,260 1,725 2,218
Ending Cash 830 1,260 1,725 2,218 2,726

Media Sector
PT Media Nusantara Citra Tbk.
NEUTRAL
We maintain our NEUTRAL recommendation on PT Media
Nusantara Citra Tbk. (MNCN) with 52-week target price of
IDR 1,650 per share, implying 11.5x FY20F P/E (-0.3SD
from 5-years average). Our neutral rating is on the back of the
company’s demanding valuation since the share price has rallied by
140% YTD, leading to a valuation gap with SCMA to 3-years low at
45% (vs historical avg. of 80%). In addition to that, we expect
digital business to grow at a calmer rate while FTA business to
grow by mid-to-low single digit. Upside risks to our call are
significant hike in rate card and robust performance from digital
business.
Normalizing growth from digital business. Being a content
king in Indonesia’s mass market media industry, MNCN managed to
capture the growing opportunities from digital media business by
launching its own streaming platform: RCTI+ in 2H19 while also
monetizing from its contents uploaded on the company’s YouTube
channels. Growing from a low base, MNCN’s digital business has
been growing by an exponential rate and we estimate the
segment’s contribution reaching 8% in FY19E. Nevertheless, we
expect the growth momentum to decelerate in the coming years on
the back of a high base growth reading as well as rising
competition from both local and foreign OTT players such as Vidio,
HOOQ, Viu, MAXstream, Iflix, Viu, and Netflix.
Venturing into a healthier industry outlook through
collaboration. As MNCN and SCMA have announced partnership to
jointly work on contents production for OTT and movies, we expect
MNCN to have a wider range of contents library while bearing a
minimum cost and risk level. The management also expects rate
card to increase by a total of 25% in FY20F, or specifically 10% in
1Q20 and another 15% prior to Lebaran period. However, we have
yet to take into account the aggressive rate card adjustment in our
FY20F forecast as we view that the feasibility of prior mentioned
plans highly depends on various factors including competitor’s
strategy, ads demand, and company’s audience share performance.
94
Stock Information
Bloomberg Ticker MNCN IJ
52-Week High 1,705
52-Week Low 675
FY20F P/E 11.5x
FY20F P/BV 1.7x
Share Outstanding (Mn) 14,276.1
Market Cap. (IDR Tn) 22.7
Share Price Performance
Current Price 1,590
52-Week Target Price 1,650
% Change 3.8%
Highlights (IDR Bn) 2018 2019E 2020F 2021F 2022F
Revenue 7,444 8,267 8,604 8,933 9,246
% growth 5.5% 11.1% 6.0% 3.8% 3.5%
EBITDA 3,177 3,378 3,441 3,513 3,586
Net Profit 1,531 1,999 2,056 2,143 2,244
% growth 5.4% 30.5% 2.8% 4.3% 4.7%
EBITDA Margin (%) 42.7% 40.9% 40.0% 39.3% 38.8%
Net Margin (%) 20.6% 24.2% 23.9% 24.0% 24.3%
Return on Equity (%) 13.9% 16.3% 15.1% 14.3% 13.7%
Return on Assets (%) 9.3% 11.3% 11.0% 10.9% 11.0%
EPS (IDR) 107 140 144 150 157
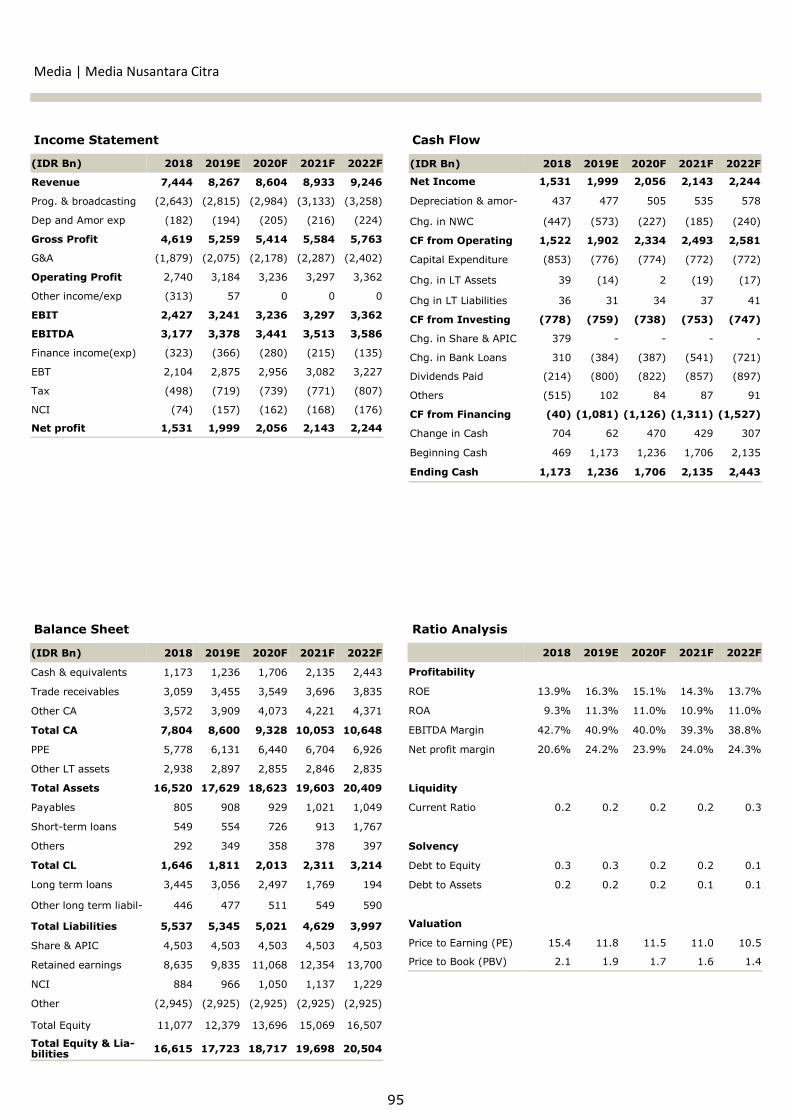
95
Income Statement Cash Flow
Balance Sheet Ratio Analysis
Media | Media Nusantara Citra
(IDR Bn) 2018 2019E 2020F 2021F 2022F
Cash & equivalents 1,173 1,236 1,706 2,135 2,443
Trade receivables 3,059 3,455 3,549 3,696 3,835
Other CA 3,572 3,909 4,073 4,221 4,371
Total CA 7,804 8,600 9,328 10,053 10,648
PPE 5,778 6,131 6,440 6,704 6,926
Other LT assets 2,938 2,897 2,855 2,846 2,835
Total Assets 16,520 17,629 18,623 19,603 20,409
Payables 805 908 929 1,021 1,049
Short-term loans 549 554 726 913 1,767
Others 292 349 358 378 397
Total CL 1,646 1,811 2,013 2,311 3,214
Long term loans 3,445 3,056 2,497 1,769 194
Other long term liabil- 446 477 511 549 590
Total Liabilities 5,537 5,345 5,021 4,629 3,997
Share & APIC 4,503 4,503 4,503 4,503 4,503
Retained earnings 8,635 9,835 11,068 12,354 13,700
NCI 884 966 1,050 1,137 1,229
Other (2,945) (2,925) (2,925) (2,925) (2,925)
Total Equity 11,077 12,379 13,696 15,069 16,507
Total Equity & Lia-bilities
16,615 17,723 18,717 19,698 20,504
2018 2019E 2020F 2021F 2022F
Profitability
ROE 13.9% 16.3% 15.1% 14.3% 13.7%
ROA 9.3% 11.3% 11.0% 10.9% 11.0%
EBITDA Margin 42.7% 40.9% 40.0% 39.3% 38.8%
Net profit margin 20.6% 24.2% 23.9% 24.0% 24.3%
Liquidity
Current Ratio 0.2 0.2 0.2 0.2 0.3
Solvency
Debt to Equity 0.3 0.3 0.2 0.2 0.1
Debt to Assets 0.2 0.2 0.2 0.1 0.1
Valuation
Price to Earning (PE) 15.4 11.8 11.5 11.0 10.5
Price to Book (PBV) 2.1 1.9 1.7 1.6 1.4
(IDR Bn) 2018 2019E 2020F 2021F 2022F
Revenue 7,444 8,267 8,604 8,933 9,246
Prog. & broadcasting (2,643) (2,815) (2,984) (3,133) (3,258)
Dep and Amor exp (182) (194) (205) (216) (224)
Gross Profit 4,619 5,259 5,414 5,584 5,763
G&A (1,879) (2,075) (2,178) (2,287) (2,402)
Operating Profit 2,740 3,184 3,236 3,297 3,362
Other income/exp (313) 57 0 0 0
EBIT 2,427 3,241 3,236 3,297 3,362
EBITDA 3,177 3,378 3,441 3,513 3,586
Finance income(exp) (323) (366) (280) (215) (135)
EBT 2,104 2,875 2,956 3,082 3,227
Tax (498) (719) (739) (771) (807)
NCI (74) (157) (162) (168) (176)
Net profit 1,531 1,999 2,056 2,143 2,244
(IDR Bn) 2018 2019E 2020F 2021F 2022F
Net Income 1,531 1,999 2,056 2,143 2,244
Depreciation & amor- 437 477 505 535 578
Chg. in NWC (447) (573) (227) (185) (240)
CF from Operating 1,522 1,902 2,334 2,493 2,581
Capital Expenditure (853) (776) (774) (772) (772)
Chg. in LT Assets 39 (14) 2 (19) (17)
Chg in LT Liabilities 36 31 34 37 41
CF from Investing (778) (759) (738) (753) (747)
Chg. in Share & APIC 379 - - - -
Chg. in Bank Loans 310 (384) (387) (541) (721)
Dividends Paid (214) (800) (822) (857) (897)
Others (515) 102 84 87 91
CF from Financing (40) (1,081) (1,126) (1,311) (1,527)
Change in Cash 704 62 470 429 307
Beginning Cash 469 1,173 1,236 1,706 2,135
Ending Cash 1,173 1,236 1,706 2,135 2,443

Metal Sector
Improving Balance
NEUTRAL
What do we expect in FY20? Despite recent
weakness, we forecast nickel price to rebound in FY20
as we see the current inventory remains low while
demand will still grow modestly paired with a moderate
supply growth as higher refined output will be strained
by lower ore availability from Indonesia’s ore export
ban. Wood Mackenzie forecasts demand to grow by
3.8% YoY in FY20, slowing down from 6.3% in FY19.
Stainless steel and EV batteries remain to be the
engine drivers for nickel consumption growth. On the
other hand, refined nickel output is forecasted to grow
by 5.3% in FY20, declining from 8.3% in FY19. Nickel
mined production, however, is expected to drop by 3%
YoY. These should level out the demand/supply balance
in FY20, after posting a supply deficit in the past 4
years. We forecast nickel price to average at USD
15,000 per ton in FY20, rising from USD 14,000 per ton
average in FY19.
FY19 in a nutshell. After recent outperformance in
3Q19 boosted by the changes in Indonesia ore export
ban regulation, nickel stocks dived in recent months as
nickel price pulled back to USD 13,000 per ton from its
highest level at USD 18,050 in Sep-19. Recent nickel
fallout was driven by weakness in the stainless steel
and EV sales department. Stainless steel price has
dropped by 11.4% from its peak in FY19 due to a
lackluster demand and an increase in raw material
cost. Meanwhile, EV sales in China plummeted following
Chinese government’s decision to cut subsidy in Jun-
19. On the other hand, we see supplies flooding due to
ramping up of ore export coming from Indonesia prior
to the export ban deadline (Jan-20). We saw a
significant jump in Indonesia ore export to 5.9 wmt in
Oct-19 (+200% YoY, +50.9% MoM). Most of them
were absorbed by Chinese players, shown by their
recent jump in ore inventory (+9.1% YoY).
96
Source: Bloomberg, Sinarmas Investment Research
Metal sector vs JCI
Source: Bloomberg, Sinarmas Investment Research
Nickel demand/surplus balance
-30.0%
-20.0%
-10.0%
0.0%
10.0%
20.0%
30.0%
40.0%
50.0%
60.0%
70.0%
80.0%
Dec-18 Jan-19 Feb-19 Mar-19 Apr-19 May-19 Jun-19 Jul-19 Aug-19 Sep-19 Oct-19 Nov-19
JCI Index Nickel Stocks LME Price
(40,000)
(30,000)
(20,000)
(10,000)
-
10,000
20,000
30,000
40,000
50,000
-
50,000
100,000
150,000
200,000
250,000
Apr-
01
Aug-0
1
Dec-0
1
Apr-
02
Aug-0
2
Dec-0
2
Apr-
03
Aug-0
3
Dec-0
3
Apr-
04
Aug-0
4
Dec-0
4
Apr-
05
Aug-0
5
Dec-0
5
Apr-
06
Aug-0
6
Dec-0
6
Apr-
07
Aug-0
7
Dec-0
7
Apr-
08
Aug-0
8
Dec-0
8
Apr-
09
Aug-0
9
Dec-0
9
Apr-
10
Aug-1
0
Dec-1
0
Apr-
11
Aug-1
1
Dec-1
1
Apr-
12
Aug-1
2
Dec-1
2
Apr-
13
Aug-1
3
Dec-1
3
Apr-
14
Aug-1
4
Dec-1
4
Apr-
15
Aug-1
5
Dec-1
5
Apr-
16
Aug-1
6
Dec-1
6
Apr-
17
Aug-1
7
Dec-1
7
Apr-
18
Aug-1
8
Dec-1
8
Apr-
19
Aug-1
9
Surplus/Deficit Global Nickel Demand (Ton) Global Nickel Production (Ton)

Metal | Sector Outlook
Steady nickel demand growth. Global demand for
nickel is expected to grow steadily by 3% CAGR in the
next 5 years. Stainless steel and EV batteries will
remain as the engine drivers for growth. Stainless
steel, currently representing 68% of total nickel
demand, is expected to grow by 3.7% in FY20. Despite
recent weakness, Chinese government’s stimulus to
boost the economy through infrastructure projects
should help improving the demand. We should see a
modest recovery in the latter half of 2020, post
Chinese holiday season. This should level out the
demand/supply balance for FY20.
We downgrade our rating to NEUTRAL on metal
sector, despite potential price rebound, as we see
current share price offers limited upside potentials.
Using our long term (LT) nickel price assumption at
USD 16k per ton, our DCF-based valuation arrived at a
fair price of IDR 3,700 and IDR 970 per share
respectively for INCO and ANTM, which offers a limited
upside from current market price. As a result, we have
an ADD call for ANTM (14% upside) and NEUTRAL
rating for INCO (6% upside). Upside risks to our call
are higher than expected nickel price, unexpected
supply disruption and lower than expected inventory.
Indonesia brings forward nickel ore export ban.
Nickel price had rallied in Sep-19, reaching its peak of
USD 18,050 after the announcement that Indonesia will
bring forward its nickel ore export ban regulation from
2022 to the beginning of 2020. This was intended to
promote the development of value added products for
refined nickel output. To illustrate the impacts of such
regulation, as of 10M19, Indonesia has exported 26.6
mn wmt of nickel ore, this is equivalent to ~270k ton
of refined nickel which is around 11% of global refined
nickel demand. Due to fear of shortage supply, traders
have been stocking up nickel, causing the price to
shoot up. However, prior to the deadline, Indo ore
miners have been ramping up their export. In oct-19,
ore export jumped significantly to 5.9 wmt (+200%
YoY, +50.9% MoM).
Nickel supply dynamics. Wood Mackenzie expects
nickel mined production to decline by 3% YoY while
refined production to rise by 5.3% YoY in FY20. Global
mined nickel production is set to drop due to
Indonesia’s ore export ban, while the acceleration of
Indonesia’s smelter projects should boost refined
output. Wood Mackenzie also expect refined production
to remain flat in FY21 due to reduction in Chinese NPI
output resulting from lower ore availability from
Indonesia. This should help offset potential NPI
increase from Indonesia, primarily coming from further
expansion from Tsingshan Morowali and Virtue Dragon.
97
Source: Bloomberg, Sinarmas Investment Research
Indonesia ore export jump in Oct-19
Ticker Rating CP TP % Chg FY20F P/E
INCO NEUTRAL 3,490 3,700 6.0 28.5
ANTM ADD 850 970 14.1 24.6
Metal sector
Source: Wood Mackenzie, Sinarmas Investment Research
Indonesia rising refined nickel output
Global refined nickel supply-demand balance (kt)
2018 2019 2020 2021
Refined production capability 2103 2233 2421 2593
Forecast disruption allowance -4 -52 -52
Base case refined output 2233 2417 2542 2533
Forecast market adjusment 1 5 13
Actual/forecast refined output 2233 2418 2547 2546
Consumption 2300 2445 2538 2617
Balance -68 -26 8 -70
Source: Wood Mackenzie, Sinarmas Investment Research
Global refined nickel supply-demand balance (kt)
0
500
1000
1500
2000
2500
3000
2015 2016 2017 2018 2019 2020 2021
China Indonesia Japan Oceania Others
-50.00
0.00
50.00
100.00
150.00
200.00
250.00
-2.00
0.00
2.00
4.00
6.00
8.00
10.00
Jan-1
2
Apr-
12
Jul-
12
Oct
-12
Jan-1
3
Apr-
13
Jul-
13
Oct
-13
Jan-1
4
Apr-
14
Jul-
14
Oct
-14
Jan-1
5
Apr-
15
Jul-
15
Oct
-15
Jan-1
6
Apr-
16
Jul-
16
Oct
-16
Jan-1
7
Apr-
17
Jul-
17
Oct
-17
Jan-1
8
Apr-
18
Jul-
18
Oct
-18
Jan-1
9
Apr-
19
Jul-
19
Oct
-19
Nickel Ore (mn wmt) Ferronickel (mn Mt)

Metal Sector
PT Vale Indonesia Tbk.
NEUTRAL
We downgrade our recommendation from ADD to NEUTRAL
on PT Vale Indonesia Tbk. (INCO) with 52-week target price
of IDR 3,700. Our TP provides 6% upside potential and implies
28.5x FY20F PE and 1.3x FY20F PBV. Though we remain positive on
LT nickel price, we see limited upside for the stock due to recent
share price rally. We expect nickel price to average at USD 15k per
ton in FY20 which will bring INCO’s earnings to USD 94 mn,
doubled the profit that we have estimated for FY19E. Upside risks
to our call are higher than expected nickel price, lower than
expected cash cost and better than expected global economic data.
Still the best proxy for nickel recovery. Being a pure nickel
player in the industry, INCO is one of the best proxies and
beneficiaries of rising nickel price. In addition, since INCO only sells
refined nickel (nickel matte), they are not impacted by the recent
Indonesia’s regulation on export ore ban. Using our base case
scenario of LME nickel price at USD 15k, we forecast INCO to book
an earnings of USD 94 mn in FY20. Accordingly, ROE will also
improve from 2.1% in FY19E to 4.6% in FY20F. On another note,
our sensitivity analyst suggest that every 1% increase in nickel
price will raise INCO’s earnings by 4.5%.
Update on stake divestment. After months of overhang in
INCO’s 20% stake divestment, local news have reported that the
deal agreement is getting closer to completion. Inalum mentioned
that they will be acquiring 20% stake of INCO for USD 500 mn.
This implies a market price of ~IDR 3,600. Official signing of the
conditional sales and purchase agreement is expected to be
completed in end of Dec-19, while the closing transaction will
happen in Jun-20.
Valuation. Our target price of IDR 3,700 per share is derived from
DCF based valuation (11% WACC) throughout its life of mine and
using LT nickel price assumption at USD 16k per ton. Hence, we
see limited upsides on the stock as we believe the market is
currently valuing INCO near our LT nickel price. INCO is currently
trading at 26.8x FY20 forward PE and 1.2x FY20 forward PBV.
98
Stock Information
Bloomberg Ticker INCO IJ
52-Week High 4,320
52-Week Low 2,410
FY20F P/E 28.5x
FY20F P/BV 1.3x
Share Outstanding (Mn) 9,936.3
Market Cap. (IDR Tn) 34.7
Share Price Performance
Current Price 3,490
52-Week Target Price 3,700
% Change 6.0%
Highlights (USD Mn) 2018 2019E 2020F 2021F 2022F
Revenue 777 733 806 958 1,073
% growth 23.4% -5.7% 10.0% 18.9% 12.0%
Gross Profit 104 80 153 243 296
Net Profit 61 40 94 158 196
% growth N/A -34.2% 135.1% 68.3% 24.5%
Gross Margin (%) 13.4% 11.0% 19.0% 25.3% 27.6%
Net Margin (%) 7.8% 5.4% 11.6% 16.4% 18.3%
Return on Equity (%) 3.2% 2.1% 4.6% 7.1% 8.0%
Return on Assets (%) 2.7% 1.8% 3.9% 5.9% 6.6%
EPS (USD) 0.006 0.004 0.009 0.016 0.020
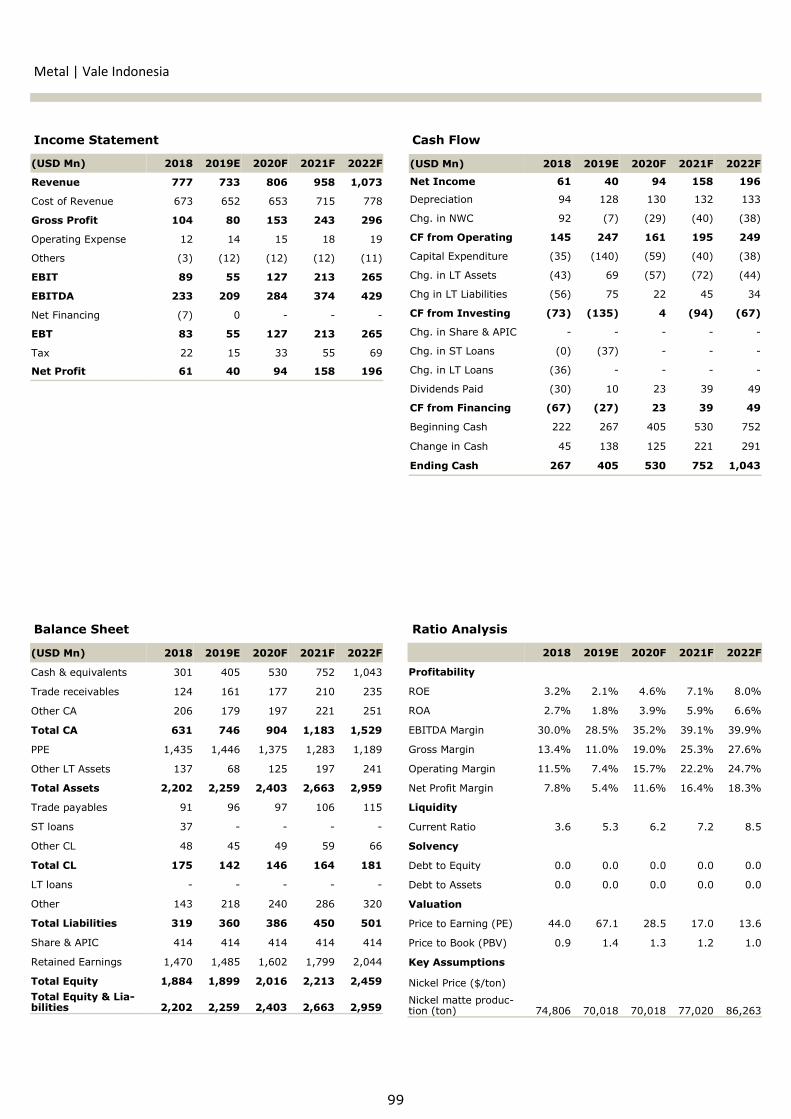
99
Income Statement Cash Flow
Balance Sheet Ratio Analysis
Metal | Vale Indonesia
(USD Mn) 2018 2019E 2020F 2021F 2022F
Cash & equivalents 301 405 530 752 1,043
Trade receivables 124 161 177 210 235
Other CA 206 179 197 221 251
Total CA 631 746 904 1,183 1,529
PPE 1,435 1,446 1,375 1,283 1,189
Other LT Assets 137 68 125 197 241
Total Assets 2,202 2,259 2,403 2,663 2,959
Trade payables 91 96 97 106 115
ST loans 37 - - - -
Other CL 48 45 49 59 66
Total CL 175 142 146 164 181
LT loans - - - - -
Other 143 218 240 286 320
Total Liabilities 319 360 386 450 501
Share & APIC 414 414 414 414 414
Retained Earnings 1,470 1,485 1,602 1,799 2,044
Total Equity 1,884 1,899 2,016 2,213 2,459
Total Equity & Lia-bilities
2,202
2,259
2,403
2,663
2,959
2018 2019E 2020F 2021F 2022F
Profitability
ROE 3.2% 2.1% 4.6% 7.1% 8.0%
ROA 2.7% 1.8% 3.9% 5.9% 6.6%
EBITDA Margin 30.0% 28.5% 35.2% 39.1% 39.9%
Gross Margin 13.4% 11.0% 19.0% 25.3% 27.6%
Operating Margin 11.5% 7.4% 15.7% 22.2% 24.7%
Net Profit Margin 7.8% 5.4% 11.6% 16.4% 18.3%
Liquidity
Current Ratio 3.6 5.3 6.2 7.2 8.5
Solvency
Debt to Equity 0.0 0.0 0.0 0.0 0.0
Debt to Assets 0.0 0.0 0.0 0.0 0.0
Valuation
Price to Earning (PE) 44.0 67.1 28.5 17.0 13.6
Price to Book (PBV) 0.9 1.4 1.3 1.2 1.0
Key Assumptions
Nickel Price ($/ton)
Nickel matte produc-tion (ton)
74,806
70,018
70,018
77,020
86,263
(USD Mn) 2018 2019E 2020F 2021F 2022F
Revenue 777 733 806 958 1,073
Cost of Revenue 673 652 653 715 778
Gross Profit 104 80 153 243 296
Operating Expense 12 14 15 18 19
Others (3) (12) (12) (12) (11)
EBIT 89 55 127 213 265
EBITDA 233 209 284 374 429
Net Financing (7) 0 - - -
EBT 83 55 127 213 265
Tax 22 15 33 55 69
Net Profit 61 40 94 158 196
(USD Mn) 2018 2019E 2020F 2021F 2022F
Net Income 61 40 94 158 196
Depreciation 94 128 130 132 133
Chg. in NWC 92 (7) (29) (40) (38)
CF from Operating 145 247 161 195 249
Capital Expenditure (35) (140) (59) (40) (38)
Chg. in LT Assets (43) 69 (57) (72) (44)
Chg in LT Liabilities (56) 75 22 45 34
CF from Investing (73) (135) 4 (94) (67)
Chg. in Share & APIC - - - - -
Chg. in ST Loans (0) (37) - - -
Chg. in LT Loans (36) - - - -
Dividends Paid (30) 10 23 39 49
CF from Financing (67) (27) 23 39 49
Beginning Cash 222 267 405 530 752
Change in Cash 45 138 125 221 291
Ending Cash 267 405 530 752 1,043

Metal Sector
PT Aneka Tambang Tbk.
ADD
We tone down our recommendation on PT Aneka Tambang
Tbk (ANTM) from BUY to ADD with 52-week target price of
IDR 970. Our TP provides 14% upside and implies 24.6x FY20F PE
and 1.2x FY20F PBV (10-years average). We slightly tone down our
rating as we adjust our earnings following Indonesia’s regulation on
ore export ban. Despite ore export ban, we believe rising nickel
price and higher ferronickel output from the Halmahera plant
expansion could fully offset earnings loss from the ban. We forecast
earnings to expand by 20% next year, supported by higher margin
from the nickel business and higher output from the bauxite
divisions. Downside risks to our call are lower than expected
commodity price (nickel, gold and bauxite) and lower than
expected production output.
Dissecting the impact of export ore ban. In the nickel
segments, ANTM sells ferronickel (20% Ni content) as well as nickel
ore. For the ore, ANTM is likely to sell around ~8 mn wmt of ore
this year, in which half of it (~4 mn wmt) are exported. This will
translate to a potential revenue loss of ~IDR 1.7 tn (4.8% of total
revenue). We forecast nickel-segments revenue to decline slightly
by 6.6% in FY20 (ore sales down by 47.9% YoY but ferronickel up
by 21.2% YoY) before rising by 19.1% in FY21, as rising nickel
price and higher output from the ferronickel expansion start to
materialize.
Expecting steady increase of ferronickel output. Construction
progress of East Halmahera ferronickel plant project has reached
98% of completion on Sep-19. The company expects production to
begin in 2020. Note that this plant has a total capacity of 13.5k
ton, which will bring a total ferronickel capacity of the company to
40.0k ton (27k ton currently). We expect a production CAGR of
11.2% in the next 4 years. This should provide a decent LT growth
for the company.
Valuation. Our target price of IDR 970 per share is derived from
DCF based valuation (11% WACC) throughout each of the mine life.
ANTM is currently trading at 21.6x FY20 forward PE and 1.0x FY20
forward PBV.
100
Stock Information
Bloomberg Ticker ANTM IJ
52-Week High 1,175
52-Week Low 660
FY20F P/E 24.6x
FY20F P/BV 1.2x
Share Outstanding (Mn) 24,030.8
Market Cap. (IDR Tn) 20.4
Share Price Performance
Current Price 850
52-Week Target Price 970
% Change 14.1%
Highlights (IDR Bn) 2018 2019E 2020F 2021F 2022F
Revenue 25,241 34,007 35,641 37,587 37,485
% growth 99.5% 34.7% 4.8% 5.5% -0.3%
Gross Profit 3,476 4,663 5,270 6,296 6,361
Net Profit 874 781 947 1,488 1,847
% growth 540.6% -10.7% 21.2% 57.2% 24.2%
Gross Margin (%) 13.8% 13.7% 14.8% 16.8% 17.0%
Net Margin (%) 3.5% 2.3% 2.7% 4.0% 4.9%
Return on Equity (%) 4.4% 4.0% 4.8% 7.4% 9.0%
Return on Assets (%) 2.6% 2.3% 2.8% 4.3% 5.4%
EPS (IDR) 36 32 39 62 77
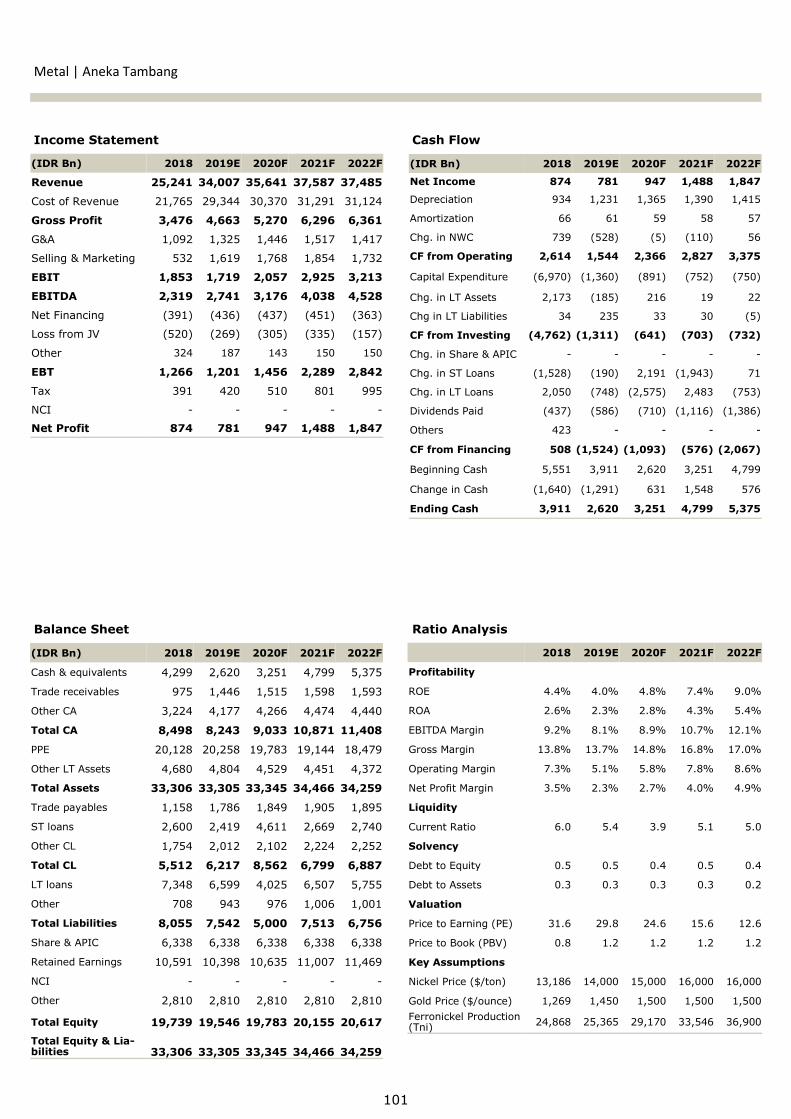
101
Income Statement Cash Flow
Balance Sheet Ratio Analysis
Metal | Aneka Tambang
(IDR Bn) 2018 2019E 2020F 2021F 2022F
Cash & equivalents 4,299 2,620 3,251 4,799 5,375
Trade receivables 975 1,446 1,515 1,598 1,593
Other CA 3,224 4,177 4,266 4,474 4,440
Total CA 8,498 8,243 9,033 10,871 11,408
PPE 20,128 20,258 19,783 19,144 18,479
Other LT Assets 4,680 4,804 4,529 4,451 4,372
Total Assets 33,306 33,305 33,345 34,466 34,259
Trade payables 1,158 1,786 1,849 1,905 1,895
ST loans 2,600 2,419 4,611 2,669 2,740
Other CL 1,754 2,012 2,102 2,224 2,252
Total CL 5,512 6,217 8,562 6,799 6,887
LT loans 7,348 6,599 4,025 6,507 5,755
Other 708 943 976 1,006 1,001
Total Liabilities 8,055 7,542 5,000 7,513 6,756
Share & APIC 6,338 6,338 6,338 6,338 6,338
Retained Earnings 10,591 10,398 10,635 11,007 11,469
NCI - - - - -
Other 2,810 2,810 2,810 2,810 2,810
Total Equity 19,739 19,546 19,783 20,155 20,617
Total Equity & Lia-bilities
33,306
33,305
33,345
34,466
34,259
2018 2019E 2020F 2021F 2022F
Profitability
ROE 4.4% 4.0% 4.8% 7.4% 9.0%
ROA 2.6% 2.3% 2.8% 4.3% 5.4%
EBITDA Margin 9.2% 8.1% 8.9% 10.7% 12.1%
Gross Margin 13.8% 13.7% 14.8% 16.8% 17.0%
Operating Margin 7.3% 5.1% 5.8% 7.8% 8.6%
Net Profit Margin 3.5% 2.3% 2.7% 4.0% 4.9%
Liquidity
Current Ratio 6.0 5.4 3.9 5.1 5.0
Solvency
Debt to Equity 0.5 0.5 0.4 0.5 0.4
Debt to Assets 0.3 0.3 0.3 0.3 0.2
Valuation
Price to Earning (PE) 31.6 29.8 24.6 15.6 12.6
Price to Book (PBV) 0.8 1.2 1.2 1.2 1.2
Key Assumptions
Nickel Price ($/ton) 13,186 14,000 15,000 16,000 16,000
Gold Price ($/ounce) 1,269 1,450 1,500 1,500 1,500
Ferronickel Production (Tni)
24,868 25,365 29,170 33,546 36,900
(IDR Bn) 2018 2019E 2020F 2021F 2022F
Revenue 25,241 34,007 35,641 37,587 37,485
Cost of Revenue 21,765 29,344 30,370 31,291 31,124
Gross Profit 3,476 4,663 5,270 6,296 6,361
G&A 1,092 1,325 1,446 1,517 1,417
Selling & Marketing 532 1,619 1,768 1,854 1,732
EBIT 1,853 1,719 2,057 2,925 3,213
EBITDA 2,319 2,741 3,176 4,038 4,528
Net Financing (391) (436) (437) (451) (363)
Loss from JV (520) (269) (305) (335) (157)
Other 324 187 143 150 150
EBT 1,266 1,201 1,456 2,289 2,842
Tax 391 420 510 801 995
NCI - - - - -
Net Profit 874 781 947 1,488 1,847
(IDR Bn) 2018 2019E 2020F 2021F 2022F
Net Income 874 781 947 1,488 1,847
Depreciation 934 1,231 1,365 1,390 1,415
Amortization 66 61 59 58 57
Chg. in NWC 739 (528) (5) (110) 56
CF from Operating 2,614 1,544 2,366 2,827 3,375
Capital Expenditure (6,970) (1,360) (891) (752) (750)
Chg. in LT Assets 2,173 (185) 216 19 22
Chg in LT Liabilities 34 235 33 30 (5)
CF from Investing (4,762) (1,311) (641) (703) (732)
Chg. in Share & APIC - - - - -
Chg. in ST Loans (1,528) (190) 2,191 (1,943) 71
Chg. in LT Loans 2,050 (748) (2,575) 2,483 (753)
Dividends Paid (437) (586) (710) (1,116) (1,386)
Others 423 - - - -
CF from Financing 508 (1,524) (1,093) (576) (2,067)
Beginning Cash 5,551 3,911 2,620 3,251 4,799
Change in Cash (1,640) (1,291) 631 1,548 576
Ending Cash 3,911 2,620 3,251 4,799 5,375

Oil and Gas Sector
Calm Waters Ahead
NEUTRAL
What do we expect in FY20? After a strong rally in
FY19, we expect oil price to stabilize at the current
level as wee see market balance to remain unchanged
this year. On the supply side, we see output growth
from US will slow down in FY20 to 0.9 mn bpd, after a
strong output growth in FY19 (1.3 mn bpd). Meanwhile,
recent OPEC decision to further cut their production by
another 500k barrels per day will help to stabilize
market balance from a lackluster demand in FY20.
Weak demand, fueled by US China trade war and fears
of global economic recessions will play a major role in
setting the oil price this year. We expect, demand
indicator to play a larger role than supply in
determining oil price in 2020. EIA estimates that
demand will rise by 1.2 mn bpd in FY20, rising slightly
from an increase of 1.0 mn bpd in FY19. We forecast oil
price to average at USD 60 per barrel in FY20,
compared to USD 57 per barrel in FY19.
Another round of cut for OPEC and allies. In
OPEC’s last meeting in Dec-19, all members including
Russia have agreed to cut production by an additional
of 500,000 bpd by the end of Mar-20 to help push up
oil price. This is equivalent to 0.5% of total global
output and it would bring the total production cut for
OPEC and its allies to 1.7 mn bpd. Potential falling
demand due to global economic slowdown and
increasing global oil supply from US and other
producers outside the cartel are the major reasons for
the deeper cut. If executed, OPEC will produce about
29.4 mn bpd in FY20, which is equivalent to 29% of
global output, down by 4% from a year ago.
FY19 in a nutshell. Oil price has moved in steadily in
2019, settling in at USD 59 per barrel as of Dec-19
(+30% YTD), as OPEC and its allies have been
supportive in maintaining market balance in response
to the rising of US shale oil output and lackluster
demand. Since OPEC’s decision to cut production at the
end of FY18, we have seen major decline in their
output. In Oct-19, OPEC production has fallen to 29.7
mn barrels per day (bpd), down from 33.0 mn bpd in
Nov-18. Saudi Arabia led the decline as output fell by
1.1 mn bpd to 9.9 mn bpd in Oct-19. Meanwhile, US
output has risen from 11.7 mn bpd in Dec-18 to 12.6
mn bpd in Oct-19, driven by rising shale output. On the
other hand, IEA estimate global oil demand recovered
slightly to 101.3 mn bpd in 3Q19 from the low levels of
99.3 mn bpd in 1H19. This figure is slightly higher than
2018’s level at 99.3 mn bpd.
102
14.718.8
10.0
10.9
14.5
14.9
0
10
20
30
40
50
60
70
80
0.0
5.0
10.0
15.0
20.0
25.0
30.0
35.0
40.0
45.0
50.0
US Saudi Arabia Russia Oil Price
Oil production (mn bpd) and price
Source: Bloomberg, IEA, OPEC, Sinarmas Investment Research
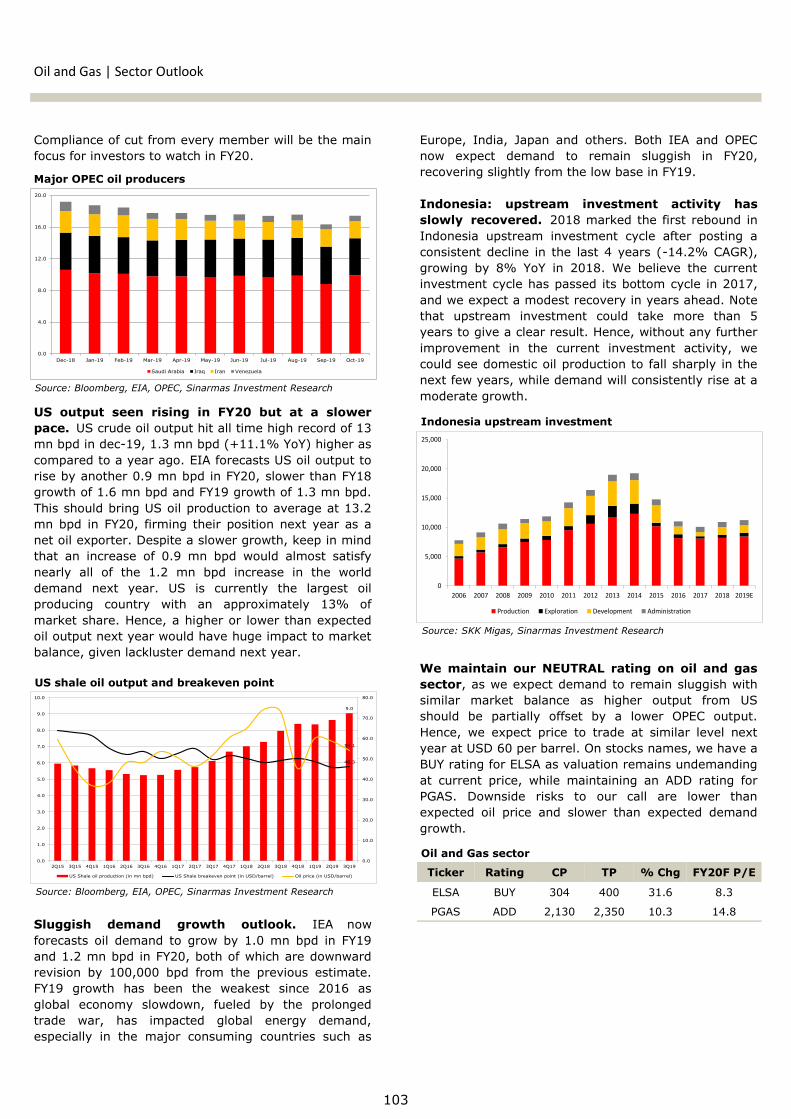
Oil and Gas | Sector Outlook
Europe, India, Japan and others. Both IEA and OPEC
now expect demand to remain sluggish in FY20,
recovering slightly from the low base in FY19.
Indonesia: upstream investment activity has
slowly recovered. 2018 marked the first rebound in
Indonesia upstream investment cycle after posting a
consistent decline in the last 4 years (-14.2% CAGR),
growing by 8% YoY in 2018. We believe the current
investment cycle has passed its bottom cycle in 2017,
and we expect a modest recovery in years ahead. Note
that upstream investment could take more than 5
years to give a clear result. Hence, without any further
improvement in the current investment activity, we
could see domestic oil production to fall sharply in the
next few years, while demand will consistently rise at a
moderate growth.
We maintain our NEUTRAL rating on oil and gas
sector, as we expect demand to remain sluggish with
similar market balance as higher output from US
should be partially offset by a lower OPEC output.
Hence, we expect price to trade at similar level next
year at USD 60 per barrel. On stocks names, we have a
BUY rating for ELSA as valuation remains undemanding
at current price, while maintaining an ADD rating for
PGAS. Downside risks to our call are lower than
expected oil price and slower than expected demand
growth.
Compliance of cut from every member will be the main
focus for investors to watch in FY20.
US output seen rising in FY20 but at a slower
pace. US crude oil output hit all time high record of 13
mn bpd in dec-19, 1.3 mn bpd (+11.1% YoY) higher as
compared to a year ago. EIA forecasts US oil output to
rise by another 0.9 mn bpd in FY20, slower than FY18
growth of 1.6 mn bpd and FY19 growth of 1.3 mn bpd.
This should bring US oil production to average at 13.2
mn bpd in FY20, firming their position next year as a
net oil exporter. Despite a slower growth, keep in mind
that an increase of 0.9 mn bpd would almost satisfy
nearly all of the 1.2 mn bpd increase in the world
demand next year. US is currently the largest oil
producing country with an approximately 13% of
market share. Hence, a higher or lower than expected
oil output next year would have huge impact to market
balance, given lackluster demand next year.
Sluggish demand growth outlook. IEA now
forecasts oil demand to grow by 1.0 mn bpd in FY19
and 1.2 mn bpd in FY20, both of which are downward
revision by 100,000 bpd from the previous estimate.
FY19 growth has been the weakest since 2016 as
global economy slowdown, fueled by the prolonged
trade war, has impacted global energy demand,
especially in the major consuming countries such as
103
Ticker Rating CP TP % Chg FY20F P/E
ELSA BUY 304 400 31.6 8.3
PGAS ADD 2,130 2,350 10.3 14.8
Oil and Gas sector
Source: Bloomberg, EIA, OPEC, Sinarmas Investment Research
Major OPEC oil producers
Source: Bloomberg, EIA, OPEC, Sinarmas Investment Research
US shale oil output and breakeven point
0
5,000
10,000
15,000
20,000
25,000
2006 2007 2008 2009 2010 2011 2012 2013 2014 2015 2016 2017 2018 2019E
Production Exploration Development Administration
Source: SKK Migas, Sinarmas Investment Research
Indonesia upstream investment
0.0
4.0
8.0
12.0
16.0
20.0
Dec-18 Jan-19 Feb-19 Mar-19 Apr-19 May-19 Jun-19 Jul-19 Aug-19 Sep-19 Oct-19
Saudi Arabia Iraq Iran Venezuela
9.0
46.3
54.1
0.0
10.0
20.0
30.0
40.0
50.0
60.0
70.0
80.0
0.0
1.0
2.0
3.0
4.0
5.0
6.0
7.0
8.0
9.0
10.0
2Q15 3Q15 4Q15 1Q16 2Q16 3Q16 4Q16 1Q17 2Q17 3Q17 4Q17 1Q18 2Q18 3Q18 4Q18 1Q19 2Q19 3Q19
US Shale oil production (in mn bpd) US Shale breakeven point (in USD/barrel) Oil price (in USD/barrel)

Oil and Gas Sector
PT Elnusa Tbk.
BUY
We maintain our BUY rating on PT Elnusa Tbk. (ELSA) with
52-week target price of 400. Our TP provides 31.6% upside and
implies 8.3x FY20F PE (-0.6SD from 5 years average). ELSA is
currently trading at an undemanding valuation (6.3x FY20 forward
PE) despite delivering a robust performance. ELSA’s share price has
declined by 10% YTD, with valuation derating to –1.5SD despite
posting 8% EPS growth in 9M19, on track to achieve our target of
18% EPS growth in FY19E due to a lower base in 4Q18. We see
attractive opportunity to buy the stock at current level. We expect
ELSA to continue delivering high single digit EPS growth in years
ahead supported by downstream business growth and recovery in
the upstream segments. Downside risks to our call are lower than
expected oil price and slow down in upstream activity investment.
Solid downstream growth. The expansion to downstream
business has borne fruit for the company. Downstream business
has been growing by 38% in the past 5 years, now contributing
80% of earnings as of 9M19 compared to 12% in FY14.
Combination of organic growth (higher fuel consumption and
increasing market share) and inorganic growth (M&A) have
supported the growth. We expect ELSA to post another 9% CAGR
earnings growth in the next five years.
Recovery on the upstream business. We believe upstream
investment activity will continue to recover in the upcoming years
which has currently passed its bottom cycle. 2018 marked the first
rebound in the upstream investment, which we expect the uptrend
to continue in the next few years. Higher upstream activity and
stable oil price should result in a better tariff and margin for ELSA.
Currently, we are only baking in a 0.2% net margin improvement
in the upstream segment with flat new contract growth. Hence,
additional upside surprise from our base scenario is a bonus.
Valuation. Our target price of IDR 400 per share is derived from
DCF based valuation (12% WACC and 1% terminal growth). ELSA
is currently trading at 6.3x FY20 forward PE, -1.5SD from 5 years
average PE. Given the solid earnings growth from the downstream
business paired with an upstream recovery, we see current share
price to be undemanding.
104
Stock Information
Bloomberg Ticker ELSA IJ
52-Week High 416
52-Week Low 270
FY20F P/E 8.3x
FY20F P/BV 0.8x
Share Outstanding (Mn) 7,298.5
Market Cap. (IDR Tn) 2.2
Share Price Performance
Current Price 304
52-Week Target Price 400
% Change 31.6%
Highlights (IDR Bn) 2018 2019E 2020F 2021F 2022F
Revenue 6,625 8,081 8,227 8,365 8,737
% growth 33.1% 22.0% 1.8% 1.7% 4.4%
Gross Profit 652 812 848 857 904
Net Profit 276 323 353 375 409
% growth 11.8% 17.0% 9.1% 6.2% 9.1%
Gross Margin (%) 9.8% 10.0% 10.3% 10.2% 10.4%
Net Margin (%) 4.2% 4.1% 4.3% 4.5% 4.7%
Return on Equity (%) 8.5% 9.3% 9.5% 9.4% 9.6%
Return on Assets (%) 4.8% 4.9% 5.2% 5.3% 5.4%
EPS (IDR) 38 44 48 51 56
-
50,000
100,000
150,000
200,000
250,000
300,000
-
50
100
150
200
250
300
350
400
450
Jan-19 Feb-19 Mar-19 Apr-19 May-19 Jun-19 Jul-19 Aug-19 Sep-19 Oct-19 Nov-19 Dec-19
Th
ou
sa
nd
s
ELSA IJ Price Volume Graph
Volume ELSA
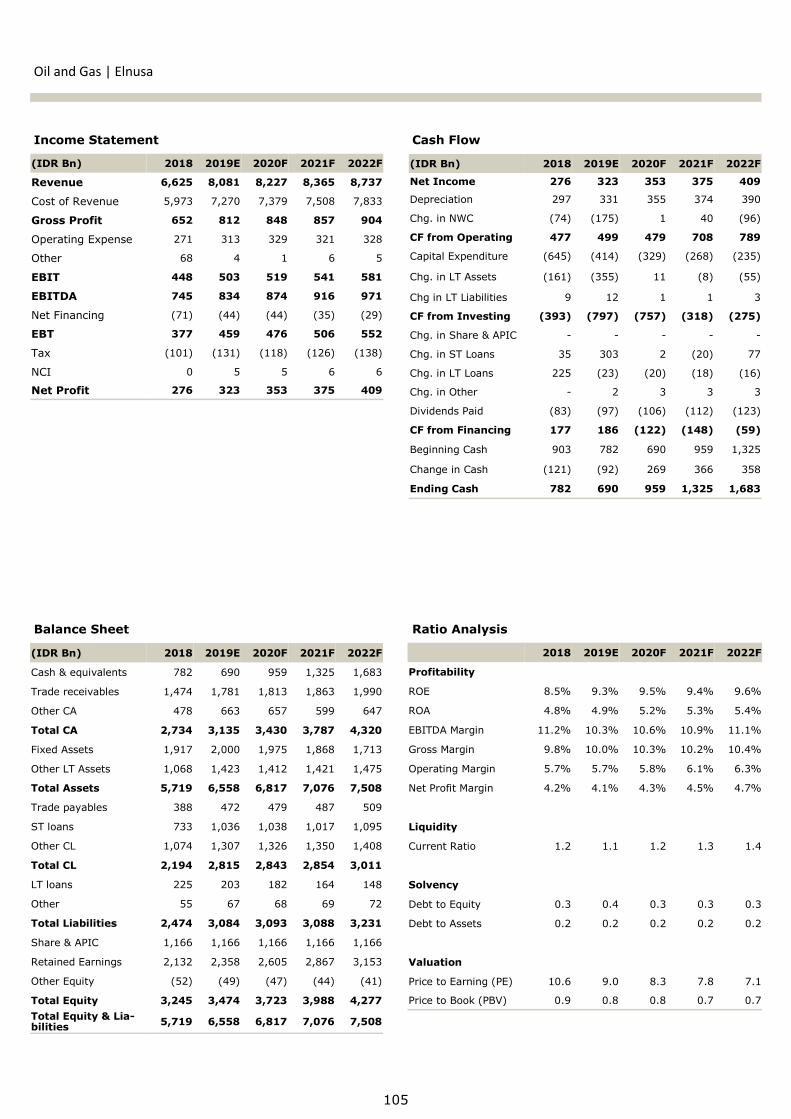
105
Income Statement Cash Flow
Balance Sheet Ratio Analysis
Oil and Gas | Elnusa
(IDR Bn) 2018 2019E 2020F 2021F 2022F
Cash & equivalents 782 690 959 1,325 1,683
Trade receivables 1,474 1,781 1,813 1,863 1,990
Other CA 478 663 657 599 647
Total CA 2,734 3,135 3,430 3,787 4,320
Fixed Assets 1,917 2,000 1,975 1,868 1,713
Other LT Assets 1,068 1,423 1,412 1,421 1,475
Total Assets 5,719 6,558 6,817 7,076 7,508
Trade payables 388 472 479 487 509
ST loans 733 1,036 1,038 1,017 1,095
Other CL 1,074 1,307 1,326 1,350 1,408
Total CL 2,194 2,815 2,843 2,854 3,011
LT loans 225 203 182 164 148
Other 55 67 68 69 72
Total Liabilities 2,474 3,084 3,093 3,088 3,231
Share & APIC 1,166 1,166 1,166 1,166 1,166
Retained Earnings 2,132 2,358 2,605 2,867 3,153
Other Equity (52) (49) (47) (44) (41)
Total Equity 3,245 3,474 3,723 3,988 4,277
Total Equity & Lia-bilities
5,719 6,558 6,817 7,076 7,508
2018 2019E 2020F 2021F 2022F
Profitability
ROE 8.5% 9.3% 9.5% 9.4% 9.6%
ROA 4.8% 4.9% 5.2% 5.3% 5.4%
EBITDA Margin 11.2% 10.3% 10.6% 10.9% 11.1%
Gross Margin 9.8% 10.0% 10.3% 10.2% 10.4%
Operating Margin 5.7% 5.7% 5.8% 6.1% 6.3%
Net Profit Margin 4.2% 4.1% 4.3% 4.5% 4.7%
Liquidity
Current Ratio 1.2 1.1 1.2 1.3 1.4
Solvency
Debt to Equity 0.3 0.4 0.3 0.3 0.3
Debt to Assets 0.2 0.2 0.2 0.2 0.2
Valuation
Price to Earning (PE) 10.6 9.0 8.3 7.8 7.1
Price to Book (PBV) 0.9 0.8 0.8 0.7 0.7
(IDR Bn) 2018 2019E 2020F 2021F 2022F
Revenue 6,625 8,081 8,227 8,365 8,737
Cost of Revenue 5,973 7,270 7,379 7,508 7,833
Gross Profit 652 812 848 857 904
Operating Expense 271 313 329 321 328
Other 68 4 1 6 5
EBIT 448 503 519 541 581
EBITDA 745 834 874 916 971
Net Financing (71) (44) (44) (35) (29)
EBT 377 459 476 506 552
Tax (101) (131) (118) (126) (138)
NCI 0 5 5 6 6
Net Profit 276 323 353 375 409
(IDR Bn) 2018 2019E 2020F 2021F 2022F
Net Income 276 323 353 375 409
Depreciation 297 331 355 374 390
Chg. in NWC (74) (175) 1 40 (96)
CF from Operating 477 499 479 708 789
Capital Expenditure (645) (414) (329) (268) (235)
Chg. in LT Assets (161) (355) 11 (8) (55)
Chg in LT Liabilities 9 12 1 1 3
CF from Investing (393) (797) (757) (318) (275)
Chg. in Share & APIC - - - - -
Chg. in ST Loans 35 303 2 (20) 77
Chg. in LT Loans 225 (23) (20) (18) (16)
Chg. in Other - 2 3 3 3
Dividends Paid (83) (97) (106) (112) (123)
CF from Financing 177 186 (122) (148) (59)
Beginning Cash 903 782 690 959 1,325
Change in Cash (121) (92) 269 366 358
Ending Cash 782 690 959 1,325 1,683

Oil and Gas Sector
PT Perusahaan Gas Negara Tbk.
ADD
Improving quarterly performance supported by higher
distribution volume. PGAS recorded 3Q19 revenue and net profit
at USD 1.0 bn (+5.2% YoY, +10% QoQ) and USD 75 mn (+15.6%
YoY, vs loss of USD 11 mn in 2Q19) respectively, supported by a
strong recovery in distribution volume. PGAS distribution jumped to
971 BBTUD in 9M19 (vs 932 BBTUD in 6M19), as demand from
power sector rose in the quarter. Strong volume trend continued to
build up through Oct-19, with the volume recorded at 978 BBTUD.
On the flip side, transmission volume remained soft (-2.2% YoY)
while upstream volume fell 27% yoy due to several expiry block.
Earnings set to recover. We expect a strong distribution volume
trend to continue in FY20, driven by the higher demand in the
power sector and manufacturing industry. In addition, the
upcoming 7/11 regulation should also protect the distribution
margin. We are baking in 990 BBTUD (+1.5% YoY) volume in
FY20F, with the distribution margin remains stable at USD 2.3 per
MMBTU. On the transmission segment, we expect a similar volume
in FY20 as compared to the previous year. Meanwhile, steady oil
price at USD 60 per barrel should lift Saka earnings in FY20, after a
weak performance in FY19. All in all, we forecast PGAS earnings to
jump by 25% YoY in FY20, booking net profit of USD 270 mn.
Government decide to drop the plan of gas price hike.
Previously, PGAS plans to raise gas price by ~7% for the industrial
segments starting in Nov-19. However, the government recently
dropped the plan as they want to maintain the competitiveness of
domestic products. By keeping the price at current levels, the
industry won’t increase its cost of production. Despite bailing the
plan, we think that the government will still find a win-win solution
with gas players, in order to continue promoting gas infrastructure
expansion. One possible course is to lower the price at the
upstream level (cost for PGAS), which the government is currently
looking at. If realized, this should provide upside surprise for PGAS.
Valuation and recommendation. We reiterate our ADD rating on
PGAS, with 52-week target price at IDR 2,350 per share (10%
upside), implying FY20F PE at 14.8x (5-years average). Downside
risks are lower than expected volume and government regulations.
106
Stock Information
Bloomberg Ticker PGAS IJ
52-Week High 2,720
52-Week Low 1,775
FY20F P/E 14.8x
FY20F P/BV 1.1x
Share Outstanding (Mn) 24,241.5
Market Cap. (IDR Tn) 51.6
Share Price Performance
Current Price 2,130
52-Week Target Price 2,350
% Change 10.3%
Highlights (USD Mn) 2018 2019E 2020F 2021F 2022F
Revenue 3,870 3,760 3,862 3,963 4,068
% growth 8.4% -2.8% 2.7% 2.6% 2.6%
Gross Profit 1,310 1,155 1,182 1,196 1,254
Net Profit 305 208 270 251 272
% growth 54.9% -31.6% 29.7% -7.1% 8.4%
Gross Margin (%) 33.8% 30.7% 30.6% 30.2% 30.8%
Net Margin (%) 7.9% 5.5% 7.0% 6.3% 6.7%
Return on Equity (%) 8.1% 6.3% 7.8% 6.8% 7.0%
Return on Assets (%) 3.8% 2.8% 3.7% 3.4% 3.6%
EPS (USD) 0.013 0.009 0.011 0.010 0.011
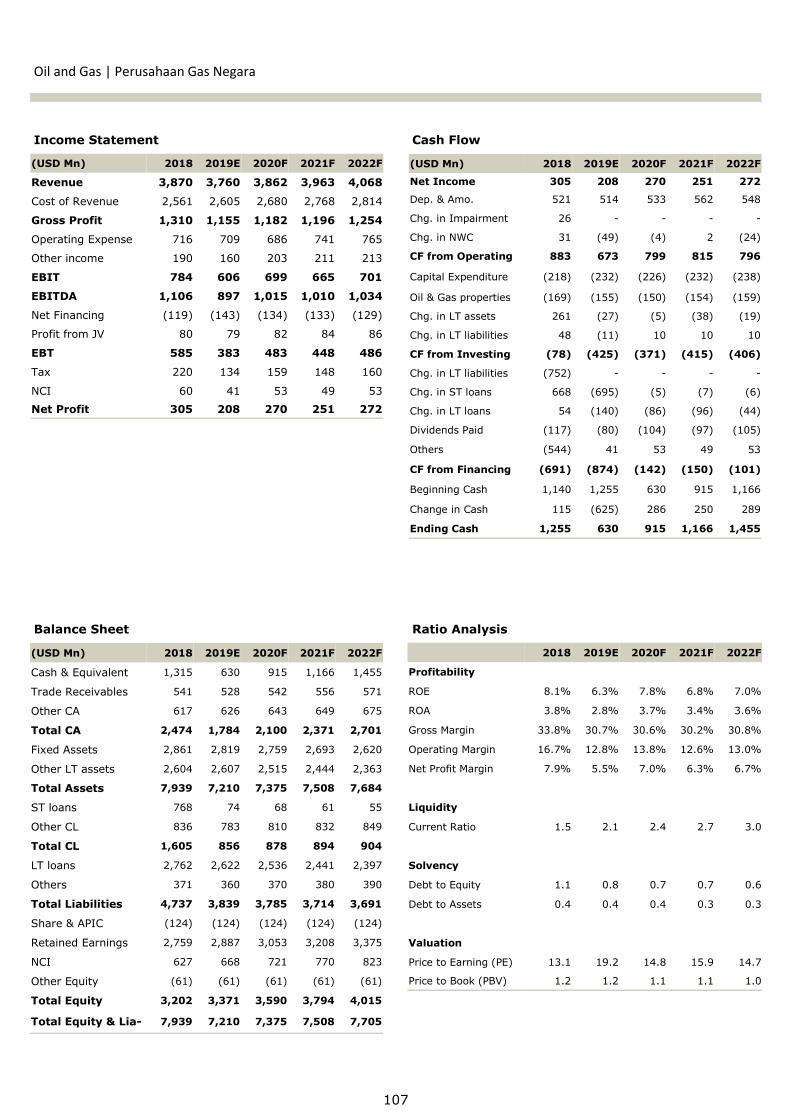
107
Income Statement Cash Flow
Balance Sheet Ratio Analysis
Oil and Gas | Perusahaan Gas Negara
(USD Mn) 2018 2019E 2020F 2021F 2022F
Cash & Equivalent 1,315 630 915 1,166 1,455
Trade Receivables 541 528 542 556 571
Other CA 617 626 643 649 675
Total CA 2,474 1,784 2,100 2,371 2,701
Fixed Assets 2,861 2,819 2,759 2,693 2,620
Other LT assets 2,604 2,607 2,515 2,444 2,363
Total Assets 7,939 7,210 7,375 7,508 7,684
ST loans 768 74 68 61 55
Other CL 836 783 810 832 849
Total CL 1,605 856 878 894 904
LT loans 2,762 2,622 2,536 2,441 2,397
Others 371 360 370 380 390
Total Liabilities 4,737 3,839 3,785 3,714 3,691
Share & APIC (124) (124) (124) (124) (124)
Retained Earnings 2,759 2,887 3,053 3,208 3,375
NCI 627 668 721 770 823
Other Equity (61) (61) (61) (61) (61)
Total Equity 3,202 3,371 3,590 3,794 4,015
Total Equity & Lia- 7,939 7,210 7,375 7,508 7,705
2018 2019E 2020F 2021F 2022F
Profitability
ROE 8.1% 6.3% 7.8% 6.8% 7.0%
ROA 3.8% 2.8% 3.7% 3.4% 3.6%
Gross Margin 33.8% 30.7% 30.6% 30.2% 30.8%
Operating Margin 16.7% 12.8% 13.8% 12.6% 13.0%
Net Profit Margin 7.9% 5.5% 7.0% 6.3% 6.7%
Liquidity
Current Ratio 1.5 2.1 2.4 2.7 3.0
Solvency
Debt to Equity 1.1 0.8 0.7 0.7 0.6
Debt to Assets 0.4 0.4 0.4 0.3 0.3
Valuation
Price to Earning (PE) 13.1 19.2 14.8 15.9 14.7
Price to Book (PBV) 1.2 1.2 1.1 1.1 1.0
(USD Mn) 2018 2019E 2020F 2021F 2022F
Revenue 3,870 3,760 3,862 3,963 4,068
Cost of Revenue 2,561 2,605 2,680 2,768 2,814
Gross Profit 1,310 1,155 1,182 1,196 1,254
Operating Expense 716 709 686 741 765
Other income 190 160 203 211 213
EBIT 784 606 699 665 701
EBITDA 1,106 897 1,015 1,010 1,034
Net Financing (119) (143) (134) (133) (129)
Profit from JV 80 79 82 84 86
EBT 585 383 483 448 486
Tax 220 134 159 148 160
NCI 60 41 53 49 53
Net Profit 305 208 270 251 272
(USD Mn) 2018 2019E 2020F 2021F 2022F
Net Income 305 208 270 251 272
Dep. & Amo. 521 514 533 562 548
Chg. in Impairment 26 - - - -
Chg. in NWC 31 (49) (4) 2 (24)
CF from Operating 883 673 799 815 796
Capital Expenditure (218) (232) (226) (232) (238)
Oil & Gas properties (169) (155) (150) (154) (159)
Chg. in LT assets 261 (27) (5) (38) (19)
Chg. in LT liabilities 48 (11) 10 10 10
CF from Investing (78) (425) (371) (415) (406)
Chg. in LT liabilities (752) - - - -
Chg. in ST loans 668 (695) (5) (7) (6)
Chg. in LT loans 54 (140) (86) (96) (44)
Dividends Paid (117) (80) (104) (97) (105)
Others (544) 41 53 49 53
CF from Financing (691) (874) (142) (150) (101)
Beginning Cash 1,140 1,255 630 915 1,166
Change in Cash 115 (625) 286 250 289
Ending Cash 1,255 630 915 1,166 1,455

Plantation Sector
The Arrival of Long-Awaited Positive Breeze
OVERWEIGHT
The beginning of structural slowdown in CPO
production. We reiterate our earlier view on potential
slowdown in CPO production that may restrain supply
onwards. In addition to MPOB data, we also gathered
several large CPO planters in Indonesia and Singapore
to learn about the latest trends. The findings indicated
that in 9M19, Singaporean CPO planters as a whole
experienced a 6.3%/3.6% drop in FFB/CPO production.
In the same period, CPO planters in Indonesia also saw
at 5%/5.7% reduction in their FFB/CPO production. The
declining production across the countries may be
attributable to limited new plantings in the previous
year. In Indonesia, we also notice more aggressive
replanting programs have been done by large CPO
planters with aging tree profile in 2019 and is still
ongoing. The aggressive replanting in may keep
Indonesia’s CPO output low in the next few years,
leading to potential supply disruption.
Cutback in fertilizer and drought may put
pressure on output in 2020. In addition to limited
new mature areas, CPO output both in Indonesia and
Malaysia are expected to see flat to minimal growth in
2020. Noting industry analyst Dorab Mistry, Malaysian
output is seen down to 19.3mn tons while Indonesian
will see 44mn tons production, rise by just 1mn tons in
2020. This will be on the back of lack of fertilizers
application in the past few years during the weak CPO
price period coupled with recent drought and haze that
may have knock-on effect on production yield. While
quoting from the latest USDA report, it is estimated
that Indonesia will produce CPO of 43mn tons (+3.6%
FY19: a bit delayed, but CPO price finally saw an
acceleration. Although later than expected, CPO price
has subsequently recovered since mid-19 that stands
still at MYR 2,850/ton at current. Several backdrops on
rising CPO price in 2019 are: 1) supportive MPOB data
on production and inventory, 2) better demand seen in
China and India, 3) mini trade deal between US-China,
and 4) brighter future industry outlook. Noise still came
from the European Union which plans to curb palm-
based biodiesel, however the issue may have been
offset by the promising Indonesia biodiesel
implementation. Quoting from Malaysia Palm Oil Board
(MPOB), CPO stockpiles dropped constantly to 2.3mn
tons for Nov-19 (-25% from end of FY18) close to its 5-
year average, on muted production (+4.6% YoY YTD
Jan-Nov’19) and solid uplift in exports (+13.3% YoY
YTD Jan-Nov’19) stemming from India and China.
108
Source: MPOB, Bloomberg, Sinarmas Investment Research
Inventory almost fall to its 5-year average level
-
500
1,000
1,500
2,000
2,500
3,000
3,500
Jun-18 Aug-18 Oct-18 Dec-18 Feb-19 Apr-19 Jun-19 Aug-19 Oct-19
MPOB Production MPOB Export MPOB Inventory 5Y Avg Inventory

Plantation | Sector Outlook
(+16.3% from FY19E average CPO price) which we
believe is enough to lift CPO planters’ earnings next
year.
Expecting recovery in CPO planters’ earnings in
2020. We forecast the CPO planters under our
coverage (AALI, LSIP, and SIMP) to continue booking
FFB and CPO decline in 2020 despite at a moderate
pace compared to 2019’s. However, net profit along
with margins will surge stemming from higher CPO
price assumption. We forecast AALI and LSIP’s net
profit to surge by 417.8%/256.4% while SIMP’s will
turn positive in 2020.
We reiterate our stance to OVERWEIGHT for
plantation sector on brighter industry outlook and
higher CPO price. Our bullish stance on the sector as
CPO price will remain strong for the aforementioned
positive catalysts in the industry. This should then
translate into significant recovery for CPO planters’
performance which has been sluggish throughout 2019.
For this sector we recommend BUY for LSIP and SIMP,
while NEUTRAL for AALI. We prefer LSIP the most for
its being pure upstream CPO player which will be a
direct beneficiary of higher CPO price in 2020.
YoY) and Malaysia at 21mn tons (+0.9% YoY) for
2019/2020 marketing year.
Biodiesel mandate in Southeast Asia to assure
CPO demand. In addition to food demand, biodiesel
mandate remains the key to drive incremental CPO
demand. Indonesia has successfully implemented B20
program which exceeds 5.9mn kiloliters in 2019 and
will start B30 program effectively in January 2020 with
target of 9.6mn kiloliters. The implementation on B30
itself is estimated to lift up Indonesia’s incremental
CPO domestic consumption at least of 3mn tons. Align
with Indonesia, Malaysia is also committing to move
toward 20% biodiesel blend totaling 1.5mn kiloliters.
We believe the smooth execution of the biodiesel
program across countries will limit global supply, lead
to lower inventory and eventually being supportive to
CPO price onwards.
US-China trade deal and correlation to CPO price.
The development of US-China trade war has recently
become a key to CPO price movement, for its
correlation with soybeans. Post the rally of CPO price
recently, we observe that the gap between CPO and
soybean oil has been narrowed significantly which may
raise a concern whether CPO price will be sustainable
or not at current price. However, the positive results
from the phase one trade deal that require China’s
committing to import US$ 32bn more in farm products
over the next two years should resume their purchase
for US soybeans. Consequently, soybean price should
recover back resulting in normalized spread between
CPO and soybean oil.
Favorable CPO price in 2020. CPO price has rallied
significantly since mid-year and currently stands strong
at MYR 2.850/ton (+36.6% from end of 2018). We do
not expect CPO price to sustain at current high level
however will remain favorable due to lower output and
inventory level coupled with strong demand from the
biodiesel mandate in 2020. As a result, we are now
seeing CPO price to average at MYR 2,500/ton in 2020
109
Ticker Rating CP TP % Chg FY20F EV/ha
AALI NEUTRAL 13,425 14,600 8.8 8,600
LSIP BUY 1,420 1,720 21.1 5,800
SIMP BUY 390 450 15.4 3,870
Plantation sector
Source: Bloomberg, Sinarmas Investment Research
Narrowing spread between soyoil and CPO
Source: Bloomberg, Sinarmas Investment Research
CPO stocks move closely with CPO prices
-
50.0
100.0
150.0
200.0
250.0
Dec-17 Feb-18 Apr-18 Jun-18 Aug-18 Oct-18 Dec-18 Feb-19 Apr-19 Jun-19 Aug-19 Oct-19
Soy Oil Premium to Palm Oil Average
-40.0%
-30.0%
-20.0%
-10.0%
0.0%
10.0%
20.0%
30.0%
40.0%
50.0%
Dec-18 Jan-19 Feb-19 Mar-19 Apr-19 May-19 Jun-19 Jul-19 Aug-19 Sep-19 Oct-19 Nov-19
CPO Price LSIP AALI SIMP

Plantation Sector
PT Astra Agro Lestari Tbk.
NEUTRAL
We lower our BUY call to NEUTRAL for PT Astra Agro Lestari
Tbk (AALI) with 52-week target price of IDR 14,600. Our TP
represents 8.8% potential upside, derived from 8,600 EV/ha. The
encouraging outlook of the industry should promote better earnings
for AALI next year. However, as portion of downstream and trading
business contribute more to AALI, margins may find difficulty to
recover above 20% (FY16-18 average GPM). Therefore, despite re-
rating may still in sight if CPO price remains strong, yet should be
limited from current price. We prefer pure upstream as well as
cheap name such as LSIP and SIMP. Downside risks to our call are
unsustainable CPO price and higher portion of downstream and
trading that may result in squeezing margins.
Maintain our optimism on the industry outlook. Moving
forward to 2020, the industry outlook should remain rosy supported
by declining CPO output both in Indonesia and Malaysia, coupled
with promising demand stemming from biodiesel program in both
countries. Although CPO price is unlikely to sustain at current solid
level of MYR 2,850/ton, yet an average of MYR 2,500/ton (+16.3%
from FY19E) is sufficient to lift up CPO planter’s earnings in 2020.
Uplift in earnings on higher CPO price. As of 10M19, AALI
recorded significant drop in FFB and CPO production of 12.2% and
13.3% respectively, which may be on lower nucleus mature area of
8,900ha. Although CPO sales were still up by 16.8% as of 9M19
(~36% came from CPO trading). We believe AALI should still see
decline in its operational metrics, hence forecasting -3%/-2.3% for
FFB and CPO, while ASP rise to IDR 7,575 (+16.3% from FY19E) on
recent rally in CPO price. As a result, top and bottom-line grow by
10.9%/417.8% with GPM/NPM translated to 17.9%/6.7%.
Aggresive replanting is ongoing. AALI finally seen being more
aggresive in replanting, in which 6,263ha was replanted as of
10M19, up by 76.2% YoY. AALI’s nucleus immature area also
increased to 9.8% of nucleus mature (vs 8.7% in 10M18). The
replanting should be persist noting AALI’s trees have reached 15.3
average age. Production may keep decline and working capital
increase as the result of replanting, though may be good to secure
future growht
110
Stock Information
Bloomberg Ticker AALI IJ
52-Week High 14,400
52-Week Low 9,500
FY20F P/E 22.1x
FY20F P/BV 1.4x
Share Outstanding (Mn) 1,924.7
Market Cap. (IDR Tn) 25.8
Share Price Performance
Current Price 13,425
52-Week Target Price 14,600
% Change 8.8%
Highlights (IDR Bn) 2018 2019E 2020F 2021F 2022F
Revenue 19,084 17,151 19,016 19,604 19,634
% growth 10.3% -10.1% 10.9% 3.1% 0.2%
Gross Profit 3,540 1,908 3,407 3,565 3,513
Net Profit 1,439 246 1,272 1,355 1,315
% growth -26.9% -82.9% 417.8% 6.6% -3.0%
Gross Margin (%) 18.5% 11.1% 17.9% 18.2% 17.9%
Net Margin (%) 7.5% 1.4% 6.7% 6.9% 6.7%
Return on Equity (%) 7.5% 1.3% 6.4% 6.5% 6.0%
Return on Assets (%) 5.5% 0.9% 4.5% 4.7% 4.4%
EPS (IDR) 747 128 661 704 683
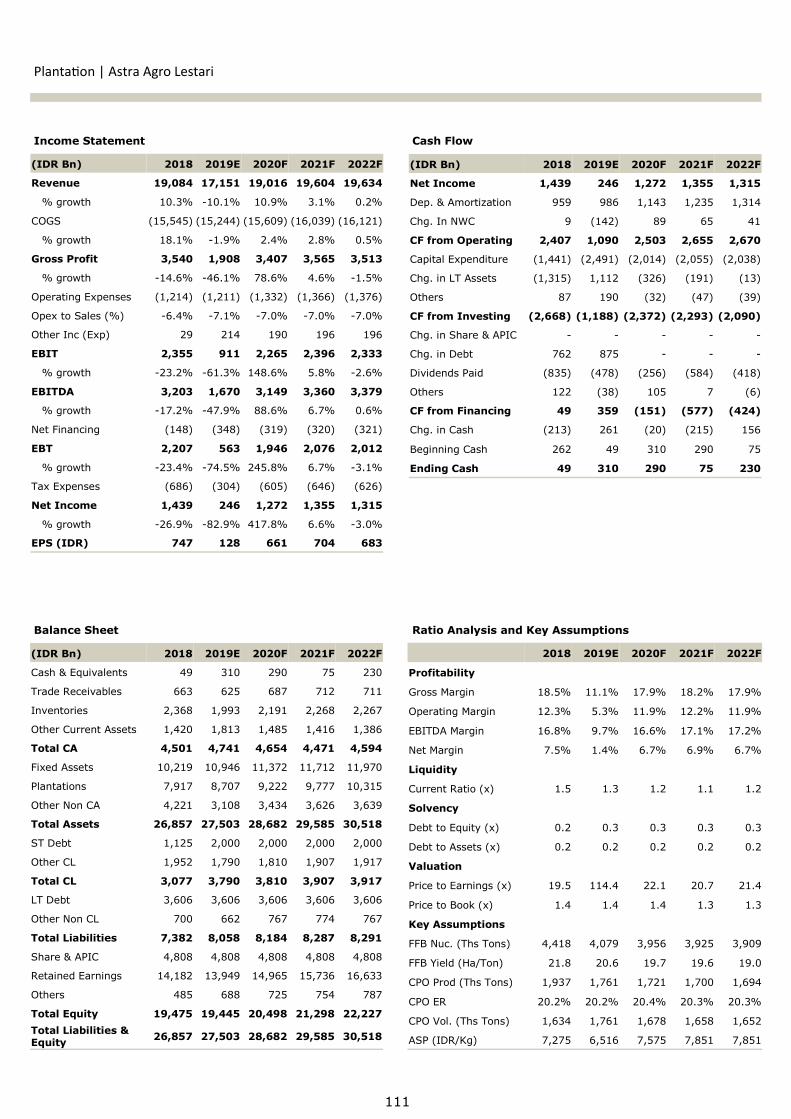
111
Income Statement Cash Flow
Balance Sheet Ratio Analysis and Key Assumptions
Plantation | Astra Agro Lestari
(IDR Bn) 2018 2019E 2020F 2021F 2022F
Cash & Equivalents 49 310 290 75 230
Trade Receivables 663 625 687 712 711
Inventories 2,368 1,993 2,191 2,268 2,267
Other Current Assets 1,420 1,813 1,485 1,416 1,386
Total CA 4,501 4,741 4,654 4,471 4,594
Fixed Assets 10,219 10,946 11,372 11,712 11,970
Plantations 7,917 8,707 9,222 9,777 10,315
Other Non CA 4,221 3,108 3,434 3,626 3,639
Total Assets 26,857 27,503 28,682 29,585 30,518
ST Debt 1,125 2,000 2,000 2,000 2,000
Other CL 1,952 1,790 1,810 1,907 1,917
Total CL 3,077 3,790 3,810 3,907 3,917
LT Debt 3,606 3,606 3,606 3,606 3,606
Other Non CL 700 662 767 774 767
Total Liabilities 7,382 8,058 8,184 8,287 8,291
Share & APIC 4,808 4,808 4,808 4,808 4,808
Retained Earnings 14,182 13,949 14,965 15,736 16,633
Others 485 688 725 754 787
Total Equity 19,475 19,445 20,498 21,298 22,227
Total Liabilities & Equity
26,857 27,503 28,682 29,585 30,518
2018 2019E 2020F 2021F 2022F
Profitability
Gross Margin 18.5% 11.1% 17.9% 18.2% 17.9%
Operating Margin 12.3% 5.3% 11.9% 12.2% 11.9%
EBITDA Margin 16.8% 9.7% 16.6% 17.1% 17.2%
Net Margin 7.5% 1.4% 6.7% 6.9% 6.7%
Liquidity
Current Ratio (x) 1.5 1.3 1.2 1.1 1.2
Solvency
Debt to Equity (x) 0.2 0.3 0.3 0.3 0.3
Debt to Assets (x) 0.2 0.2 0.2 0.2 0.2
Valuation
Price to Earnings (x) 19.5 114.4 22.1 20.7 21.4
Price to Book (x) 1.4 1.4 1.4 1.3 1.3
Key Assumptions
FFB Nuc. (Ths Tons) 4,418 4,079 3,956 3,925 3,909
FFB Yield (Ha/Ton) 21.8 20.6 19.7 19.6 19.0
CPO Prod (Ths Tons) 1,937 1,761 1,721 1,700 1,694
CPO ER 20.2% 20.2% 20.4% 20.3% 20.3%
CPO Vol. (Ths Tons) 1,634 1,761 1,678 1,658 1,652
ASP (IDR/Kg) 7,275 6,516 7,575 7,851 7,851
(IDR Bn) 2018 2019E 2020F 2021F 2022F
Revenue 19,084 17,151 19,016 19,604 19,634
% growth 10.3% -10.1% 10.9% 3.1% 0.2%
COGS (15,545) (15,244) (15,609) (16,039) (16,121)
% growth 18.1% -1.9% 2.4% 2.8% 0.5%
Gross Profit 3,540 1,908 3,407 3,565 3,513
% growth -14.6% -46.1% 78.6% 4.6% -1.5%
Operating Expenses (1,214) (1,211) (1,332) (1,366) (1,376)
Opex to Sales (%) -6.4% -7.1% -7.0% -7.0% -7.0%
Other Inc (Exp) 29 214 190 196 196
EBIT 2,355 911 2,265 2,396 2,333
% growth -23.2% -61.3% 148.6% 5.8% -2.6%
EBITDA 3,203 1,670 3,149 3,360 3,379
% growth -17.2% -47.9% 88.6% 6.7% 0.6%
Net Financing (148) (348) (319) (320) (321)
EBT 2,207 563 1,946 2,076 2,012
% growth -23.4% -74.5% 245.8% 6.7% -3.1%
Tax Expenses (686) (304) (605) (646) (626)
Net Income 1,439 246 1,272 1,355 1,315
% growth -26.9% -82.9% 417.8% 6.6% -3.0%
EPS (IDR) 747 128 661 704 683
(IDR Bn) 2018 2019E 2020F 2021F 2022F
Net Income 1,439 246 1,272 1,355 1,315
Dep. & Amortization 959 986 1,143 1,235 1,314
Chg. In NWC 9 (142) 89 65 41
CF from Operating 2,407 1,090 2,503 2,655 2,670
Capital Expenditure (1,441) (2,491) (2,014) (2,055) (2,038)
Chg. in LT Assets (1,315) 1,112 (326) (191) (13)
Others 87 190 (32) (47) (39)
CF from Investing (2,668) (1,188) (2,372) (2,293) (2,090)
Chg. in Share & APIC - - - - -
Chg. in Debt 762 875 - - -
Dividends Paid (835) (478) (256) (584) (418)
Others 122 (38) 105 7 (6)
CF from Financing 49 359 (151) (577) (424)
Chg. in Cash (213) 261 (20) (215) 156
Beginning Cash 262 49 310 290 75
Ending Cash 49 310 290 75 230

Plantation Sector
PT PP London Sumatra Indonesia Tbk.
BUY
We maintain our BUY call on PT London Sumatra Indonesia
Tbk (LSIP) with 52-week target price of IDR 1,720. Our TP
represents 21.1% potential upside, pegged to 5,800 EV/ha. The
optimism on CPO price outlook should bolster LSIP earnings in
2020. We remain our preference on LSIP among CPO planters on
its pure upstream status, which is directly impacted by the rebound
in CPO price. Downside risks to our call are fall in CPO price and
disruption form its non-CPO business.
Maintain our optimism on the industry outlook. As mentioned
before, we reiterate our optimism on palm oil sector on the back of
lower CPO output both in Indonesia and Malaysia and higher
demand on biodiesel program in both countries. Although CPO price
is unlikely to sustain at current solid level of MYR 2,850/ton, yet an
average of MYR 2,500/ton (+16.3% from FY19E) is sufficient to lift
up CPO planter’s earnings in 2020.
Accelerating earnings in 2020. In 9M19, LSIP posted FFB/CPO
production decline by 3.4%/11.3% YoY on lower nucleus mature
area of 1,529 from last year’s and significant drop in external FFB.
The aging tree profile along with replanting program should keep
LSIP’s FFB/CPO production declining, therefore we foresee -2%
drop in FFB/CPO in 2020. To add, we assume LSIP’s CPO ASP at
IDR 7,733 (+13.8% from FY19E), which then brings LSIP’s top and
bottom-line grow by 10.2%/256.4%, translated into 20.7%/10.2%
FY20F GPM/NPM. Following the recent rally of CPO price since end
of 3Q19, we expect recovery in LSIP’s earnings will be seen starting
4Q19 and afterwards.
Balance sheet in good shape, no financial issue on
replanting investment. With average tree age of 16.6years as of
9M19, LSIP currently and onwards should undertake replanting
more aggresively to secure future growth. The issue with replanting
may come from high working capital needs and cash flow
disruption. However, considering LSIP’s zero debt and ample cash
position of IDR 1.4tn in 9M19, LSIP is likely able to secure its
working capital in the near and medium term.
112
Stock Information
Bloomberg Ticker LSIP IJ
52-Week High 1,520
52-Week Low 1,000
FY20F P/E 27.6x
FY20F P/BV 1.3x
Share Outstanding (Mn) 6,822.9
Market Cap. (IDR Tn) 9.7
Share Price Performance
Current Price 1,420
52-Week Target Price 1,720
% Change 21.1%
Highlights (IDR Bn) 2018 2019E 2020F 2021F 2022F
Revenue 4,020 3,790 4,176 4,252 4,248
% growth -15.2% -5.7% 10.2% 1.8% -0.1%
Gross Profit 683 457 865 874 822
Net Profit 331 119 426 421 366
% growth -54.8% -64.0% 256.4% -1.0% -13.3%
Gross Margin (%) 17.0% 12.0% 20.7% 20.6% 19.3%
Net Margin (%) 8.2% 3.2% 10.2% 9.9% 8.6%
Return on Equity (%) 4.0% 1.4% 5.0% 4.8% 4.0%
Return on Assets (%) 3.3% 1.2% 4.2% 4.0% 3.4%
EPS (IDR) 49 18 62 62 54

113
Plantation | PP London Sumatra Indonesia
Income Statement Cash Flow
Balance Sheet Ratio Analysis and Key Assumptions
(IDR Bn) 2018 2019E 2020F 2021F 2022F
Cash & Equivalents 1,663 1,714 1,946 2,054 2,031
Trade Receivables 152 123 157 155 162
Inventories 489 354 371 352 331
Other Current Assets 140 108 106 104 106
Total CA 2,444 2,299 2,580 2,665 2,630
Fixed Assets 3,141 3,063 3,020 3,009 3,000
Plantations 3,094 3,140 3,354 3,582 3,817
Other Non CA 1,359 1,357 1,360 1,385 1,383
Total Assets 10,037 9,859 10,314 10,641 10,831
Trade Payables 312 258 240 255 257
Other CL 213 250 236 249 261
Total CL 525 508 475 504 518
Debt - - - - -
Other Non CL 1,180 1,031 1,142 1,189 1,169
Total Liabilities 1,705 1,540 1,617 1,693 1,687
Share & APIC 1,713 1,713 1,713 1,713 1,713
Retained Earnings 6,607 6,593 6,971 7,222 7,418
Others 13 13 13 13 13
Total Equity 8,332 8,319 8,697 8,947 9,144
Total Liabilities & Equity
10,037 9,859 10,314 10,641 10,831
2018 2019E 2020F 2021F 2022F
Profitability
Gross Margin 17.0% 12.0% 20.7% 20.6% 19.3%
Operating Margin 8.5% 2.7% 11.4% 10.9% 9.2%
EBITDA Margin 18.4% 13.2% 21.4% 20.2% 18.4%
Net Margin 8.2% 3.2% 10.2% 9.9% 8.6%
Liquidity
Current Ratio (x) 4.7 4.5 5.4 5.3 5.1
Solvency
Debt to Equity (x) 0.0 0.0 0.0 0.0 0.0
Debt to Assets (x) 0.0 0.0 0.0 0.0 0.0
Valuation
Price to Earnings (x) 35.4 98.2 27.6 27.8 32.1
Price to Book (x) 1.4 1.4 1.3 1.3 1.3
Key assumptions
FFB Nuc. (Ths Tons) 1,516 1,459 1,431 1,417 1,423
FFB Yield (Ha/Ton) 17.4 17.0 16.8 16.7 16.9
CPO Prod. (Ths Tons) 453 402 394 390 392
CPO ER 23.0% 23.0% 23.0% 23.0% 23.0%
CPO Sales (Ths Tons) 436 434 421 410 411
ASP (IDR/Kg) 6,964 6,795 7,733 8,016 8,016
(IDR Bn) 2018 2019E 2020F 2021F 2022F
Revenue 4,020 3,790 4,176 4,252 4,248
% growth -15.2% -5.7% 10.2% 1.8% -0.1%
COGS (3,337) (3,333) (3,310) (3,377) (3,426)
% growth -3.1% -0.1% -0.7% 2.0% 1.4%
Gross Profit 683 457 865 874 822
% growth -47.2% -33.2% 89.5% 1.0% -6.0%
Operating Expenses (373) (393) (429) (451) (472)
Opex to Sales (%) -9.3% -10.4% -10.3% -10.6% -11.1%
Other Inc (Exp) 30 37 41 41 41
EBIT 340 101 477 465 390
% growth -62.4% -70.3% 373.2% -2.5% -16.0%
EBITDA 738 501 893 860 780
% growth -43.6% -32.1% 78.3% -3.7% -9.4%
Net Financing 77 67 73 80 81
EBT 417 168 549 544 472
% growth -56.7% -59.8% 227.4% -1.0% -13.3%
Tax Expenses (88) (50) (126) (125) (108)
Net Income 329 117 424 420 364
% growth -55.1% -64.3% 260.6% -1.0% -13.3%
EPS (IDR) 49 18 62 62 54
(IDR Bn) 2018 2019E 2020F 2021F 2022F
Net Income 331 119 426 421 366
Dep. & Amortization 397 400 416 396 389
Chg. In NWC (7) 179 (82) 52 26
CF from Operating 721 699 760 869 780
Capital Expenditure (334) (368) (588) (612) (616)
Chg. in LT Assets (104) 2 (3) (25) 1
Others (26) (149) 110 48 (21)
CF from Investing (464) (515) (481) (590) (635)
Chg. in Share & APIC - - - - -
Chg. in Debt - - - - -
Dividends Paid (294) (133) (48) (171) (169)
Others 67 - - - -
CF from Financing (228) (133) (48) (171) (169)
Chg. in Cash 30 51 232 108 (24)
Beginning Cash 1,633 1,663 1,714 1,946 2,054
Ending Cash 1,663 1,714 1,946 2,054 2,031

Plantation Sector
PT Salim Ivomas Pratama Tbk.
BUY
We initiate coverage on PT Salim Ivomas Pratama Tbk
(SIMP) with 52-week target price of IDR 450. Our TP
represents 15.4% potential upside, derived from 3,870 EV/ha.
Following the recent CPO price rally and our FY20F CPO price
assumption of MYR 2,500/ton (+16.3% from FY19E), SIMP’s
earnings should turn positive in 2020. Our call is mainly of SIMP’s
attractive valuation. Downside risks to our call are unsustainable
CPO price, slower growth in EOF, and increases in leverage or
finance cost that may directly squeeze SIMP’s earnings.
An integrated CPO player. SIMP is CPO player that operates both
in upstream and downstream businessses with contribution to sales
portion of 23%:77% as of 9M19. For the plantation segment, total
planted area amounting to 298,416ha in which 83.3% palm oil,
5.6% rubber, 4.4% sugar and the rest for others (industrial timber,
cocoa, tea). Meanwhile edible oil and fats (EOF) consists of cooking
oil (Bimoli and Delima), margarine, and etc.
Growing demand in EOF division. The positive of SIMP we think
is the stable demand growth for EOF products. On management’s
note, despite the sluggish upstream, EOF sales volume was
estimated still up by low teens. In addition, pricing in EOF is less
volatile athough remain adjustable (despite the lagging times).
While the negatives come from the thin margin whereas normal
EBITDA margin for EOF is only between 3%-5%. Furthermore,
intense competition lingers on the division.
Thin margin and leverage lead to earnings volatility. Unlike
its subsidiary LSIP, SIMP records leverage in its book with debt to
equity (DER) of 0.6x. Despite DER is reasonable, however coupled
with SIMP’s thin margin, earnings volatility risk is real. With our
CPO price assumption, we forecast SIMP to book top-line growth of
7.1%, while net profit turns positiva at IDR 328bn. GPM/NPM will
be seen at 18.9%/2.2% in FY20F.
Cheapest among the peers. On our estimates, SIMP trades at
~3,200 EV/ha, which is one of the lowest in the sector. It also
trades at 0.34x forward PBV, which make SIMP more attractive.
114
thi
Stock Information
Bloomberg Ticker SIMP IJ
52-Week High 540
52-Week Low 308
FY20F P/E 21.7x
FY20F P/BV 0.4x
Share Outstanding (Mn) 15,816.3
Market Cap. (IDR Tn) 6.2
Share Price Performance
Current Price 390
52-Week Target Price 450
% Change 15.4%
Highlights (IDR Bn) 2018 2019E 2020F 2021F 2022F
Revenue 14,190 13,907 14,896 15,344 15,541
% growth -10.3% -2.0% 7.1% 3.0% 1.3%
Gross Profit 2,458 1,976 2,810 2,826 2,843
Net Profit (77) (417) 328 319 327
% growth N/A N/A N/A -2.8% 2.7%
Gross Margin (%) 17.3% 14.2% 18.9% 18.4% 18.3%
Net Margin (%) -0.5% -3.0% 2.2% 2.1% 2.1%
Return on Equity (%) -0.4% -2.3% 1.8% 1.7% 1.8%
Return on Assets (%) -0.2% -1.2% 1.0% 0.9% 0.9%
EPS (IDR) (5) (26) 21 20 21
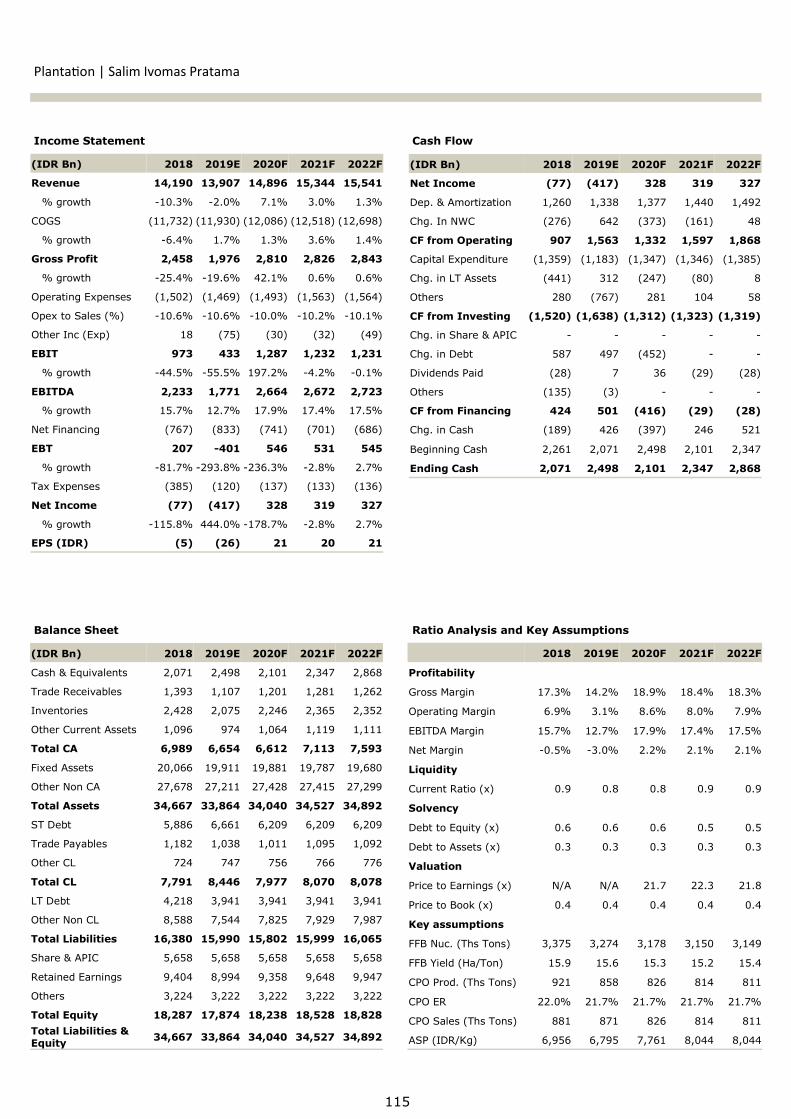
115
Plantation | Salim Ivomas Pratama
Income Statement Cash Flow
Balance Sheet Ratio Analysis and Key Assumptions
(IDR Bn) 2018 2019E 2020F 2021F 2022F
Cash & Equivalents 2,071 2,498 2,101 2,347 2,868
Trade Receivables 1,393 1,107 1,201 1,281 1,262
Inventories 2,428 2,075 2,246 2,365 2,352
Other Current Assets 1,096 974 1,064 1,119 1,111
Total CA 6,989 6,654 6,612 7,113 7,593
Fixed Assets 20,066 19,911 19,881 19,787 19,680
Other Non CA 27,678 27,211 27,428 27,415 27,299
Total Assets 34,667 33,864 34,040 34,527 34,892
ST Debt 5,886 6,661 6,209 6,209 6,209
Trade Payables 1,182 1,038 1,011 1,095 1,092
Other CL 724 747 756 766 776
Total CL 7,791 8,446 7,977 8,070 8,078
LT Debt 4,218 3,941 3,941 3,941 3,941
Other Non CL 8,588 7,544 7,825 7,929 7,987
Total Liabilities 16,380 15,990 15,802 15,999 16,065
Share & APIC 5,658 5,658 5,658 5,658 5,658
Retained Earnings 9,404 8,994 9,358 9,648 9,947
Others 3,224 3,222 3,222 3,222 3,222
Total Equity 18,287 17,874 18,238 18,528 18,828
Total Liabilities & Equity
34,667 33,864 34,040 34,527 34,892
2018 2019E 2020F 2021F 2022F
Profitability
Gross Margin 17.3% 14.2% 18.9% 18.4% 18.3%
Operating Margin 6.9% 3.1% 8.6% 8.0% 7.9%
EBITDA Margin 15.7% 12.7% 17.9% 17.4% 17.5%
Net Margin -0.5% -3.0% 2.2% 2.1% 2.1%
Liquidity
Current Ratio (x) 0.9 0.8 0.8 0.9 0.9
Solvency
Debt to Equity (x) 0.6 0.6 0.6 0.5 0.5
Debt to Assets (x) 0.3 0.3 0.3 0.3 0.3
Valuation
Price to Earnings (x) N/A N/A 21.7 22.3 21.8
Price to Book (x) 0.4 0.4 0.4 0.4 0.4
Key assumptions
FFB Nuc. (Ths Tons) 3,375 3,274 3,178 3,150 3,149
FFB Yield (Ha/Ton) 15.9 15.6 15.3 15.2 15.4
CPO Prod. (Ths Tons) 921 858 826 814 811
CPO ER 22.0% 21.7% 21.7% 21.7% 21.7%
CPO Sales (Ths Tons) 881 871 826 814 811
ASP (IDR/Kg) 6,956 6,795 7,761 8,044 8,044
(IDR Bn) 2018 2019E 2020F 2021F 2022F
Revenue 14,190 13,907 14,896 15,344 15,541
% growth -10.3% -2.0% 7.1% 3.0% 1.3%
COGS (11,732) (11,930) (12,086) (12,518) (12,698)
% growth -6.4% 1.7% 1.3% 3.6% 1.4%
Gross Profit 2,458 1,976 2,810 2,826 2,843
% growth -25.4% -19.6% 42.1% 0.6% 0.6%
Operating Expenses (1,502) (1,469) (1,493) (1,563) (1,564)
Opex to Sales (%) -10.6% -10.6% -10.0% -10.2% -10.1%
Other Inc (Exp) 18 (75) (30) (32) (49)
EBIT 973 433 1,287 1,232 1,231
% growth -44.5% -55.5% 197.2% -4.2% -0.1%
EBITDA 2,233 1,771 2,664 2,672 2,723
% growth 15.7% 12.7% 17.9% 17.4% 17.5%
Net Financing (767) (833) (741) (701) (686)
EBT 207 -401 546 531 545
% growth -81.7% -293.8% -236.3% -2.8% 2.7%
Tax Expenses (385) (120) (137) (133) (136)
Net Income (77) (417) 328 319 327
% growth -115.8% 444.0% -178.7% -2.8% 2.7%
EPS (IDR) (5) (26) 21 20 21
(IDR Bn) 2018 2019E 2020F 2021F 2022F
Net Income (77) (417) 328 319 327
Dep. & Amortization 1,260 1,338 1,377 1,440 1,492
Chg. In NWC (276) 642 (373) (161) 48
CF from Operating 907 1,563 1,332 1,597 1,868
Capital Expenditure (1,359) (1,183) (1,347) (1,346) (1,385)
Chg. in LT Assets (441) 312 (247) (80) 8
Others 280 (767) 281 104 58
CF from Investing (1,520) (1,638) (1,312) (1,323) (1,319)
Chg. in Share & APIC - - - - -
Chg. in Debt 587 497 (452) - -
Dividends Paid (28) 7 36 (29) (28)
Others (135) (3) - - -
CF from Financing 424 501 (416) (29) (28)
Chg. in Cash (189) 426 (397) 246 521
Beginning Cash 2,261 2,071 2,498 2,101 2,347
Ending Cash 2,071 2,498 2,101 2,347 2,868
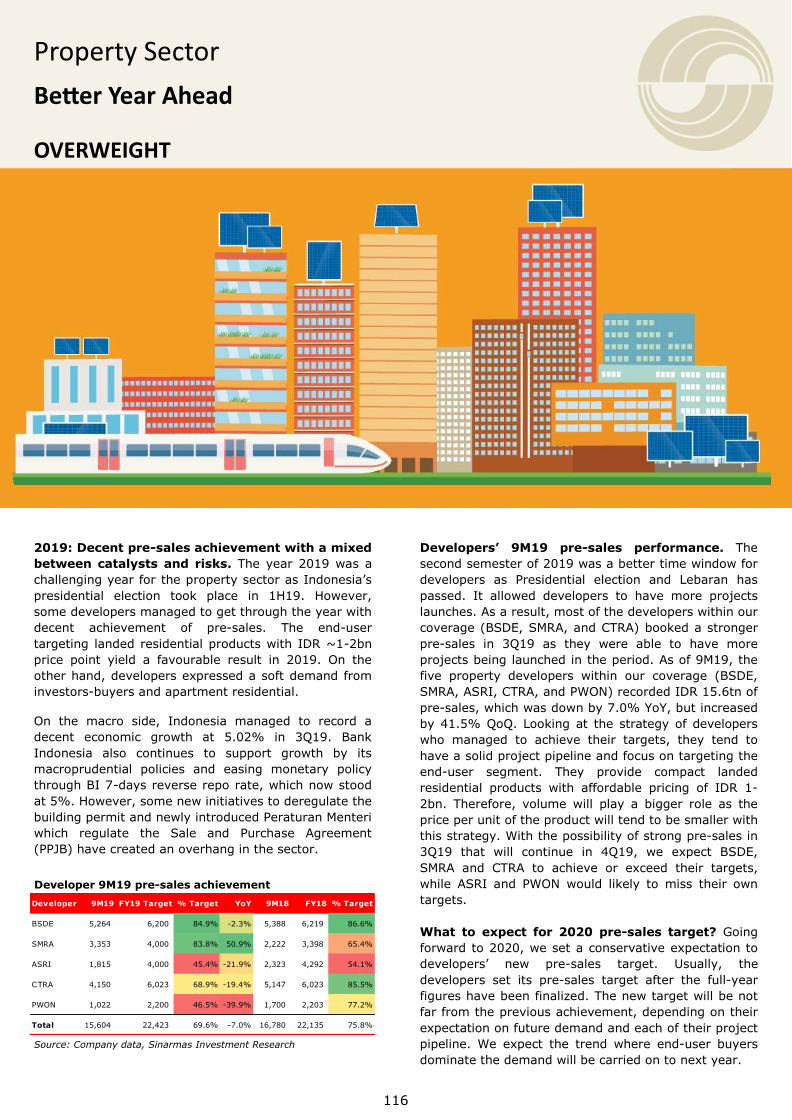
WƌŽƉĞƌƚLJ^ĞĐƚŽƌ ĞƩĞƌzĞĂƌŚĞĂĚ
KsZt/',d
'HYHORSHUV¶ 0 SUH-VDOHV SHUIRUPDQFH 7KHVHFRQGVHPHVWHURIZDVDEHWWHUWLPHZLQGRZIRUGHYHORSHUV DV 3UHVLGHQWLDO HOHFWLRQ DQG /HEDUDQ KDVSDVVHG ,W DOORZHG GHYHORSHUV WR KDYH PRUH SURMHFWVODXQFKHV$VDUHVXOWPRVWRIWKHGHYHORSHUVZLWKLQRXUFRYHUDJH%6'(605$DQG&75$ERRNHGDVWURQJHUSUH-VDOHV LQ 4 DV WKH\ ZHUH DEOH WR KDYH PRUHSURMHFWVEHLQJODXQFKHGLQWKHSHULRG$VRI0WKHILYH SURSHUW\ GHYHORSHUV ZLWKLQ RXU FRYHUDJH %6'(605$$65,&75$DQG3:21UHFRUGHG,'5WQRISUH-VDOHVZKLFKZDVGRZQE\<R<EXWLQFUHDVHGE\4R4 /RRNLQJDW WKH VWUDWHJ\RI GHYHORSHUVZKR PDQDJHG WR DFKLHYH WKHLU WDUJHWV WKH\ WHQG WRKDYHDVROLGSURMHFWSLSHOLQHDQGIRFXVRQWDUJHWLQJWKHHQG-XVHU VHJPHQW 7KH\ SURYLGH FRPSDFW ODQGHGUHVLGHQWLDO SURGXFWV ZLWK DIIRUGDEOH SULFLQJ RI ,'5 -EQ 7KHUHIRUH YROXPHZLOO SOD\ D ELJJHU UROH DV WKHSULFHSHUXQLWRIWKHSURGXFWZLOOWHQGWREHVPDOOHUZLWKWKLVVWUDWHJ\:LWKWKHSRVVLELOLW\RIVWURQJSUH-VDOHVLQ4 WKDW ZLOO FRQWLQXH LQ 4 ZH H[SHFW %6'(605$ DQG &75$ WR DFKLHYH RU H[FHHG WKHLU WDUJHWVZKLOH $65, DQG 3:21 ZRXOG OLNHO\ WRPLVV WKHLU RZQWDUJHWV :KDW WR H[SHFW IRU SUH-VDOHV WDUJHW"*RLQJIRUZDUGWRZHVHWDFRQVHUYDWLYHH[SHFWDWLRQWRGHYHORSHUV¶ QHZ SUH-VDOHV WDUJHW 8VXDOO\ WKHGHYHORSHUV VHW LWV SUH-VDOHV WDUJHW DIWHU WKH IXOO-\HDUILJXUHVKDYHEHHQILQDOL]HG7KHQHZWDUJHWZLOOEHQRWIDUIURPWKHSUHYLRXVDFKLHYHPHQWGHSHQGLQJRQWKHLUH[SHFWDWLRQRQIXWXUHGHPDQGDQGHDFKRIWKHLUSURMHFWSLSHOLQH:H H[SHFW WKH WUHQG ZKHUH HQG-XVHU EX\HUVGRPLQDWHWKHGHPDQGZLOOEHFDUULHGRQWRQH[W\HDU
'HFHQWSUH-VDOHVDFKLHYHPHQWZLWKDPL[HGEHWZHHQFDWDO\VWVDQG ULVNV7KH\HDUZDVDFKDOOHQJLQJ\HDUIRUWKHSURSHUW\VHFWRUDV,QGRQHVLD¶VSUHVLGHQWLDO HOHFWLRQ WRRN SODFH LQ + +RZHYHUVRPHGHYHORSHUVPDQDJHGWRJHWWKURXJKWKH\HDUZLWKGHFHQW DFKLHYHPHQW RI SUH-VDOHV 7KH HQG-XVHUWDUJHWLQJ ODQGHGUHVLGHQWLDOSURGXFWVZLWK ,'5a-EQSULFH SRLQW \LHOG D IDYRXUDEOH UHVXOW LQ 2Q WKHRWKHUKDQGGHYHORSHUVH[SUHVVHGDVRIWGHPDQGIURPLQYHVWRUV-EX\HUVDQGDSDUWPHQWUHVLGHQWLDO
2Q WKH PDFUR VLGH ,QGRQHVLD PDQDJHG WR UHFRUG DGHFHQW HFRQRPLF JURZWK DW LQ 4 %DQN,QGRQHVLD DOVR FRQWLQXHV WR VXSSRUW JURZWK E\ LWVPDFURSUXGHQWLDO SROLFLHV DQG HDVLQJ PRQHWDU\ SROLF\WKURXJK%,-GD\VUHYHUVHUHSRUDWHZKLFKQRZVWRRGDW+RZHYHUVRPHQHZLQLWLDWLYHVWRGHUHJXODWHWKHEXLOGLQJSHUPLWDQGQHZO\LQWURGXFHG3HUDWXUDQ0HQWHULZKLFK UHJXODWH WKH 6DOH DQG 3XUFKDVH $JUHHPHQW33-%KDYHFUHDWHGDQRYHUKDQJLQWKHVHFWRU
6RXUFH&RPSDQ\GDWD6LQDUPDV,QYHVWPHQW5HVHDUFK
'HYHORSHU0SUH-VDOHVDFKLHYHPHQW
Developer 9M19 FY19 Target % Target YoY 9M18 FY18 % Target
BSDE 5,264 6,200 84.9% -2.3% 5,388 6,219 86.6%
SMRA 3,353 4,000 83.8% 50.9% 2,222 3,398 65.4%
ASRI 1,815 4,000 45.4% -21.9% 2,323 4,292 54.1%
CTRA 4,150 6,023 68.9% -19.4% 5,147 6,023 85.5%
PWON 1,022 2,200 46.5% -39.9% 1,700 2,203 77.2%
Total 15,604 22,423 69.6% -7.0% 16,780 22,135 75.8%

WƌŽƉĞƌƚLJ^ĞĐƚŽƌKƵƚůŽŽŬ
7KHUHIRUH ZH EDNH LQ D DJJUHJDWH PDUNHWLQJVDOHV JURZWK IRU WKH ILYH GHYHORSHUV ZLWKLQ RXUFRYHUDJH ,W ZLOO UHPDLQ WKH HQG-XVHU PDUNHW DVLQYHVWRU EX\HUV KDYH QRW VHHQ PDNLQJ DQ\ VWURQJFRPHEDFN 7KH WLPH RI ORZ-LQWHUHVW UDWH DQG ORZ-/79 UDWLR'XULQJ%DQN,QGRQHVLD%,KDVORZHUHGWKH%,'D\V 5HYHUVH 5HSR 5DWH E\ ESV VLQFH -XO\- WR DW FXUUHQW 7KH )HG KDV VLJQDOOHG QR FKDQJHV LQLQWHUHVWUDWHVLQSURYLGLQJOHVVSUHVVXUHIRU%DQN,QGRQHVLD WR UDLVH LQWHUHVW 7KHUHIRUH ZH H[SHFW WKHHDVLQJPRQHWDU\SROLF\FRXOGOHDGPRUWJDJHUDWHWREHORZHU LQ 0RUHRYHU WKH PDFUR-SUXGHQWLDO SROLF\ZKLFKIXUWKHUUHOD[HVWKH/79IRUWKHILUVWKRPHEX\HUVKRXOGVXSSRUWEX\HUV¶DIIRUGDELOLW\2QWKHRWKHUKDQGWKH OX[XU\ W\SH RI SURSHUW\ UHFHLYHG WKH WD[ FXW WRLQFHQWLYL]HWKHXSSHUPDUNHWVHJPHQW
3RVVLEOH FKDQJH LQ UHJXODWLRQ FUHDWHV ERWKUHZDUGV DQG ULVNV 7KHUHZDVDQHZUXOH3HUDWXUDQ0HQWHULIURPWKH0LQLVWU\RI3XEOLF:RUNVDQG+RXVLQJ3835 IRU WKH 33-% 7KH QHZ UXOH VWDWHV WKDWFRPSHQVDWLRQ KDV WR EH PDGH LI GHYHORSHUV IDLOHG WRGHOLYHU WKH DJUHHG WLPLQJ RI WKH SURMHFW FRPSOHWLRQ+RZHYHU WKHUH LV DQ XQFHUWDLQW\ LQ WKH QHZ UXOHV¶GHILQLWLRQ DQG SUDFWLFH ZKLFK FRXOG LQIOLFW D ILQDQFLDOORVV WR SURSHUW\ GHYHORSHUV +RZHYHU DV ZH WDONHGZLWK WKH GHYHORSHUV WKH\ DUH VWLOO LQ WKH SURFHVV RI
OHDUQLQJWKHLPSOLFDWLRQRIWKHUXOHDQGQHJRWLDWLQJZLWKWKH UHODWHGERGLHV WR ORRNDW WKHEHVW RXWFRPH IRU DOOVWDNHKROGHUV (DUO\YLHZRQ36$.LPSDFWV7KH36$.³5HYHQXH IURP &RQWUDFWV ZLWK &XVWRPHUV´ ZKLFK ZDVDGRSWHG IURP ,)56 ZLOO EH LPSOHPHQWHG DW WKHEHJLQQLQJRI,Q36$.UHYHQXH LVUHFRJQL]HGZKHQDJRRGRUVHUYLFHLVWUDQVIHUUHGWRWKHFXVWRPHUDQG WKH FXVWRPHU REWDLQV WKH FRQWURO RI WKDW JRRGVHUYLFH :LWK WKDW EHLQJ VDLG SURSHUW\ GHYHORSHUVVKRXOGRQO\UHFRJQL]HWKHLUUHYHQXHZKHQWKHSURSHUW\LVDOUHDG\KDQGHGRYHU WRD FXVWRPHU*RLQJ IRUZDUGGHYHORSHUV¶ UHYHQXH DQG ERWWRP-OLQH PDUJLQ ZLOO EHPRUHIOXFWXDWLYHDVLWKHDYLO\GHSHQGVRQHDFKSURMHFWFRPSOHWLRQ WLPH 0RUHRYHU DV WKHUH PLJKW EH DQDGMXVWPHQWRQUHWDLQHGHDUQLQJV LWZLOODOVRDIIHFWWKHFRPSDQ\¶V VROYHQF\ UDWLRV LQ EHIRUH VWDUWQRUPDOL]LQJ$ERXW 36$.—)LQDQFLDO ,QVWUXPHQWV LWDIIHFWVPRUHWKDQMXVWDILQDQFLDOLQVWLWXWLRQ/DWHUWKHGHYHORSHUV DUH UHTXLUHG WR UHFRUG WKHLU WUDQVDFWLRQVZLWK FXVWRPHUV DW WKH IDLU YDOXH UDWKHU WKDQ WKHLQYRLFHG DPRXQW LQFOXGH IDLU YDOXH SOXV WKH LQWHUHVWFRVW LPSOLHGWRWKHSULFHZKHQEX\HUFKRVHPRUWJDJHLQVWDOOPHQW SD\PHQW :H H[SHFW WKH LPSDFW ZLOO EHPRUHRQWKHGHYHORSHUV¶UHYHQXHZKLOHWKHERWWRP-OLQHVKRXOGEHOHVVDIIHFWHG :H WDNH D FDXWLRXVO\ RSWLPLVWLF YLHZ RQ WKHVHFWRU DQG FDOO DQ2YHUZHLJKW VWDQFH'HVSLWHWKHULVNV IURP WKH FKDQJHV LQ DFFRXQWLQJ SULQFLSOHV ZHEHOLHYHWKHORZ-LQWHUHVWUDWHDQGORZ/79FRXOGVXSSRUWWKH EX\HUV DIIRUGDELOLW\ WKLV \HDU $V ZH EHOLHYH WKHWUHQG RI VWURQJ GHPDQG IURP WKH HQG-XVHU UHVLGHQWLDOEX\HUZLOOFRQWLQXHLQZHSUHIHUDGHYHORSHUZLWKDFOHDUSURMHFWSLSHOLQHDQGDJRRGH[SRVXUHWRWKHHQG-XVHUVHJPHQW,QWHUPVRIVWRFNSLFN%6'(DQG605$EHFRPHRXU WRSSLFNVRI WKHVHFWRUDV WKHLU VWUDWHJLHVDUHVXLWDEOHZLWKWKHFXUUHQWSURSHUW\PDUNHWFRQGLWLRQ:H UHPDLQ IDYRUDEOH RQ &75$ DV WKH\ JRW DPSOH RISURMHFW SLSHOLQH DQG WDUJHWV WKHPLG WR ORZ VHJPHQW)RU $65, GHVSLWH WKH XQDWWUDFWLYH RXWORRN RI WKHFRPSDQ\ ZH VHH DQ XSVLGH IURP WKH YDOXDWLRQSHUVSHFWLYH DV WKH SULFH DOUHDG\ KHDYLO\ SXQLVKHG/DVWO\ZHDOVRKDYHDQ$'' UDWLQJRQ3:21DVSUH-VDOHV VKRXOGSLFN-XS LQZKLFK VXSSRUWHGE\ WKHODXQFKRI%HNDVL6XSHUEORFN
7LFNHU 5DWLQJ &3 73 &KJ 'LVFWR1$9
%6'( %8<
605$ %8<
$65, $''
3:21 $''
&75$ $''
3URSHUW\6HFWRU
'HYHORSHUV¶PDUNHWLQJVDOHVHVWLPDWH,'5WQ
6RXUFH&RPSDQ\GDWD6LQDUPDV,QYHVWPHQW5HVHDUFK
6RXUFH%DQN,QGRQHVLD6LQDUPDV,QYHVWPHQW5HVHDUFK
1HZ/79)795DWLRLPSOHPHQWHGRQ'HFHPEHU
-
1
2
3
4
5
6
7
8
9
10
2011 2012 2013 2014 2015 2016 2017 2018 2019E 2020F 2021F 2022F
BSDE SMRA ASRI CTRA PWON

WƌŽƉĞƌƚLJ^ĞĐƚŽƌ
WdƵŵŝ^ĞƌƉŽŶŐĂŵĂŝdďŬ
hz
:H UHLWHUDWH RXU %8< FDOO RQ %6'( ZLWK )< 73 RI ,'52XUWDUJHWSULFHUHIOHFWVDGLVFRXQWWR1$9DQGLPSOLHV D [ 3%9 LQ )<)%6'(LVQRWEHKLQGLQWHUPVRIFDSWXULQJ WKH FXUUHQW VWURQJSURSHUW\GHPDQG LQ VPDOO WLFNHW VL]HODQGHG UHVLGHQWLDO SURGXFWV 3UH-VDOHV DFKLHYHPHQW LV RQ WUDFN WRPHHW)<PDQDJHPHQWJXLGDQFH%6'(DVRQHRIWKHGHYHORSHUVZLWKWKHELJJHVWODQGEDQNaKDKDVEHHQEHQHILWWLQJIURPWKHIOH[LELOLW\LQWHUPVRIGHYHORSPHQWVWUDWHJ\0RUHRYHUZLWKWKHVWURQJ EDODQFH VKHHW WKDW %6'(KDV LW SURYLGHV WKH FDSDELOLW\ WRFRQWLQXHGHYHORSLQJ LWV FXUUHQW DQG IXWXUHSURMHFWV+RZHYHU WKHKHDGZLQGVFRPHIURPORZHUWKDQH[SHFWHGSURSHUW\GHPDQG %HWWHU SUH-VDOHV EH\RQG %6'(¶V SUH-VDOHV LQ 4 VKRZHGVLJQLILFDQWJURZWK FRPSDUHG WR4%6'( UHSRUWHGSUH-VDOHVRI,'5 WQ <R< ZLWK VWURQJHU VDOHV LQ WKH UHVLGHQWLDOVKRSKRXVHDQGODQGVDOHV7KHODQGSORWVDOHVLQFOXGHG,'5EQVDOHV WR *RYHUQPHQW RI ,QGRQHVLD LQ UHODWHG WR 37 7UDQVEXPL6HUEDUDMD D VXEVLGLDU\ RI %6' ZKLFK RZQV WKH 6HUSRQJ-%DODUDMD WROO URDGFRQFHVVLRQDQG ,'5EQ WR376DKDEDW.RWD:LVDWDD-9FRPSDQ\WRGHYHORSDVKRSSLQJPDOOLQ.RWD:LVDWD-&LEXEXU2YHUDOO0SUH-VDOHVKDVDFKLHYHGRI)<WDUJHW,'5WQZLWK ,'5WQ -<R< WKDWZDVDOUHDG\RQKDQG$IWHU WKH SURMHFW RI )OHHN+DX] )OHHN+DX] 5 DQG ,PDMLKDXV KDYHEHHQODXQFKHGLWRQO\UHTXLUHGDIHZGD\VWREHVROG7KHSURGXFWVRIIHUHGDFRPSDFW\HWURRP\KRXVHZLWKDQDIIRUGDEOHSULFHZLWKLQDUDQJHRI,'5EQ-EQ 5HDG\WRFDSWXUHWKHIXWXUHRSSRUWXQLW\%6'(LVPRUHSRVLWLYHIRU WKHSURSHUW\PDUNHW QH[W \HDU DQG DLPHGDGHFHQWJURZWKRISUH-VDOHV%6'(ZLOOEHDLPLQJWKHVZHHWVSRWPDUNHWRIDIIRUGDEOHKRXVLQJIRUWKHHQG-XVHUVHJPHQW0RUHRYHUWKHFRPSDQ\SODQQHGWRGHYHORSVRPHQHZLQYHVWPHQWSURSHUWLHVLQ&LEXEXUDUHDZLWK-9VFKHPH WR EXLOG XS WKHLU IXWXUH UHFXUULQJ LQFRPH:RUWK WR QRWHWKH-9VFKHPHZLOODOVRFRQWULEXWHWRQH[W\HDUODQGSORWVDOHV2QWKHRWKHUKDQG%6'(ZLOOEHPRUHFRQVHUYDWLYHRQODXQFKLQJKLJK-ULVH UHVLGHQWLDO ZKLOH ZDLWLQJ IRU WKH GHPDQG IRU KLJK-ULVHUHVLGHQWLDOWRSLFNXS2WKHUWKDQWKDWWKHRQJRLQJSURJUHVVRIWROO-URDG LQIUDVWUXFWXUH LQ %6'( DUHD VKRXOG LPSURYH ODQG SULFHDSSUHFLDWLRQZKLOHDOVRLPSURYLQJWKHWUDIILFLQ%6'&LW\
^ƚŽĐŬ/ŶĨŽƌŵĂƟŽŶ
ůŽŽŵďĞƌŐdŝĐŬĞƌ ^/:
ϱϮ-tĞĞŬ,ŝŐŚ ϭϱϴϬ
ϱϮ-tĞĞŬ>Žǁ ϭϭϮϬ
&zϮϬ&W ϭϴϰdž
&zϮϬ&Ws Ϭϴdž
^ŚĂƌĞKƵƚƐƚĂŶĚŝŶŐ;DŶͿ ϭϵϮϰϲϳ
DĂƌŬĞƚĂƉ;/ZdŶͿ ϮϰϮ
^ŚĂƌĞWƌŝĐĞWĞƌĨŽƌŵĂŶĐĞ
ƵƌƌĞŶƚWƌŝĐĞ ϭϮϱϱ
ϱϮ-tĞĞŬdĂƌŐĞƚWƌŝĐĞ ϭϱϬϬ
йŚĂŶŐĞ ϭϵϱй
+LJKOLJKWV,'5%Q ( ) ) )
3UH-VDOHV
JURZWK -
5HYHQXH
5HYHQXHJURZWK - -
(%,7'$
1HW3URILW
(36,'5
(36JURZWK - - -
3([
3%9[

WƌŽƉĞƌƚLJƵŵŝ^ĞƌƉŽŶŐĂŵĂŝ
,QFRPH6WDWHPHQW &DVK)ORZ
%DODQFH6KHHW 5DWLR$QDO\VLV
( ) ) )
3URILWDELOLW\
52$
52(
*URVVSURILWPDUJLQ
2SHUDWLQJPDUJLQ
1HWPDUJLQ
6ROYHQF\/LTXLGLW\
,QWHUHVWFRYHU[
'HEWWRHTXLW\[
1HWGHEWWRHTXLW\[
&XUUHQWUDWLR[
4XLFNUDWLR[
9DOXDWLRQV
3([
3%9[
.H\$VVXPSWLRQ
3UH-VDOHVJURZWK -
,'5%Q ( ) ) )
&DVKHTXLYDOHQWV
7UDGHUHFHLYDEOHV
,QYHQWRULHV
2WKHUV
7RWDO&$
/7,QYHVWPHQW
1HWIL[HGDVVHWV
2WKHU/7DVVHWV
7RWDO$VVHWV
6KRUW-WHUPORDQV
3D\DEOHV
2WKHUV
7RWDO&/
/RQJ-WHUPGHEW
2WKHUOLDELOLWLHV
7RWDO/LDELOLWLHV
7RWDO(TXLW\
,'5%Q ( ) ) )
1HW,QFRPH
'HSUHFLDWLRQ
&KJLQZRUNLQJFDS
&)IURPRSHUDWLQJ
&KJLQIL[HGDVVHW
&KJLQ/7DVVHWV
&KJLQ/7OLDELOLWLHV
&)IURPLQYHVWLQJ
&KJLQHTXLW\
&KJLQ67ORDQV
&KJLQ/7ORDQV
'LYLGHQG
&)IURPILQDQFLQJ
1HW&DVKIORZ
%HJLQQLQJRI&DVK
(QGLQJ&DVK
,'5%Q ( ) ) )
5HYHQXH
FKDQJH - -
&RVWRIUHYHQXHV
FKDQJH - -
*URVVSURILW
FKDQJH - -
2SHUDWLQJH[SHQVHV
FKDQJH
2SHUDWLQJSURILW
FKDQJH - -
(%,7'$
FKDQJH - -
1HWLQWHUHVW
(DUQLQJVEHIRUHWD[
FKDQJH - - -
7D[
1HWLQFRPH
FKDQJH - - -
(36,'5
FKDQJH - - -

WƌŽƉĞƌƚLJ^ĞĐƚŽƌ
Wd^ƵŵŵĂƌĞĐŽŶŐƵŶŐdďŬ
hz
:H UHLWHUDWH RXU %8< FDOO RQ 605$ ZLWK )< 73 RI ,'52XUWDUJHWSULFHUHIOHFWVDGLVFRXQWWR1$9DQGLPSOLHV D [ 3%9 LQ )<) 6XPPDUHFRQ$JXQJKDVVKRZQRII D VWHOODU SHUIRUPDQFH LQZKLFKZHH[SHFW WR FRQWLQXH WRWKLV \HDU 3URMHFW ODXQFKHV ZHUH VXFFHVVIXOO\ VXSSRUWHG E\ FOHDUSURMHFWSLSHOLQHWKDWWDUJHWVWKHHQG-XVHUPDUNHWZLWKDQDWWUDFWLYHSULFHSRLQW605$VKRXOGKDYHOHVVLPSDFWIURPWKHLPSOHPHQWDWLRQRI36$.VLQFHWKH\GRQ¶WKDYHDQ\RQJRLQJDSDUWPHQWSURMHFWLQFRQVWUXFWLRQSURJUHVV+RZHYHUWKHFRPSDQ\¶VQHDUGHEWPDWXULW\DQGWLJKWFDVKEDODQFHDUHWKLQJVWKDWQHHGWRFRQVLGHUDVLWFRXOGZLWKKROGIXWXUHJURZWK 6WURQJ SUH-VDOHV LQ FRXOG FRQWLQXH LQ $V RI0 605$ UHFRUGHG LWV SUH-VDOHV RI ,'5 WQ <R< RI FRPSDQ\¶VRXU HVWLPDWH :H DUH RSWLPLVWLF WKDW605$ FRXOG H[FHHG LWV )< SUH-VDOHV WDUJHW ZLWK DQ ,'5 WQILJXUH RI SUH-VDOHV ,Q ZH H[SHFW SUH-VDOHV WR JURZE\ <R<WR,'5WQZLWKWKHFRPSDQ\¶VIRFXVRQHQG-XVHUWDUJHWLQJSURGXFWV SULFHG UDQJLQJ DW ,'5 -EQ 6HUSRQJ DQG %HNDVLUHPDLQHGWREHWKHPDLQFRQWULEXWRUVWRWKHFRPSDQ\¶VSUH-VDOHVZKLOH %DQGXQJ DQG 0DNDVVDU ZLOO DOVR FRQWULEXWH D VLJQLILFDQWDPRXQW 0RUHRYHU 6XPPDUHFRQ %RJRU ZKLFK LV SULPDULO\VFKHGXOHGWRODXQFKLQZLOOEHVKLIWHGWRHDUO\RQFHLWVUHDG\ZLWKDOORIWKHQHFHVVDU\SHUPLWV 3UHVHUYH WKH VROYHQF\ 'HVSLWH LWV VWURQJ SURMHFW SLSHOLQH DQGJRRGSHUIRUPDQFHRISUH-VDOHV605$LVIDFLQJDVLJQLILFDQWDPRXQWRI GHEW PDWXULQJ LQ DQG HDFK DW ,'5 WQ :LWK DOLPLWHGDPRXQWRIFDVKDQGHTXLYDOHQWVKROGLQLWVERRN,'5WQLQ 0 WKH FRPSDQ\ ZLOO FRQWLQXH LWV VWUDWHJ\ WR SUHVHUYHVROYHQF\ JRLQJ IRUZDUG 7KH WLJKW FDVK EDODQFH KDV DOUHDG\LPSDFWHG ZLWK WKH VORZLQJ GRZQ RI FRQVWUXFWLRQ DFWLYLW\ LQ LWVLQYHVWPHQW SURMHFW ,Q 605$ZLOO SDXVH RQ ERWK VLJQLILFDQWODQGDFTXLVLWLRQDQGGHYHORSLQJDSDUWPHQWSURMHFWDVWKH\ZLOOIRFXVRQ PRQHWL]LQJ LWV SURMHFW +RZHYHU ZH EHOLHYH WKH PRUHFRQVHUYDWLYHDSSURDFKRI&R¶VVWUDWHJ\LVWKHULJKWWKLQJWKDWQHHGVWREHWDNHQ
^ƚŽĐŬ/ŶĨŽƌŵĂƟŽŶ
ůŽŽŵďĞƌŐdŝĐŬĞƌ ^DZ/:
ϱϮ-tĞĞŬ,ŝŐŚ ϭϯϲϬ
ϱϮ-tĞĞŬ>Žǁ ϳϲϱ
&zϮϬ&W ϯϰϯdž
&zϮϬ&Ws ϭϴdž
^ŚĂƌĞKƵƚƐƚĂŶĚŝŶŐ;DŶͿ ϭϰϰϮϲϴ
DĂƌŬĞƚĂƉ;/ZdŶͿ ϭϰϵ
^ŚĂƌĞWƌŝĐĞWĞƌĨŽƌŵĂŶĐĞ
ƵƌƌĞŶƚWƌŝĐĞ ϭϬϯϬ
ϱϮ-tĞĞŬdĂƌŐĞƚWƌŝĐĞ ϭϯϬϬ
йŚĂŶŐĞ ϮϲϮй
+LJKOLJKWV,'5%Q ( ) ) )
3UH-VDOHV
JURZWK -
5HYHQXH
5HYHQXHJURZWK
(%,7'$
1HW3URILW
(36,'5
(36JURZWK
3([
3%9[
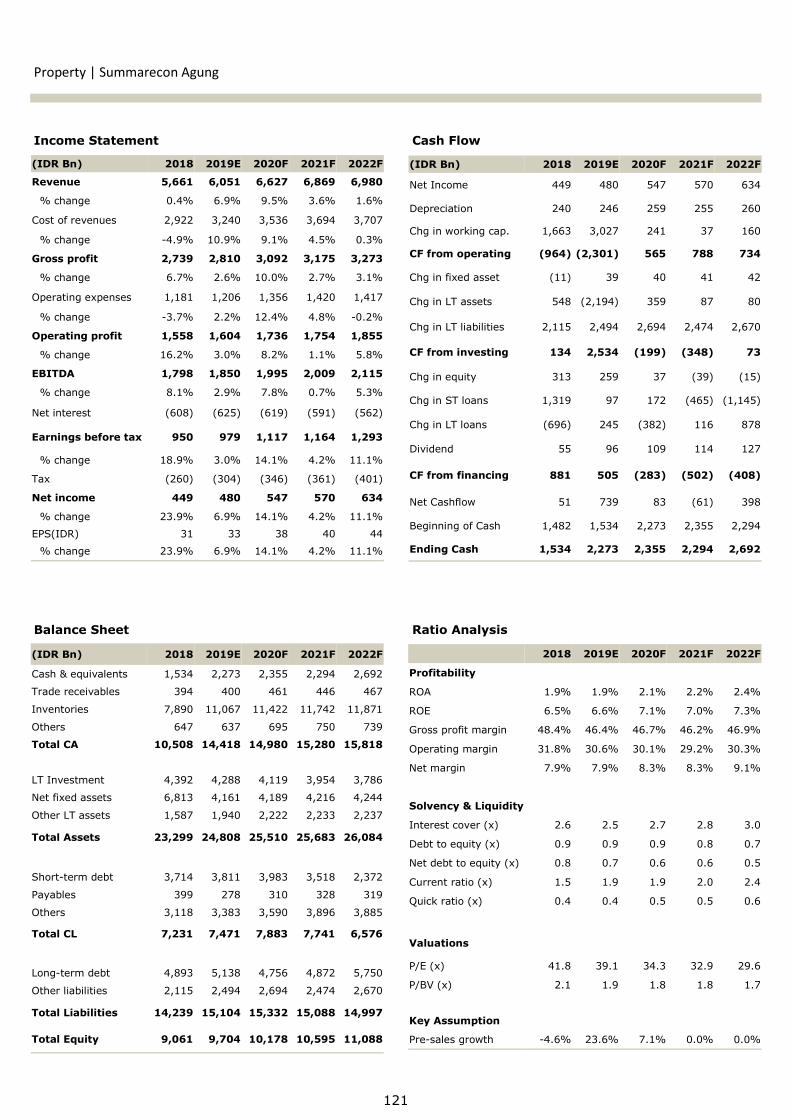
,QFRPH6WDWHPHQW &DVK)ORZ
%DODQFH6KHHW 5DWLR$QDO\VLV
WƌŽƉĞƌƚLJ^ƵŵŵĂƌĞĐŽŶŐƵŶŐ
,'5%Q ( ) ) )
5HYHQXH
FKDQJH
&RVWRIUHYHQXHV
FKDQJH -
*URVVSURILW
FKDQJH
2SHUDWLQJH[SHQVHV
FKDQJH - -
2SHUDWLQJSURILW
FKDQJH
(%,7'$
FKDQJH
1HWLQWHUHVW
(DUQLQJVEHIRUHWD[
FKDQJH
7D[
1HWLQFRPH
FKDQJH
(36,'5
FKDQJH
,'5%Q ( ) ) )
&DVKHTXLYDOHQWV
7UDGHUHFHLYDEOHV
,QYHQWRULHV
2WKHUV
7RWDO&$
/7,QYHVWPHQW
1HWIL[HGDVVHWV
2WKHU/7DVVHWV
7RWDO$VVHWV
6KRUW-WHUPGHEW
3D\DEOHV
2WKHUV
7RWDO&/
/RQJ-WHUPGHEW
2WKHUOLDELOLWLHV
7RWDO/LDELOLWLHV
7RWDO(TXLW\
( ) ) )
3URILWDELOLW\
52$
52(
*URVVSURILWPDUJLQ
2SHUDWLQJPDUJLQ
1HWPDUJLQ
6ROYHQF\/LTXLGLW\
,QWHUHVWFRYHU[
'HEWWRHTXLW\[
1HWGHEWWRHTXLW\[
&XUUHQWUDWLR[
4XLFNUDWLR[
9DOXDWLRQV
3([
3%9[
.H\$VVXPSWLRQ
3UH-VDOHVJURZWK -
,'5%Q ( ) ) )
1HW,QFRPH
'HSUHFLDWLRQ
&KJLQZRUNLQJFDS
&)IURPRSHUDWLQJ
&KJLQIL[HGDVVHW
&KJLQ/7DVVHWV
&KJLQ/7OLDELOLWLHV
&)IURPLQYHVWLQJ
&KJLQHTXLW\
&KJLQ67ORDQV
&KJLQ/7ORDQV
'LYLGHQG
&)IURPILQDQFLQJ
1HW&DVKIORZ
%HJLQQLQJRI&DVK
(QGLQJ&DVK

WƌŽƉĞƌƚLJ^ĞĐƚŽƌ
WdůĂŵ^ƵƚĞƌĂZĞĂůƚLJdďŬ
:HKDYHDQ$''FDOORQ$65,ZLWK)<73RI,'52XUWDUJHW SULFH UHIOHFWV D GLVFRXQW WR 1$9 DQG LPSOLHV D[3%9 LQ)<)$ODP6XWHUD5HDOW\FXUUHQWO\KDVD ODFNRIFDWDO\VWV WKDW ZHLJK GRZQ LWV RXWORRN 0RUHRYHU WKH VLJQLILFDQWQHDU-WHUPGHEWPDWXULW\LQ-FRXOGUHVWUDLQ$65,IURPLWVPDMRU H[SDQVLRQ RI QHZ GHYHORSPHQWV HVSHFLDOO\ IRU WKH 1RUWK6HUSRQJ+RZHYHUGHVSLWHWKHXQDWWUDFWLYHRXWORRN$65,YDOXDWLRQKDVGHSUHVVHGWRWKHSRLQWWKDWLWLVFKHDS:HDUHORRNLQJWRJDLQIURP WKH FXUUHQW SULFH OHYHO 0RUHRYHU DV $65, KDV DGRSWHG DFRQVHUYDWLYH DFFRXQWLQJ PHWKRG VLQFH WKH EHJLQQLQJ $65, ZLOOKDYHQRLPSDFWRQWKHLPSOHPHQWDWLRQRI36$.LQHDUO\ 6RIWSUH-VDOHVSHUIRUPDQFHDQGODFNRIQHZSURMHFWV'XULQJ0$ODP6XWHUDRQO\PDQDJHGWRUHFRUG,'5WQ-<R<RI SUH-VDOHV IRUPLQJ RI )< SUH-VDOHV WDUJHW RI ,'5 WQ:RUWKWRQRWH$65,KDGUHYLVHG LWV)<WDUJHWWR,'5WQIURP,'5WQDQGH[SHFWHG,'5WQODQGVDOHVIURP&)/'LQ$VRI'HFHPEHU$65,DQQRXQFHG WKDW WKH\KDYHDFKLHYHGSUH-VDOHVRI,'5WQRILWV)<WDUJHWDVDWUDQVDFWLRQZLWK&)/'KDVEHHQFRQFOXGHG%HWKDWDVLWPD\ZHDUHFRQFHUQHGWKDW$65,PLJKW VWLOO EH XQDEOH WR DFKLHYH LWV )< SUH-VDOHV WDUJHW *RLQJIRUZDUG ZH DOVR H[SHFW OHVV LQWHUHVWLQJ GHYHORSPHQW RI QHZSURMHFWV LQ WKH QHDU IXWXUH ZKLOH IRU 1RUWK 6HUSRQJ $65, LVH[SHFWHG WR VWDUW WKH GHYHORSPHQW LQ :H ORZHUHG RXUHVWLPDWH RQ - SUH-VDOHV WR ,'5 WQ DQG ,'5 W ,Q $ODP 6XWHUD 5HDOW\ ZLOO IRFXV RQ VHOOLQJ LWV UHPDLQLQJLQYHQWRU\FRQWLQXHWR ODXQFKD ODQGHGUHVLGHQWLDOSURMHFW LQ3DVDU.HPLVDQGDKLJK-ULVHSURMHFWLQ$ODP6XWHUD 0RUHJURZWKRQUHFXUULQJLQFRPH6LQFHWKHFRPSOHWLRQRI*:.6WDWXH LQ *:. &XOWXUDO 3DUN %DOL LQ 4 $65, KDV EHHQH[SHULHQFLQJVLJQLILFDQWJURZWK LQ LWV WRXULVPUHYHQXH<R<LQ0:HDUHSRVLWLYHIRU$65,¶VWRXULVPWRFRQWLQXHLWVVWURQJJURZWK JRLQJ IRUZDUG 7KH FRPSDQ\ LV DOVR QHDU FRPSOHWLRQ RIUHQRYDWLQJ 0DOO # $ODP 6XWHUD ZKLFK VKRXOG WXUQ LQWR D EHWWHURFFXSDQF\UDWLRLQ
^ƚŽĐŬ/ŶĨŽƌŵĂƟŽŶ
ůŽŽŵďĞƌŐdŝĐŬĞƌ ^Z//:
ϱϮ-tĞĞŬ,ŝŐŚ ϯϳϲ
ϱϮ-tĞĞŬ>Žǁ ϮϯϬ
&zϮϬ&W ϭϯϰdž
&zϮϬ&Ws Ϭϱdž
^ŚĂƌĞKƵƚƐƚĂŶĚŝŶŐ;DŶͿ ϭϵϲϰϵϰ
DĂƌŬĞƚĂƉ;/ZdŶͿ ϰϴ
ƵƌƌĞŶƚWƌŝĐĞ ϮϰϮ
ϱϮ-tĞĞŬdĂƌŐĞƚWƌŝĐĞ ϮϴϬ
йŚĂŶŐĞ ϭϱϳй
+LJKOLJKWV,'5%Q ( ) ) )
3UH-VDOHV
JURZWK -
5HYHQXH
5HYHQXHJURZWK -
(%,7'$
1HW3URILW
(36,'5
(36JURZWK - -
3([
3%9[
^ŚĂƌĞWƌŝĐĞWĞƌĨŽƌŵĂŶĐĞ

,QFRPH6WDWHPHQW &DVK)ORZ
%DODQFH6KHHW 5DWLR$QDO\VLV
WƌŽƉĞƌƚLJůĂŵ^ƵƚĞƌĂZĞĂůƚLJ
,'5%Q ( ) ) )
5HYHQXH
FKDQJH -
&RVWRIUHYHQXHV
FKDQJH - -
*URVVSURILW
FKDQJH -
2SHUDWLQJH[SHQVHV
FKDQJH -
2SHUDWLQJSURILW
FKDQJH - -
(%,7'$
FKDQJH - -
1HWLQWHUHVW
(DUQLQJVEHIRUHWD[
FKDQJH - -
7D[
1HWLQFRPH
FKDQJH - -
(36,'5
FKDQJH - -
,'5%Q ( ) ) )
1HW,QFRPH
'HSUHFLDWLRQ
&KJLQZRUNLQJFDS
&)IURPRSHUDWLQJ
&KJLQIL[HGDVVHW
&KJLQ/7DVVHWV
&KJLQ/7OLDELOLWLHV
&)IURPLQYHVWLQJ
&KJLQHTXLW\
&KJLQ67ORDQV
&KJLQ/7ORDQV
'LYLGHQG
&)IURPILQDQFLQJ
1HW&DVKIORZ
%HJLQQLQJRI&DVK
(QGLQJ&DVK
,'5%Q ( ) ) )
&DVKHTXLYDOHQWV
7UDGHUHFHLYDEOHV
,QYHQWRULHV
2WKHUV
7RWDO&$
/7,QYHVWPHQW
1HWIL[HGDVVHWV
2WKHU/7DVVHWV
7RWDO$VVHWV
6KRUW-WHUPORDQV
3D\DEOHV
2WKHUV
7RWDO&/
/RQJ-WHUPGHEW
2WKHUOLDELOLWLHV
7RWDO/LDELOLWLHV
7RWDO(TXLW\
( ) ) )
3URILWDELOLW\
52$
52(
*URVVSURILWPDUJLQ
2SHUDWLQJPDUJLQ
1HWPDUJLQ
6ROYHQF\/LTXLGLW\
,QWHUHVWFRYHU[
'HEWWRHTXLW\[
1HWGHEWWRHTXLW\[
&XUUHQWUDWLR[
4XLFNUDWLR[
9DOXDWLRQV
3([
3%9[
.H\$VVXPSWLRQ
3UH-VDOHVJURZWK -

WƌŽƉĞƌƚLJ^ĞĐƚŽƌ
WdWĂŬƵǁŽŶ:ĂƟdďŬ
:HXSJUDGHRXUFDOORQ3:21WR$''ZLWK)<73RI,'52XUWDUJHWSULFHUHIOHFWVDGLVFRXQWWR1$9DQGLPSOLHVD[3%9LQ)<)'HVSLWHWKHVWURQJHDUQLQJVDQGDKHDOWK\EDODQFH VKHHW WKDW 3DNXZRQ -DWL KDVZH UHPDLQ FDXWLRXVRQ WKH VRIW SUH-VDOHV DFKLHYHPHQW LQ WKDW FRXOG FRQWLQXH LQ 3DNXZRQ -DWL SOD\V LQ WKH KLJKHU XSSHU PDUNHW SURSHUW\VHJPHQWDQGKLJK-ULVHUHVLGHQWLDOV7KHUHIRUHLWLVQRWH[SHULHQFLQJVWURQJ GHPDQG IURP WKH ORZHU VHJPHQW SURSHUW\ PDUNHW0RUHRYHU 3:21¶V UHYHQXH IURP SURSHUW\ GHYHORSPHQW LVHVWLPDWHGWRGHFUHDVHE\a,'5WQDVLWZDVLPSDFWHGE\36$.+RZHYHU XSVLGH ULVNV WR RXU FDOO LQFOXGH VXFFHVVIXO SURMHFWODXQFKLQJ LQ DQG VWURQJHU WKDQ H[SHFWHG SURSHUW\ GHPDQGUHFRYHU\IRUKLJK-ULVHUHVLGHQWLDO 6RIWSUH-VDOHVPLJKWFRQWLQXHWR$VRI03:21KDVDFKLHYHG SUH-VDOHV RI ,'5 WQ RXW RI WKH ,'5 WQ SUH-VDOHVWDUJHW 7KHQXPEHUVDUHZHDNJLYHQ3:21KDVGHFUHDVHGLWV)<SUH-VDOHVE\IURPa,'5WQGXHWRGHOD\LQODXQFKHVIRUVRPHRI WKHLUSURMHFWSLSHOLQH LQFOXGLQJ WKH%HNDVLVXSHUEORFNSURMHFW /RRNLQJ IRUZDUG LQWR ZH H[SHFW 3:21 WR VHW DKLJKHU SUH-VDOHV WDUJHW RI ,'5 WQ IURP )< SUH-VDOHVHVWLPDWH )RU %HNDVL SURMHFW 3:21 LV FXUUHQWO\ SUHSDULQJ DQGEXLOGLQJXSVDOHVWRSXUVXHWKH)HE-ODXQFKLQJSODQ+RZHYHUWKH FRPSDQ\ VDLG WKDW WKH\ ZRXOG EH PRUH FRQVHUYDWLYH RQ LWVRWKHUQHZ ODXQFKHV LQ3:21GRHVRIIHUDSURGXFWZLWK WKHVZHHW VSRW SULFLQJ RI ,'5 -EQ +RZHYHU LW LV DQ DSDUWPHQWSURMHFW LQ 6XUDED\D ZKLFK GRHV QRW KDYH VWURQJ GHPDQG DVFRPSDUHG WR ODQGHG UHVLGHQWLDO )RU LWV ODQGHG UHVLGHQWLDO SURMHFW3:21SULFHGLWVSURGXFWDERYH,'5EQ 5HFXUULQJ LQFRPH UHPDLQV VROLG:H VHH WKDW 3:21 UHFXUULQJLQFRPH ZLOO UHPDLQ WR ERRN D VROLG JURZWK RI D KLJK VLQJOH-GLJLWJURZWK JRLQJ IRUZDUG DQG VXSSRUW WKH FRPSDQ\¶V WRWDO UHYHQXH3:21 KROGV D VWURQJ SRUWIROLR RI LQYHVWPHQW SURSHUWLHV WKDWFRQVLVWVRINVTPRIUHWDLOPDOO1/$NVTPRIRIILFHOHDVLQJ1/$ DQG KRWHO URRPV $OO RI WKHP KDYH D KLJK RFFXSDQF\UDWH%HVLGHV3:21¶VVWURQJILQDQFLDOSRVLWLRQLVUHDG\WRVXSSRUWLWVIXWXUHH[SDQVLRQZKLOHWKHFRPSDQ\LVDOVREHQHILWWHGIURPORZOHYHUDJH
^ƚŽĐŬ/ŶĨŽƌŵĂƟŽŶ
ůŽŽŵďĞƌŐdŝĐŬĞƌ WtKE/:
ϱϮ-tĞĞŬ,ŝŐŚ ϴϭϱ
ϱϮ-tĞĞŬ>Žǁ ϱϱϬ
&zϮϬ&W ϭϰϬdž
&zϮϬ&Ws ϭϳdž
^ŚĂƌĞKƵƚƐƚĂŶĚŝŶŐ;DŶͿ ϰϴϭϱϵϲ
DĂƌŬĞƚĂƉ;/ZdŶͿ Ϯϳϱ
ƵƌƌĞŶƚWƌŝĐĞ ϱϳϬ
ϱϮ-tĞĞŬdĂƌŐĞƚWƌŝĐĞ ϲϰϬ
йŚĂŶŐĞ ϭϮϯй
+LJKOLJKWV,'5%Q ( ) ) )
3UH-VDOHV
JURZWK - -
5HYHQXH
5HYHQXHJURZWK - -
(%,7'$
1HW3URILW
(36,'5
(36JURZWK -
3([
3%9[
^ŚĂƌĞWƌŝĐĞWĞƌĨŽƌŵĂŶĐĞ
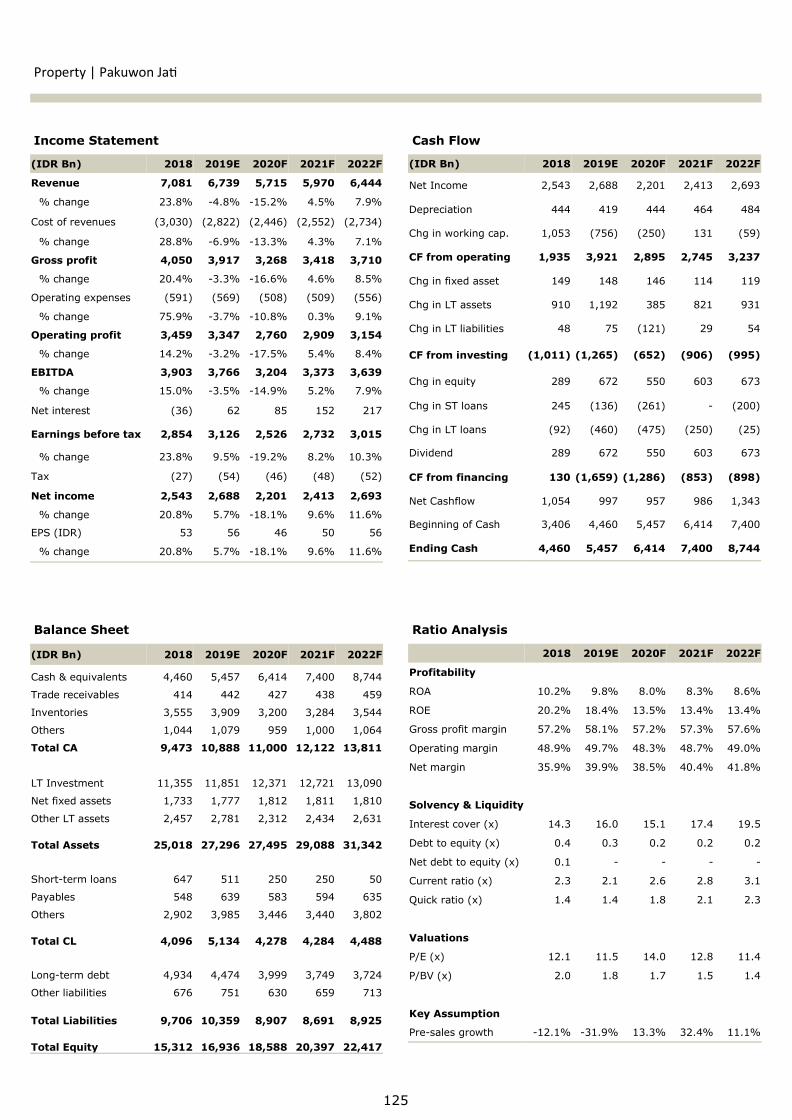
,QFRPH6WDWHPHQW &DVK)ORZ
%DODQFH6KHHW 5DWLR$QDO\VLV
WƌŽƉĞƌƚLJWĂŬƵǁŽŶ:ĂƟ
,'5%Q ( ) ) )
5HYHQXH
FKDQJH - -
&RVWRIUHYHQXHV
FKDQJH - -
*URVVSURILW
FKDQJH - -
2SHUDWLQJH[SHQVHV
FKDQJH - -
2SHUDWLQJSURILW
FKDQJH - -
(%,7'$
FKDQJH - -
1HWLQWHUHVW
(DUQLQJVEHIRUHWD[
FKDQJH -
7D[
1HWLQFRPH
FKDQJH -
(36,'5
FKDQJH -
,'5%Q ( ) ) )
&DVKHTXLYDOHQWV
7UDGHUHFHLYDEOHV
,QYHQWRULHV
2WKHUV
7RWDO&$
/7,QYHVWPHQW
1HWIL[HGDVVHWV
2WKHU/7DVVHWV
7RWDO$VVHWV
6KRUW-WHUPORDQV
3D\DEOHV
2WKHUV
7RWDO&/
/RQJ-WHUPGHEW
2WKHUOLDELOLWLHV
7RWDO/LDELOLWLHV
7RWDO(TXLW\
,'5%Q ( ) ) )
1HW,QFRPH
'HSUHFLDWLRQ
&KJLQZRUNLQJFDS
&)IURPRSHUDWLQJ
&KJLQIL[HGDVVHW
&KJLQ/7DVVHWV
&KJLQ/7OLDELOLWLHV
&)IURPLQYHVWLQJ
&KJLQHTXLW\
&KJLQ67ORDQV -
&KJLQ/7ORDQV
'LYLGHQG
&)IURPILQDQFLQJ
1HW&DVKIORZ
%HJLQQLQJRI&DVK
(QGLQJ&DVK
( ) ) )
3URILWDELOLW\
52$
52(
*URVVSURILWPDUJLQ
2SHUDWLQJPDUJLQ
1HWPDUJLQ
6ROYHQF\/LTXLGLW\
,QWHUHVWFRYHU[
'HEWWRHTXLW\[
1HWGHEWWRHTXLW\[ - - - -
&XUUHQWUDWLR[
4XLFNUDWLR[
9DOXDWLRQV
3([
3%9[
.H\$VVXPSWLRQ
3UH-VDOHVJURZWK - -

WƌŽƉĞƌƚLJ^ĞĐƚŽƌ
WdŝƉƵƚƌĂĞǀĞůŽƉŵĞŶƚdďŬ
:H UHLWHUDWH RXU $'' FDOO RQ &75$ ZLWK )< 73 RI ,'52XUWDUJHWSULFHUHIOHFWVDGLVFRXQWWR1$9DQGLPSOLHVD[3%9LQ)<)&LSXWUD'HYHORSPHQWLVRQWUDFNWRDFKLHYHLWV)<SUH-VDOHVWDUJHW&75$LVVXSSRUWHGE\DVWURQJSURMHFW SLSHOLQH WKDW WDUJHWV WKHPLG WR ORZ-HQGPDUNHW VHJPHQWZKLFK FXUUHQWO\ VKRZV VWURQJ GHPDQG +RZHYHU WKH GHPDQG IRURIILFHDQGDSDUWPHQWUHPDLQHGVRIW0RUHRYHU&75$KDVDVXLWDEOHVWUDWHJ\IRUWKHFXUUHQWFRQGLWLRQ/RZ/79UDWLRDQGPRUWJDJHUDWHWKDW LV H[SHFWHG WR GHFUHDVH IROORZLQJ WKH FHQWUDO UDWH +RZHYHUWKH ULVNV WR RXU FDOO DUH ZHDNHU GHPDQG LQ WKH RYHUDOO SURSHUW\PDUNHWDQGKLJKHUWKDQH[SHFWHGLPSDFWRIERWK36$.DQG $PSOHSURMHFWSLSHOLQHDQGVXLWDEOHVWUDWHJ\OHDGWRDVWURQJSUH-VDOHVSHUIRUPDQFH$VRI0&75$KDVERRNHGSUH-VDOHVRI ,'5 WQ - <R< DQG DFKLHYHG RI )< SUH-VDOHVWDUJHWRI,'5WQ1RWVWRSSLQJWKHUH&75$RQWK2FWREHU¶KDVDOUHDG\ERRNHGDQDGGLWLRQDO,'5WQRISUH-VDOHVIURP&LWUD*DUGHQ3XULSURMHFWDQG&LWUD/DQG&LW\/RVDUL0DNDVVDU7KHDGGLWLRQDOVDOHIURPERWKSURMHFWVPDGHWKHSUH-VDOHVWR,'5EQIRUPLQJRI WKH FRPSDQ\V IXOO-\HDU WDUJHW $V RI 0 RI WKHFRPSDQ\¶VSUH-VDOHVZHUHSULFHG IURPXQGHU ,'5EQZKLOHRILWVSD\PHQWXVHDPRUWJDJHPHWKRG7KHUHIRUHZHDUHSRVLWLYHIRU &75$ WR DFKLHYH LWV IXOO-\HDU WDUJHW *RLQJ IRUZDUG &LSXWUD'HYHORSPHQW ZLOO FRQWLQXH WR WDUJHW WKH HQG-XVHU PDUNHW ZLWK DSULFHSRLQWEHORZ,'5EQZKLFKZHEHOLHYHZKHUHWKHVZHHW-VSRWFXUUHQWO\LV,QZHHVWLPDWH&75$WRKDYHDEHWWHUSUH-VDOHVWDUJHWWKDWVWDQGVDWDQRWKHU,'5WQ<R< 'UDZEDFNV 'HVSLWH WKH VWURQJ SUH-VDOHV SHUIRUPDQFH DQGVXLWDEOH EXVLQHVV VWUDWHJ\ ILQDQFLDO SHUIRUPDQFH ZDV ZHDN IRU&75$LQ0RYLQJLQWRZHH[SHFW&75$ZLOOEHLPSDFWHGIURP WKH LPSOHPHQWDWLRQ RI 36$. DQG ZKLFK ZH KDYH QRWUHFHLYHG WKH HVWLPDWHG ILJXUH IRU WKH DGMXVWPHQW 2Q D YDOXDWLRQSHUVSHFWLYHWKHXSVLGHJLYHQIURPWKHFXUUHQWSULFHOHYHOLVQRWWRROXFUDWLYH +RZHYHU ZH EHOLHYH WKH XSVLGH ULVNV DUH ORZHU WKDQH[SHFWHGLPSDFWIURPWKHDFFRXQWLQJFKDQJHDQGWKHFRQWLQXDWLRQRIVWURQJSUH-VDOHVSHUIRUPDQFHLQ
^ƚŽĐŬ/ŶĨŽƌŵĂƟŽŶ
ůŽŽŵďĞƌŐdŝĐŬĞƌ dZ/:
ϱϮ-tĞĞŬ,ŝŐŚ ϭϯϯϱ
ϱϮ-tĞĞŬ>Žǁ ϴϱϱ
&zϮϬ&W Ϯϴϭdž
&zϮϬ&Ws ϭϮdž
^ŚĂƌĞKƵƚƐƚĂŶĚŝŶŐ;DŶͿ ϭϴϱϲϬϯ
DĂƌŬĞƚĂƉ;/ZdŶͿ ϭϴϱ
ƵƌƌĞŶƚWƌŝĐĞ ϭϬϲϬ
ϱϮ-tĞĞŬdĂƌŐĞƚWƌŝĐĞ ϭϭϳϬ
йŚĂŶŐĞ ϭϬϰй
+LJKOLJKWV,'5%Q ( ) ) )
3UH-VDOHV
JURZWK - -
5HYHQXH
5HYHQXHJURZWK - - -
(%,7'$
1HW3URILW
(36,'5
(36JURZWK - -
3([
3%9[
^ŚĂƌĞWƌŝĐĞWĞƌĨŽƌŵĂŶĐĞ

,QFRPH6WDWHPHQW &DVK)ORZ
%DODQFH6KHHW 5DWLR$QDO\VLV
WƌŽƉĞƌƚLJŝƉƵƚƌĂĞǀĞůŽƉŵĞŶƚ
,'5%Q ( ) ) )
1HW,QFRPH
'HSUHFLDWLRQ
&KJLQZRUNLQJFDS
&)IURPRSHUDWLQJ
&KJLQIL[HGDVVHW
&KJLQ/7DVVHWV
&KJLQ/7OLDELOLWLHV
&)IURPLQYHVWLQJ
&KJLQHTXLW\ - - - -
&KJLQ67ORDQV
&KJLQ/7ORDQV
'LYLGHQG
&)IURPILQDQFLQJ
1HW&DVKIORZ
%HJLQQLQJRI&DVK
(QGLQJ&DVK
( ) ) )
3URILWDELOLW\ 52$
52(
*URVVSURILWPDUJLQ
2SHUDWLQJPDUJLQ
1HWPDUJLQ
6ROYHQF\/LTXLGLW\ ,QWHUHVWFRYHU[
'HEWWRHTXLW\[
1HWGHEWWRHTXLW\[
&XUUHQWUDWLR[
4XLFNUDWLR[
9DOXDWLRQV 3([
3%9[
.H\$VVXPSWLRQ 3UH-VDOHVJURZWK - -
,'5%Q ( ) ) )
&DVKHTXLYDOHQWV
7UDGHUHFHLYDEOHV
,QYHQWRULHV
2WKHUV
7RWDO&$
/7,QYHVWPHQW
1HWIL[HGDVVHWV
2WKHU/7DVVHWV
7RWDO$VVHWV
6KRUW-WHUPORDQV
3D\DEOHV
2WKHUV
7RWDO&/
/RQJ-WHUPGHEW
2WKHUOLDELOLWLHV
7RWDO/LDELOLWLHV
7RWDO(TXLW\
,'5%Q ( ) ) )
5HYHQXH
FKDQJH - - -
&RVWRIUHYHQXHV
FKDQJH - - -
*URVVSURILW
FKDQJH - - -
2SHUDWLQJH[SHQVHV
FKDQJH - -
2SHUDWLQJSURILW
FKDQJH - - -
(%,7'$
FKDQJH - -
1HWLQWHUHVW
(DUQLQJVEHIRUHWD[
FKDQJH - -
7D[
1HWLQFRPH
FKDQJH - -
(36,'5
FKDQJH - -

Pulp and Paper Sector
Pulp Price Conundrum
NEUTRAL
Pulp demand was bad in 2019, yet no changes in
the underlying segments. 2019 was surely a bad
year for pulp demand due to China’s economic
slowdown. However, question is whether the slowdown
will be temporary or long lasting, as pulp demand will
move correspondingly with China’s economy.
Exempting the slowdown, it is believed that the
underlying segments of pulp, especially tissue, will
continue to grow strongly in China and many other
parts of the world, at around 2.8% per annum until
2030. Not only tissue, the other pulp downstream
product such as packaging has kept on gaining traction
on the back of 1) e-commerce development and 2)
plastic substitution. Recent global trend has also
provided the industry with the opportunity to gradually
replace plastic products such as straw, wrapper and
FY19: sloppy pulp and paper market. FY19 global
pulp and paper industry has been highlighted by the
rapid escalation and a record high pulp inventory level
in both China and European ports. Inventory level has
crawled up starting in 4Q18 which we predicted was
due to the skyrocketing pulp price that touched ~USD
800/ton in mid 2018. This has led to the disagreement
between buyers and sellers. As a result, several big
Chinese paper mills chose to operate with a depressed
inventory, delaying the purchase and takeaways from
China ports in the early 2019. At the same time, global
economic slowdown especially in China and Europe,
two biggest pulp users in the world, has put more
pressure on pulp demand throughout the year. On
various sources, we note that global China BHKP pulp
price has slumped significantly to ~USD 530/ton in mid
-year, reflecting a drastic decline of almost 25% from
2018. Following the industry and price outlook, the
pulp and paper companies under our coverage (INKP
and TKIM) have experienced a flat top-line growth with
dropping margins in 2019.
Supply outlook to remain intact. Similar to 2019,
global pulp production capacity should remain the same
as no further major addition post the 2.8mn tons from
OKI pulp and paper. The next new capacity investment
reported (~3-4mn tons) is coming from several Latin
America mills (Arauco’s MAPA and UPM) which are
expected to complete in 2021-2022. Therefore, we see
no disruption from the supply side in the near to
medium term, though we are more cautious in the
longer term.
128
50
100
150
200
250
450
500
550
600
650
700
750
800
850
Jan-14 Jun-14 Nov-14 Apr-15 Sep-15 Feb-16 Jul-16 Dec-16 May-17 Oct-17 Mar-18 Aug-18 Jan-19 Jun-19
China Import ASP (USD/ton) - LHS PPI Pulp RHS
Source: Bloomberg, fred.stlouis.org, Sinarmas Investment Research
Pulp price slump over 2019

Pulp and Paper | Sector Outlook
quarters at a low fixed price (estimated at USD 480-
500/ton). To note, Suzano has lowered their
inventories by 440KT in 3Q18. Despite the short-term
pressure, however pulp price at ~USD 450-500/ton
may have been bottoming as we believe it is already
close to several pulp producers’ cash cost. Therefore,
we expect less downside risk for pulp price from the
current level, however price recovery may be delayed
and can possibly seen the fastest in 2H20 considering
the current high inventory level. Our assumption on
benchmark pulp price is at USD 610/650/630 per ton
for FY19E/FY20F/FY21F.
Implications on pulp and paper companies’
performances. We believe that there is a hope for
better performances for both INKP and TKIM in 2020
on the back of moderate recovery in pulp price and
higher sales volume. INKP as an integrated pulp and
paper producer should be benefited from its flexibility
to switch its focus between upstream or downstream
by examining pulp price. Meanwhile, TKIM will still see
the benefit of OKI’s ramping up its utilization rate both
in pulp and tissue segments.
We lower our OVERWEIGHT to NEUTRAL stance
on pulp and paper industry. Despite China was seen
improving in the near end of FY19, the overall sector
outlook remains challenging. We believe the best
decision is “wait and see” at current whilst keep on
observing for further outcomes from China, Europe,
and Suzano’s act as it will shape the direction of the
industry ahead. Near term pressure remains for pulp
price while moderate recovery should be more visible in
2H20. We prefer INKP as it will be more directly
impacted by pulp price improvement and its attractive
valuation.
Styrofoam with an eco-friendly fiber-based packaging
onwards. Consequently, we view pulp remains a
growing industry in the long term.
The industry’s direction will be steered by China
and Europe. Starting 2019 with weak demand, recent
news stated that pulp demand in China has been
improving from July to end 3Q19, which was estimated
due to historically low pulp price, seasonally better
demand moving towards Chinese New Year, along with
Suzano’s effort to destock its record high inventories.
Pulp inventories in China ports were also reported down
to 1.75MT (-11% MoM as of Nov-19), despite still being
elevated compared to normal level (~1MT). Meanwhile
European pulp market remains facing tough challenges,
mainly caused by the deceleration in Printing & Writing
(P&W) demand. That led to European’s pulp stockpiles
to remain soaring at 1.87MT per Oct-19. At current,
we remain cautious and further developments on China
and Europe will confirm a clearer outlook for the
industry ahead.
Expectation on pulp price ahead. The remaining
elevated stockpiles both in China and European ports
will keep on pressuring pulp price in the near term.
This will be exacerbated by Suzano’s continuing effort
to destock more of their inventories in the upcoming
129
Ticker Rating CP TP % Chg FY20F P/E
INKP BUY 7,875 10,400 32.1 10.5
TKIM NEUTRAL 11,300 12,350 9.3 10.5
Pulp and Paper sector
21.1
30.8 34.0
39.0 42.8
55.0 58.9
66.0
2005 2015 2018 2023E
Hardwood (mn tons) Global Market Pulp Demand (mn tons)
Source: PPPC S&D 2019, Suzano, Sinarmas Investment Research
Growing global pulp demand
-
500
1,000
1,500
2,000
2,500
Jul-17 Sep-17 Nov-17 Jan-18 Mar-18 May-18 Jul-18 Sep-18 Nov-18 Jan-19 Mar-19 May-19 Jul-19 Sep-19
European Pulp Stockpiles (ths tons) Average Stockpiles
Source: Europulp, Sinarmas Investment Research
High stockpiles in European ports

Pulp and Paper Sector
PT Indah Kiat Pulp and Paper Tbk.
BUY
We maintain our BUY recommendation on PT Indah Kiat
Pulp and Paper Tbk (INKP) with 52-week target price of IDR
10,400. Our TP represents 32.1% potential upside, pegged to
10.5x FY20F PE. Despite challenges may linger on the industry in
the near-term, however some recoveries in pulp price may be
visble next year although with a humble magnitude. As a result, we
expect INKP to book slightly better margins next year. INKP will
focus on expanding in its tissue business ahead while continue
enhancing its production efficiency. Forward looking, INKP now
trades at 7.9x PE and 0.7x PBV which are undemanding. Downside
risk to our call is softer than expeced pulp demand that
continuously pressurizes global pulp price.
Anticipating a modest recovery in pulp price. Considering the
global industry prospect in 2020, we expect a recovery in pulp price
although not at a significant degree and only appeared most
quickly in 2H19. We are now seeing pulp price at USD 650/ton in
FY20F (+6.6% from FY19E). For INKP, we forecast top/bottom-line
growth of 5.9%/17.9% YoY in FY20F. We also see slight margins
expansion whereas GPM/OPM/NPM will reach 28.2/18.7/11% in
2020 (vs 27.2%/17.8%/9.9% in FY19E).
Flexibility, privilege of being integrated. Being a fully
integrated pulp and paper company, INKP operates in both
upstream and downstream (paper, packaging and tissue)
businesses. This will benefit INKP in terms of: 1) a portion of pulp
is used internally (for INKP and affiliated companies) hence less
fear of weak external pulp demand, 2) the visibility to manage
product mix, as INKP could shift to more downstream products if
pulp price softens, vice versa.
Focus on expanding tissue and promoting efficiency. At
current, INKP operates tissue lines totaling 108,000 tons capacity
(FY20F utilization of 80%) and looking forward to add more lines in
the upcoming years as tissue growth outlook remains positive. In
addition, INKP keeps on promoting production efficiency, one of
which by operating 2 new powerplants in early 2020 in its Serang
plant in order to reduce costs. Note that energy cost attributes
~26% to INKP’s COGS.
130
Stock Information
Bloomberg Ticker INKP IJ
52-Week High 13,700
52-Week Low 5,325
FY20F P/E 10.5x
FY20F P/BV 0.9x
Share Outstanding (Mn) 5,471.0
Market Cap. (IDR Tn) 43.1
Share Price Performance
Current Price 7,875
52-Week Target Price 10,400
% Change 32.1%
Highlights (USD Mn) 2018 2019E 2020F 2021F 2022F
Revenue 3,335 3,274 3,467 3,618 3,735
% growth 6.6% -1.9% 5.9% 4.3% 3.2%
Gross Profit 1,204 891 978 981 968
Net Profit 588 323 381 391 380
% growth 42.3% -45.1% 17.9% 2.6% -2.7%
Gross Margin (%) 36.1% 27.2% 28.2% 27.1% 25.9%
Net Margin (%) 17.6% 9.9% 11.0% 10.8% 10.2%
Return on Equity (%) 16.8% 8.3% 9.1% 8.6% 7.8%
Return on Assets (%) 7.2% 3.7% 4.6% 4.8% 4.6%
EPS (USD) 0.107 0.059 0.069 0.071 0.069

131
Pulp and Paper | Indah Kiat Pulp and Paper
(USD Mn) 2018 2019E 2020F 2021F 2022F
Revenue 3,335 3,274 3,467 3,618 3,735
% growth 6.6% -1.9% 5.9% 4.3% 3.2%
COGS (2,132) (2,383) (2,490) (2,637) (2,767)
% growth -4.2% 11.8% 4.5% 5.9% 4.9%
Gross Profit 1,204 891 978 981 968
% growth 33.2% -26.0% 9.7% 0.3% -1.3%
Operating Expenses (310) (309) (331) (347) (363)
Opex to Sales (%) -9.3% -9.4% -9.5% -9.6% -9.7%
EBIT 894 582 647 634 605
% growth 48.3% -34.9% 11.2% -2.0% -4.5%
EBITDA 1,186 854 942 932 916
% growth 32.2% -28.0% 10.3% -1.1% -1.7%
Net Financing (180) (175) (139) (113) (98)
Other Inc (Exp) 21 24 1 1 1
EBT 736 431 508 521 507
% growth 61.0% -41.5% 17.9% 2.6% -2.7%
Tax Benefit (Exp) (148) (108) (127) (130) (127)
Net Income 588 323 381 391 380
% growth 42.3% -45.1% 17.9% 2.6% -2.7%
EPS (USD) 0.107 0.059 0.069 0.071 0.069
(USD Mn) 2018 2019E 2020F 2021F 2022F
Net Income 588 323 381 391 380
Dep. & Amortization 292 272 295 298 311
Chg. In NWC (755) 694 (267) (167) (7)
CF from Operating 125 1,289 409 522 684
Capital Expenditure (390) (255) (306) (271) (274)
Chg. in LT Assets 26 (31) (2) (2) (13)
Chg. in LT Liabs 53 (40) 24 16 1
CF from Investing (311) (326) (284) (257) (286)
Chg. in Share & APIC - - - - -
Chg. in Debt 356 (348) (793) (309) (210)
Dividends Paid (39) (56) (31) (36) (37)
Others 5 (13) - - -
CF from Financing 322 (416) (823) (345) (247)
Chg. in Cash 136 547 (698) (80) 152
Beginning Cash 620 756 1,303 605 525
Ending Cash 756 1,303 605 525 676
Income Statement Cash Flow
Balance Sheet Ratio Analysis and Key Assumptions
(USD Mn) 2018 2019E 2020F 2021F 2022F
Cash & Equivalents 756 1,303 605 525 676
Trade Receivables 1,097 847 922 986 992
Inventories 1,182 1,053 1,097 1,155 1,192
Other Current Assets 1,156 750 925 1,016 967
Total CA 4,191 3,953 3,549 3,681 3,827
Fixed Assets 3,934 3,916 3,927 3,900 3,863
Other Non CA 627 658 660 662 675
Total Assets 8,751 8,528 8,137 8,243 8,366
Short Term Debt 1,393 1,780 1,295 1,192 1,156
Trade Payables 147 166 168 182 190
Other CL 202 92 118 148 128
Total CL 1,742 2,038 1,580 1,522 1,474
Long Term Debt 2,977 2,243 1,936 1,730 1,556
Other Non CL 261 221 245 261 262
Total Liabilities 4,979 4,501 3,760 3,512 3,291
Share & APIC 2,195 2,195 2,195 2,195 2,195
Retained Earnings 1,564 1,831 2,181 2,536 2,879
Others 13 1 1 1 1
Total Equity 3,772 4,026 4,376 4,731 5,074
Total Liabilities & Equity
8,751 8,528 8,137 8,243 8,366
2018 2019E 2020F 2021F 2022F
Profitability
Gross Margin 36.1% 27.2% 28.2% 27.1% 25.9%
Operating Margin 26.8% 17.8% 18.7% 17.5% 16.2%
EBITDA Margin 35.6% 26.1% 27.2% 25.7% 24.5%
Net Margin 17.6% 9.9% 11.0% 10.8% 10.2%
Liquidity
Current Ratio (x) 2.4 1.9 2.2 2.4 2.6
Solvency
Debt to Equity (x) 1.2 1.0 0.7 0.6 0.5
Debt to Assets (x) 0.5 0.5 0.4 0.4 0.3
Valuation
Price to Earnings (x) 6.8 12.4 10.5 10.2 10.5
Price to Book (x) 1.1 1.0 0.9 0.8 0.8
Key Assumptions
Utilization rate 88.0% 88.4% 90.0% 91.6% 93.2%
Sales Vol Growth
Pulp -18.3% -2.9% 4.5% 6.4% 3.8%
Paper 2.7% 7.9% -0.1% 0.1% 0.0%
Packaging -1.4% -0.7% 4.2% 5.5% 2.4%
Pulp price (USD/ton) 790 610 650 630 630

Pulp and Paper Sector
PT Tjiwi Kimia Pulp and Paper Tbk.
NEUTRAL
We lower our BUY to NEUTRAL call on PT Tjiwi Kimia Pulp
and Paper Tbk (TKIM) with 52-week target price of IDR
12,350. Our TP represents 9.3% potential upside. TKIM’s
performance will remain be dependent on the ramping up of OKI
mills in 2020 along with the continuing conversion of white paper
lines to the industrial brown paper lines. On the OKI mills, we
expect a ramping up in its utilization rate, both from pulp and
tissue. OKI will also see more savings in transportation cost once
the seaport construction is finished next year. At current price, we
believe INKP provides more potential upside than TKIM. In
addition, we view that pulp price recovery will impact INKP more
directly. All considered, we prefer INKP to TKIM. Downside risks to
our call is weak global pulp price and slow ramping up in OKI.
Driven by OKI mills. TKIM’s performance will still be driven by
how well OKI manages to ramp up its production in 2020. For
FY20F, we forecast OKI to produce 2.5mn tons of pulp (83.3%
utilization rate), up from 2.2mn tons in FY19E (we expect the
slower production was on downtime). In addition, tissue production
will be at 200ths tons (40% utilization rate). Taking into account
those assumptions and global pulp price at USD 650/ton, we arrive
at USD 255mn contribution from OKI (+24.1% YoY). For TKIM, we
expect a flat top-line growth in 2020 due to higher sales coming
from industrial brown paper that has lower selling price. GPM/OPM
should expand by ~50bps to 10.6%/3.2%, while bottom-line is
seen at USD 256mn (+26.7% YoY; 23.9% NPM).
Operating efficiency in OKI stemming from the seaport. The
seaport construction in OKI should be completed in 2020, which
may provide OKI with opportunity to save a portion of its logistics
cost. When the seaport fully operates, OKI will be able to receive
woodchips from other islands by sea (not only by land transport
and usually cheaper costs) and perform direct export sales as most
OKI’s sales go to the export market. Better operating efficiency, we
believe that it may lead to higher OKI’s profitabitly ahead.
132
Stock Information
Bloomberg Ticker TKIM IJ
52-Week High 13,950
52-Week Low 5,575
FY20F P/E 10.5x
FY20F P/BV 1.6x
Share Outstanding (Mn) 3,113.2
Market Cap. (IDR Tn) 35.2
Share Price Performance
Current Price 11,300
52-Week Target Price 12,350
Upside Potential 9.3%
Highlights (USD Mn) 2018 2019E 2020F 2021F 2022F
Revenue 1,056 1,069 1,072 1,079 1,097
% growth 4.4% 1.3% 0.3% 0.6% 1.7%
Gross Profit 115 108 114 115 118
Net Profit 246 202 256 277 278
% growth 667.6% -17.8% 26.7% 8.1% 0.6%
Gross Margin (%) 10.9% 10.1% 10.6% 10.7% 10.7%
Net Margin (%) 23.3% 18.9% 23.9% 25.6% 25.4%
Return on Equity (%) 19.9% 14.3% 15.5% 14.6% 12.9%
Return on Assets (%) 8.3% 6.4% 7.8% 7.9% 7.6%
EPS (USD) 0.079 0.065 0.082 0.089 0.089

133
Pulp and Paper | Tjiwi Kimia Pulp and Paper
(USD Mn) 2018 2019E 2020F 2021F 2022F
Revenue 1,056 1,069 1,072 1,079 1,097
% growth 4.4% 1.3% 0.3% 0.6% 1.7%
COGS (940) (961) (959) (963) (979)
% growth 4.2% 2.2% -0.3% 0.5% 1.7%
Gross Profit 115 108 114 115 118
% growth 5.8% -6.4% 5.4% 1.5% 1.9%
Operating Expenses (76) (78) (79) (79) (80)
Opex to Sales (%) -7.2% -7.3% -7.4% -7.3% -7.3%
EBIT 40 30 34 37 38
% growth 51.9% -24.1% 14.3% 7.0% 3.5%
EBITDA 132 109 114 112 113
% growth 20.5% -17.4% 4.7% -1.9% 1.5%
Associated Income 230 206 255 273 273
Others (19) (35) (33) (32) (31)
EBT 251 201 256 278 280
% growth 528.8% -19.9% 27.6% 8.4% 0.8%
Tax Benefit (Exp) (5) 1 (0) (1) (2)
Net Income 246 202 256 277 278
% growth 667.6% -17.8% 26.7% 8.1% 0.6%
EPS (USD) 0.079 0.065 0.082 0.089 0.089
(USD Mn) 2018 2019E 2020F 2021F 2022F
Net Income 246 202 256 277 278
Dep. & Amortization 92 79 79 75 75
Chg. In NWC (193) 174 (38) (25) 17
CF from Operating 144 455 297 327 371
Capital Expenditure (26) (39) (29) (29) (30)
Chg. in LT Assets (213) (213) (254) (273) (276)
Chg. in LT Liabs 2 (3) 3 (0) 1
CF from Investing (237) (254) (280) (303) (305)
Chg. in Share & APIC - - - - -
Chg. in Debt 129 (14) (71) (65) (77)
Dividends Paid (7) (25) (20) (26) (28)
Others (2) - - - -
CF from Financing 121 (39) (91) (90) (105)
Chg. in Cash 28 162 (74) (66) (39)
Beginning Cash 125 153 315 241 175
Ending Cash 153 315 241 175 136
Income Statement Cash Flow
Balance Sheet Ratio Analysis and Key Assumptions
(USD Mn) 2018 2019E 2020F 2021F 2022F
Cash & Equivalents 153 315 241 175 136
Trade Receivables 124 101 109 111 109
Inventories 331 274 272 279 281
Other Current Assets 334 250 277 291 278
Total CA 942 941 899 856 804
Fixed Assets 1,033 993 943 897 852
Other Non CA 990 1,203 1,457 1,730 2,006
Total Assets 2,965 3,137 3,298 3,483 3,662
Short Term Debt 455 528 517 509 504
Trade Payables 70 81 75 74 78
Other CL 30 30 30 31 31
Total CL 555 640 622 614 613
Long Term Debt 1,108 1,021 961 904 832
Other Non CL 66 64 67 66 67
Total Liabilities 1,730 1,724 1,650 1,584 1,512
Share & APIC 714 714 714 714 714
Retained Earnings 520 698 933 1,184 1,435
Others 1 1 1 1 1
Total Equity 1,235 1,413 1,648 1,899 2,150
Total Liabilities & Equity
2,965 3,137 3,298 3,483 3,662
2018 2019E 2020F 2021F 2022F
Profitability
Gross Margin 10.9% 10.1% 10.6% 10.7% 10.7%
Operating Margin 3.8% 2.8% 3.2% 3.4% 3.5%
EBITDA Margin 12.5% 10.2% 10.6% 10.3% 10.3%
Net Margin 23.3% 18.9% 23.9% 25.6% 25.4%
Liquidity
Current Ratio (x) 1.7 1.5 1.4 1.4 1.3
Solvency
Debt to Equity (x) 1.3 1.1 0.9 0.7 0.6
Debt to Assets (x) 0.5 0.5 0.4 0.4 0.4
Valuation
Price to Earnings (x) 11.0 13.3 10.5 9.7 9.7
Price to Book (x) 2.2 1.9 1.6 1.4 1.3
Key Assumptions
Utilization rate 64.2% 64.7% 65.0% 65.5% 66.0%
Sales Vol Growth
Paper -6.3% 1.4% -0.1% -1.5% 0.1%
Stationery 0.0% 9.4% 1.4% 2.0% 2.0%
Packaging 13.5% 9.2% 0.0% 4.3% 4.2%
Pulp price (USD/ton) 790 610 650 630 630

ZĞƚĂŝů^ĞĐƚŽƌ ŚĂůůĞŶŐŝŶŐ>ĂŶĚƐĐĂƉĞ
EhdZ>
6RFLDO DVVLVWDQFH EXGJHW UHPDLQV DPSOH DOEHLWZLWK D PLQRU JURZWK$VLPSOLHGLQ¶VEXGJHWWKH JRYHUQPHQW VKRZV LWV VXVWDLQ FRPPLWPHQW WRDGGUHVV SRYHUW\ DQG GHYHORSPHQW LVVXHV ZLWK ,'5WQ DOORFDWLRQ IRU VRFLDO DVVLVWDQFH <R<0DMRULW\ RI ZKLFK LV DOORFDWHG WR ZHOIDUH-RULHQWHGSURJUDPVVXFKDVYLOODJHIXQG3.+DQGIRRGVXEVLG\+RZHYHUZHREVHUYHDVKLIWLQWKHJRYHUQPHQW¶VIRFXVLQ WKH FRPLQJ \HDUV WRZDUGV SURPRWLQJ WKH KXPDQFDSLWDOGHYHORSPHQW2QHRIWKHPHDVXUHVLVFDUULHGLQWKH IRUP RI D QRWDEOH ULVH LQ ¶V EXGJHW IRUHGXFDWLRQDQGKHDOWKFDUHSURJUDPVHYLGHQFHGE\LQFUHDVH LQ EXGJHW IRU 1DWLRQDO +HDOWKFDUH $VVLVWDQFHDQG WKH LQWURGXFWLRQ RI .,3 .XOLDK 1DWLRQDO +LJKHU(GXFDWLRQ $VVLVWDQFH DV DQ H[WHQVLRQ RI %LGLNPLVLSURJUDP,QWKHPHDQWLPHWKHLQFUHDVHLQWKHEXGJHWIRUVXEVLG\LVPDLQO\DOORFDWHGWRDQHZSURJUDPDLPHG
LQ D JODQFH :H VWDUWHG ZLWK D KLJKRSWLPLVPIRUFRQVXPSWLRQ-EDVHGVHFWRURQWKHEDFNRIDEXQGDQW VRFLDO DVVLVWDQFH SURJUDPV DQG ELJ HYHQWVWDNLQJ SODFH LQ + OHJLVODWLYH DQG SUHVLGHQWLDOHOHFWLRQ'HVSLWH WKHDIRUHPHQWLRQHGDLGV H[SHFWHG WRHVFDODWH PRQH\ FLUFXODWLRQ DQG ERRVW FRQVXPSWLRQUHWDLOVDOHVIRUVRPHQDPHVXQGHURXUFRYHUDJHVXFKDV(5$$ /33) DQG 5$/6 ZHUH TXLWH VOXJJLVK ZKLOHRWKHUV OLNH $&(6 DQG 0$3, PDQDJHG WR FRQWLQXHUHFRUGLQJDIDYRUDEOHJURZWK:HDUHRIWKHYLHZWKDWUHODWLYHO\ ORZ NH\ FRPPRGLW\ SULFHV VXFK DV FRDO DQGFUXGH SDOP RLO &32 RYHU WKH \HDU FRQWULEXWH WR DVRIWHU SXUFKDVLQJ SRZHU PRVWO\ DIIHFWLQJ PLG WR ORZHQG FRQVXPSWLRQ &RQFXUUHQWO\ FRPSHWLWLRQ LQ ERWKRIIOLQH DQG RQOLQH PDUNHWV UHPDLQHG DJJUHVVLYHFRQWULEXWLQJWRDQRWKHUKHDGZLQG $QWLFLSDWLQJ VXEGXHG GLVFUHWLRQDU\ VSHQGLQJ$IWHUD\HDUIXOORIVWLPXOXVZHH[SHFWWKDWWKHRYHUDOOUHWDLOVHFWRUPLJKW IDFHDVORZGRZQ LQGULYHQE\WKHDEVHQFHRIQDWLRQ-VFDOH IHVWLYHHYHQWV WKH OLPLWHGJURZWK LQVRFLDODVVLVWDQFHSURJUDP¶VEXGJHWDQG WKHSRWHQWLDO ZHDNHQLQJ RI FXVWRPHUV¶ SXUFKDVLQJ SRZHUGXH WR WKH ULVLQJ FRVW RI OLYLQJ 6XEVWDQWLDO KLNHV LQEDVLF QHHGV ZRXOG EH FRPLQJ IURP WKH LQFUHDVLQJ FLJDUHWWH¶V $63V GXH WR D VXUJH LQ H[FLVH WD[ IRUWREDFFR FRPSDQLHV UHYRFDWLRQ RI VXEVLGLHV IRU9$HOHFWULFLW\XVHUVFDWHJRUL]HGDVFDSDEOHDQGKHDOWK LQVXUDQFH %3-6 .HVHKDWDQ SUHPLXPDGMXVWPHQW :H YLHZ WKHVH IDFWRUV WR EH GHWULPHQWDOWRZDUGV KRXVHKROGV¶ FRQVXPSWLRQ FDSDFLW\ HVSHFLDOO\WKRVHZLWKLQWKHPLGGOHWRORZHUFODVVVHJPHQW
6RXUFH0LQLVWU\RI)LQDQFH6LQDUPDV,QYHVWPHQW5HVHDUFK
,QGRQHVLDQJRYHUQPHQW¶VEXGJHWDOORFDWLRQIRUVXEVLG\
119 107 98
154 143125
6767
69
6370
62
-53%
-6%
-5%
30%
-2%
-12%
-60%
-50%
-40%
-30%
-20%
-10%
0%
10%
20%
30%
40%
0
50
100
150
200
250
2015 2016 2017 2018 Outlook 2019 APBN 2020
(in IDR tn)
Energy Non-energy Growth

ZĞƚĂŝů^ĞĐƚŽƌKƵƚůŽŽŬ
(-FRPPHUFH VKRZV QR VLJQV RI VORZLQJ 7RGDWHZH VHH WKDW RQOLQH VDOHV KDYH GHPRQVWUDWHG DVXVWDLQDEOH DQG VWURQJ JURZWK DV H-FRPPHUFH RIIHUVFRQYHQLHQFH RI ILQGLQJ WKH EHVW GHDOV DQG FRPSDULQJSURGXFWV LQ RQO\ IHZ WDSV DZD\ &RPSHWLWLRQ LVHVSHFLDOO\VWHHSHUIRUPLG-HQGUHWDLOHUVFRQVLGHULQJWKHKLJKHVW DSSHWLWH IRU RQOLQH SXUFKDVHV LV ZLWKLQ WKHPLGGOH FODVV VHJPHQW 5HVSRQGLQJ WR WKLV GLVUXSWLRQODWHO\EULFNDQGPRUWDUUHWDLOHUVKDYHVWDUWHGLQYHVWLQJLQEXLOGLQJWKHLURZQRQOLQHSODWIRUPV:HEHOLHYHWKDWVWUHQJWKHQLQJ RPQL-FKDQQHO VWUDWHJ\ DQG H[SDQGLQJRQH¶V SUHVHQFH LQ WKH RQOLQH SODWIRUPV ZRXOG EH YHU\EHQHILFLDO IRUWUDGLWLRQDO UHWDLOHUV WRGHIHQGWKHLUVKDUHDPLGVWHVFDODWLQJWKUHDWVIURPWKHH-FRPPHUFHVHFWRU
:H WRQH GRZQ RXU VWDQFH RQ UHWDLO VHFWRU WR1(875$/ DVZHVHHWKDWDQXPEHURISULFHLQFUHDVHVLQ EDVLF QHHGV ZLOO SXW D VWUDLQ RQ ,QGRQHVLDQV¶GLVSRVDEOH LQFRPH KHQFH QHJDWLYHO\ DIIHFWLQJ UHWDLOQDPHV¶ SHUIRUPDQFHV SULPDULO\ RI WKRVH HQJDJLQJ LQPLG WR ORZHU HQG VHJPHQW :H GR H[SHFW WKDW WKHUHFRYHU\ RI &32 SULFH ZRXOG SURYLGH VRPH LQFHQWLYHVIRUFRQVXPSWLRQDSSHWLWHWKRXJKPLJKWQRWEHHQRXJKWR IXOO\ RIIVHW WKH KLJKHU EDVLF OLYLQJ FRVWV GXH WRFLJDUHWWHVHOHFWULFLW\DQGLQVXUDQFHWDULIIDGMXVWPHQWV:H KDYH D 1(875$/ UDWLQJ IRU 5$/6 DQG /33) JLYHQWKHLUH[SRVXUHWRPLGWRORZFODVVVHJPHQWDQG$&(6DVZHH[SHFWJURZWKWRVORZGRZQLQWKHFRPLQJ\HDUV:KHUHDV ZH IDYRU 0$3, GXH WR LWV UHVLOLHQW WDUJHWPDUNHW DQG H[FLWLQJ H[SDQVLRQ RSSRUWXQLWLHV DQG ZHKDYHDQ$''UDWLQJRQ(5$$DVZHVHHEHWWHURXWORRNRQ WKH EDFN RI WKH XSFRPLQJ EODFN PDUNHW FRQWUROLPSOHPHQWDWLRQ
WRVXSSRUWWKRVH LQWKHMRE-VHHNLQJSHULRG.DUWX3UD-NHUMD ZKLFK ZRXOG EH UROOHG RXW LQ 7KHVHSURJUDPV ZH EHOLHYH ZRXOG EH EHQHILFLDO IRULPSURYLQJ WKHTXDOLW\ RIKXPDQ FDSLWDO WKRXJK LQ WKHVKRUW-UXQLWVVLJQLILFDQFHWRZDUGVZHOIDUHPLJKWQRWEHGLUHFWO\H[SHULHQFHG ([SHFWLQJ PLOG SHUIRUPDQFH IURP PLG WR ORZHUHQG UHWDLOHUV ZKLOH KLJKHU HQG RQHV HQMR\ DUHODWLYHO\ UHVLOLHQW WDUJHW PDUNHW %HLQJ KLJKO\VHQVLWLYH WR GLVFUHWLRQDU\ VSHQGLQJ ZH ILQG WKDW LWZRXOGEHFKDOOHQJLQJIRUUHWDLOHUVZLWKPLGWRORZHUHQGWDUJHW PDUNHW WR DFTXLUH IDYRUDEOH VDOHV JURZWK LQDVZHDUHKHDGLQJLQWRDVHULHVRISULFHLQFUHDVHVZKLFK SRVVLEO\ FDXVH FXVWRPHUV WR FXW EDFN RQ WKHLUUHWDLO H[SHQGLWXUHV +LJKHU HQG SOD\HUV RQ WKH RWKHUKDQGEHQHILW IURPDPRUHVWDEOHSXUFKDVLQJSRZHURIWKHLU FRQVXPHUV EDVH WKRXJK JURZWK PLJKW QR EH DVUREXVWDVLWZDVLQJLYHQWKHKLJKEDVHILJXUHV 3UHVVXUHV RQ PDUJLQ GXH WR FOHDUDQFH DQGSURPRWLRQDO DFWLYLWLHV FRVW FRQWURO EHFRPHV DIRFDO SRLQW 7DSSLQJ LQWR ZH DQWLFLSDWHFRQWLQXLQJ SUHVVXUH RQ PDUJLQV DV D FRQVHTXHQFH RIWKH DJJUHVVLYH H[SDQVLRQ FRQGXFWHG E\PRVW UHWDLOHUVRYHUWKHSDVWIHZ\HDUVZKLFKXVXDOO\FDOOVIRUIUHTXHQWSURPRWLRQDO DFWLYLWLHV +HQFH ZH WKLQN WKDWPHUFKDQGLVLQJ DQG RSHUDWLQJ H[SHQVH PDQDJHPHQWEHFRPH HYHQ PRUH HVVHQWLDO IRU UHWDLO SOD\HUVFRQVLGHULQJ WKHLUQDWXUHRIKLJKRSHUDWLQJ OHYHUDJHRQWRSRIDQQXDOKLNHLQZDJHVDQGUHQWDOFRVWV
6XEWOHUHFRYHU\LQFRPPRGLW\SULFHV$VRQHRIWKHPDLQ HQJLQHV RI ,QGRQHVLD¶V HFRQRP\ ZH QRWLFH WKDWWKHSHUIRUPDQFHRIPDQ\UHWDLOHUVDUHKLJKO\ OLQNHGWRWKRVHRIWKHFRXQWU\¶VNH\FRPPRGLWLHV&32DQGFRDO:KLOH FRDO SULFH UHPDLQV EHQLJQ DQG WKH RXWORRN KDV\HWWRVKRZDQ\VLJQDOIRUDQLPPLQHQWUHFRYHU\&32SULFH KDV VWDUWHG WR UHFRYHU LQ + DQGZH IRUHFDVWWKH LPSURYHPHQWZRXOG OLQJHU LQ:HH[SHFW WKHUHFRYHU\ WR JLYH D KDQG LQ EDFNLQJ SXUFKDVLQJ SRZHUDPLGWKHH[SHFWHGKLJKHUOLYLQJFRVWVLQ
6RXUFH&RPSDQ\GDWD6LQDUPDV,QYHVWPHQW5HVHDUFK
5HWDLOHUVJURVVPDUJLQ
6RXUFH&RPSDQ\GDWD6LQDUPDV,QYHVWPHQW5HVHDUFK
5HWDLO666*<R<
1.4
11.7
13.5
7.0
3.0
5.5
-1.2
3.5
0.5 1.0
3.04.0
8.0
3.0 4.0
6.3
-1.2
2.9
0.5 0
2016 2017 2018 2019E 2020F
ACES LPPF MAPI RALS
7LFNHU 5DWLQJ &3 73 &KJ )<)3(
$&(6 1(875$/
(5$$ $''
/33) 1(875$/
0$3, %8<
5$/6 1(875$/
5HWDLOVHFWRU
(9(%,7'$
-5%
5%
15%
25%
35%
45%
55%
65%
2015 2016 2017 2018 2019E 2020F
ACES ERAA LPPF MAPI RALS
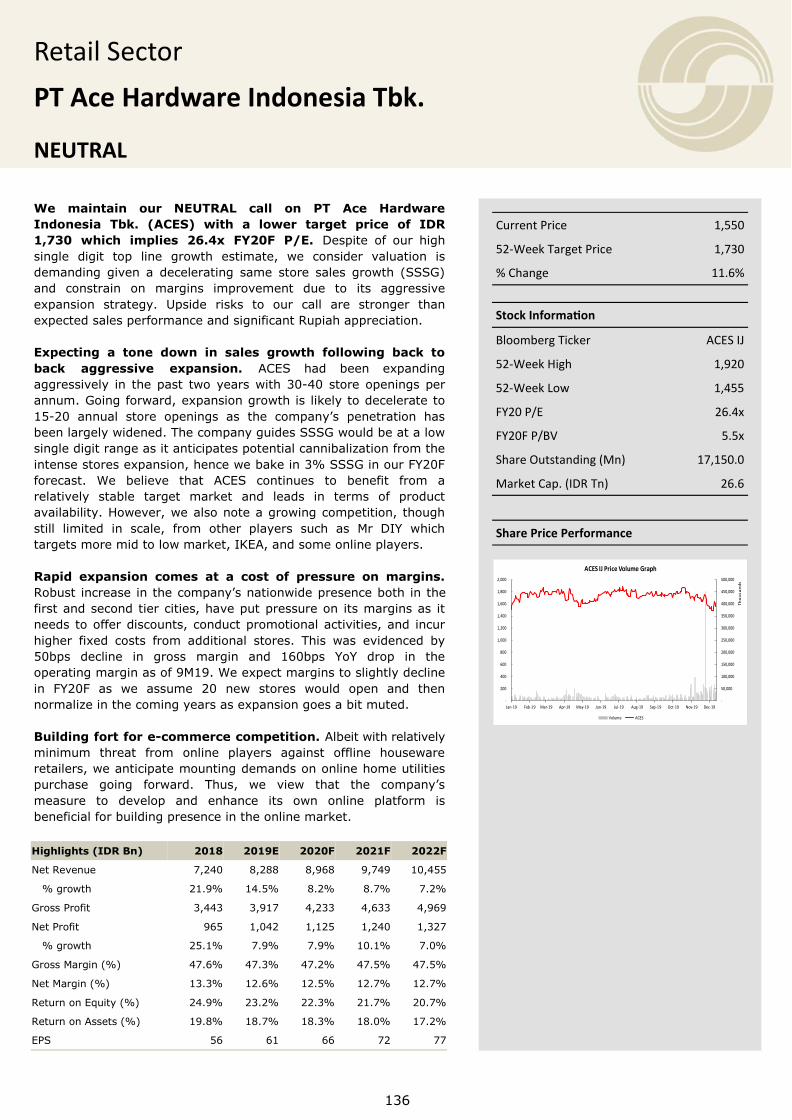
ZĞƚĂŝů^ĞĐƚŽƌ
WdĐĞ,ĂƌĚǁĂƌĞ/ŶĚŽŶĞƐŝĂdďŬ
EhdZ>
:H PDLQWDLQ RXU 1(875$/ FDOO RQ 37 $FH +DUGZDUH,QGRQHVLD 7EN $&(6 ZLWK D ORZHU WDUJHW SULFH RI ,'5 ZKLFK LPSOLHV [ )<) 3( 'HVSLWH RI RXU KLJKVLQJOH GLJLW WRS OLQH JURZWK HVWLPDWH ZH FRQVLGHU YDOXDWLRQ LVGHPDQGLQJ JLYHQ D GHFHOHUDWLQJ VDPH VWRUH VDOHV JURZWK 666*DQG FRQVWUDLQ RQ PDUJLQV LPSURYHPHQW GXH WR LWV DJJUHVVLYHH[SDQVLRQ VWUDWHJ\ 8SVLGH ULVNV WR RXU FDOO DUH VWURQJHU WKDQH[SHFWHGVDOHVSHUIRUPDQFHDQGVLJQLILFDQW5XSLDKDSSUHFLDWLRQ ([SHFWLQJ D WRQH GRZQ LQ VDOHV JURZWK IROORZLQJ EDFN WREDFN DJJUHVVLYH H[SDQVLRQ $&(6 KDG EHHQ H[SDQGLQJDJJUHVVLYHO\ LQ WKHSDVW WZR\HDUVZLWK- VWRUHRSHQLQJVSHUDQQXP*RLQJIRUZDUGH[SDQVLRQJURZWKLV OLNHO\WRGHFHOHUDWHWR- DQQXDO VWRUH RSHQLQJV DV WKH FRPSDQ\¶V SHQHWUDWLRQ KDVEHHQODUJHO\ZLGHQHG7KHFRPSDQ\JXLGHV666*ZRXOGEHDWDORZVLQJOHGLJLWUDQJHDVLWDQWLFLSDWHVSRWHQWLDOFDQQLEDOL]DWLRQIURPWKHLQWHQVHVWRUHVH[SDQVLRQKHQFHZHEDNHLQ666*LQRXU)<)IRUHFDVW :H EHOLHYH WKDW $&(6 FRQWLQXHV WR EHQHILW IURP DUHODWLYHO\ VWDEOH WDUJHW PDUNHW DQG OHDGV LQ WHUPV RI SURGXFWDYDLODELOLW\+RZHYHUZHDOVRQRWHDJURZLQJFRPSHWLWLRQWKRXJKVWLOO OLPLWHG LQ VFDOH IURP RWKHU SOD\HUV VXFK DV 0U ',< ZKLFKWDUJHWVPRUHPLGWRORZPDUNHW,.($DQGVRPHRQOLQHSOD\HUV 5DSLG H[SDQVLRQ FRPHV DW D FRVW RI SUHVVXUH RQ PDUJLQV5REXVWLQFUHDVHLQWKHFRPSDQ\¶VQDWLRQZLGHSUHVHQFHERWKLQWKHILUVWDQGVHFRQGWLHUFLWLHVKDYHSXWSUHVVXUHRQ LWVPDUJLQVDV LWQHHGV WRRIIHUGLVFRXQWVFRQGXFWSURPRWLRQDODFWLYLWLHVDQG LQFXUKLJKHU IL[HG FRVWV IURP DGGLWLRQDO VWRUHV 7KLV ZDV HYLGHQFHG E\ESV GHFOLQH LQ JURVV PDUJLQ DQG ESV <R< GURS LQ WKHRSHUDWLQJPDUJLQDVRI0:HH[SHFWPDUJLQVWRVOLJKWO\GHFOLQHLQ )<) DV ZH DVVXPH QHZ VWRUHV ZRXOG RSHQ DQG WKHQQRUPDOL]HLQWKHFRPLQJ\HDUVDVH[SDQVLRQJRHVDELWPXWHG %XLOGLQJIRUWIRUH-FRPPHUFHFRPSHWLWLRQ$OEHLWZLWKUHODWLYHO\PLQLPXP WKUHDW IURP RQOLQH SOD\HUV DJDLQVW RIIOLQH KRXVHZDUHUHWDLOHUVZHDQWLFLSDWHPRXQWLQJGHPDQGVRQRQOLQHKRPHXWLOLWLHVSXUFKDVH JRLQJ IRUZDUG 7KXV ZH YLHZ WKDW WKH FRPSDQ\¶VPHDVXUH WR GHYHORS DQG HQKDQFH LWV RZQ RQOLQH SODWIRUP LVEHQHILFLDOIRUEXLOGLQJSUHVHQFHLQWKHRQOLQHPDUNHW
^ƚŽĐŬ/ŶĨŽƌŵĂƟŽŶ
ůŽŽŵďĞƌŐdŝĐŬĞƌ ^/:
ϱϮ-tĞĞŬ,ŝŐŚ ϭϵϮϬ
ϱϮ-tĞĞŬ>Žǁ ϭϰϱϱ
&zϮϬW Ϯϲϰdž
&zϮϬ&Ws ϱϱdž
^ŚĂƌĞKƵƚƐƚĂŶĚŝŶŐ;DŶͿ ϭϳϭϱϬϬ
DĂƌŬĞƚĂƉ;/ZdŶͿ Ϯϲϲ
^ŚĂƌĞWƌŝĐĞWĞƌĨŽƌŵĂŶĐĞ
ƵƌƌĞŶƚWƌŝĐĞ ϭϱϱϬ
ϱϮ-tĞĞŬdĂƌŐĞƚWƌŝĐĞ ϭϳϯϬ
йŚĂŶŐĞ ϭϭϲй
+LJKOLJKWV,'5%Q ( ) ) )
1HW5HYHQXH
JURZWK
*URVV3URILW
1HW3URILW
JURZWK
*URVV0DUJLQ
1HW0DUJLQ
5HWXUQRQ(TXLW\
5HWXUQRQ$VVHWV
(36
-
50,000
100,000
150,000
200,000
250,000
300,000
350,000
400,000
450,000
500,000
-
200
400
600
800
1,000
1,200
1,400
1,600
1,800
2,000
Jan-19 Feb-19 Mar-19 Apr-19 May-19 Jun-19 Jul-19 Aug-19 Sep-19 Oct-19 Nov-19 Dec-19
Tho
usa
nd
s
ACES IJ Price Volume Graph
Volume ACES
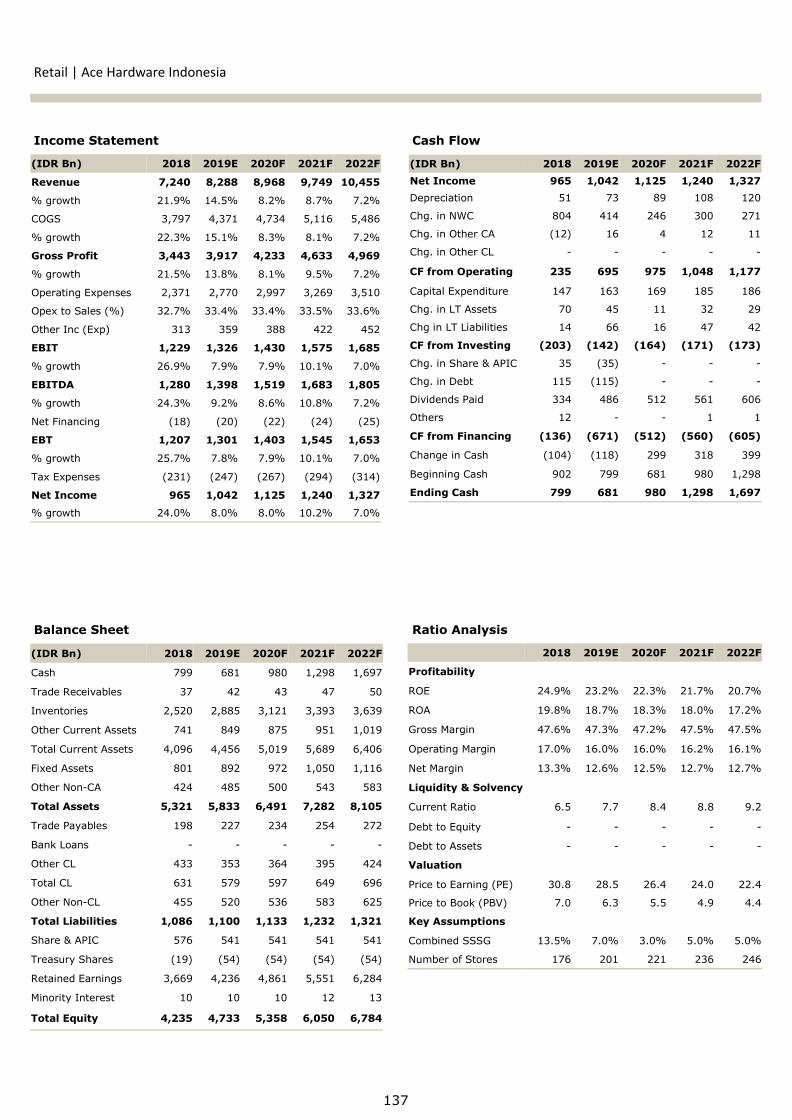
,QFRPH6WDWHPHQW &DVK)ORZ
%DODQFH6KHHW 5DWLR$QDO\VLV
ZĞƚĂŝůĐĞ,ĂƌĚǁĂƌĞ/ŶĚŽŶĞƐŝĂ
,'5%Q ( ) ) )
&DVK
7UDGH5HFHLYDEOHV
,QYHQWRULHV
2WKHU&XUUHQW$VVHWV
7RWDO&XUUHQW$VVHWV
)L[HG$VVHWV
2WKHU1RQ-&$
7RWDO$VVHWV
7UDGH3D\DEOHV
%DQN/RDQV - - - - -
2WKHU&/
7RWDO&/
2WKHU1RQ-&/
7RWDO/LDELOLWLHV
6KDUH$3,&
7UHDVXU\6KDUHV
5HWDLQHG(DUQLQJV
0LQRULW\,QWHUHVW
7RWDO(TXLW\
,'5%Q ( ) ) )
5HYHQXH
JURZWK
&2*6
JURZWK
*URVV3URILW
JURZWK
2SHUDWLQJ([SHQVHV
2SH[WR6DOHV
2WKHU,QF([S
(%,7
JURZWK
(%,7'$
JURZWK
1HW)LQDQFLQJ
(%7
JURZWK
7D[([SHQVHV
1HW,QFRPH
JURZWK
,'5%Q ( ) ) )
1HW,QFRPH
'HSUHFLDWLRQ
&KJLQ1:&
&KJLQ2WKHU&$
&KJLQ2WKHU&/ - - - - -
&)IURP2SHUDWLQJ
&DSLWDO([SHQGLWXUH
&KJLQ/7$VVHWV
&KJLQ/7/LDELOLWLHV
&)IURP,QYHVWLQJ
&KJLQ6KDUH$3,& - - -
&KJLQ'HEW - - -
'LYLGHQGV3DLG
2WKHUV - -
&)IURP)LQDQFLQJ
&KDQJHLQ&DVK
%HJLQQLQJ&DVK
(QGLQJ&DVK
( ) ) )
3URILWDELOLW\
52(
52$
*URVV0DUJLQ
2SHUDWLQJ0DUJLQ
1HW0DUJLQ
/LTXLGLW\6ROYHQF\
&XUUHQW5DWLR
'HEWWR(TXLW\ - - - - -
'HEWWR$VVHWV - - - - -
9DOXDWLRQ
3ULFHWR(DUQLQJ3(
3ULFHWR%RRN3%9
.H\$VVXPSWLRQV
&RPELQHG666*
1XPEHURI6WRUHV

ZĞƚĂŝů^ĞĐƚŽƌ
WdƌĂũĂLJĂ^ǁĂƐĞŵďĂĚĂdďŬ
:HXSJUDGHRXUFDOORQ37(UDMD\D6ZDVHPEDGD7EN(5$$WR$''ZLWKDWDUJHWSULFHRI,'5ZKLFKLPSOLHV[)<) 3( DV ZH H[SHFW D UHERXQG RQ WKH FRPSDQ\¶V VDOHVYROXPH VXSSRUWHGE\ VXEVLGLQJ WKUHDW IURPEODFNPDUNHW DV ,0(,FRQWURO LPSOHPHQWDWLRQ WDNHV SODFH 5LVNV WR RXU FDOO GHOD\ DQGORRVH,0(,FRQWUROLPSOHPHQWDWLRQZHDNVPDUWSKRQHGHPDQGV 9HQWXULQJ LQWR D QHZ HUD RI EODFN PDUNHW FRQWURO 7KHLQWHQVLI\LQJ WKUHDW IURP EODFN PDUNHW LQ WKH SDVW IHZ \HDUVHVSHFLDOO\IRU$SSOHDQG;LDRPLEUDQGVDVZHOODVDORZHUVSHQGLQJDSSHWLWH IRU D QHZ VPDUWSKRQH KDYH FDXVHG SKRQH UHWDLOHUVEXVLQHVV ODQGVFDSH WR VXIIHU VLQFH ODWH $V RI 0 (5$$H[SHULHQFHG <R< GHFOLQH LQ LWV VDOHV YROXPH ZKLOH $63PDQDJHG WR ULVHE\<R<:KLOH WKHUH LVDQRQ-JRLQJGHEDWHDURXQG WKHSDUWLHV UHVSRQVLEOH IRU EHDULQJ WKH FRVWV ,0(, FRQWUROLPSOHPHQWDWLRQLVH[SHFWHGWREHLQHIIHFWLQ$SULO6KRXOGWKHUHJXODWLRQEHLQJHQIRUFHGVWULFWO\DQGFRQVLVWHQWO\ZHEHOLHYHWKLVZRXOGEHDEUHDWKRIIUHVKDLUIRURIILFLDOSKRQHUHWDLOHUVDVLWZRXOGPLQLPL]HWKHGLVWULEXWLRQRILOOHJDOSKRQHV +HDOWKLHU ILQDQFLDO SHUIRUPDQFH (5$$¶V SURILWDELOLW\ ZDVVHYHUHO\KXUWLQDVDUHVXOWRIDZHDNVDOHVYROXPHWKHFOHDUDQFHRIDJLQJLQYHQWRULHVDQGDVLJQLILFDQWLQFUHDVHLQIL[HGFRVWVIURPQHZVWRUHRSHQLQJV*RLQJLQWRZHDVVXPHDJURZWK LQ ERWK YROXPH DQG $63 DV ZH DUH VHHLQJ WKH XSFRPLQJLOOHJDO SKRQH VDOHV FRQWURO VKRXOG HQDEOH WKH FRPSDQ\ WR HQMR\ DKLJKHUGHPDQGIRURIILFLDOSKRQHVEHWWHUPRQHWL]HLWVQHZRXWOHWVDQGPLQLPL]HFOHDUDQFH:HDOVRVHHDORZHUILQDQFLDOEXUGHQIURPZRUNLQJ FDSLWDO DV (5$$ LV QR ORQJHU UHVSRQVLEOH IRU LPSRUWLQJVSDUHSDUWVIRU;LDRPLSURGXFWV *URZLQJ FRQWULEXWLRQ IURP KLJKHU PDUJLQ VHJPHQWV $V DUHVXOWRI WKHJURZLQJ LPSRUWDQFHRIJDGJHWV LQRXUGDLO\ OLYHVZHREVHUYH (5$$¶V DFFHVVRULHV DQG RWKHU HOHFWURQLF GLYLVLRQV WRFRQWLQXRXVO\JURZZLWKDGRXEOHGLJLWUDWHDQGLPSURYHLQPDUJLQ7KRXJK DFFRXQWLQJ IRU VPDOO SRUWLRQ RI UHYHQXH a RI QHWVDOHVZH H[SHFW WKH FRPSDQ\ WR VHH D KLJKHU FRQWULEXWLRQ IURPWKHVHWZREXVLQHVVHVJLYHQWKHULVLQJWUHQGDQGQHHGVIRUSURGXFWVVXFKDVZHDUDEOHGHYLFHDQGJDGJHWSURWHFWRU
^ƚŽĐŬ/ŶĨŽƌŵĂƟŽŶ
ůŽŽŵďĞƌŐdŝĐŬĞƌ Z/:
ϱϮ-tĞĞŬ,ŝŐŚ ϮϱϵϬ
ϱϮ-tĞĞŬ>Žǁ ϵϲϱ
&zϮϬ&W ϭϭϵdž
&zϮϬ&Ws ϭϭdž
^ŚĂƌĞKƵƚƐƚĂŶĚŝŶŐ;DŶͿ ϯϭϵϬϬ
DĂƌŬĞƚĂƉ;/ZdŶͿ ϲϬ
^ŚĂƌĞWƌŝĐĞWĞƌĨŽƌŵĂŶĐĞ
ƵƌƌĞŶƚWƌŝĐĞ ϭϲϮϱ
ϱϮ-tĞĞŬdĂƌŐĞƚWƌŝĐĞ ϭϴϳϬ
йŚĂŶŐĞ ϭϱϭй
+LJKOLJKWV,'5%Q ( ) ) )
1HW5HYHQXH
JURZWK -
*URVV3URILW
1HW3URILW
JURZWK -
*URVV0DUJLQ
1HW0DUJLQ
5HWXUQRQ(TXLW\
5HWXUQRQ$VVHWV
(36

,QFRPH6WDWHPHQW &DVK)ORZ
%DODQFH6KHHW 5DWLR$QDO\VLV
ZĞƚĂŝůƌĂũĂLJĂ^ǁĂƐĞŵďĂĚĂ
,'5%Q ( ) ) )
&DVK
7UDGH5HFHLYDEOHV
,QYHQWRULHV
2WKHU&XUUHQW$VVHWV
7RWDO&XUUHQW$VVHWV
)L[HG$VVHWV
2WKHU1RQ-&$
7RWDO$VVHWV
7UDGH3D\DEOHV
67%DQN/RDQV
2WKHU&/
7RWDO&/
2WKHU1RQ-&/
7RWDO/LDELOLWLHV
6KDUH$3,&
5HWDLQHG(DUQLQJV
0LQRULW\,QWHUHVW
2WKHU(TXLW\
7RWDO(TXLW\
,'5%Q ( ) ) )
5HYHQXH
JURZWK -
&2*6
JURZWK -
*URVV3URILW
JURZWK -
2SHUDWLQJ([SHQVHV
2SH[WR6DOHV
2WKHU,QF([S
(%,7
JURZWK -
(%,7'$
JURZWK -
1HW)LQDQFLQJ
(%7
JURZWK -
7D[([SHQVHV
1HW,QFRPH
JURZWK -
,'5%Q ( ) ) )
1HW,QFRPH
'HSUHFLDWLRQ
&KJLQ1:&
&KJLQ2WKHU&$
&KJLQ2WKHU&/
&)IURP2SHUDWLQJ
&DSLWDO([SHQGLWXUH
&KJLQ/7$VVHWV
&KJLQ/7/LDELOLWLHV
&)IURP,QYHVWLQJ
'LYLGHQGV3DLG
&KJLQ'HEW
6KDUH&DSLWDO$3,& - - - -
2WKHUV - - - -
&)IURP)LQDQFLQJ
&KDQJHLQ&DVK
%HJLQQLQJ&DVK
(QGLQJ&DVK
( ) ) )
3URILWDELOLW\
52(
52$
1HW0DUJLQ
/LTXLGLW\6ROYHQF\
&XUUHQW5DWLR
'HEWWR(TXLW\
'HEWWR$VVHWV
,QWHUHVW&RYHUDJH
9DOXDWLRQ 3ULFHWR(DUQLQJ3(
3ULFHWR%RRN3%9
.H\$VVXPSWLRQV
$63*URZWK
9ROXPH*URZWK -
1XPEHURI6WRUHV
*URVV0DUJLQ
2SHUDWLQJ0DUJLQ

ZĞƚĂŝů^ĞĐƚŽƌ
WdDĂƚĂŚĂƌŝĞƉĂƌƚŵĞŶƚ^ƚŽƌĞdďŬ
EhdZ>
:HPDLQWDLQRXU1(875$/UHFRPPHQGDWLRQRQ370DWDKDUL'HSDUWPHQW 6WRUH 7EN /33)ZLWK D ORZHU WDUJHW SULFH RI,'5ZKLFK LPSOLHV[)<)3(:HFRQWLQXHVHHLQJDFKDOOHQJLQJHQYLURQPHQW IRU WKHFRPSDQ\JLYHQ WKH ULVLQJFRVWVIRU EDVLF QHHGV LQFUHDVLQJ RYHUKHDGV DQG RQOLQH FRPSHWLWLRQZKLFKSURYLGHDGLVUXSWLRQWR/33)¶VWDUJHWPDUNHW8SVLGHULVNVWRRXU FDOO VWURQJHU WKDQ H[SHFWHG PLG HQG SXUFKDVLQJ SRZHU DQGVXFFHVVIXOEUDQGSDUWQHUVKLSV 6WULYLQJ IRU VDOHV ERRVWHUV 7KHFRPSDQ\¶VVWUXJJOHWRJHQHUDWHVDOHVZDVHYLGHQFHGE\DVRIW VDOHVYROXPHGHVSLWH WKH LQYHQWRU\FOHDUDQFH WKDW LW FRQGXFWHG WKURXJKRXW 6DPH VWRUH VDOHVJURZWK FRQWLQXHG WR GHFHOHUDWH ZKLOH PDUJLQV ZHUH FRPSUHVVHGGXHWRFOHDUDQFHDVLWVHHNVWRSURYLGHVSDFHVIRUQHZEUDQGV7KHFRQGLWLRQ PLJKW JHW HYHQ WRXJKHU LQ DV ZH VHH PLQLPXPFDWDO\VWIRUPLGWRORZFRQVXPSWLRQ+HQFHZHEDNHLQ666*DVVXPSWLRQIRURXU)<)IRUHFDVW &RXQWLQJ RQ H[FOXVLYH EUDQG SDUWQHUVKLSV ,Q DQ HIIRUW WRFRXQWHUWKHZHDNWUHQGWKHFRPSDQ\DLPVWRH[SDQGLWVH[FOXVLYHEUDQGV VXFK DV DQG 296 E\ RSHQLQJ QHZ VSHFLDOW\ VWRUHVGHVLJQDWHG IRU WKHVH WZR EUDQGV ERWK LQ *UHDWHU -DNDUWD DQGRXWVLGH -DNDUWD DUHD 6LPXOWDQHRXVO\ WKH FRPSDQ\ NHHSV RQH[SORULQJVRPHRWKHUSRWHQWLDOH[FOXVLYHEUDQGVSDUWQHUVKLS7KHVHUROORXWV KRZHYHU KDYH \HW WR WUDQVODWH LQWR VLJQLILFDQW VDOHVFRQWULEXWLRQ DV WKH EUDQGV KDYH \HW WR JDLQ IDPH DPRQJVW,QGRQHVLDQV 0RUHRYHU FRQVLGHULQJ WKH FURZGHG IDVKLRQ PDUNHWGLPLQLVKLQJLQWHUHVWLQGHSDUWPHQWVWRUHVDQGUREXVWH[SDQVLRQRQPLG WR KLJK VSHFLDOW\ VWRUHV E\ FRPSHWLWRUV ZH WKLQN WKDW WKHFRPSDQ\ ZRXOG QHHG WR VSHQGPRUH RQ SURPRWLRQDO DFWLYLWLHV WRLQWURGXFHWKHEUDQG &RPSHWLQJ IRU WUDIILF ZLWK H-FRPPHUFH $VDPHDQ WR FRSHZLWKWKHWHQVHRQOLQHFRPSHWLWLRQFRPSDQ\ LQFUHDVHV LWV IRFXVRQUH-EXLOGLQJ PDWDKDULFRP SODWIRUP E\ WU\LQJ WR OHYHO XS LWVDGYHUWLVLQJ DQG SURPRWLRQDO DFWLYLWLHV DQG OHYHUDJLQJ RQ LWVH[FOXVLYH EUDQGV RZQHUVKLS 7KDW EHLQJ VDLG ZH KDYH \HW WR VHHDQ\ VLJQLILFDQW LPSURYHPHQW IURP WKH RQOLQH FRQWULEXWLRQ RQ WKHEDFNRIWLJKWFRPSHWLWLRQRQDSSDUHORQOLQHPDUNHW
^ƚŽĐŬ/ŶĨŽƌŵĂƟŽŶ
ůŽŽŵďĞƌŐdŝĐŬĞƌ >WW&/:
ϱϮ-tĞĞŬ,ŝŐŚ ϳϯϮϱ
ϱϮ-tĞĞŬ>Žǁ ϮϵϰϬ
&zϮϬ&W ϴϰdž
&zϮϬ&Ws ϰϯdž
^ŚĂƌĞKƵƚƐƚĂŶĚŝŶŐ;DŶͿ ϮϴϬϰϵ
DĂƌŬĞƚĂƉ;/ZdŶͿ ϭϬϰ
^ŚĂƌĞWƌŝĐĞWĞƌĨŽƌŵĂŶĐĞ
ƵƌƌĞŶƚWƌŝĐĞ ϯϳϬϬ
ϱϮ-tĞĞŬdĂƌŐĞƚWƌŝĐĞ ϰϬϯϬ
йŚĂŶŐĞ ϴϵй
+LJKOLJKWV,'5%Q ( ) ) )
1HW5HYHQXH
JURZWK
*URVV3URILW
1HW3URILW
JURZWK - - - -
*URVV0DUJLQ
1HW0DUJLQ
5HWXUQRQ(TXLW\
5HWXUQRQ$VVHWV
(36
-
20,000
40,000
60,000
80,000
100,000
120,000
140,000
160,000
180,000
-
1,000
2,000
3,000
4,000
5,000
6,000
7,000
8,000
Jan-19 Feb-19 Mar-19 Apr-19 May-19 Jun-19 Jul-19 Aug-19 Sep-19 Oct-19 Nov-19 Dec-19
Tho
usa
nd
s
LPPF IJ Price Volume Graph
Volume LPPF

,QFRPH6WDWHPHQW &DVK)ORZ
%DODQFH6KHHW 5DWLR$QDO\VLV
ZĞƚĂŝůDĂƚĂŚĂƌŝĞƉĂƌƚŵĞŶƚ^ƚŽƌĞ
,'5%Q ( ) ) )
&DVK
7UDGH5HFHLYDEOHV
,QYHQWRULHV
2WKHU&XUUHQW$VVHWV
7RWDO&XUUHQW$VVHWV
)L[HG$VVHWV
2WKHU1RQ-&$
7RWDO$VVHWV
7UDGH3D\DEOHV
%DQN/RDQV - - - - -
2WKHU&/
7RWDO&/
2WKHU1RQ-&/
7RWDO/LDELOLWLHV
6KDUH$3,&
5HWDLQHG(DUQLQJV
0LQRULW\,QWHUHVW - - - - -
2WKHU(TXLW\
7RWDO(TXLW\
,'5%Q ( ) ) )
5HYHQXH
JURZWK
&2*6
JURZWK - -
*URVV3URILW
JURZWK -
2SHUDWLQJ([SHQVHV
2SH[WR6DOHV
2WKHU,QF([S
(%,7
JURZWK - - - -
(%,7'$
JURZWK - - - -
1HW)LQDQFLQJ
(%7
JURZWK - - - -
7D[([SHQVHV
1HW,QFRPH
JURZWK - - - -
,'5%Q ( ) ) )
1HW,QFRPH
'HSUHFLDWLRQ
&KJLQ1:&
&KJLQ2WKHU&$
&KJLQ2WKHU&/
&)IURP2SHUDWLQJ
&DSLWDO([SHQGLWXUH
&KJLQ/7$VVHWV
&KJLQ/7/LDELOLWLHV
&)IURP,QYHVWLQJ
&KJLQ6KDUH$3,& - - - - -
&KJLQ'HEW - - - - -
'LYLGHQGV3DLG
2WKHUV - - - -
&)IURP)LQDQFLQJ
&KDQJHLQ&DVK
%HJLQQLQJ&DVK
(QGLQJ&DVK
( ) ) )
3URILWDELOLW\
52(
52$
*URVV0DUJLQ
2SHUDWLQJ0DUJLQ
1HW0DUJLQ
/LTXLGLW\6ROYHQF\
&XUUHQW5DWLR
'HEWWR(TXLW\ - - - - -
'HEWWR$VVHWV - - - - -
9DOXDWLRQ
3ULFHWR(DUQLQJ3(
3ULFHWR%RRN3%9
.H\$VVXPSWLRQV
&RPELQHG666*
1XPEHURI6WRUHV

ZĞƚĂŝů^ĞĐƚŽƌ
WdDŝƚƌĂĚŝƉĞƌŬĂƐĂdďŬ
hz
:H PDLQWDLQ RXU %8< UHFRPPHQGDWLRQ RQ 37 0LWUD$GLSHUNDVD7EN0$3,ZLWKDKLJKHU73RI,'5ZKLFKLPSOLHV [ )<) (9(%,7'$:HYLHZWKDWRXWORRNUHPDLQVDWWUDFWLYH IRU WKH FRPSDQ\DV LWPDLQWDLQV LWV IRFXVRQH[SDQVLRQPRGH ZLWK N DGGLWLRQDO UHWDLO VSDFH ZLWKLQ LWV SLSHOLQH DQG LVVXSSRUWHG E\ D UHODWLYHO\ UHVLOLHQW WDUJHW PDUNHW DV ZHOO DVH[WHQVLYH EUDQGV SRUWIROLR 5LVNV WR RXU FDOO ZHDN WUDIILF SRRUH[SDQVLRQH[HFXWLRQDQGVWURQJHUWKDQH[SHFWHGFRPSHWLWLRQ ([FLWLQJ SHUIRUPDQFH IURP DFWLYH GLYLVLRQ 1RZDGD\VIDVKLRQDEOH VSRUWVZHDU KDV SURYHQ WR EH UHPDUNDEO\ SRSXODUDPRQJVW ,QGRQHVLDQV DV LWV XVDJH LV QR ORQJHU OLPLWHG WR LWVIXQFWLRQDOLW\EXWDOVREHFRPHVDSDUWRIIDVKLRQ%HLQJWKHODUJHVWVSRUWVZHDUUHWDLOHU0$3,EHQHILWV IURPWKH LQFUHDVLQJGHPDQG IRUVW\OLVKVSRUWFORWKLQJ*RLQJLQWRZHVHHWKHRSSRUWXQLW\IRU0$3,¶V DFWLYH GLYLVLRQ WR SHUIRUPZHOO DV WKH WUHQG SHUVLVWV ZKLOHUHODWLYHO\ OLPLWHGSUHVHQFH LQVHFRQGWLHUFLWLHVSURYLGHVURRPV IRUH[SDQVLRQ &RQWHQGLQJ ZLWKLQ FURZGHG IDVKLRQ DQG )% LQGXVWU\ :HH[SHFW 0$3,¶V )% VHJPHQW WR VOLJKWO\ XQGHUSHUIRUP LWV RWKHUEXVLQHVVHV GXH WR DJJUHVVLYH FRPSHWLWLRQ IURP 9& EDFNHG FRIIHHFKDLQVZKLFK RIIHU H[WHQVLYH GLVFRXQWV DQG H[SDQG LQ H[SRQHQWLDOUDWH:KLOHZHDVVXPHPRGHVWJURZWKIURP0$3,¶VGHSWVWRUHDQGIDVKLRQGLYLVLRQVZHDUHSRVLWLYHZLWKWKHFRPSDQ\¶VPHDVXUHVWRHQKDQFH RPQL-FKDQQHO VWUDWHJ\ WR KHOS LQ RIIVHWWLQJ LQFUHDVLQJFRPSHWLWLRQIURPPLGWRKLJKRQOLQHDQGRIIOLQHIDVKLRQSOD\HUV7KHFRPSDQ\ DOVR FORVHO\ PRQLWRUV PRUH RSSRUWXQLWLHV WR WDS LQWR$6($1PDUNHWWKURXJKLWVIDVKLRQDQGDFWLYHEUDQGV 7DSSLQJ LQWR QHZ VHJPHQWV ,QODWH0$3,DFTXLUHGVRPHRI,QILQLWHRXWOHWVDQDXWKRUL]HG$SSOHUHVHOOHUDQGWKHQUHEUDQGHGWKHVWRUHVXQGHU'LJLPDSWRULGHDORQJWKHVPDUWSKRQHSRSXODULW\DVLWEHFRPHVPRUHLQWHJUDOWRWKHVRFLHW\,QDGGLWLRQWR'LJLPDSWKHFRPSDQ\DLPVWR IXUWKHUSHQHWUDWH LQWRRQHRI WKHPRVW IDVW-JURZLQJ UHWDLO VHJPHQW KHDOWK DQG EHDXW\ E\ SDUWQHULQJ ZLWK:DOPDUW¶V %RRVW ZKRVH VWRUH RSHQLQJV DUH H[SHFWHG WR EH UROOHGRXW LQ+%RRVWZRXOG FRPSOHPHQW0$3,¶V H[LVWLQJKHDOWKDQGEHDXW\EXVLQHVVZKLFK FDWHUVKLJKHU HQG VHJPHQW6HSKRUD DV LWIHDWXUHVDPLGGOHWLHUORFDODQGLQWHUQDWLRQDOEUDQGV
^ƚŽĐŬ/ŶĨŽƌŵĂƟŽŶ
ůŽŽŵďĞƌŐdŝĐŬĞƌ DW//:
ϱϮ-tĞĞŬ,ŝŐŚ ϭϭϴϱ
ϱϮ-tĞĞŬ>Žǁ ϳϲϱ
&zϮϬ&W ϮϬϬdž
&zϮϬ&Ws Ϯϲdž
^ŚĂƌĞKƵƚƐƚĂŶĚŝŶŐ;DŶͿ ϭϲϲϬϬϬ
DĂƌŬĞƚĂƉ;/ZdŶͿ ϭϳϭ
^ŚĂƌĞWƌŝĐĞWĞƌĨŽƌŵĂŶĐĞ
ƵƌƌĞŶƚWƌŝĐĞ ϭϬϯϬ
ϱϮ-tĞĞŬdĂƌŐĞƚWƌŝĐĞ ϭϯϬϬ
йŚĂŶŐĞ ϮϲϮй
+LJKOLJKWV,'5%Q ( ) ) )
1HW5HYHQXH
JURZWK
*URVV3URILW
1HW3URILW
JURZWK
*URVV0DUJLQ
1HW0DUJLQ
5HWXUQRQ(TXLW\
5HWXUQRQ$VVHWV
(36
-
10,000
20,000
30,000
40,000
50,000
60,000
70,000
80,000
90,000
-
200
400
600
800
1,000
1,200
1,400
Jan-19 Feb-19 Mar-19 Apr-19 May-19 Jun-19 Jul-19 Aug-19 Sep-19 Oct-19 Nov-19 Dec-19
Tho
usa
nd
s
MAPI IJ Price Volume Graph
Volume MAPI

,QFRPH6WDWHPHQW &DVK)ORZ
%DODQFH6KHHW 5DWLR$QDO\VLV
ZĞƚĂŝůDŝƚƌĂĚŝƉĞƌŬĂƐĂ
,'5%Q ( ) ) )
&DVK
7UDGH5HFHLYDEOHV
,QYHQWRULHV
2WKHU&XUUHQW$VVHWV
7RWDO&XUUHQW$VVHWV
)L[HG$VVHWV
2WKHU1RQ-&/
7RWDO$VVHWV
7UDGH3D\DEOHV
67%DQN/RDQV
2WKHU67/LDELOLWLHV - - - -
7RWDO&/
/7%DQN/RDQV - -
2WKHU/7/LDELOLWLHV
7RWDO/LDELOLWLHV
6KDUH$3,&
5HWDLQHG(DUQLQJV
2WKHU(TXLW\
7RWDO(TXLW\
,'5%Q ( ) ) )
5HYHQXH
JURZWK
&2*6
JURZWK
*URVV3URILW
JURZWK
2SHUDWLQJ([SHQVHV
2SH[WR6DOHV
2WKHU,QF([S
(%,7
JURZWK
(%,7'$
JURZWK
1HW)LQDQFLQJ
(%7
JURZWK
7D[([SHQVHV
1HW,QFRPH
JURZWK
,'5%Q ( ) ) )
1HW,QFRPH
'HSUHFLDWLRQ
&KJLQ1:&
&KJLQ2WKHU&$
&KJLQ2WKHU&/
&)IURP2SHUDWLQJ
&DSLWDO([SHQGLWXUH
&KJLQ/7$VVHWV
&KJLQ/7/LDELOLWLHV
&)IURP,QYHVWLQJ
&KJLQ6KDUH$3,& - - - - -
&KJLQ'HEW
'LYLGHQGV3DLG
2WKHUV - - - -
&)IURP)LQDQFLQJ
&KDQJHLQ&DVK
%HJLQQLQJ&DVK
(QGLQJ&DVK
( ) ) )
3URILWDELOLW\
52(
52$
*URVV0DUJLQ
2SHUDWLQJ0DUJLQ
1HW0DUJLQ
/LTXLGLW\6ROYHQF\
&XUUHQW5DWLR
'HEWWR(TXLW\
'HEWWR$VVHWV
,QWHUHVW&RYHUDJH
9DOXDWLRQ 3ULFHWR(DUQLQJ3(
3ULFHWR%RRN3%9
(9(%,7'$
.H\$VVXPSWLRQV
&RPELQHG666*
1XPEHURI6WRUHV

ZĞƚĂŝů^ĞĐƚŽƌ
WdZĂŵĂLJĂŶĂ>ĞƐƚĂƌŝ^ĞŶƚŽƐĂdďŬ
EhdZ>
:H ORZHU RXU UHFRPPHQGDWLRQ RQ 37 5DPD\DQD /HVWDUL6HQWRVD 7EN 5$/6 WR 1(875$/ ZLWK WDUJHW SULFH RI ,'5ZKLFK LPSOLHV)<)3(RI['HVSLWHWKHIDFWWKDWYDOXDWLRQKDV WXUQHGXQGHPDQGLQJZHDUHRI WKHYLHZ WKDWPLJKW QRW EH LQ IDYRXU RI 5$/6¶ WDUJHW PDUNHW FRQVLGHULQJ WKHSRWHQWLDO SULFH KLNHV RQ VRPH HVVHQWLDO EDVLF QHHGV LQFOXGLQJFLJDUHWWHV HOHFWULFLW\ DQG KHDOWKFDUH 8SVLGH ULVNV WR RXU FDOOVWURQJHU WKDQ H[SHFWHG ORZHU HQG SXUFKDVLQJ SRZHU VLJQLILFDQWFRVW-FXWWLQJDQGPDUJLQVLPSURYHPHQW 4XLFN WDNHRQ'HVSLWHWKHRSWLPLVPSXWXSRQWKHFRPSDQ\LQRQWKHEDFNRIDEXQGDQWVRFLDOVXSSRUWWKHFRPSDQ\ZDVQRWDEOHWRJHQHUDWHDVPXFKJURZWKDVLWKDGH[SHFWHG$PRGHVWSXUFKDVLQJ SRZHU RI ORZHU HQG FXVWRPHUV GULYHQ E\ VOXJJLVKFRPPRGLWLHVSULFHV UHVXOWHG LQ IODWWLVK VDOHV UHDGLQJVDVRI 0:KHUHDV QHW LQFRPH JUHZ E\ <R< DV LW ZDV GULYHQ E\ QRQRSHUDWLRQDO LWHPV D KLJKHU ILQDQFH LQFRPH <R< DQG DORZHUWD[UDWH 8QVXSSRUWLYHPDFURFRQGLWLRQ+HDGLQJLQWRZHWKLQNWKDWWKHUHDUHPDQ\XSFRPLQJSUHVVXUHVRQ5$/6¶VDOHVSHUIRUPDQFHDVZHWDNH LQWRDFFRXQWKLJKHUEDVLFQHHGVDQGXWLOLWLHVSULFHVZKLFKWHQGWRGDPSHQWKHSXUFKDVLQJSRZHURIPLGWRORZFODVVVHJPHQWWKH PRVW +HQFH ZH DUH EHLQJ FRQVHUYDWLYH ZLWK RXU 666*DVVXPSWLRQ DV ZH EDNH LQ IODW JURZWK LQ RXU )<) IRUHFDVW:HWKLQN WKDW WKH FRPSDQ\ ZRXOG EH IRUFHG WR UHO\ RQ FRVW FXWWLQJVWUDWHJ\WRVXSSRUWLWVERWWRP-OLQH¶VJURZWK &RXQWLQJ RQPDUJLQV H[SDQVLRQ 5$/6KDVVHHQPDUJLQRQWKHJURVVOHYHOH[SDQGHGZLGHO\LQWKHSDVWIHZ\HDUVRQWKHEDFNRIDQLPSURYLQJSURGXFWPL[EHWWHUSULFLQJSROLF\DVZHOODVWKHFORVXUHVDQGGRZQVL]LQJIRUXQGHUSHUIRUPHGVWRUHV:HH[SHFWWKHFRPSDQ\WR FRQWLQXH VHHNLQJ FRVW-FXWWLQJ VWUDWHJ\ DQG LPSURYLQJ PDUJLQVWKURXJK HQKDQFLQJ SXUFKDVH SODQQLQJ DQG UHQWLQJ RXW DYDLODEOHVSDFHV WR PHUFKDQWV VXFK DV ;;, FLQHPD DQG )% RXWOHWV+RZHYHUZHDUHVHHLQJ OLPLWHGURRPV IRU WKHFRPSDQ\WRUHGXFHFRVWVDQGOLIWPDUJLQVJRLQJIRUZDUGPLJKWEHOLPLWHGDVPRVWRIWKHNH\VWUDWHJLHVDQGPDMRUGRZQVL]LQJKDYHWDNHQSODFH
^ƚŽĐŬ/ŶĨŽƌŵĂƟŽŶ
ůŽŽŵďĞƌŐdŝĐŬĞƌ Z>^/:
ϱϮ-tĞĞŬ,ŝŐŚ ϭϴϳϱ
ϱϮ-tĞĞŬ>Žǁ ϵϮϱ
&zϮϬ&W ϭϭϳdž
&zϮϬ&Ws Ϯϭdž
^ŚĂƌĞKƵƚƐƚĂŶĚŝŶŐ;DŶͿ ϳϬϵϲϬ
DĂƌŬĞƚĂƉ;/ZdŶͿ ϳϯ
^ŚĂƌĞWƌŝĐĞWĞƌĨŽƌŵĂŶĐĞ
ƵƌƌĞŶƚWƌŝĐĞ ϭϬϯϱ
ϱϮ-tĞĞŬdĂƌŐĞƚWƌŝĐĞ ϭϬϵϬ
йŚĂŶŐĞ ϱϮй
+LJKOLJKWV,'5%Q ( ) ) )
1HW5HYHQXH
JURZWK
*URVV3URILW
1HW3URILW
JURZWK
*URVV0DUJLQ
1HW0DUJLQ
5HWXUQRQ(TXLW\
5HWXUQRQ$VVHWV
(36
-
5,000
10,000
15,000
20,000
25,000
30,000
35,000
40,000
-
200
400
600
800
1,000
1,200
1,400
1,600
1,800
2,000
Jan-19 Feb-19 Mar-19 Apr-19 May-19 Jun-19 Jul-19 Aug-19 Sep-19 Oct-19 Nov-19 Dec-19
Tho
usa
nd
s
RALS IJ Price Volume Graph
Volume RALS

,QFRPH6WDWHPHQW &DVK)ORZ
%DODQFH6KHHW 5DWLR$QDO\VLV
ZĞƚĂŝůZĂŵĂLJĂŶĂ>ĞƐƚĂƌŝ^ĞŶƚŽƐĂ
,'5%Q ( ) ) )
&DVK
7UDGH5HFHLYDEOHV
,QYHQWRULHV
2WKHU&XUUHQW$VVHWV
7RWDO&XUUHQW$VVHWV
)L[HG$VVHWV
2WKHU1RQ-&$
7RWDO$VVHWV
7UDGH3D\DEOHV
2WKHU&/
7RWDO&/
2WKHU1RQ-&/
7RWDO/LDELOLWLHV
6KDUH$3,&
7UHDVXU\6KDUHV
5HWDLQHG(DUQLQJV
2WKHU(TXLW\
7RWDO(TXLW\
,'5%Q ( ) ) )
5HYHQXH
JURZWK
&2*6
JURZWK - -
*URVV3URILW
JURZWK
2SHUDWLQJ([SHQVHV
2SH[WR6DOHV
2WKHU,QF([S
(%,7
JURZWK -
(%,7'$
JURZWK -
1HW)LQDQFLQJ
(%7
JURZWK -
7D[([SHQVHV
1HW,QFRPH
JURZWK
,'5%Q ( ) ) )
1HW,QFRPH
'HSUHFLDWLRQ
&KJLQ1:&
&KJLQ2WKHU&$
&)IURP2SHUDWLQJ
&DSLWDO([SHQGLWXUH
&KJLQ/7$VVHWV
&KJLQ/7/LDELOLWLHV
&)IURP,QYHVWLQJ
&KJLQ6KDUH$3,& - - - - -
'LYLGHQGV3DLG
2WKHUV - - -
&)IURP)LQDQFLQJ
&KDQJHLQ&DVK
%HJLQQLQJ&DVK
(QGLQJ&DVK
( ) ) )
3URILWDELOLW\
52(
52$
*URVV0DUJLQ
2SHUDWLQJ0DUJLQ
1HW0DUJLQ
/LTXLGLW\6ROYHQF\
&XUUHQW5DWLR
'HEWWR(TXLW\ - - - - -
'HEWWR$VVHWV - - - - -
9DOXDWLRQ 3ULFHWR(DUQLQJ3(
3ULFHWR%RRN3%9
.H\$VVXPSWLRQV
&RPELQHG666*
1XPEHURI6WRUHV

Telecommunication Sector A Better Competition Landscape for All
OVERWEIGHT
More reasonable pricing. After telco operators raised their pricing during the Ramadan season, there were some adjustments in 3Q19 and more promotional gimmicks among the telco operators. However, in 4Q19, we have seen a better competition landscape as operators start to increase their price. Indosat has started to increase the pricing of the Yellow package and stop its unlimited package for the new subscribers. Indosat has also simplified its Freedom Internet package. Moreover, TLKM has also increased its pricing across its packages with the new “OMG” data package. The newly introduced OMG offered more data packages at a higher price. Thus, we believe the price increase initiative gave a positive signal to the sector. As always, all of the Big-3 operators are aspiring to keep sustainable pricing to continue going forward. Speaking of profitability, continuing a positive trend on the EBITDA margin improvement, the Big 3 operators aim to maintain the current level of margin until the end of 2019.
Healthier industry outlook. After the SIM card registration process that ended in May 2018, the Big 3 operators in Indonesia have been experiencing a natural cleansing process on their cellular subscribers. SIM card registration has given positive impacts on the industry; 1) a lower churn rate, 2) less starter pack and more renewal packages. These had led to better profitability for operators as renewal packages offer less price discount, while a low churn rate decreases both acquisition and producing costs. Although the sector recorded a decrease in the number of subscribers, the overall cellular ARPU among the operators has been rising since 2Q18. With that being said, despite the loss in the number of subscribers, the quality of the users has improved. In 2019, we have seen the normalization of the subscriber base of the operators. Comparing the market share in subscriber from FY18 to 9M19, TLKM is the only one that gained additional market share, while EXCL and ISAT loss market share.
146
Source: Company data, Sinarmas Investment Research
41.042.8
40.539.0
35.5 35.8
42.3
44.842.9
43.8 44.1
32.934.3 34.5 33.9
30.0 30.131.5
32.7 32.834.1
35.3
22.1 23.022.1
20.3
15.617.4
22.2
25.226.5
28.829.7
10.00
15.00
20.00
25.00
30.00
35.00
40.00
45.00
50.00
1Q17 2Q17 3Q17 4Q17 1Q18 2Q18 3Q18 4Q18 1Q19 2Q19 3Q19
Cellular ARPU (IDR 000)
TLKM EXCL ISAT
54.2%
49.8% 51.0%
46.6%
49.8%
38.2%
47.6%45.2%
50.3%
45.2%
50.8%
35.1%36.6%
38.2%35.5% 36.1% 36.1% 37.2%
38.9% 38.2% 39.3% 40.3%42.5%
45.7%43.4%
38.8%
34.1%
29.0% 28.8%
21.3%
35.7% 36.4%
42.7%
15.0%
20.0%
25.0%
30.0%
35.0%
40.0%
45.0%
50.0%
55.0%
60.0%
1Q17 2Q17 3Q17 4Q17 1Q18 2Q18 3Q18 4Q18 1Q19 2Q19 3Q19
EBITDA Margin
TLKM EXCL ISAT
Source: Company data, Sinarmas Investment Research

Telecommunication | Sector Outlook
Embracing the future of digitalization. Indonesia is a lucrative market for data services as it has 1) a huge population dominated by the digital-native generation, 2) a rising smartphone penetration as mobile phones are getting cheaper, 3) one of the most active social media users in the world. Internet penetration will grow at a fast rate, supported by rising urbanization and more affordable smartphones. As of 9M19, data traffic from TLKM, EXCL and ISAT combined, rose by 59% YoY to 9.4mn Terabyte. Going forward, we are expecting data traffic to grow more than 30% YoY, supported by the catalysts as mentioned above and the rapid increase in video consumption. In terms of data revenue mix, as of 9M19, EXCL leads with 85.2%, followed by ISAT and TLKM which recorded data revenue mix of 75.8% and 64.0% respectively.
More on tower divestment plan. Recently, ISAT has signed Sales & Purchase Agreements (SPAs) to sell its 3,100 towers with a total transaction of IDR 6.4tn (implying ~IDR 2.1bn/tower). By looking at tower divestment in the past, the price was above the range of IDR 1.43-1.63bn/tower. On the other hand, EXCL is also planning to divest 4,500 towers in 2020. In short, we believe the tower divestment plan, if completed, should give a positive impact to operators’ bottom-line as they recorded a gain from the tower sale which is most likely will be amortized within the leaseback period.
147
A cheaper tower lease contract renewal. The Big-3 operators will have a portion of the contract renewal on tower lease going forward. The good news is that the renewal rate for the tower lease would be significantly lower than the previous contract price. As of now, the market price for tower lease is around IDR 12-13mn/tower/month. Being said that, the Big-3 operator can save up to ~30-40% of their previous contract price. By looking at this, we can expect telco operators to have a quite significant cost saving and thus improved profitability. PSAK 73 impact on Indonesia telecommunication operators. PSAK 73, an adoption product of IFRS 16: Leases will be implemented starting on 1 January 2020 in Indonesia. Under PSAK 73, operating leases are treated similarly as finance leases—that is, the lessee is required to recognize all of its leases on the balance sheet (assets under finance lease and lease payable). In the income statement, the company reports interest expense and depreciation expense. We view that the adoption of PSAK 73 has a positive effect on EBITDA as operating lease expense is reclassified as depreciation expense and interest expense. ISAT has followed the PSAK 73 since Ooredoo has implemented IFRS 16 on 1 Jan 19. The company said that the change in accounting has resulted in an increased GPM margin of ~3%. For TLKM and EXCL which have not implemented this, further looking on the PSAK 73 implementation and its impact is needed. EBITDA margin could improve by the change in accounting, but the balance sheet could stretch on higher debt recognized. Conclusion and stock pick. All in all, we upgrade our recommendation on telecommunication sector from NEUTRAL to OVERWEIGHT. We believe that the sector will have good earnings growth going forward, supported by a healthier competition environment and growth from mobile data revenues. Overall, we are positive for all of the Big-3 operators. Despite the expected softer earnings in 4Q19, TLKM remains our top picks for the sector as we believe the future growth is still promising. On the other hand, we are also positive for both EXCL and ISAT to continue their better performance in 2020. However, the main downside risk to our call includes aggressive competition which will harm the overall industry.
Ticker Rating CP TP % Chg FY20F EV/EBITDA
TLKM BUY 3,990 4,950 24.1 7.0
EXCL ADD 3,240 3,650 12.7 4.3
ISAT ADD 3,120 3,600 15.4 5.4
Telecommunication Sector
-
500
1,000
1,500
2,000
2,500
3,000
3,500
4,000
1Q17 2Q17 3Q17 4Q17 1Q18 2Q18 3Q18 4Q18 1Q19 2Q19 3Q19
Thou
sand
s
Data Traffic (Tb)
TLKM EXCL ISAT
Source: Company data, Sinarmas Investment Research
Source: Company data, Sinarmas Investment Research
48% 49% 49% 50% 50% 50% 50% 49% 49% 49% 48%
31% 31% 32% 31% 31% 32% 32% 31% 30% 30% 30%
21% 20% 19% 19% 19% 19% 18% 20% 20% 21% 22%
-
50
100
150
200
250
300
350
400
450
500
0.0%
20.0%
40.0%
60.0%
80.0%
100.0%
120.0%
1Q17 2Q17 3Q17 4Q17 1Q18 2Q18 3Q18 4Q18 1Q19 2Q19 3Q19
Thou
sand
s
BTS Market Share
TLKM EXCL ISAT Total BTS

Telecommunication Sector
PT Telekomunikasi Indonesia Tbk.
BUY
Remain positive with a BUY recommendation for TLKM with a 52-week target price of IDR 4,950. Our target price is derived from EV/EBITDA multiples valuation at 7.0x, equivalent to its five years historical average. Despite the concern of weaker than expected earnings in 4Q19, we remain positive that TLKM would have a decent growth next year, supported by healthier competition landscape, growing mobile data revenues, and rising fixed broadband penetration. Moreover, we believe that TLKM has competitive advantages of domination in infrastructure, a superior network quality, and distinct customer profiles. However, the risk to our call is a significant drop in pricing across the telco industry. Signaling a positive trend in the cellular business. Despite the negative trend on data yield that persists, Telkomsel’s ARPU is slowly climbing up since the SIM card registration process that was completed in 2Q18. ARPU was recorded at IDR 43.3k in 9M19 (vs 36.6k in 6M18 and 43.1k in 2Q19). Going forward, TLKM aspires to keep increasing its ARPU, which is supported by 4G and legacy-to-data migration on its part of 111.2mn data users (66.3% of the total subscriber) which will lead to 30% higher data consumption. On the other hand, TLKM successfully gained back cellular subscribers in 3Q19, and maintain its dominance in the market share with 170.9mn subscribers (60%). Moreover, with the recent price increase through the new “OMG” data package, we believe the price increase initiative could give a positive signal to the sector. IndiHome is set for continuous growth. TLKM’s consumer segment is now contributed more than 10% of its total revenue and has a promising outlook. The total expected market for fixed broadband is 25mn household, and it experiences less business competition. As of 9M19, Indihome’s subscribers have reached 6.5mn (+1.4mn YTD, +38.3% YoY), with revenue growth of 52.1% YoY amounted to IDR 13.7tn. For 2019, TLKM sets a target to increase its subscribers to 7.0mn and expects to add another 1.5mn user in 2020. With the rapid growth of subscribers each year and a promising business outlook, we believe IndiHome will be a strong growth engine of TLKM towards digitalization.
148
Stock Information
Bloomberg Ticker TLKM IJ
52-Week High 4.500
52-Week Low 3,480
FY20F EV/EBITDA 7.0x
FY20F P/BV 4.5x
Share Outstanding (Mn) 99,062.2
Market Cap. (IDR Tn) 395.3
Share Price Performance
Current Price 3,990
52-Week Target Price 4,950
% Change 24.1%
Highlights (IDR Tn) 2018 2019E 2020F 2021F 2022F
Revenue 130.8 136.8 150.4 162.3 173.8
% growth 2.0% 4.6% 10.0% 7.9% 7.1%
EBITDA 59.2 64.3 73.4 81.0 88.7
% growth -8.4% 8.7% 14.2% 10.3% 9.5%
Net Profit 18.0 20.3 23.4 26.3 29.5
% growth -18.6% 12.7% 15.2% 12.2% 12.3%
EBITDA Margin 45.3% 47.0% 48.8% 49.9% 51.1%
Net Margin 13.8% 14.9% 15.6% 16.2% 17.0%
EPS (IDR) 182 205 236 265 298
EV/EBITDA (x) 8.7 8.0 7.0 6.4 5.8
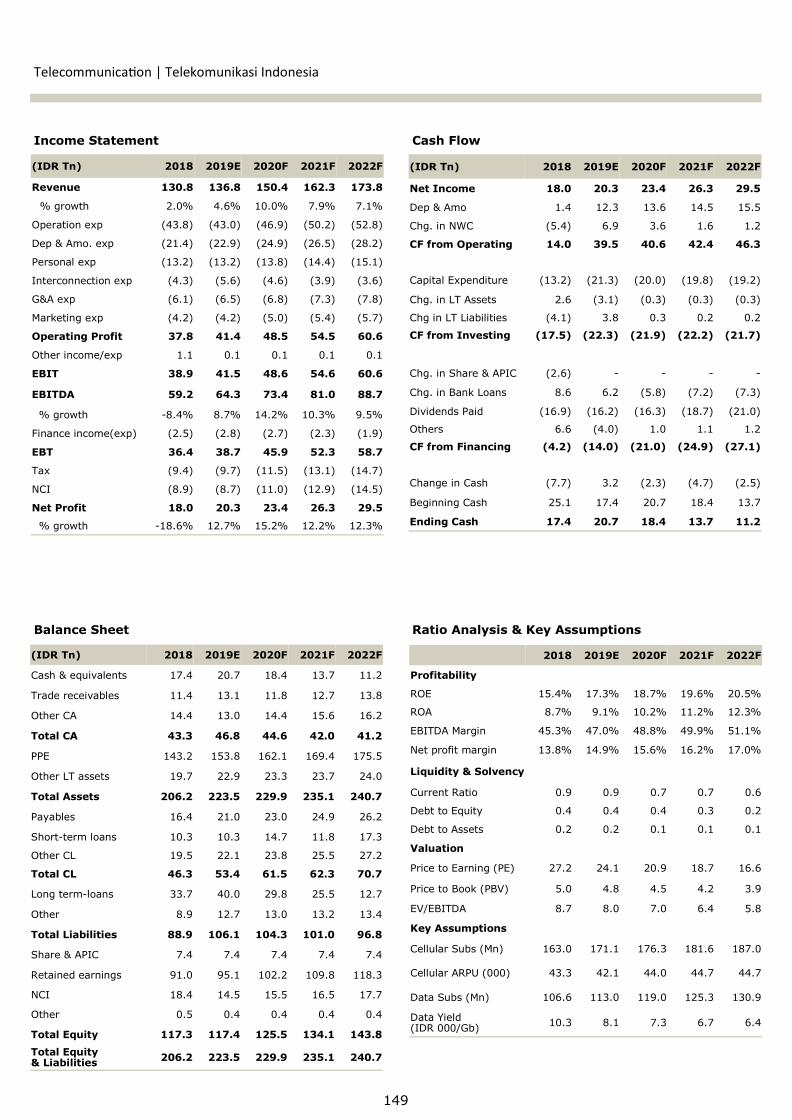
149
Income Statement Cash Flow
Balance Sheet Ratio Analysis & Key Assumptions
Telecommunication | Telekomunikasi Indonesia
(IDR Tn) 2018 2019E 2020F 2021F 2022F
Revenue 130.8 136.8 150.4 162.3 173.8
% growth 2.0% 4.6% 10.0% 7.9% 7.1%
Operation exp (43.8) (43.0) (46.9) (50.2) (52.8)
Dep & Amo. exp (21.4) (22.9) (24.9) (26.5) (28.2)
Personal exp (13.2) (13.2) (13.8) (14.4) (15.1)
Interconnection exp (4.3) (5.6) (4.6) (3.9) (3.6)
G&A exp (6.1) (6.5) (6.8) (7.3) (7.8)
Marketing exp (4.2) (4.2) (5.0) (5.4) (5.7)
Operating Profit 37.8 41.4 48.5 54.5 60.6
Other income/exp 1.1 0.1 0.1 0.1 0.1
EBIT 38.9 41.5 48.6 54.6 60.6
EBITDA 59.2 64.3 73.4 81.0 88.7
Finance income(exp) (2.5) (2.8) (2.7) (2.3) (1.9)
EBT 36.4 38.7 45.9 52.3 58.7
Tax (9.4) (9.7) (11.5) (13.1) (14.7)
NCI (8.9) (8.7) (11.0) (12.9) (14.5)
Net Profit 18.0 20.3 23.4 26.3 29.5
% growth -8.4% 8.7% 14.2% 10.3% 9.5%
% growth -18.6% 12.7% 15.2% 12.2% 12.3%
(IDR Tn) 2018 2019E 2020F 2021F 2022F
Net Income 18.0 20.3 23.4 26.3 29.5
Dep & Amo 1.4 12.3 13.6 14.5 15.5
Chg. in NWC (5.4) 6.9 3.6 1.6 1.2
CF from Operating 14.0 39.5 40.6 42.4 46.3
Capital Expenditure (13.2) (21.3) (20.0) (19.8) (19.2)
Chg. in LT Assets 2.6 (3.1) (0.3) (0.3) (0.3)
Chg in LT Liabilities (4.1) 3.8 0.3 0.2 0.2
CF from Investing (17.5) (22.3) (21.9) (22.2) (21.7)
Chg. in Share & APIC (2.6) - - - -
Chg. in Bank Loans 8.6 6.2 (5.8) (7.2) (7.3)
Dividends Paid (16.9) (16.2) (16.3) (18.7) (21.0)
Others 6.6 (4.0) 1.0 1.1 1.2
CF from Financing (4.2) (14.0) (21.0) (24.9) (27.1)
Change in Cash (7.7) 3.2 (2.3) (4.7) (2.5)
Beginning Cash 25.1 17.4 20.7 18.4 13.7
Ending Cash 17.4 20.7 18.4 13.7 11.2
(IDR Tn) 2018 2019E 2020F 2021F 2022F
Cash & equivalents 17.4 20.7 18.4 13.7 11.2
Trade receivables 11.4 13.1 11.8 12.7 13.8
Other CA 14.4 13.0 14.4 15.6 16.2
Total CA 43.3 46.8 44.6 42.0 41.2
PPE 143.2 153.8 162.1 169.4 175.5
Other LT assets 19.7 22.9 23.3 23.7 24.0
Total Assets 206.2 223.5 229.9 235.1 240.7
Payables 16.4 21.0 23.0 24.9 26.2
Short-term loans 10.3 10.3 14.7 11.8 17.3
Other CL 19.5 22.1 23.8 25.5 27.2
Total CL 46.3 53.4 61.5 62.3 70.7
Long term-loans 33.7 40.0 29.8 25.5 12.7
Other 8.9 12.7 13.0 13.2 13.4
Total Liabilities 88.9 106.1 104.3 101.0 96.8
Share & APIC 7.4 7.4 7.4 7.4 7.4
Retained earnings 91.0 95.1 102.2 109.8 118.3
NCI 18.4 14.5 15.5 16.5 17.7
Other 0.5 0.4 0.4 0.4 0.4
Total Equity 117.3 117.4 125.5 134.1 143.8
Total Equity & Liabilities 206.2 223.5 229.9 235.1 240.7
2018 2019E 2020F 2021F 2022F
Profitability
ROE 15.4% 17.3% 18.7% 19.6% 20.5%
ROA 8.7% 9.1% 10.2% 11.2% 12.3%
EBITDA Margin 45.3% 47.0% 48.8% 49.9% 51.1%
Net profit margin 13.8% 14.9% 15.6% 16.2% 17.0%
Liquidity & Solvency
Current Ratio 0.9 0.9 0.7 0.7 0.6
Debt to Equity 0.4 0.4 0.4 0.3 0.2
Debt to Assets 0.2 0.2 0.1 0.1 0.1
Valuation
Price to Earning (PE) 27.2 24.1 20.9 18.7 16.6
Price to Book (PBV) 5.0 4.8 4.5 4.2 3.9
EV/EBITDA 8.7 8.0 7.0 6.4 5.8
Key Assumptions
Cellular Subs (Mn) 163.0 171.1 176.3 181.6 187.0
Cellular ARPU (000) 43.3 42.1 44.0 44.7 44.7
Data Subs (Mn) 106.6 113.0 119.0 125.3 130.9
Data Yield (IDR 000/Gb) 10.3 8.1 7.3 6.7 6.4
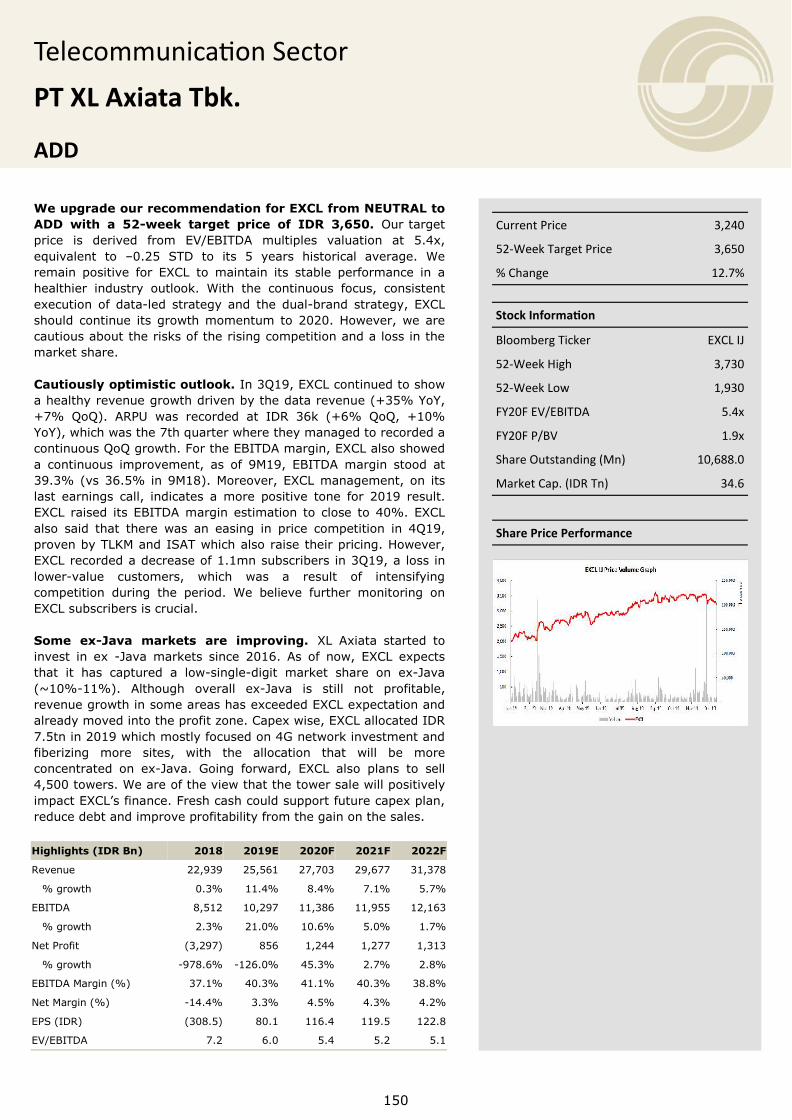
Telecommunication Sector
PT XL Axiata Tbk.
ADD
We upgrade our recommendation for EXCL from NEUTRAL to ADD with a 52-week target price of IDR 3,650. Our target price is derived from EV/EBITDA multiples valuation at 5.4x, equivalent to –0.25 STD to its 5 years historical average. We remain positive for EXCL to maintain its stable performance in a healthier industry outlook. With the continuous focus, consistent execution of data-led strategy and the dual-brand strategy, EXCL should continue its growth momentum to 2020. However, we are cautious about the risks of the rising competition and a loss in the market share. Cautiously optimistic outlook. In 3Q19, EXCL continued to show a healthy revenue growth driven by the data revenue (+35% YoY, +7% QoQ). ARPU was recorded at IDR 36k (+6% QoQ, +10% YoY), which was the 7th quarter where they managed to recorded a continuous QoQ growth. For the EBITDA margin, EXCL also showed a continuous improvement, as of 9M19, EBITDA margin stood at 39.3% (vs 36.5% in 9M18). Moreover, EXCL management, on its last earnings call, indicates a more positive tone for 2019 result. EXCL raised its EBITDA margin estimation to close to 40%. EXCL also said that there was an easing in price competition in 4Q19, proven by TLKM and ISAT which also raise their pricing. However, EXCL recorded a decrease of 1.1mn subscribers in 3Q19, a loss in lower-value customers, which was a result of intensifying competition during the period. We believe further monitoring on EXCL subscribers is crucial. Some ex-Java markets are improving. XL Axiata started to invest in ex -Java markets since 2016. As of now, EXCL expects that it has captured a low-single-digit market share on ex-Java (~10%-11%). Although overall ex-Java is still not profitable, revenue growth in some areas has exceeded EXCL expectation and already moved into the profit zone. Capex wise, EXCL allocated IDR 7.5tn in 2019 which mostly focused on 4G network investment and fiberizing more sites, with the allocation that will be more concentrated on ex-Java. Going forward, EXCL also plans to sell 4,500 towers. We are of the view that the tower sale will positively impact EXCL’s finance. Fresh cash could support future capex plan, reduce debt and improve profitability from the gain on the sales.
150
Stock Information
Bloomberg Ticker EXCL IJ
52-Week High 3,730
52-Week Low 1,930
FY20F EV/EBITDA 5.4x
FY20F P/BV 1.9x
Share Outstanding (Mn) 10,688.0
Market Cap. (IDR Tn) 34.6
Share Price Performance
Current Price 3,240
52-Week Target Price 3,650
% Change 12.7%
Highlights (IDR Bn) 2018 2019E 2020F 2021F 2022F
Revenue 22,939 25,561 27,703 29,677 31,378
% growth 0.3% 11.4% 8.4% 7.1% 5.7%
EBITDA 8,512 10,297 11,386 11,955 12,163
% growth 2.3% 21.0% 10.6% 5.0% 1.7%
Net Profit (3,297) 856 1,244 1,277 1,313
% growth -978.6% -126.0% 45.3% 2.7% 2.8%
EBITDA Margin (%) 37.1% 40.3% 41.1% 40.3% 38.8%
Net Margin (%) -14.4% 3.3% 4.5% 4.3% 4.2%
EPS (IDR) (308.5) 80.1 116.4 119.5 122.8
EV/EBITDA 7.2 6.0 5.4 5.2 5.1

151
Income Statement Cash Flow
(IDR Bn) 2018 2019E 2020F 2021F 2022F
Revenue 22,939 25,561 27,703 29,677 31,378
% growth 0.3% 11.4% 8.4% 7.1% 5.7%
Dep & amor exp (11,621) (7,305) (7,800) (8,282) (8,792)
Infra exp (8,453) (9,581) (10,525) (11,505) (12,563)
Interconnection exp (2,421) (1,931) (1,715) (1,821) (1,959)
Salaries exp (1,037) (1,283) (1,415) (1,556) (1,711)
Sales and marketing exp (2,039) (1,917) (2,078) (2,226) (2,353)
G&A exp (476) (552) (586) (615) (630)
Operating Profit (3,109) 2,993 3,586 3,673 3,371
Other income/exp (29) 473 423 423 423
EBIT (3,138) 3,465 4,009 4,096 3,794
EBITDA 8,512 10,297 11,386 11,955 12,163
% growth 2.3% 21.0% 10.6% 5.0% 1.7%
Finance income (exp) (1,259) (2,277) (2,350) (2,393) (2,043)
EBT (4,396) 1,188 1,658 1,703 1,750
Tax 1,099 (333) (415) (426) (438)
Net profit (3,297) 856 1,244 1,277 1,313
% growth -978.6% -126.0% 45.3% 2.7% 2.8%
EPS (IDR) N/A 80.1 116.4 119.5 122.8
Income Statement Cash Flow
Balance Sheet Ratio Analysis & Key Assumptions
Telecommunication | XL Axiata
(IDR Bn) 2018 2019E 2020F 2021F 2022F
Net Income (3,297) 856 1,244 1,277 1,313
Dep & Amo 11,208 7,305 7,800 8,282 8,792
Chg. in NWC 849 69 314 635 469
CF from Operating 8,760 8,230 9,358 10,194 10,573
Capital Expenditure (12,885) (10,225) (7,618) (7,419) (7,845)
Chg. in LT Assets 263 222 (566) (36) (73)
Chg in LT Liabilities (1,229) (214) 87 280 140
CF from Investing (13,851) (10,216) (8,097) (7,176) (7,777)
Chg. in Share & APIC (8) 8 - - -
Chg. in Bank Loans 3,673 2,269 (1,322) (2,038) (597)
Dividends Paid - - - - -
CF from Financing 3,682 2,276 (1,322) (2,038) (597)
Change in Cash (1,408) 290 (60) 981 2,199
Beginning Cash 2,455 1,047 1,337 1,276 2,257
Ending Cash 1,047 1,337 1,276 2,257 4,456
(IDR Bn) 2018 2019E 2020F 2021F 2022F
Cash & equivalents 1,047 1,337 1,276 2,257 4,456
Trade receivables 632 700 751 814 858
Other CA 5,380 4,201 4,649 5,167 5,542
Total CA 7,059 6,238 6,677 8,238 10,856
PPE 36,760 39,712 39,563 38,733 37,818
Other LT assets 13,796 13,541 14,074 14,077 14,117
Total Assets 57,614 59,491 60,314 61,048 62,791
Payables 9,159 7,966 8,480 9,357 9,996
Short-term loans 1,329 4,776 400 677 4,849
Other CL 5,245 5,340 6,347 5,425 5,676
Total CL 15,733 18,082 15,226 15,459 20,522
Long term-loans 11,235 7,459 9,059 7,882 3,033
Other 12,303 14,744 15,578 15,980 16,196
Total Liabilities 39,271 40,285 39,864 39,321 39,751
Share & APIC 13,218 13,226 13,226 13,226 13,226
Retained earnings 5,125 5,981 7,224 8,502 9,814
Total Equity 18,343 19,206 20,450 21,727 23,040
Total Equity & Liabilities 57,614 59,491 60,314 61,048 62,791
2018 2019E 2020F 2021F 2022F
Profitability
ROE -18.0% 4.5% 6.1% 5.9% 5.7%
ROA -5.7% 1.4% 2.1% 2.1% 2.1%
EBITDA Margin 37.1% 40.3% 41.1% 40.3% 38.8%
Net profit margin -14.4% 3.3% 4.5% 4.3% 4.2%
Liquidity & Solvency
Current Ratio 0.4 0.3 0.4 0.5 0.5
Debt to Equity 0.6 0.6 0.4 0.4 0.3
Debt to Assets 0.2 0.2 0.1 0.1 0.1
Valuation
Price to Earning (PE) - 45.6 31.4 30.5 29.7
Price to Book (PBV) 2.1 2.0 1.9 1.8 1.7
EV/EBITDA 7.2 6.0 5.4 5.2 5.1
Key Assumptions
Cellular Subs (Mn) 54.9 56.4 58.1 59.9 61.7
Cellular ARPU (000) 30.5 34.5 36.2 37.7 38.7
Data Subs (Mn) 45.0 50.2 52.3 54.5 56.7
Data Yield (IDR 000/ 6.8 5.8 5.3 5.2 5.1
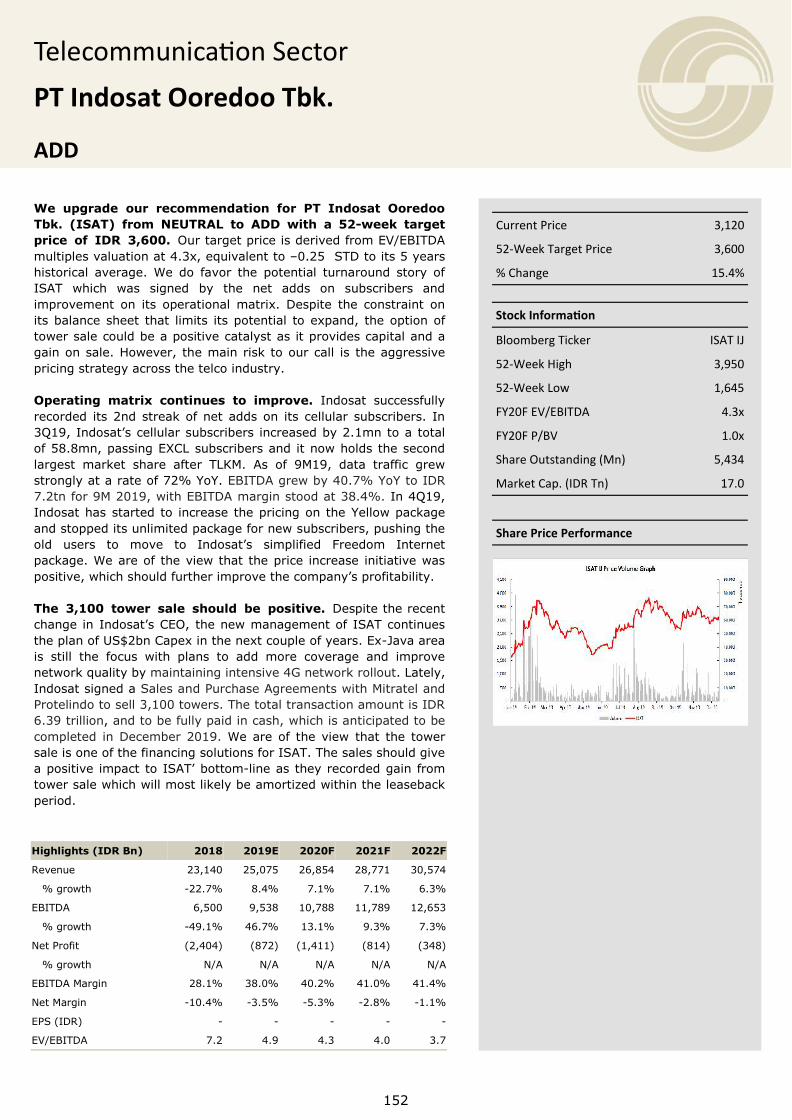
Telecommunication Sector
PT Indosat Ooredoo Tbk.
ADD
We upgrade our recommendation for PT Indosat Ooredoo Tbk. (ISAT) from NEUTRAL to ADD with a 52-week target price of IDR 3,600. Our target price is derived from EV/EBITDA multiples valuation at 4.3x, equivalent to –0.25 STD to its 5 years historical average. We do favor the potential turnaround story of ISAT which was signed by the net adds on subscribers and improvement on its operational matrix. Despite the constraint on its balance sheet that limits its potential to expand, the option of tower sale could be a positive catalyst as it provides capital and a gain on sale. However, the main risk to our call is the aggressive pricing strategy across the telco industry. Operating matrix continues to improve. Indosat successfully recorded its 2nd streak of net adds on its cellular subscribers. In 3Q19, Indosat’s cellular subscribers increased by 2.1mn to a total of 58.8mn, passing EXCL subscribers and it now holds the second largest market share after TLKM. As of 9M19, data traffic grew strongly at a rate of 72% YoY. EBITDA grew by 40.7% YoY to IDR 7.2tn for 9M 2019, with EBITDA margin stood at 38.4%. In 4Q19, Indosat has started to increase the pricing on the Yellow package and stopped its unlimited package for new subscribers, pushing the old users to move to Indosat’s simplified Freedom Internet package. We are of the view that the price increase initiative was positive, which should further improve the company’s profitability. The 3,100 tower sale should be positive. Despite the recent change in Indosat’s CEO, the new management of ISAT continues the plan of US$2bn Capex in the next couple of years. Ex-Java area is still the focus with plans to add more coverage and improve network quality by maintaining intensive 4G network rollout. Lately, Indosat signed a Sales and Purchase Agreements with Mitratel and Protelindo to sell 3,100 towers. The total transaction amount is IDR 6.39 trillion, and to be fully paid in cash, which is anticipated to be completed in December 2019. We are of the view that the tower sale is one of the financing solutions for ISAT. The sales should give a positive impact to ISAT’ bottom-line as they recorded gain from tower sale which will most likely be amortized within the leaseback period.
152
Stock Information
Bloomberg Ticker ISAT IJ
52-Week High 3,950
52-Week Low 1,645
FY20F EV/EBITDA 4.3x
FY20F P/BV 1.0x
Share Outstanding (Mn) 5,434
Market Cap. (IDR Tn) 17.0
Share Price Performance
Current Price 3,120
52-Week Target Price 3,600
% Change 15.4%
Highlights (IDR Bn) 2018 2019E 2020F 2021F 2022F
Revenue 23,140 25,075 26,854 28,771 30,574
% growth -22.7% 8.4% 7.1% 7.1% 6.3%
EBITDA 6,500 9,538 10,788 11,789 12,653
% growth -49.1% 46.7% 13.1% 9.3% 7.3%
Net Profit (2,404) (872) (1,411) (814) (348)
% growth N/A N/A N/A N/A N/A
EBITDA Margin 28.1% 38.0% 40.2% 41.0% 41.4%
Net Margin -10.4% -3.5% -5.3% -2.8% -1.1%
EPS (IDR) - - - - -
EV/EBITDA 7.2 4.9 4.3 4.0 3.7

153
Income Statement Cash Flow
(IDR Bn) 2018 2019E 2020F 2021F 2022F
Revenue 23,140 25,075 26,854 28,771 30,574
% growth -22.7% 8.4% 7.1% 7.1% 6.3%
Cost of services (12,043) (11,834) (11,948) (12,652) (13,372)
Dep & amor exp (8,249) (9,438) (10,015) (10,543) (11,002)
Personnel exp (2,238) (1,728) (2,083) (2,196) (2,317)
Marketing exp (1,229) (1,025) (1,149) (1,225) (1,305)
G & A exp (1,129) (949) (885) (909) (927)
Operating Profit (1,508) 867 915 1,387 1,792
Other income/exp 815 2 - - -
EBIT (692) 869 915 1,387 1,792
EBITDA 6,500 9,538 10,788 11,789 12,653
% growth -49.1% 46.7% 13.1% 9.3% 7.3%
Finance income(exp) (2,089) (2,641) (2,808) (2,537) (2,361)
EBT (2,782) (1,772) (1,893) (1,150) (569)
Tax 578 272 439 254 108
NCI (319) (57) (92) (53) (23)
Net profit (2,522) (1,558) (1,546) (950) (483)
% growth -311.6% -63.7% 61.8% -42.3% -57.3%
EPS (IDR) - - - - -
Income Statement Cash Flow
Balance Sheet Ratio Analysis & Key Assumptions
Telecommunication | Indosat Ooredoo
(IDR Bn) 2018 2019E 2020F 2021F 2022F
Net Income (2,404) (872) (1,411) (814) (348)
Dep & Amo 7,596 9,438 10,015 10,543 11,002
Chg. in NWC 3,901 (303) 522 478 499
CF from Operating 9,093 8,263 9,126 10,207 11,154
Capital Expenditure (8,534) (13,015) (7,444) (6,836) (6,054)
Chg. in LT Assets (3,070) (176) (252) (272) (255)
Chg in LT Liabilities (110) 248 71 138 115
CF from Investing (11,757) (13,044) (7,700) (7,039) (6,255)
Chg. in Share & APIC - - - - -
Chg. in Bank Loans 2,310 5,653 (2,080) (2,183) (1,628)
Dividends Paid (397) - - - -
CF from Financing 2,034 5,693 (2,009) (2,106) (1,556)
Change in Cash (630) 913 (583) 1,061 3,342
Beginning Cash 1,675 1,045 1,958 1,375 2,436
Ending Cash 1,045 1,958 1,375 2,436 5,779
(IDR Bn) 2018 2019E 2020F 2021F 2022F
Cash & equivalents 1.045 1.958 1.375 2.436 5.779
Trade receivables 2.926 3.171 3.396 3.638 3.866
Other CA 3.935 4.029 4.116 4.156 4.233
Total CA 7.907 9.158 8.886 10.230 13.878
PPE 36.899 40.557 38.075 34.465 29.619
Other LT assets 8.334 8.530 8.768 9.012 9.226
Total Assets 53.140 58.245 55.730 53.707 52.723
Payables 927 923 989 1.047 1.102
Short-term loans 7.060 7.124 4.136 5.990 6.371
Other CL 13.053 13.094 13.861 14.563 15.312
Total CL 21.040 21.140 18.986 21.600 22.786
Long term-loans 17.886 23.474 24.382 20.344 18.335
Total Liabilities 41.003 46.940 45.764 44.479 43.770
Share & APIC 2.090 2.090 2.090 2.090 2.090
Retained earnings 8.497 7.625 6.214 5.400 5.053
Total Equity 12.136 11.305 9.966 9.228 8.953
Total Equity & Liabilities 53.140 58.245 55.730 53.707 52.723
2018 2019E 2020F 2021F 2022F
Profitability
ROE -19.8% -7.7% -14.2% -8.8% -3.9%
ROA -4.5% -1.5% -2.5% -1.5% -0.7%
EBITDA Margin 28.1% 38.0% 40.2% 41.0% 41.4%
Net profit margin -10.4% -3.5% -5.3% -2.8% -1.1%
Liquidity & Solvency
Current Ratio 0.4 0.4 0.5 0.5 0.6
Debt to Equity 1.8 2.1 2.2 2.2 2.1
Debt to Assets 0.4 0.4 0.4 0.4 0.4
Valuation
Price to Earning (PE) - - - - -
Price to Book (PBV) 0.9 0.9 1.0 1.1 1.2
EV/EBITDA 5.3 4.1 3.5 2.9 2.3
Key Assumptions
Cellular Subs (Mn) 58.0 59.6 62.0 63.8 65.8
Cellular ARPU (000) 26.7 25.8 26.4 27.3 28.1
Data Subs (Mn) 44.1 45.6 48.3 50.4 52.6
Data Yield (IDR 000/ 6.7 4.5 3.9 3.7 3.6

Tobacco Sector
Valuation is Turning Attractive
OVERWEIGHT
assume that government is currently seeing a
significant industry volume decline up to 10% YoY next
year. We believe this unprecedented hike may be a one
-time event due to the absence in 2019. The sector
remains vital as it controls the livelihood of many
stakeholders, especially tobacco farmers. While we see
some may price in extreme excise hike post 2020, we
maintain normal rate of 10-11% for 2021 onwards.
No more affordable cigarettes. Effective as of early
Jan-20, cigarette producers ideally are obligated to
raise their products ASP to at least 85% from the new
HJE to comply with the regulation. We notice that both
HMSP and GGRM will need to raise ASP significantly by
20%-35%, especially for their lower-priced products.
The flagship products, which have already met the
regulation, should see less aggressive ASP hike in our
FY19: Industry outlook getting stable. Based on
Phillip Morris International Data, Indonesia’s cigarette
market has started signaling a stable performance this
year, with volume recorded at 226.3bn sticks (+0.7%
YoY) in 9M19 following limited ASP increases. HMSP
recorded volume of 72.1bn sticks in 9M19, down by
3.2% YoY which was on persisting decline of A Mild and
a faster shift to low price SKM FF category which was
not HMSP’s expertise. On the flip side, GGRM
maintained its robust volume growth trend of ~14% as
of 9M19. Another thing to note from this sector was the
severe depreciation of tobacco players’ share price
throughout the year. Note that by the end of Nov-19,
both HMSP and GGRM’s share has been cut by almost
half, on the back of: 1) free-float weight adjustment for
LQ45 and IDX30 that hurt HMSP the most, 2) ESG
issue, and 3) unprecedented soaring excise tax hike
and minimum cigarette retail selling price for 2020.
The extreme excise tax hike put negativity on the
sector, yet should be a one time event. Ministry of
Finance has set excise tax to increase by blended
average of 23% YoY next year with highest hike
coming from SPM and SKM. In addition, minimum retail
selling price (HJE) is also set elevated by ~42% on
average, whereas SPM and SKM’s are lifted more than
50%. Note that HJE applies as the basis for
government’s VAT collection. This decision is intended
to cut cigarette consumption, control the industry and
preserve government income. The 23% increase in
excise tax is much higher than the adjusted total excise
tax increases of 11% in 2020 state budget, in which we
154
11.2% 10.5% 10.0% 0.0% 23.0%
8.3%
8.1%7.5%
3.3%
19.0%
10.7%
7.2% 5.6%
3.4%
18.2%
0.0%
5.0%
10.0%
15.0%
20.0%
25.0%
2016 2017 2018 2019E 2020F
Average Excise Tax Hike HMSP ASP Hike (Est.) GGRM ASP Hike (Est.)
Source: Company Data, Sinarmas Investment Research
Unexpected excise tax hike in 2020
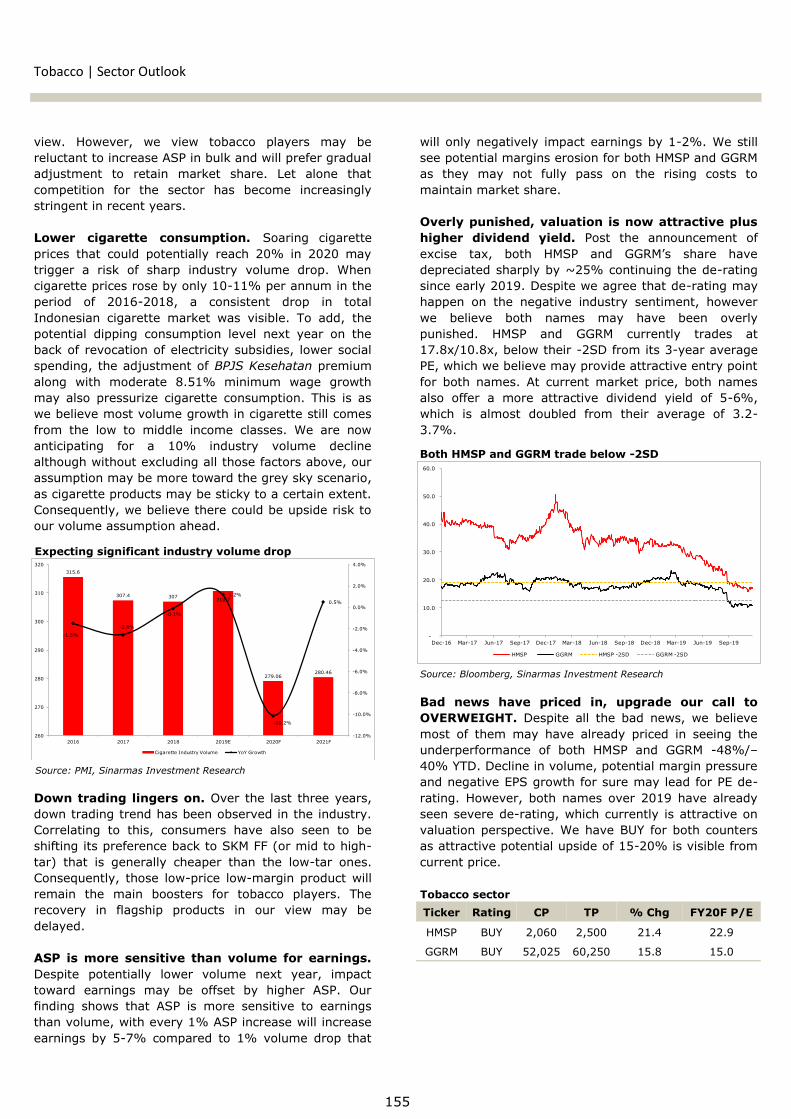
Tobacco | Sector Outlook
will only negatively impact earnings by 1-2%. We still
see potential margins erosion for both HMSP and GGRM
as they may not fully pass on the rising costs to
maintain market share.
Overly punished, valuation is now attractive plus
higher dividend yield. Post the announcement of
excise tax, both HMSP and GGRM’s share have
depreciated sharply by ~25% continuing the de-rating
since early 2019. Despite we agree that de-rating may
happen on the negative industry sentiment, however
we believe both names may have been overly
punished. HMSP and GGRM currently trades at
17.8x/10.8x, below their -2SD from its 3-year average
PE, which we believe may provide attractive entry point
for both names. At current market price, both names
also offer a more attractive dividend yield of 5-6%,
which is almost doubled from their average of 3.2-
3.7%.
Bad news have priced in, upgrade our call to
OVERWEIGHT. Despite all the bad news, we believe
most of them may have already priced in seeing the
underperformance of both HMSP and GGRM -48%/–
40% YTD. Decline in volume, potential margin pressure
and negative EPS growth for sure may lead for PE de-
rating. However, both names over 2019 have already
seen severe de-rating, which currently is attractive on
valuation perspective. We have BUY for both counters
as attractive potential upside of 15-20% is visible from
current price.
view. However, we view tobacco players may be
reluctant to increase ASP in bulk and will prefer gradual
adjustment to retain market share. Let alone that
competition for the sector has become increasingly
stringent in recent years.
Lower cigarette consumption. Soaring cigarette
prices that could potentially reach 20% in 2020 may
trigger a risk of sharp industry volume drop. When
cigarette prices rose by only 10-11% per annum in the
period of 2016-2018, a consistent drop in total
Indonesian cigarette market was visible. To add, the
potential dipping consumption level next year on the
back of revocation of electricity subsidies, lower social
spending, the adjustment of BPJS Kesehatan premium
along with moderate 8.51% minimum wage growth
may also pressurize cigarette consumption. This is as
we believe most volume growth in cigarette still comes
from the low to middle income classes. We are now
anticipating for a 10% industry volume decline
although without excluding all those factors above, our
assumption may be more toward the grey sky scenario,
as cigarette products may be sticky to a certain extent.
Consequently, we believe there could be upside risk to
our volume assumption ahead.
Down trading lingers on. Over the last three years,
down trading trend has been observed in the industry.
Correlating to this, consumers have also seen to be
shifting its preference back to SKM FF (or mid to high-
tar) that is generally cheaper than the low-tar ones.
Consequently, those low-price low-margin product will
remain the main boosters for tobacco players. The
recovery in flagship products in our view may be
delayed.
ASP is more sensitive than volume for earnings.
Despite potentially lower volume next year, impact
toward earnings may be offset by higher ASP. Our
finding shows that ASP is more sensitive to earnings
than volume, with every 1% ASP increase will increase
earnings by 5-7% compared to 1% volume drop that
155
Ticker Rating CP TP % Chg FY20F P/E
HMSP BUY 2,060 2,500 21.4 22.9
GGRM BUY 52,025 60,250 15.8 15.0
Tobacco sector
Source: PMI, Sinarmas Investment Research
Expecting significant industry volume drop
315.6
307.4 307310.7
279.06280.46
-1.5%
-2.6%
-0.1%
1.2%
-10.2%
0.5%
-12.0%
-10.0%
-8.0%
-6.0%
-4.0%
-2.0%
0.0%
2.0%
4.0%
260
270
280
290
300
310
320
2016 2017 2018 2019E 2020F 2021F
Cigarette Industry Volume YoY Growth
Source: Bloomberg, Sinarmas Investment Research
Both HMSP and GGRM trade below -2SD
-
10.0
20.0
30.0
40.0
50.0
60.0
Dec-16 Mar-17 Jun-17 Sep-17 Dec-17 Mar-18 Jun-18 Sep-18 Dec-18 Mar-19 Jun-19 Sep-19
HMSP GGRM HMSP -2SD GGRM -2SD

Tobacco Sector
PT HM Sampoerna Tbk.
BUY
We raise our NEUTRAL to BUY call on PT HM Sampoerna Tbk
(HMSP) with 52-week target price of IDR 2,500. Our TP
represents 21.4% potential upside, pegged to 22.9x FY20F PE (-
1.5SD from its 3-year average PE) which also implies a 18.9x
forward PE. Despite the negative sentiment of the industry post the
extreme excise tax coupled with HJE hike, we believe all the bad
news have already priced in the significant de-rating of HMSP
throughout 2019. Downside risks to our call are another round of
extreme excise tax hike after 2020 and worse-than-expected
volume and continuing market share drop.
Expecting industry volume drop. With the significant rise in
2020 excise tax hike and HJE, we are now anticipating a 10% YoY
cigarette volume decline in the industry, leading to total Indonesia
cigarette market of 279bn sticks (based on Phillip Morris
International data). Our assumption should be more toward the
worst case scenario as people will still consume cigarette, yet
leaving the probability of lower consumption.
HMSP’s earnings outlook. For HMSP, we assume FY20F volume
to drop in-line with industry’s 10% YoY totaling 88.8bn sticks (from
2.7% decline in FY19E) with ASP to rise by 19% (vs 3.3% in
FY19E). As a result, top-line will still grow by 7.1% YoY to IDR
115.0tn on higher ASP although EPS will drop by 11.7% YoY on
margin erosion. Our numbers show a decline of 260/240bps in
HMSP’s FY20F GPM/NPM to 22.1%/11%.
“A Mild” recovery may be on hold. In 2019, HMSP launched new
product “A Mild Splash” to bring back its glory in the SKM LTLN
following the continuously decline in “A Mild”. As we see the
downtrading and shift back to SKM FF will persist in the upcoming
years, we believe it may be ineffective and the SKM FF popular
brands such as Magnum Mild, Phillip Morris Bold and Malboro Filter
Black will remain the key products in the upcoming years.
Undemanding valuation coupled with attractive dividend
yield. HMSP currently trades at 17.8x PE (below -2SD from its 3-
year average) and provides 5.3% FY20F dividend yield.
156
Stock Information
Bloomberg Ticker HMSP IJ
52-Week High 4,080
52-Week Low 1,900
FY20F P/E 22.9x
FY20F P/BV 8.4x
Share Outstanding (Mn) 116,318.1
Market Cap. (IDR Tn) 239.6
Share Price Performance
Current Price 2,060
52-Week Target Price 2,500
% Change 21.4%
Highlights (IDR Bn) 2018 2019E 2020F 2021F 2022F
Revenue 106,742 107,358 114,971 125,583 136,238
% growth 7.7% 0.6% 7.1% 9.2% 8.5%
Gross Profit 25,491 26,460 25,353 27,443 29,277
Net Profit 13,538 14,375 12,693 13,563 14,157
% growth 6.8% 6.2% -11.7% 6.9% 4.4%
Gross Margin (%) 23.9% 24.6% 22.1% 21.9% 21.5%
Net Margin (%) 12.7% 13.4% 11.0% 10.8% 10.4%
Return on Equity (%) 39.0% 40.2% 36.0% 38.9% 39.7%
Return on Assets (%) 30.2% 31.3% 28.4% 30.2% 30.4%
EPS (IDR) 116 124 109 117 122

157
Tobacco | HM Sampoerna
Income Statement Cash Flow
(IDR Bn) 2018 2019E 2020F 2021F 2022F
Revenue 106,742 107,358 114,971 125,583 136,238
% growth 7.7% 0.6% 7.1% 9.2% 8.5%
COGS (81,251) (80,898) (89,619) (98,139) (106,961)
% growth 8.5% -0.4% 10.8% 9.5% 9.0%
Gross Profit 25,491 26,460 25,353 27,443 29,277
% growth 5.3% 3.8% -4.2% 8.2% 6.7%
Operating Expenses (8,609) (8,693) (9,675) (10,513) (11,519)
Opex to Sales (%) -8.1% -8.1% -8.4% -8.4% -8.5%
Other Inc (Exp) 106 - - - -
EBIT 16,988 17,767 15,677 16,930 17,759
% growth 5.5% 4.6% -11.8% 8.0% 4.9%
EBITDA 17,962 18,453 16,416 17,701 18,548
% growth 5.7% 2.7% -11.0% 7.8% 4.8%
Net Financing 973 1,305 1,162 1,064 1,117
EBT 17,961 19,072 16,840 17,994 18,875
% growth 6.3% 6.2% -11.7% 6.9% 4.9%
Tax Expenses (4,423) (4,696) (4,147) (4,431) (4,719)
Net Income 13,538 14,375 12,693 13,563 14,157
% growth 6.8% 6.2% -11.7% 6.9% 4.4%
EPS (IDR) 116 124 109 117 122
(IDR Bn) 2018 2019E 2020F 2021F 2022F
Net Income 13,538 14,375 12,693 13,563 14,157
Dep. & Amortization 974 686 739 771 789
Chg. In NWC 6,675 (2,992) (518) (1,838) 283
CF from Operating 21,187 12,069 12,914 12,496 15,229
Capital Expenditure (1,372) (228) (672) (485) (384)
Chg. in LT Assets 587 274 119 23 (2)
Others (95) 116 213 248 275
CF from Investing (879) 163 (339) (214) (112)
Chg. in Share & APIC 97 - - - -
Chg. in Debt - - - - -
Dividends Paid (12,390) (13,616) (14,361) (12,680) (13,550)
Others - - - - -
CF from Financing (12,293) (13,616) (14,361) (12,680) (13,550)
Chg. in Cash 8,015 (1,384) (1,787) (398) 1,568
Beginning Cash 7,502 15,516 14,133 12,346 11,948
Ending Cash 15,516 14,133 12,346 11,948 13,516
Balance Sheet Ratio Analysis and Key Assumptions
(IDR Bn) 2018 2019E 2020F 2021F 2022F
Cash & Equivalents 15,516 14,133 12,346 11,948 13,516
Trade Receivables 3,815 3,251 3,481 3,803 2,259
Inventories 15,183 15,271 16,354 17,863 19,379
Other Current Assets 3,317 4,537 4,056 4,626 4,932
Total CA 37,831 37,192 36,237 38,240 40,086
Fixed Assets 7,288 6,830 6,763 6,476 6,072
Other Non CA 1,483 1,208 1,089 1,066 1,068
Total Assets 46,602 45,230 44,089 45,783 47,226
Short Term Debt - - - - -
Trade Payables 3,450 3,758 4,260 4,692 5,121
Taxes Payable 1,688 1,792 1,582 1,691 1,801
Other CL 3,656 996 1,017 1,039 1,062
Total CL 8,794 6,545 6,860 7,423 7,984
Other Non CL 2,450 2,566 2,779 3,027 3,302
Total Liabilities 11,244 9,112 9,639 10,450 11,286
Share & APIC 21,011 21,011 21,011 21,011 21,011
Retained Earnings 13,731 14,490 12,822 13,705 14,312
Others 616 616 616 616 616
Total Equity 35,358 36,118 34,450 35,333 35,940
Total Liabilities & Equity
46,602 45,230 44,089 45,783 47,226
2018 2019E 2020F 2021F 2022F
Profitability
Gross Margin 23.9% 24.6% 22.1% 21.9% 21.5%
Operating Margin 15.9% 16.5% 13.6% 13.5% 13.0%
EBITDA Margin 16.8% 17.2% 14.3% 14.1% 13.6%
Net Margin 12.7% 13.4% 11.0% 10.8% 10.4%
Liquidity
Current Ratio (x) 4.3 5.7 5.3 5.2 5.0
Quick Ratio (x) 2.2 2.7 2.3 2.1 2.0
Solvency
Debt to Equity (x) 0.0 0.0 0.0 0.0 0.0
Interest Cov. (x) na na 0.0 0.0 0.0
Valuation
Price to Earnings (x) 21.5 20.2 22.9 21.4 20.5
Price to Book (x) 8.2 8.1 8.4 8.2 8.1
Key Assumptions
Volume (Bn Sticks) 101.4 98.6 88.8 89.3 89.8
% growth 0.1% -2.7% -10.0% 0.6% 0.5%
Blended ASP Est. 1,044 1,078 1,284 1,395 1,518
% growth 7.9% 3.3% 19.0% 8.7% 8.8%
Market Share 33.0% 31.8% 31.8% 31.8% 31.8%
Tobacco Sector
PT Gudang Garam Tbk.
BUY
We upgrade our NEUTRAL call to BUY on PT Gudang Garam
Tbk (GGRM) with 52-week target price of IDR 60,250. Our TP
represents 15.8% potential upside, pegged to 15.0x FY20F PE (-
1.25SD from its 3-year average PE). Despite the negative
sentiment of the industry post the extreme excise tax coupled with
HJE hike, we believe that all the bad news have already priced in
the significant de-rating of GGRM throughout 2019. Downside risks
to our call are another round of extreme excise tax hike after 2020
and worse-than-expected volume.
Industry volume decline is visible. Due to the significant rise in
excise tax and HJE, we are now assuming 10% YoY industry
cigarette volume decline in 2020. We believe our number is more
toward the grey sky scenario due to the stickiness of cigarette
products. For GGRM, we only assume a 6% decline in volume,
better than the industry considering 1) a strong equity brand for
the low to middle income class, 2) the continuing preference on
SKM FF category which is GGRM’s expertise. This drop would be the
first for GGRM in since 2017, as on average GGRM posted a volume
growth of ~8% for 2017-2019E period.
GGRM’s earnings outlook. Applying our volume assumption with
18.2% ASP increase, we now identify GGRM’s FY20F top-line to
grow by 8.8% YoY. Net profit is expected to observe steep decline
of 19.7% YoY, bringing it close to the 2017-2018’s level on the
reluctancy to aggressively raising ASP. This is as in the last 3
years, we see GGRM’s focus was more toward market share than
profitability. Correspondingly, we forecast GPM/NPM to dip to
16.6%/6.4% in FY20F.
Undemanding valuation coupled with an attractive dividend
yield. Post the significant de-rating, GGRM currently trades at
10.8x PE (below -2SD from its 3-year average). Assuming FY20F
dividend at IDR 2,600/share which is similar to the past 4 years,
we arrive at 5.0% dividend yield. Even so, with significant FY19E
net profit growth of 23.2% YoY, there may be upside risk to our
forecasted dividend yield.
158
Stock Information
Bloomberg Ticker GGRM IJ
52-Week High 100,975
52-Week Low 49,175
FY20F P/E 15.0x
FY20F P/BV 2.2x
Share Outstanding (Mn) 1,924.1
Market Cap. (IDR Tn) 100.1
Share Price Performance
Current Price 52,025
52-Week Target Price 60,250
Upside Potential 15.8%
Highlights (IDR Bn) 2018 2019E 2020F 2021F 2022F
Revenue 95,708 108,833 120,719 131,393 142,420
% growth 14.9% 13.7% 10.9% 8.8% 8.4%
Gross Profit 18,644 21,505 20,033 21,702 23,674
Net Profit 7,792 9,596 7,707 8,316 8,809
% growth 0.5% 23.2% -19.7% 7.9% 5.9%
Gross Margin (%) 19.5% 19.8% 16.6% 16.5% 16.6%
Net Margin (%) 8.1% 8.8% 6.4% 6.3% 6.2%
Return on Equity (%) 17.8% 20.2% 15.1% 15.4% 15.3%
Return on Assets (%) 11.5% 13.3% 9.9% 10.0% 10.0%
EPS (IDR) 4,050 4,987 4,005 4,322 4,578

159
Tobacco | Gudang Garam
Income Statement Cash Flow
Balance Sheet Ratio Analysis and Key Assumptions
(IDR Bn) 2018 2019E 2020F 2021F 2022F
Cash & Equivalents 2,034 2,312 2,245 2,855 2,495
Trade Receivables 1,726 2,619 2,771 2,849 3,261
Inventories 38,560 43,024 48,043 51,594 56,043
Other Current Assets 2,965 2,018 2,614 3,117 3,034
Total CA 45,285 49,973 55,673 60,414 64,834
Fixed Assets 22,759 23,838 23,723 23,663 23,701
Other Non CA 1,054 1,338 1,704 1,639 1,846
Total Assets 69,097 75,149 81,100 85,717 90,380
Short Term Debt 17,322 17,822 19,822 20,322 20,322
Trade Payables 1,130 1,280 1,476 1,608 1,740
Taxes Payable 135 160 257 277 294
Other CL 3,552 3,891 4,702 5,199 5,630
Total CL 22,004 22,994 26,000 27,129 27,693
Other Non CL 1,960 2,429 2,670 2,843 3,137
Total Liabilities 23,964 25,423 28,669 29,973 30,830
Share & APIC 1,016 1,016 1,016 1,016 1,016
Retained Earnings 44,151 48,744 51,448 54,762 58,568
Others (33) (33) (33) (33) (33)
Total Equity 45,133 49,727 52,431 55,744 59,551
Total Liabilities & Equity
69,097 75,149 81,100 85,717 90,380
2018 2019E 2020F 2021F 2022F
Profitability
Gross Margin 19.5% 19.8% 16.6% 16.5% 16.6%
Operating Margin 11.7% 12.4% 9.1% 9.0% 9.1%
EBITDA Margin 14.0% 14.4% 10.9% 10.6% 10.5%
Net Margin 8.1% 8.8% 6.4% 6.3% 6.2%
Liquidity
Current Ratio (x) 2.1 2.2 2.1 2.2 2.3
Quick Ratio (x) 0.2 0.2 0.2 0.2 0.2
Solvency
Debt to Equity (x) 0.4 0.4 0.4 0.4 0.3
Debt to Assets (x) 0.3 0.2 0.2 0.2 0.2
Interest Cov. (x) 16.5 19.5 14.9 15.0 10.6
Valuation
Price to Earnings (x) 14.9 12.1 15.0 13.9 13.2
Price to Book (x) 2.6 2.3 2.2 2.1 1.9
Key Assumptions
Volume (Bn Sticks) 85.2 93.8 88.2 88.6 89.1
% growth 8.3% 10.2% -6.0% 0.5% 0.5%
Blended ASP Est. 1,103 1,141 1,349 1,463 1,579
% growth 5.6% 3.4% 18.2% 8.4% 8.0%
(IDR Bn) 2018 2019E 2020F 2021F 2022F
Revenue 95,708 108,833 120,719 131,393 142,420
% growth 14.9% 13.7% 10.9% 8.8% 8.4%
COGS (77,063) (87,328) (100,687) (109,691) (118,746)
% growth 18.4% 13.3% 15.3% 8.9% 8.3%
Gross Profit 18,644 21,505 20,033 21,702 23,674
% growth 2.3% 15.3% -6.8% 8.3% 9.1%
Operating Expenses (7,551) (8,188) (9,157) (9,957) (10,886)
Opex to Sales (%) -7.9% -7.5% -7.6% -7.6% -7.6%
Other Inc (Exp) 64 170 139 132 177
EBIT 11,157 13,487 11,015 11,878 12,965
% growth -0.7% 20.9% -18.3% 7.8% 9.2%
EBITDA 13,358 15,657 13,130 13,937 14,927
% growth 1.3% 17.2% -16.1% 6.2% 7.1%
Net Financing (678) (692) (739) (789) (1,219)
EBT 10,479 12,794 10,276 11,088 11,745
% growth 0.4% 22.1% -19.7% 7.9% 5.9%
Tax Expenses (2,686) (3,199) (2,569) (2,772) (2,936)
Net Income 7,793 9,596 7,707 8,316 8,809
% growth 0.5% 23.1% -19.7% 7.9% 5.9%
EPS (IDR) 4,050 4,987 4,005 4,322 4,578
(IDR Bn) 2018 2019E 2020F 2021F 2022F
Net Income 7,792 9,596 7,707 8,316 8,809
Dep. & Amortization 2,190 2,170 2,115 2,060 1,963
Chg. In NWC 855 (3,921) (4,760) (3,503) (4,216)
CF from Operating 10,837 7,846 5,062 6,873 6,556
Capital Expenditure (4,037) (3,250) (2,000) (2,000) (2,000)
Chg. in LT Assets 533 (284) (367) 65 (207)
Others 481 - - - -
CF from Investing (3,024) (3,534) (2,367) (1,935) (2,207)
Chg. in Share & APIC - - - - -
Chg. in Debt (3,278) 500 2,000 500 -
Dividends Paid (5,003) (5,003) (5,003) (5,003) (5,003)
Others 172 469 241 173 293
CF from Financing (8,108) (4,034) (2,762) (4,329) (4,709)
Chg. in Cash (295) 278 (67) 610 (360)
Beginning Cash 2,329 2,034 2,312 2,245 2,855
Ending Cash 2,034 2,312 2,245 2,855 2,495

160
This page is intentionally left blank

161
Miscellaneous

DŝƐĐĞůůĂŶĞŽƵƐ^ĞĐƚŽƌ
Wd<ZŽƌƉŽƌŝŶĚŽdďŬ
EhdZ>
:H UHLWHUDWH RXU 1(875$/ FDOO RQ $.5$ ZLWK )< WDUJHWSULFHRI,'52XUWDUJHWSULFHLPSOLHV[)<3(-6'IURPLWV-\HDUDYHUDJH3(RI[2XUYDOXDWLRQLVEDVHGRQEOHQGHGKDOI-6273'&)IRUQRQ--,,3(GLVFWR1$9IRU-,,3(DQGKDOI-3( PXOWLSOHV PHWKRGRORJ\ 2YHUDOO ZH DUH SRVLWLYH IRU WKHODWHVWGHYHORSPHQWRQ-,,3(EXVLQHVVDQG LWV IXWXUH+RZHYHUZHKDYH D FRQFHUQ DERXW WKH ORQJ-WHUP JURZWK RI WKH SHWUROGLVWULEXWLRQ EXVLQHVV DV FRDO SURGXFWLRQ PLJKW GHFHOHUDWH GXH WRORZHUFDSH[RQKHDY\HTXLSPHQWLQ)< 7KHSURPLVLQJSURVSHFWRI-,,3(*RLQJIRUZDUGZHEHOLHYHWKDWWKHUH DUH WZR WKLQJV WKDW DUH LPSRUWDQW IRU -,,3( SURVSHFW 37)UHHSRUW ,QGRQHVLD 37), VPHOWHU SURMHFW DQG WKH SRWHQWLDO RIODUJH ODQG VDOHV aKD WR IRUHLJQ LQYHVWRUV IXUWKHU FODULW\ RQ0R8 UHDOL]DWLRQ QHHGHG 6SHDNLQJ RI 37),¶V VPHOWHU $.5$ KDVKDQGHGRYHUKDODQGVLQFH0D\WR37),ZLWKDUHQW-FKDUJHRI 86' VTP DQG WKH ODQG LV FXUUHQWO\ XQGHU JURXQGZRUN WRLPSURYHWKHVRLOVWDWH7KHUHQWIURP37),ZLOOFRQWULEXWHWR$.5$¶VUHYHQXHRIDSSUR[LPDWHO\ ,'5EQ\HDUZLWK WKH ILUVWSD\PHQWWREHUHFHLYHG LQ4)RUWKH OD\GRZQDUHDRIKDZKLFKZLOOEH XVHG SURJUHVVLYHO\ GXULQJ FRQVWUXFWLRQ SURJUHVV $.5$ ZLOOFKDUJH37),ZLWKWKHVDPHUHQWDOSULFHRI86'VTP/DWHUXSRQFRPSOHWLRQ37),KDVDQRSWLRQWREX\WKHODQGZLWKDSULFHRI86'VTP%HVLGHV$.5$SODQVWREXLOGD86'PQ-0:JDV-ILUHGSRZHUSODQWZLWKDQRIIWDNHDJUHHPHQWZLWK37), *URZWK LQ SHWUROHXP YROXPH DQG QRUPDOL]LQJPDUJLQ$VRI0$.5$SHWUROHXPVDOHVYROXPHZDVUHFRUGHGDWPQ./-<R<+RZHYHUGXULQJ4SHWUROYROXPHSRVWHG LWV ILUVWSRVLWLYH TXDUWHUO\ JURZWK LQ 0RYLQJ LQWR 4 $.5$ ZDVRSWLPLVWLF WR UHFRUG HYHQ D VWURQJHU SHWURO YROXPH JURZWK DQGWDUJHW )< SHWURO YROXPH WR EH DW PQ ./ 0RUHRYHU $.5&RUSRULQGR ZLOO EH EDFN WR EHFRPH WKH GLVWULEXWRU RI VXEVLGL]HGGLHVHO LQZLWKQHZIRUPXODIRUPHGDQGDTXRWDDOORFDWLRQRI ./ *RLQJ IRUZDUG ZH EDNHG LQ FRQVHUYDWLYH JURZWK RQ$.5$GLVWULEXWLRQEXVLQHVVZLWKPLG-VLQJOH-GLJLWJURZWKDQGH[SHFWWKHPDUJLQWREHQRUPDOL]HGDVWKHIHH-EDVHGFOLHQWLVEDFNDQGWKHFRPSDQ\UHWXUQVWRWKHVXEVLGL]HGGLHVHOGLVWULEXWLRQEXVLQHVV
^ƚŽĐŬ/ŶĨŽƌŵĂƟŽŶ
ůŽŽŵďĞƌŐdŝĐŬĞƌ <Z/:
ϱϮ-tĞĞŬ,ŝŐŚ ϱϴϳϱ
ϱϮ-tĞĞŬ>Žǁ ϯϮϮϬ
&zϮϬ&W ϭϲϯdž
&zϮϬ&Ws ϭϴdž
^ŚĂƌĞKƵƚƐƚĂŶĚŝŶŐ;DŶͿ ϰϬϭϰϳ
DĂƌŬĞƚĂƉ;/ZdŶͿ ϭϱϰ
^ŚĂƌĞWƌŝĐĞWĞƌĨŽƌŵĂŶĐĞ
ƵƌƌĞŶƚWƌŝĐĞ ϯϴϰϬ
ϱϮ-tĞĞŬdĂƌŐĞƚWƌŝĐĞ ϯϵϬϬ
йŚĂŶŐĞ ϭϲй
+LJKOLJKWV,'5%Q ( ) ) )
5HYHQXH
JURZWK -
*URVVSURILW
(%,7'$
1HWSURILW
JURZWK -
(36,'5
*URVVPDUJLQ
2SHUDWLQJPDUJLQ
1HWPDUJLQ
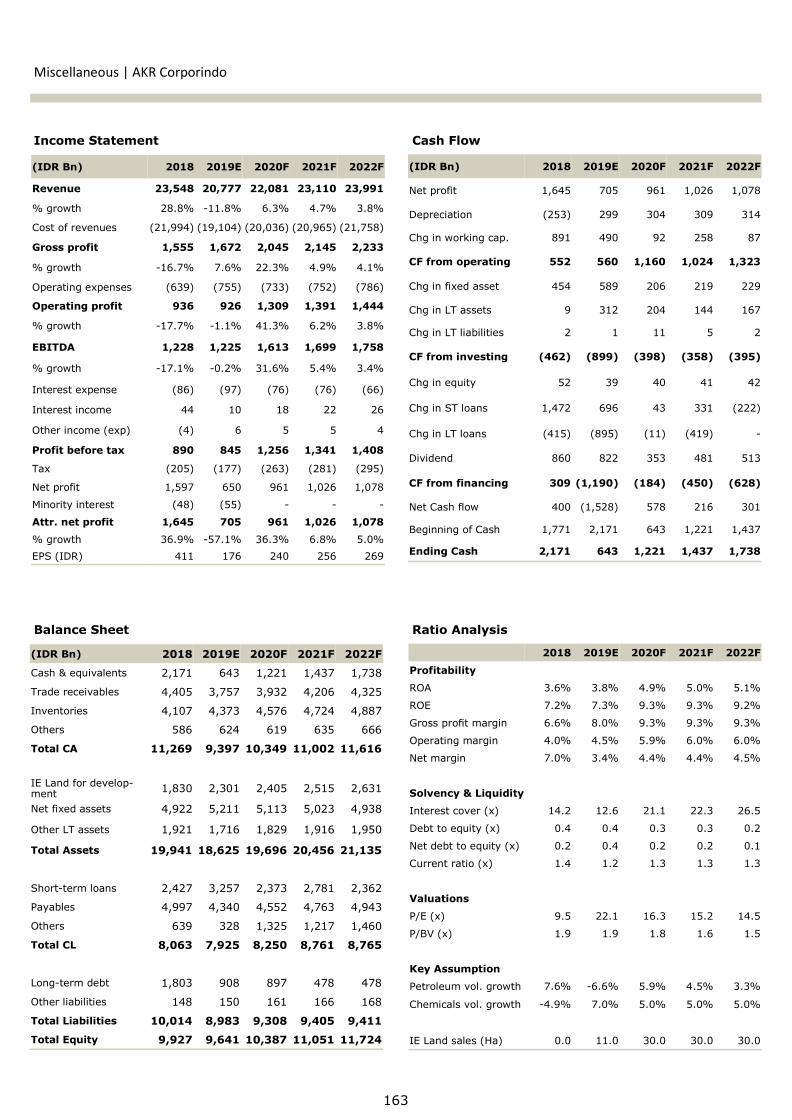
,QFRPH6WDWHPHQW &DVK)ORZ
%DODQFH6KHHW 5DWLR$QDO\VLV
DŝƐĐĞůůĂŶĞŽƵƐ<ZŽƌƉŽƌŝŶĚŽ
( ) ) )
3URILWDELOLW\
52$
52(
*URVVSURILWPDUJLQ
2SHUDWLQJPDUJLQ
1HWPDUJLQ
6ROYHQF\/LTXLGLW\
,QWHUHVWFRYHU[
'HEWWRHTXLW\[
1HWGHEWWRHTXLW\[
&XUUHQWUDWLR[
9DOXDWLRQV
3([
3%9[
.H\$VVXPSWLRQ
3HWUROHXPYROJURZWK -
&KHPLFDOVYROJURZWK -
,(/DQGVDOHV+D
,'5%Q ( ) ) )
1HWSURILW
'HSUHFLDWLRQ
&KJLQZRUNLQJFDS
&)IURPRSHUDWLQJ
&KJLQIL[HGDVVHW
&KJLQ/7DVVHWV
&KJLQ/7OLDELOLWLHV
&)IURPLQYHVWLQJ
&KJLQHTXLW\
&KJLQ67ORDQV
&KJLQ/7ORDQV -
'LYLGHQG
&)IURPILQDQFLQJ
1HW&DVKIORZ
%HJLQQLQJRI&DVK
(QGLQJ&DVK
,'5%Q ( ) ) )
5HYHQXH
JURZWK -
&RVWRIUHYHQXHV
*URVVSURILW
JURZWK -
2SHUDWLQJH[SHQVHV
2SHUDWLQJSURILW
JURZWK - -
(%,7'$
JURZWK - -
,QWHUHVWH[SHQVH
,QWHUHVWLQFRPH
2WKHULQFRPHH[S
3URILWEHIRUHWD[
7D[
1HWSURILW
0LQRULW\LQWHUHVW - - -
$WWUQHWSURILW
JURZWK -
(36,'5
,'5%Q ( ) ) )
&DVKHTXLYDOHQWV
7UDGHUHFHLYDEOHV
,QYHQWRULHV
2WKHUV
7RWDO&$
,(/DQGIRUGHYHORSPHQW
1HWIL[HGDVVHWV
2WKHU/7DVVHWV
7RWDO$VVHWV
6KRUW-WHUPORDQV
3D\DEOHV
2WKHUV
7RWDO&/
/RQJ-WHUPGHEW
2WKHUOLDELOLWLHV
7RWDO/LDELOLWLHV
7RWDO(TXLW\

Miscellaneous Sector
PT Blue Bird Tbk.
BUY
We maintain our BUY recommendation on PT Blue Bird Tbk.
(BIRD) with 52-week target price of IDR 3,500. Our TP
provides 21.1% upsides and implies 22.0x/19.0x FY20F/FY21F PE.
Due to several one-off demonstrations in 9M19, we believe
earnings have bottomed and we expect earnings recovery
momentum to play out from FY20 onwards. Rising utilization rate,
easing competition with online ride-hailing, increasing tariff, and
gradual impact from IoT investment will drive earnings in years
ahead. We forecast BIRD’s earnings to grow by 15% CAGR in the
next five years along with steady improvement in margin.
Downside risks to our call are lower than expected utilization rate
and rising fuel price.
Path to recovery. We believe BIRD earnings have bottomed in
9M19 (NPAT at IDR 229 bn, -31% YoY) after a series of unexpected
events this year that hampered its top-line growth (decline in
domestic airline passenger and several demonstrations). FY20
should set a smooth track for earnings to recover in years ahead
supported by higher utilization rate (69% in FY20 vs 67% in FY19),
easing competition with online ride-hailing, and implementation of
even-odd extension policy. In addition, recent 6% tariff hike for
Jakarta area gives a significant positive catalyst that could boost
earnings next year. Non-taxi business should also provide solid
growth ahead supported by Cititrans rapid expansion to several
other routes. We forecast BIRD’s earnings to jump by 24% next
year (due to low base in FY19) with steady 15% CAGR growth for
the next five years.
Stake acquisition plan by Go-jek. Bloomberg recently reported
that Go-jek is nearing an agreement with the company to purchase
5% stake on BIRD for USD 30 mn. This implies a valuation of IDR
3,420 price per share, 2% below our current target price. We view
the stake acquisition to be a positive catalyst for the stock as it
should provide further synergies and new paths for collaboration
between the two.
Valuation. Our target price of IDR 3,500 per share is derived from
DCF based valuation (11% WACC and 4% terminal growth). BIRD
is currently trading at 18.0x/15.6x FY20F/FY21F forward PE.
164
Stock Information
Bloomberg Ticker BIRD IJ
52-Week High 3,550
52-Week Low 1,960
FY20F P/E 22.0x
FY20F P/BV 1.3x
Share Outstanding (Mn) 2,502.1
Market Cap. (IDR Tn) 7.2
Share Price Performance
Current Price 2,890
52-Week Target Price 3,500
% Change 21.1%
Highlights (IDR Bn) 2018 2019E 2020F 2021F 2022F
Revenue 4,219 4,084 4,341 4,658 4,977
% growth 0.4% -3.2% 6.3% 7.3% 6.9%
Gross Profit 1,180 1,139 1,282 1,424 1,560
Net Profit 457 325 402 463 521
% growth 7.6% -28.9% 23.6% 15.3% 12.4%
Gross Margin (%) 28.0% 27.9% 29.5% 30.6% 31.3%
Net Margin (%) 10.8% 8.0% 9.3% 9.9% 10.5%
Return on Equity (%) 8.7% 6.0% 7.0% 7.7% 8.2%
Return on Assets (%) 6.8% 4.8% 5.7% 6.3% 6.6%
EPS 183 130 161 185 208

165
Income Statement Cash Flow
Balance Sheet Ratio Analysis
Miscellaneous | Blue Bird
(IDR Bn) 2018 2019E 2020F 2021F 2022F
Cash & Equivalents 797 958 1,259 1,635 2,066
Trade Receivables 235 238 253 272 290
Other Current Asset 32 31 33 36 38
Total CA 1,064 1,228 1,546 1,942 2,395
Fixed assets 5,395 5,257 5,193 5,175 5,153
Other 220 241 267 287 292
Total Assets 6,680 6,726 7,005 7,404 7,840
Trade payables 83 82 87 93 99
Short Term Loans 211 163 152 163 174
Other CL 99 96 102 110 117
Total CL 393 341 341 366 390
Long Term Loans 422 327 304 326 348
Other 634 613 652 700 748
Total Liabilities 1,448 1,281 1,297 1,391 1,486
Share & APIC 2,763 2,763 2,763 2,763 2,763
Retained Earnings 2,390 2,601 2,862 3,164 3,502
NCI 78 80 83 86 89
Total Equity 5,231 5,445 5,708 6,012 6,354
Total Equity & Lia-bilities
6,680 6,726 7,005 7,404 7,840
2018 2019E 2020F 2021F 2022F
Profitability
ROE 8.7% 6.0% 7.0% 7.7% 8.2%
ROA 6.8% 4.8% 5.7% 6.3% 6.6%
Gross Margin 28.0% 27.9% 29.5% 30.6% 31.3%
Operating Margin 13.2% 10.2% 11.7% 12.7% 13.4%
Net Profit Margin 10.8% 8.0% 9.3% 9.9% 10.5%
Liquidity
Current Ratio 2.7 3.6 4.5 5.3 6.1
Debt to Equity 0.1 0.1 0.1 0.1 0.1
Debt to Assets 0.1 0.1 0.1 0.1 0.1
Valuation
Price to Earning (PE) 19.3 27.2 22.0 19.1 16.9
Price to Book (PBV) 1.3 1.3 1.3 1.2 1.1
Key Assumptions
Utilization rate 67% 67% 69% 70% 70%
Avg fleet operational 15,434 15,330 15,996 15,997 15,998
Avg revenue (car/day) 624,420 627,542 658,919 691,865 726,458
(IDR Bn) 2018 2019E 2020F 2021F 2022F
Revenue 4,219 4,084 4,341 4,658 4,977
Direct cost 3,039 3,004 3,191 3,423 3,627
Gross Profit 1,180 1,139 1,282 1,424 1,560
Operating Expense 621 723 774 833 891
Gain on disposals 26 15 19 19 19
Penalties and claims 16 17 18 20 21
Other 46 48 51 55 59
EBIT 646 497 596 685 768
EBITDA 818 664 764 856 941
Net Financing (43) (57) (50) (53) (57)
EBT 606 439 546 632 711
Tax 146 112 141 166 187
NCI 3 2 2 3 3
Net Profit 457 325 402 463 521
(IDR Bn) 2018 2019E 2020F 2021F 2022F
Net Income 457 325 402 463 521
Depreciation 172 167 168 171 173
Chg. in NWC 45 (7) (6) (7) (8)
CF from Operating 674 486 564 627 686
Capital Expenditure 39 (30) (104) (153) (151)
Chg. in LT Assets (81) (21) (26) (20) (5)
Chg. in LT Liabilities (21) (20) 39 48 48
CF from Investing (63) (71) (91) (125) (109)
Chg. in Share & APIC - - - - -
Chg. in ST Loans (58) (48) (11) 11 11
Chg. in LT Loans (73) (95) (23) 22 22
Dividends Paid (160) (114) (141) (162) (182)
Others 3 2 2 3 3
CF from Financing (288) (255) (172) (126) (146)
Beginning Cash 474 797 958 1,259 1,635
Change in Cash 323 161 301 375 432
Ending Cash 797 958 1,259 1,635 2,066

DŝƐĐĞůůĂŶĞŽƵƐ^ĞĐƚŽƌ
Wd:ĂƐĂDĂƌŐĂdďŬ
EhdZ>
$SSURDFKLQJ WKH WDLOHQGRI FDSH[F\FOH -605VSHQWDWRWDORI,'5WQLQ)<-)<UHSUHVHQWLQJa[)<¶VHTXLW\DQGa[RI UHYHQXH RQ WKH EDFN RI EXLOGLQJ 7UDQV -DYD WROO URDGV :HSUHGLFW WKDW WKH FDSH[ F\FOH LV DSSURDFKLQJ LWV HQG ZLWK )<(FDSH[ RI ,'5WQ VXEVLGLQJ E\ ,'5WQ DQQXDOO\ WLOO )<) DVFRPSDQ\SODQV WREXLOGDQDGGLWLRQDONPRI WROO URDGV LQ)<)-2550DQDGR - %LWXQJ DQG DQRWKHU NP LQ )<) - )<)%RJRU5LQJ5RDG-DNDUWD-&LNDPSHN6RXWKDQGPRUHZKLFKLV PRUH PRGHUDWH FRPSDUHG RI )<)<( DGGLWLRQ RINPNP:HYLHZWKHVXEVLGLQJFDSH[OHYHOWREHDSRVLWLYHDV)&))ZLOOWXUQJUHHQLQ)<)WR,'5WQ 1HZWROOURDGVSLFNLQJXSSDFH:HEDNHLQRIWROOUHYHQXHJURZWKLQ)<()<))<)ZLWKWKHUDSLGJURZWKGULYHQ E\ QHZ WROO URDGV JURZLQJ DW D &$*5 LQ )<( -)<)PXFKKLJKHUWKDQQHZWROOURDGV&$*5%\)<)QHZWROO URDGV ZLOO FRPSULVH RI WROO UHYHQXH YHUVXV LQ)< 2XU HVWLPDWHV DUH FRQVHUYDWLYH DV ZH REVHUYH WKHGHYHORSPHQWVRIFRQQHFWLYLW\IXUWKHU 3HDNLQJ OHYHUDJH*HDULQJUDWLRZLOOUHPDLQHOHYDWHGLQ)<)DW[YHUVXV0RI[ZLWK)<)LQWHUHVWH[SHQVHULVLQJ<R<WR,'5WQ+RZHYHUDV)&))WXUQVSRVLWLYHLWVKRXOGSURYLGH-605ZLWKWKHURRPWRVORZO\GHOHYHUDJH$QDGGLWLRQDOEULJKWVSRWVWHPVIURPLWVZHLJKWHGDYHUDJHFRVWRIGHEWWKDWKDVLPSURYHGWRDVRI0YHUVXVRQ-DQ$SRVLWLYHFDWDO\VW IRU-605LV%,'555FXWVZKLFKZLOODOOHYLDWHILQDQFHH[SHQVH :H PDLQWDLQ RXU 1(875$/ FDOO RQ 37 -DVD 0DUJD 7EN-605ZLWKDQHQG-RI-)<WDUJHWSULFHRI,'52XU73LPSOLHV [ )<) 3%9 VOLJKWO\ DERYH - 6' RI LWV \HDUDYHUDJHDQG[IRUZDUG(9(%,7'$ZKLFKLVQHDU6'RILWV\HDUPHDQ:HDUHVOLJKWO\PRUHEHDULVKWKDQWKHVWUHHWGXHWRFDSH[ZKLFK LVWDSHULQJGRZQEXWUHPDLQVKLJKDQGKLJK OHYHUDJHWKDW ZLOO WDNH VRPH WLPH WR UHGXFH 2Q WKH EULJKW VLGH -605¶VH[SDQVLRQZLOOEHDUIUXLWLQWKHORQJUXQDVWUDIILFSLFNVXS8SVLGHGRZQVLGH ULVNV WRRXU FDOO DUHRYHUEHORZ WUDIILFYROXPH UDPSXSLQQHZWROOURDGVDQGFRQWUDFWLQJH[WHQGLQJFDSH[F\FOHDQGVXFFHVVIXODVVHWGLYHVWPHQWV
^ƚŽĐŬ/ŶĨŽƌŵĂƟŽŶ
ůŽŽŵďĞƌŐdŝĐŬĞƌ :^DZ/:
ϱϮ-tĞĞŬ,ŝŐŚ ϲϰϱϬ
ϱϮ-tĞĞŬ>Žǁ ϰϮϲϬ
&zϮϬ&W ϮϬϯdž
&zϮϬ&Ws Ϯϭdž
^ŚĂƌĞKƵƚƐƚĂŶĚŝŶŐ;DŶͿ ϳϮϱϳϵ
DĂƌŬĞƚĂƉ;/ZdŶͿ ϯϳϵ
^ŚĂƌĞWƌŝĐĞWĞƌĨŽƌŵĂŶĐĞ
ƵƌƌĞŶƚWƌŝĐĞ ϱϮϮϱ
ϱϮ-tĞĞŬdĂƌŐĞƚWƌŝĐĞ ϱϳϬϬ
йŚĂŶŐĞ ϵϭй
+LJKOLJKWV,'5%Q ( ) ) )
5HYHQXH
JURZWK
*URVV3URILW
1HW3URILW
JURZWK - -
*URVV0DUJLQ
1HW0DUJLQ
5HWXUQRQ(TXLW\
5HWXUQRQ$VVHWV
(36,'5
^ŚĂƌĞWƌŝĐĞWĞƌĨŽƌŵĂŶĐĞ
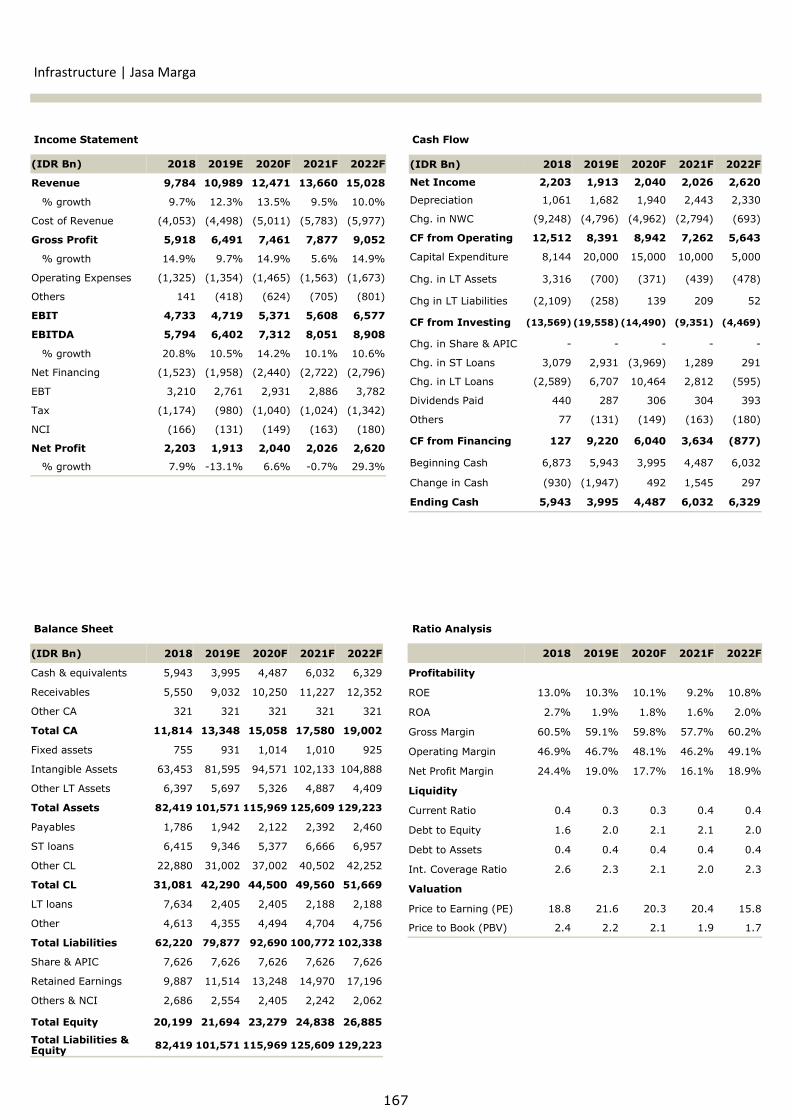
/ŶĨƌĂƐƚƌƵĐƚƵƌĞ:ĂƐĂDĂƌŐĂ
,'5%Q ( ) ) )
&DVKHTXLYDOHQWV
5HFHLYDEOHV
2WKHU&$
7RWDO&$
)L[HGDVVHWV
,QWDQJLEOH$VVHWV
2WKHU/7$VVHWV
7RWDO$VVHWV
3D\DEOHV
67ORDQV
2WKHU&/
7RWDO&/
/7ORDQV
2WKHU
7RWDO/LDELOLWLHV
6KDUH$3,&
5HWDLQHG(DUQLQJV
2WKHUV1&,
7RWDO(TXLW\
7RWDO/LDELOLWLHV(TXLW\
( ) ) )
3URILWDELOLW\
52(
52$
*URVV0DUJLQ
2SHUDWLQJ0DUJLQ
1HW3URILW0DUJLQ
/LTXLGLW\
&XUUHQW5DWLR
'HEWWR(TXLW\
'HEWWR$VVHWV
,QW&RYHUDJH5DWLR
9DOXDWLRQ
3ULFHWR(DUQLQJ3(
3ULFHWR%RRN3%9
,'5%Q ( ) ) )
5HYHQXH
JURZWK
&RVWRI5HYHQXH
*URVV3URILW
JURZWK
2SHUDWLQJ([SHQVHV
2WKHUV
(%,7
(%,7'$
JURZWK
1HW)LQDQFLQJ
(%7
7D[
1&,
1HW3URILW
JURZWK - -
,'5%Q ( ) ) )
1HW,QFRPH
'HSUHFLDWLRQ
&KJLQ1:&
&)IURP2SHUDWLQJ
&DSLWDO([SHQGLWXUH
&KJLQ/7$VVHWV
&KJLQ/7/LDELOLWLHV
&)IURP,QYHVWLQJ
&KJLQ6KDUH$3,& - - - - -
&KJLQ67/RDQV
&KJLQ/7/RDQV
'LYLGHQGV3DLG
2WKHUV
&)IURP)LQDQFLQJ
%HJLQQLQJ&DVK
&KDQJHLQ&DVK
(QGLQJ&DVK
,QFRPH6WDWHPHQW &DVK)ORZ
%DODQFH6KHHW 5DWLR$QDO\VLV

SINARMAS SEKURITAS INVESTMENT RATINGS GUIDE BUY: Share price may rise by more than 15% over the next 12 months. ADD: Share price may range between 10% to 15% over the next 12 months. NEUTRAL: Share price may range between –10% to +10% over the next 12 months. REDUCE: Share price may range between –10% to –15% over the next 12 months. SELL: Share price may fall by more than 15% over the next 12 months. DISCLAIMER This report has been prepared by PT Sinarmas Sekuritas, an affiliate of Sinarmas Group. This material is: (i) created based on information that we consider reliable, but we do not represent that it is accurate or complete, and it should not be relied upon as such; (ii) for your private information, and we are not soliciting any action based upon it; (iii) not to be construed as an offer to sell or a solicitation of an offer to buy any security. Opinions expressed are current opinions as of original publication date appearing on this material and the information, including the opinions contained herein, is subjected to change without notice. The analysis contained herein is based on numerous assumptions. Different assumptions could result in materially different results. The analyst(s) responsible for the preparation of this publication may interact with trading desk personnel, sales personnel and other constituencies for the purpose of gathering, integrating and interpreting market information. Research will initiate, update and cease coverage solely at the discretion of Sinarmas Research department. If and as applicable, Sinarmas Sekuritas’ investment banking relationships, investment banking and non-investment banking compensation and securities ownership, if any, are specified in disclaimers and related disclosures in this report. In addition, other members of Sinarmas Group may from time to time perform investment banking or other services (including acting as advisor, manager or lender) for, or solicit investment banking or other business from companies under our research coverage. Further, the Sinarmas Group, and/or its officers, directors and employees, including persons, without limitation, involved in the preparation or issuance of this material may, to the extent permitted by law and/or regulation, have long or short positions in, and buy or sell, the securities (including ownership by Sinarmas Group), or derivatives (including options) thereof, of companies under our coverage, or related securities or derivatives. In addition, the Sinarmas Group, including Sinarmas Sekuritas, may act as market maker and principal, willing to buy and sell certain of the securities of companies under our coverage. Further, the Sinarmas Group may buy and sell certain of the securities of companies under our coverage, as agent for its clients. Investors should consider this report as only a single factor in making their investment decision and, as such, the report should not be viewed as identifying or suggesting all risks, direct or indirect, that may be associated with any investment decision. Recipients should not regard this report as substitute for exercise of their own judgment. Past performance is not necessarily a guide to future performance. The value of any investments may go down as well as up and you may not get back the full amount invested. Sinarmas Sekuritas specifically prohibits the redistribution of this material in whole or in part without the written permission of Sinarmas Sekuritas and Sinarmas Sekuritas accepts no liability whatsoever for the actions of third parties in this respect. If publication has been distributed by electronic transmission, such as e-mail, then such transmission cannot be guaranteed to be secure or error-free as information could be intercepted, corrupted, lost, destroyed, arrive late or incomplete, or contain viruses. The sender therefore does not accept liability for any errors or omissions in the contents of this publication, which may arise as a result of electronic transmission. If verification is required, please request a hard-copy version. Additional information is available upon request. Images may depict objects or elements which are protected by third party copyright, trademarks and other intellectual properties.
©Sinarmas Sekuritas(2020). All rights reserved.

Equity Research Team
Sinarmas Sekuritas | Equity Research Team

Related Documents