Simultaneous OH-PLIF and Schlieren Imaging of Flame Acceleration in an Obstacle-Laden Channel L.R. Boeck a , M. Kellenberger b , G. Rainsford b , G. Ciccarelli b a Graduate Aerospace Laboratories, California Institute of Technology, Pasadena, CA 91125, USA b Department of Mechanical and Materials Engineering, Queen’s University, Kingston, ON K7L 3N6, CANADA Proceedings of the Combustion Institute (2016) Author’s manuscript http://dx.doi.org/10.1016/j.proci.2016.06.096 Corresponding Author L.R. Boeck California Institute of Technology 1200 E. California Blvd. MC 205-45 Pasadena, CA 91125 USA E-mail: [email protected] Preprint submitted to Elsevier July 12, 2016

Welcome message from author
This document is posted to help you gain knowledge. Please leave a comment to let me know what you think about it! Share it to your friends and learn new things together.
Transcript
Simultaneous OH-PLIF and Schlieren Imaging ofFlame Acceleration in an Obstacle-Laden Channel
L.R. Boecka, M. Kellenbergerb, G. Rainsfordb, G. Ciccarellib
aGraduate Aerospace Laboratories, California Institute of Technology, Pasadena, CA 91125, USAbDepartment of Mechanical and Materials Engineering, Queen’s University, Kingston, ON K7L 3N6,
CANADA
Proceedings of the Combustion Institute (2016)Author’s manuscript
http://dx.doi.org/10.1016/j.proci.2016.06.096
Corresponding AuthorL.R. Boeck
California Institute of Technology
1200 E. California Blvd. MC 205-45
Pasadena, CA 91125 USA
E-mail: [email protected]
Preprint submitted to Elsevier July 12, 2016

Abstract
Flame acceleration in stoichiometric H2/O2 at 12 and 25 kPa initial pressure in an obstacle-laden square cross-section
channel was studied experimentally using planar laser-induced fluorescence imaging of hydroxyl radicals (OH-PLIF) and
simultaneous high-speed schlieren imaging. Results were obtained resolving the explosion front structure as it develops
immediately after ignition as a slow-flame to the eventual formation of a shock-flame complex in the fast-flame regime.
The images provide a novel level of detail and allow for the determination of the effects of turbulence-flame and shock-
flame interaction. In the slow-flame regime, vortex shedding off obstacle edges occurs over long time-scales, vortices are
convected downstream and turbulent combustion takes place in the obstacle wakes. The fast-flame regime is marked by the
presence of compression waves (and shock waves) which interact with the flame and cause macroscopic deformation of the
flame and small-scale wrinkling due to Richtmyer-Meshkov instability. A quasi-steady fast-flame is characterized by the
close proximity of the precursor shock and the turbulent flame. The flow-field that governs the flame shape is established
by the precursor shock. Shock-flame interactions lead to flame front perturbations on both small and large scales. The
OH-PLIF technique makes it possible to discern the flame front from other density interfaces that appear in the complex
fast-flame structure observed in schlieren images and also eliminates the line-of-sight integration limitation.
Keywords: Explosions; Flame Acceleration; Hydrogen; OH-PLIF; Schlieren imaging
1. Introduction
The potential for an explosion involving the accidental release of a gaseous fuel represents a major hazard
for industries that produce, transport, store or process explosive gases. In contrast to more common fires, the
hazard is associated with high explosion overpressure rather than high combustion temperature. As early as
1881, Berthelot and Vieille [1] and Mallard and Le Chatelier [2] observed flame acceleration in gaseous ex-
plosions in tubes; the process of flame acceleration has been investigated in great detail ever since. The recent
review by Ciccarelli and Dorofeev [3] summarizes the current state of knowledge and illustrates the complexity
of the phenomenon. In the case of closed-end ignition in a tube, the flame propagation process involves sev-
eral phases where different fluid dynamic phenomena affect the structure of the explosion front. Shortly after
ignition, a laminar flame front propagates into the fresh mixture. During this phase the flame may be wrinkled
by hydrodynamic Landau-Darrieus instability. At the same time, diffusive-thermal effects will either stabilize
or destabilize it, depending on the mixture Lewis number. In the case of diffusive-thermally unstable mixtures,
cellular flames are observed as described, amongst others, by Clavin [4], Hertzberg [5] and Bradley et al. [6].
Flow is generated ahead of the flame as a result of the thermal expansion of the combustion products. This
unburnt gas flow interacts with solid boundaries. At sufficiently high flow velocity, or Reynolds number, turbu-
lence is generated in regions such as wall boundary layers or by vortex shedding off obstacle edges. The flame
interacts with these vortices increasing the volumetric burning rate, manifesting itself as an acceleration of the
leading-edge of the flame. An exponential increase in flame speed over distance is often observed in this initial
2
phase. When the unburnt gas velocity approaches the sound speed in the fresh mixture, compressibility effects
become important and the rate of flame acceleration attains a roughly constant value [7]. Shocks form ahead of
the flame by the merging of pressure waves generated by the accelerating flame. These shocks precompress the
unburnt mixture which increases the burning rate. Gamezo et al. [8] found an enhancement factor of 10-20 in
the overall burning rate associated with shock precompression during the later stage of the flame acceleration
process leading up to the fast-flame regime. Shocks reflect off the geometric boundaries and interact with the
flame, causing both a macroscopic deformation of the flame and flame wrinkling through Richtmyer-Meshkov
(RM) instability. Thomas et al. [9] experimentally demonstrated the great potential of shock-flame interactions
to accelerate a flame. Kholkhlov et al. [10] showed that the interaction of a single shock with a flame induces
flame wrinkling across a wide range of scales through RM instability. However, smaller scale perturbations
dissipate quickly so that mainly large-scale RM instability increases the volumetric burning rate. Eventually, the
flame speed asymptotically approaches a velocity of the order of the sound speed in the combustion products,
referred to as the fast-flame regime. It is characterized by a close coupling of a precursor shock and a turbulent
flame. Transition to detonation is possible if a range of criteria is met as discussed by Ciccarelli and Dorofeev
[3].
While the general physical mechanism of flame acceleration is believed to be understood, the current chal-
lenge is to derive models (analytical and numerical) capable of predicting explosions in real-world scenarios on
an industrial scale. Difficulties are encountered due to the wide range of spatial and temporal scales that need
to be modeled. Due to these demanding requirements, predictive capabilities of available codes are insufficient,
especially when turbulence and shock-flame interactions are important. The need for experimental validation
data is evident. Conventional techniques measuring flame speed and overpressure have been sufficient for the
validation of analytical models and lumped parameter codes in the past. Nowadays, the thorough validation of
numerical simulations requires detailed information on flow and flame dynamics. Advanced optical techniques
can help to obtain such data, resolving for instance, turbulence-flame and shock-flame interactions during flame
acceleration. Schlieren imaging, the most common visualization technique, highlights spatial density gradients,
i.e., those associated with a shock wave and a flame. The main drawback is line-of-sight integration which
hinders the unambiguous characterization of three-dimensional flames. Planar laser-induced fluorescence imag-
ing of hydroxyl radicals (OH-PLIF) overcomes this limitation and allows for direct visualization of the flame
structure.
This paper presents results from simultaneous OH-PLIF and schlieren imaging of flame propagation in a
square obstacle-laden channel in stoichiometric H2/O2 mixture at initial pressures of 12 and 25 kPa. A novel
level of detail was obtained, resolving the flame structure and the consequence of turbulence-flame and shock-
flame interactions.
3
2. Experiment
2.1. Explosion channel
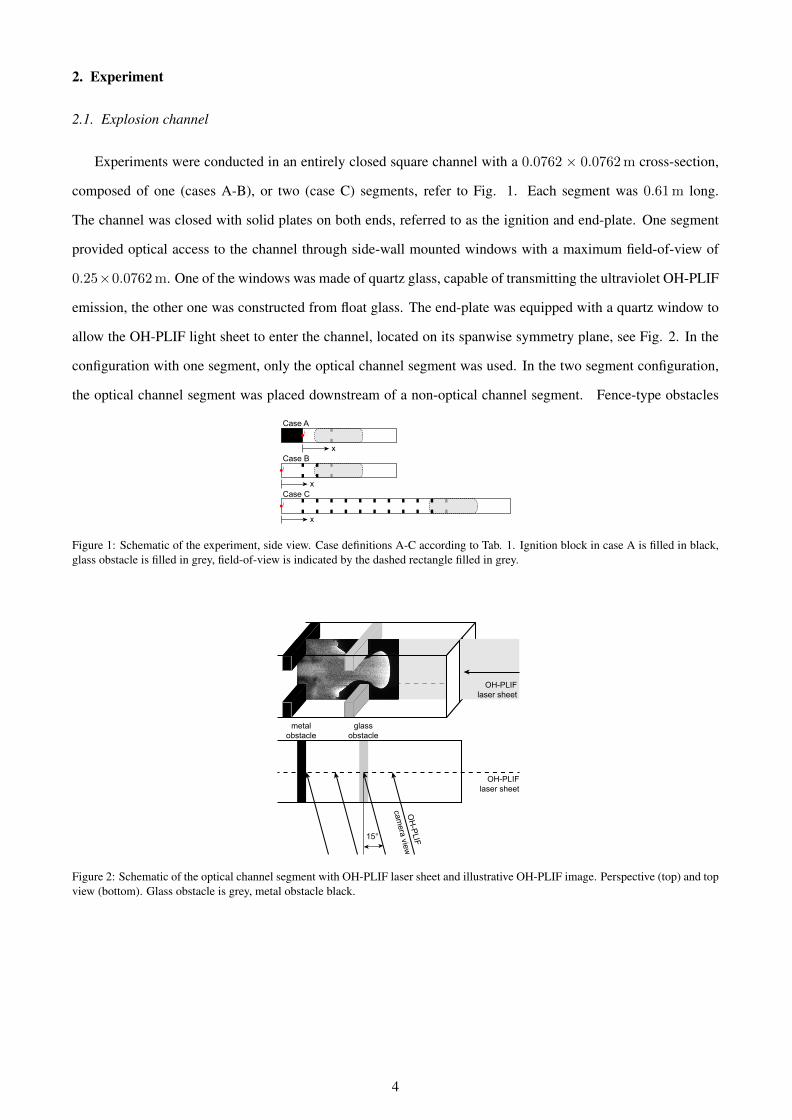
Experiments were conducted in an entirely closed square channel with a 0.0762 × 0.0762 m cross-section,
composed of one (cases A-B), or two (case C) segments, refer to Fig. 1. Each segment was 0.61 m long.
The channel was closed with solid plates on both ends, referred to as the ignition and end-plate. One segment
provided optical access to the channel through side-wall mounted windows with a maximum field-of-view of
0.25×0.0762 m. One of the windows was made of quartz glass, capable of transmitting the ultraviolet OH-PLIF
emission, the other one was constructed from float glass. The end-plate was equipped with a quartz window to
allow the OH-PLIF light sheet to enter the channel, located on its spanwise symmetry plane, see Fig. 2. In the
configuration with one segment, only the optical channel segment was used. In the two segment configuration,
the optical channel segment was placed downstream of a non-optical channel segment. Fence-type obstacles
Case A
Case B
Case C
x
x
x
Figure 1: Schematic of the experiment, side view. Case definitions A-C according to Tab. 1. Ignition block in case A is filled in black,glass obstacle is filled in grey, field-of-view is indicated by the dashed rectangle filled in grey.
OH-PLIFlaser sheet
15°
OH
-PLIF
camera view
glassobstacle
metalobstacle
OH-PLIFlaser sheet
Figure 2: Schematic of the optical channel segment with OH-PLIF laser sheet and illustrative OH-PLIF image. Perspective (top) and topview (bottom). Glass obstacle is grey, metal obstacle black.
4
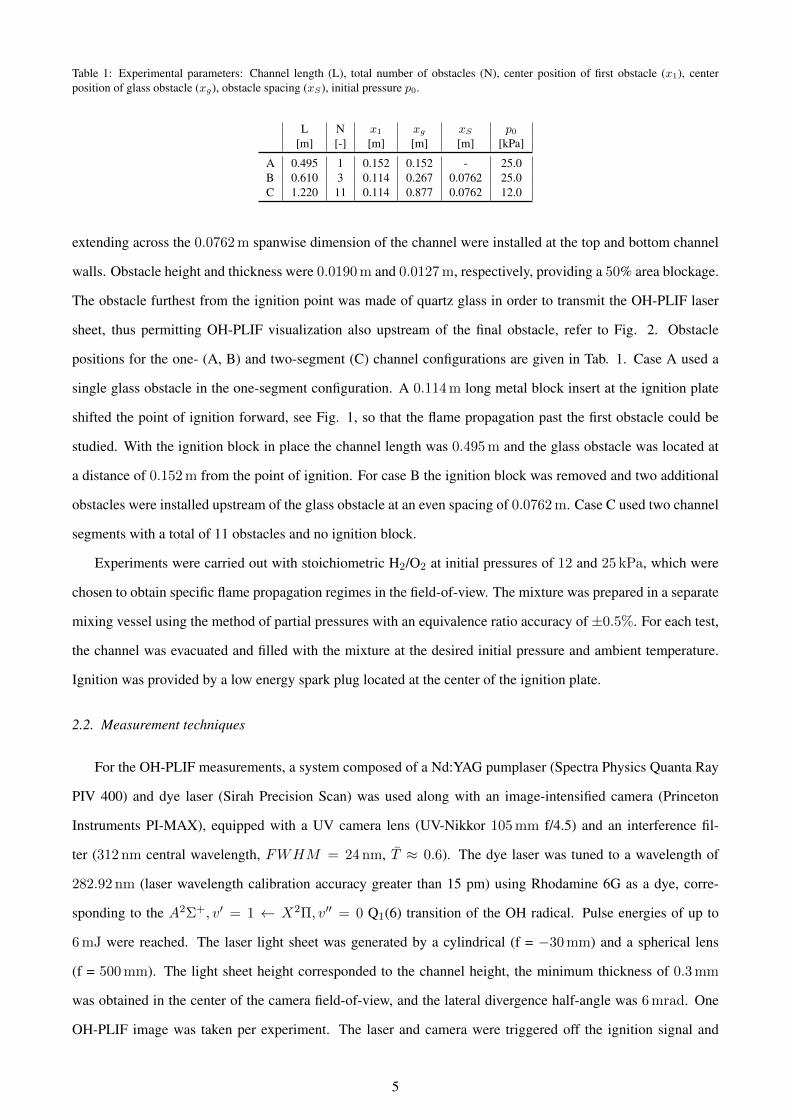
Table 1: Experimental parameters: Channel length (L), total number of obstacles (N), center position of first obstacle (x1), centerposition of glass obstacle (xg), obstacle spacing (xS), initial pressure p0.
L N x1 xg xS p0[m] [-] [m] [m] [m] [kPa]
A 0.495 1 0.152 0.152 - 25.0B 0.610 3 0.114 0.267 0.0762 25.0C 1.220 11 0.114 0.877 0.0762 12.0
extending across the 0.0762 m spanwise dimension of the channel were installed at the top and bottom channel
walls. Obstacle height and thickness were 0.0190 m and 0.0127 m, respectively, providing a 50% area blockage.
The obstacle furthest from the ignition point was made of quartz glass in order to transmit the OH-PLIF laser
sheet, thus permitting OH-PLIF visualization also upstream of the final obstacle, refer to Fig. 2. Obstacle
positions for the one- (A, B) and two-segment (C) channel configurations are given in Tab. 1. Case A used a
single glass obstacle in the one-segment configuration. A 0.114 m long metal block insert at the ignition plate
shifted the point of ignition forward, see Fig. 1, so that the flame propagation past the first obstacle could be
studied. With the ignition block in place the channel length was 0.495 m and the glass obstacle was located at
a distance of 0.152 m from the point of ignition. For case B the ignition block was removed and two additional
obstacles were installed upstream of the glass obstacle at an even spacing of 0.0762 m. Case C used two channel
segments with a total of 11 obstacles and no ignition block.
Experiments were carried out with stoichiometric H2/O2 at initial pressures of 12 and 25 kPa, which were
chosen to obtain specific flame propagation regimes in the field-of-view. The mixture was prepared in a separate
mixing vessel using the method of partial pressures with an equivalence ratio accuracy of ±0.5%. For each test,
the channel was evacuated and filled with the mixture at the desired initial pressure and ambient temperature.
Ignition was provided by a low energy spark plug located at the center of the ignition plate.
2.2. Measurement techniques
For the OH-PLIF measurements, a system composed of a Nd:YAG pumplaser (Spectra Physics Quanta Ray
PIV 400) and dye laser (Sirah Precision Scan) was used along with an image-intensified camera (Princeton
Instruments PI-MAX), equipped with a UV camera lens (UV-Nikkor 105 mm f/4.5) and an interference fil-
ter (312 nm central wavelength, FWHM = 24 nm, T̄ ≈ 0.6). The dye laser was tuned to a wavelength of
282.92 nm (laser wavelength calibration accuracy greater than 15 pm) using Rhodamine 6G as a dye, corre-
sponding to the A2Σ+, v′ = 1 ← X2Π, v′′ = 0 Q1(6) transition of the OH radical. Pulse energies of up to
6 mJ were reached. The laser light sheet was generated by a cylindrical (f = −30 mm) and a spherical lens
(f = 500 mm). The light sheet height corresponded to the channel height, the minimum thickness of 0.3 mm
was obtained in the center of the camera field-of-view, and the lateral divergence half-angle was 6 mrad. One
OH-PLIF image was taken per experiment. The laser and camera were triggered off the ignition signal and
5

synchronized with the flame arrival in the field-of-view using a Quantum Composers 9612 delay generator. The
camera was oriented at an angle of approximately 15◦ towards the spanwise channel axis, see Fig. 2. The per-
spective distortion caused by the camera angle was compensated for by linear perspective transformation of the
OH-PLIF images. The transformation matrix was derived from a camera calibration procedure using target im-
ages. Since the purpose of OH-PLIF images in this paper is visualization rather than quantitative measurement
of OH concentrations, intensities were optimized for good visibility of all details. This includes linear inten-
sity scaling to values of 0-255 (8 bit) and subsequent non-linear intensity correction enhancing low intensities
(5th order polynomial, p1 = 1.923, p2 = −4.749, p3 = 3.301, p4 = −0.8826, p5 = 1.409, p6 = 0). The
OH-PLIF field-of-view was resolved at 5.8 px/mm. Flame structures down to a size of about 1 mm were visu-
alized. High-speed schlieren imaging at framing rates of 75 kfps (cases A-B) and 84 kfps (case C) was obtained
simultaneously. The classical single-pass (Z-type) schlieren setup included: two concave mirrors (f = 3.048 m,
d = 0.254 m), two turning mirrors, a constant white light source (Xenon arc lamp, 35 W) and a Photron SA-5
high-speed camera. Flame speed was derived from the schlieren images by tracking the axial position of the
leading flame tip. The schlieren field-of-view was resolved at 2.3 px/mm.
3. Results
This section presents the results obtained from simultaneous OH-PLIF and schlieren measurements. Test
conditions for cases A-C are given in Tab. 1. Case A shows a slow-flame whose shape is governed by fluid
dynamic effects; shock waves are present in case B, interacting with the flame; case C is an example of quasi-
steady fast-flame propagation. For each case, flame tip velocity within the schlieren field-of-view, a schlieren
sequence and OH-PLIF images are presented. The latter were obtained from repeated tests, each with a different
OH-PLIF capture time. Due to high repeatability of the flame propagation, OH-PLIF images from different tests
form a coherent time series. The flame propagates from left to right in all images. The height of each image
equals the channel height of 0.0762 m.
3.1. Case A: 25 kPa, 1 obstacle
Figure 3 shows the flame tip velocity for three tests, indicating a high reproducibility of flame propagation.
The flame enters the field-of-view at x = 0.07 m at a speed of 140-170 m/s. The flame accelerates towards the
obstacle, which is centered at xg = 0.152 m. A maximum flame speed of 690-720 m/s is reached at x ≈ 0.18 m,
shortly downstream of the obstacle. This peak flame tip velocity exceeds the speed of sound in the unburnt
mixture, au = 540 m/s. However, the schlieren sequence reveals that shock waves are not generated ahead of
the flame yet so the flame can be referred to as a slow-flame. The flame speed drops further downstream before
it shows a local minimum of 340-350 m/s at x ≈ 0.24 m and subsequent acceleration to 480-515 m/s at the
end of the field-of-view. The acceleration downstream of the obstacle is due to the rapid turbulent combustion
6

of mixture in the recirculation zones. Flame tip velocity is expected to drop further downstream as the unburnt
mixture in the recirculation zones downstream of the obstacle is consumed.
x [m]0.05 0.1 0.15 0.2 0.25 0.3
v [m
/s]
100
200
300
400
500
600
700
800# 38# 39# 40
1
2
3
4
5
6
Figure 3: Flame speed, case A, obtained from schlieren imaging, tests 38, 39, 40. Glass obstacle location shown with grey box. Framenumbers in circles indicate flame tip positions in Fig.5.
1 4
2 5
3 6
Figure 4: Schlieren sequence, case A, test 38, time difference between images ∆t = 66.7µs.
1
2
4
5
3 6
Figure 5: OH-PLIF images, case A, time difference between images ∆t ≈ 55µs.
The schlieren sequence from test #38 is presented in Fig. 4. The flame front (drop in density) appears as a
white interface; whereas, a compression wave (increase in density), not observed in this sequence, shows up as a
dark line. Flame propagation is controlled by thermal expansion of combustion products, the temporal evolution
of flame surface area and turbulence-flame interaction. The flame tip is constricted as it passes the obstacle
opening and broadens further downstream. The high flame tip velocity observed in Fig. 3 is due to unburnt
gas flow contraction through the obstacle. The flow of unburnt mixture in the obstacle opening causes vortex
shedding at the obstacle edges as demonstrated by Johansen and Ciccarelli [11]. The vortices are convected
7

downstream along a line emanating from the upstream obstacle corners, highlighted in frames 1-3 with arrows.
The flame is confined laterally by the shear layers as it propagates through the obstacle opening (frames 2 and
3) such that it does not occupy the entire height of the opening. In frame 4, the flame interacts with vortices
downstream of the obstacle (see arrows) which is more apparent in the OH-PLIF images. Frame 5 shows
propagation of the flame both downstream (leading flame tip, black arrow) and upstream into the recirculation
zones along the upper and lower channel walls (white arrows). The flame eventually propagates further upstream
through the gap between the obstacle edge and the burnt gas, see frame 6.
Figure 5 presents OH-PLIF images for case A forming a coherent series. OH-PLIF overcomes the line-of-
sight integration inherent to schlieren imaging and resolves the flame front structure. Reaction of stoichiometric
H2/O2 yields particularly high temperature in the combustion products around 3000 K which results in a high
OH concentration in the burnt gas. Fluorescence intensity is consequently strong, even far behind the reaction
zone. A typical feature of OH-PLIF, the absorption of laser light, is apparent for example in frame 3 where the
light sheet travels a long distance in burnt gas from right to left and absorption following the Beer-Lambert law
causes a monotonic decrease in luminescence intensity (shadow) behind the leading flame tip. White rectangles
are superimposed on the images in Fig. 5 to show the obstacle position in the OH-PLIF plane. The obstacle
corner shadows, highlighted by arrows in frame 5, are due to the camera viewing angle, see Fig. 2. Two thin
parallel shadow lines extend from the upper and lower obstacle inner-surfaces, see arrows in frame 3, giving an
impression of the laser light sheet alignment.
Frames 1-3 show entirely smooth flame fronts, suggesting that, despite the high flame tip velocity of up to
700 m/s, the flame remains laminar. The flame front structure is not influenced by the presence of vortices shed
off the obstacle edges. In frame 4, the flame transverse surface downstream of the obstacle is influenced by the
vortices, see also arrows in frame 4 in Fig. 4. At this location, the flame front becomes wavy. In frame 5, the
wrinkling progresses and the flame starts to be entrained into the recirculation zone. The flame tip located at
the centerline of the channel remains laminar throughout. Frame 6 shows the convection of the flame into the
recirculation zones. Small-scale wrinkling is observed inside the recirculation zones, see arrow, but the visibility
of flame structures in these zones is limited due to strong absorption of laser light as it passes the flame from the
downstream end of the channel.
3.2. Case B: 25 kPa, 3 obstacles
In case B, two additional metal obstacles were placed upstream of the glass obstacle at an even spacing of
0.0762 m (first obstacle is not in the field-of-view). The additional obstacles promote further flame acceleration
which can be seen in the flame tip velocity plot, see Fig. 6. The flame accelerates up to 820-830 m/s as it passes
the first obstacle in the field-of-view which is located at x = 0.191 m. The peak flame tip velocity within the
field-of-view, 1000-1030 m/s, is reached at x ≈ 0.3 m, slightly downstream of the glass obstacle, xg = 0.267 m.
8

Further downstream, deceleration and re-acceleration of the flame is observed, similar to that found in case A.
Fluctuations in flame speed at x > 0.35 m correspond to the start of interactions between the flame and shocks
visible in the schlieren sequence, see Fig. 7, frames 4-6.
x [m]0.15 0.2 0.25 0.3 0.35 0.4
v [m
/s]
300
400
500
600
700
800
900
1000
1100# 85# 86# 87
1
2 3
4
Figure 6: Flame speed, case B, obtained from schlieren imaging, tests 85, 86, 87. Metal and glass obstacle locations shown with blackand grey boxes, respectively. Frame numbers in circles indicate flame tip positions in Fig.8.
1 4
2 5
3 6
Figure 7: Schlieren sequence, case B, test 85, time difference between images ∆t = 53.3µs.
1
2
3
4
Figure 8: OH-PLIF images, case B, time difference between images ∆t ≈ 45µs.
The flame speed clearly exceeds the unburnt mixture speed of sound, au = 540 m/s, and the flame in case
B transforms into a fast-flame. Accordingly, the schlieren sequence in Fig. 7 shows the initial formation of
compression waves that coalesce into shock waves. Frame 2 shows a first compression wave ahead of the flame
tip between the two obstacles in the field-of-view, black arrows. It reflects off the glass obstacle and interacts
with the flame in frame 3, black arrows. Based on the sharpness, the reflected wave appears to be a shock
wave. The schlieren image does not indicate any wrinkling of the flame front resulting from the shock-flame
interaction. The compression wave that is transmitted through the glass obstacle opening is seen in frame 3,
9
white arrows. Multiple compression waves coalesce and become more visible in frame 4 as the leading shock
wave. The formation of a second compression wave downstream of the glass obstacle can be seen in frame 4,
black arrows. It appears as a shock wave in frame 5 just ahead of the flame.
OH-PLIF images for case B are presented in Fig. 8. The effect of shock-flame interactions is twofold.
Upstream of the glass obstacle, the shock that reflects off the glass obstacle interacts head-on with the flame, see
frame 3, Fig. 7. In frame 3 of Fig. 8, the flame front shows small-scale wrinkling in the region of the shock-
flame interaction, see black arrows. Downstream of the obstacle, the flame shape is influenced by the interaction
with the reflected shock coming off the upper and lower channel walls (originating from the diffracted shock);
macroscopic deformations of the flame appear in frame 3, white arrows. Wrinkling is not observed along the
leading flame front, only in the recirculation zones downstream of the obstacle due to the interaction with
vortices, black arrows, frame 4, similar to case A. The axial extent of the recirculation zone is shorter than in
case A. The flame occupies a larger share of the obstacle opening height than in case A, see e.g. frame 3 in
Fig. 8. Gasdynamic expansion may support the flame propagation towards the upper and lower channel walls
downstream of the obstacle, causing a more compact recirculation zone.
3.3. Case C: 12 kPa, 11 obstacles
Adding a second channel segment upstream of the optical channel section increases the axial distance avail-
able for flame acceleration and leads to quasi-steady fast-flame propagation in the field-of-view at 12 kPa initial
pressure. The peak instantaneous flame tip velocity and the average velocity is 1150 m/s and 1050 m/s, respec-
tively, see Fig. 9. The large velocity fluctuations are due shock-flame interactions and repeated flame passage
through obstacle openings. There is no clear sign for further acceleration within the field-of-view which suggests
that the maximum deflagration velocity in the given obstructed geometry has been approached, which lies below
the burnt gas speed of sound assuming isobaric adiabatic combustion, ab = 1410 m/s, due to losses.
Schlieren images in Fig. 10 show close proximity of leading shock and flame, typical for quasi-steady fast-
flames in obstructed channels. Local explosions due to shock-induced auto-ignition do not occur. The formation
of vortices by the lead shock diffraction can be seen in Fig. 10, frames 1 and 4, black arrows. The time available
for vortex shedding off the obstacle edges is very short, of the order of 20µs, before the flame arrival. The
two vortices are convected towards the upper and lower channel walls by the flow behind the diffracting shock.
Similar to case B, two features of shock-flame interaction are observed: (1) the head-on interaction of reflected
shocks from the obstacle with the flame as indicated in frame 4, white arrows, and (2) the interaction of transverse
shocks generated by shock reflection off the upper and lower channel walls with the flame as seen in frames 5
and 6, black arrows. The first type of interaction brings the flame front to rest locally and finally convects it in the
upstream direction, frame 5, white arrows, similar to case B. The second type of interaction deforms the flame
macroscopically as the transverse shocks displace the flame front towards the channel centerline, frame 6, white
10

arrows. In both cases, the affected flame fronts appear highly turbulent following the interactions, however,
the schlieren images do not allow for an unambiguous analysis of flame front structure due to line-of-sight
integration.
x [m]0.8 0.85 0.9 0.95 1
v [m
/s]
900
950
1000
1050
1100
1150
1200# 125# 126# 1271 53 7 9 11
Figure 9: Flame speed, case C, obtained from schlieren imaging, tests 125, 126, 127. Metal and glass obstacle locations shown withblack and grey boxes, respectively. Frame numbers in circles indicate flame tip positions in Fig.11.
1 4
2 5
3 6
Figure 10: Schlieren sequence, case C, test 125, time difference between images ∆t = 23.8µs.
1 7
2 8
3 9
4 10
5 11
6 12
Figure 11: OH-PLIF images, case C, time difference between images ∆t ≈ 8.5µs.
11

A series of OH-PLIF images is presented in Fig. 11. The OH-PLIF results show, for the first time, the de-
tailed flame front structure of a fast-flame in an obstructed channel. The flame follows the gasdynamic expansion
of the unburnt mixture around the obstacle edges. Large recirculation zones where mixture would be consumed
on a long-time scale cannot be identified downstream of either of the two obstacles in the field-of-view. A small
region downstream of each obstacle where the flame interacts with a sole vortex, which can be seen in frames
1, 2 and 10, Fig. 11, white arrows, produces distinct small-scale flame wrinkling. By frame 4, this region of
mixture formed in frames 2 and 3 is completely consumed by the flame. The reflected shocks generated at the
channel walls, as seen in the schlieren sequence, are also visible in OH-PLIF frames 3 and 4 as jumps in light
intensity, white arrows, propagating towards the channel centerline and colliding on the centerline in frame 5.
Collision forms a hot region with increased luminescence in frame 6. The increase in luminescence may be
due to an increase in thermal OH luminescence caused by high local temperature, which exceeds the OH-PLIF
signal as discussed by Boeck et al. [12]. It can be seen that the reflected shocks temporarily halt the progress
of the upper and lower parts of the flame front. The flame does not consume mixture along the channel top and
bottom walls, see frame 5, until the reflected shock (traveling upstream from the obstacle) interacts with the
flame front in frames 6 and 7. The interaction shows a macroscopic deformation of the flame in frames 6 and 7.
The flame tip is compressed inside the obstacle opening due to the flow induced by the reflected shocks. Parts
of the flame upstream of the obstacle close to the channel walls are displaced upstream in frames 7-11. Frame 7
shows small-scale flame wrinkling in the regions of shock-flame interaction, black arrows, which is most likely
due to RM instability [13]. The wrinkling progresses over time, frames 8-10, and larger scales seem to become
more dominant than smaller scales. This is in accordance with findings by Kholkhlov et al. [10] that small scales
caused by RM instability dissipate quickly, whereas larger scales survive. After propagation of the flame through
the glass obstacle opening, the flame diffracts around the obstacle edges, frames 8-10, reflected transverse shock
waves become visible, frames 11 and 12, and the flame attains a global shape, similar to that between the metal
and the glass obstacle, frames 3-5. The leading flame tip (in the core region) develops wrinkles as it passes
through the obstacle, see frames 6-10. These wrinkles eventuall diminish, see frame 12. Since the vortices shed
off the obstacle edges do not reach the channel center as discussed above, the flame perturbations in the channel
center might be caused by repeated shock-flame interactions or by Rayleigh-Taylor instability associated with
the acceleration of the flame tip as it passes through the obstacle [14]. In the fast-flame regime, flame surface
perturbations due to shock-flame interactions dominate over turbulent combustion in the recirculation zone that
is key in the earlier phase of flame acceleration.
4. Conclusions
Planar laser-induced fluorescence and schlieren imaging were simultaneously applied to a flame acceleration
experiment with stoichiometric H2/O2 mixture at initial pressures of 12 and 25 kPa. Three geometrical config-
12

urations of an obstacle-laden channel were studied. Observed phenomena include, (A), early flame acceleration
(slow-flame) dominated by thermal expansion, flame surface area evolution and turbulence-flame interactions
producing a peak flame tip velocity of 700 m/s, (B) emerging shocks which cause flame tip velocity fluctuations,
macroscopic deformations and small-scale wrinkling of the flame at a peak flame tip velocity of 1000 m/s, and
(C) quasi-steady fast-flame propagation at a flame tip velocity fluctuating around 1050 m/s where precursor
shocks dominate the flow field and their interactions with the flame cause distinct deformations and small-scale
flame wrinkling. Flame perturbations arise from shock-flame interactions rather than from the interactions with
vortices shed off the obstacle edges. The experimental results provide a novel level of detail and may be used to
validate numerical simulation methods which are capable of resolving flame structure and turbulent flow.
Acknowledgments
The authors are grateful to the National Research Council Canada for the loan of the intensified camera and
UV lens, to Dr. Matthew Johnson from Carleton University for the loan of the lasers and optics, and to Adam
Steinberg for the loan of the OH narrow band filter.
References
[1] M. Berthelot, P. Vieille, CR Acad. Sci., Paris 93 (1881) 18–22.
[2] E. Mallard, H. Le Chatelier, CR Acad. Sci., Paris 93 (1881) 145–148.
[3] G. Ciccarelli, S. Dorofeev, Prog. Energ. Combust. 34 (4) (2008) 499–550.
[4] P. Clavin, Prog. Energ. Combust. 11 (1) (1985) 1–59.
[5] M. Hertzberg, Prog. Energ. Combust. 15 (3) (1989) 203–239.
[6] D. Bradley, C. G. W. Sheppart, R. Woolley, D. A. Greenhalgh, R. D. Lockett, Combust. Flame 122 (1)
(2000) 195–209.
[7] D. M. Valiev, V. Bychkov, V. Akkerman, L. E. Eriksson, Phys. Rev. E 80 (3) (2009) 036317.
[8] V. N. Gamezo, T. Ogawa, E. S. Oran, Deflagration-to-detonation transition in H2-air mixtures: effect of
blockage ratio, AIAA, 2009.
[9] G. Thomas, R. Bambrey, C. Brown, Combust. Theor. Model. 5 (4) (2001) 573–594.
[10] A. M. Khokhlov, E. S. Oran, G. O. Thomas, Combust. Flame 117 (1999) 323–339.
[11] C. T. Johansen, G. Ciccarelli, Combust. Flame 156 (2) (2009) 405–416.
13

[12] L. R. Boeck, T. Fiala, J. Hasslberger, T. Sattelmayer, Application of high-speed OH-PLIF to DDT experi-
ments, ICDERS, 2015.
[13] M. Brouillette, Annu. Rev. Fluid Mech. 34 (1) (2002) 445–468.
[14] T. Tsuruda, T. Hirano, Combust. Sci. Technol. 51 (4-6) (1987) 323–328.
14
List of figure captions
Figure 1: Schematic of the experiment, side view. Case definitions A-C according to Tab. 1. Ignition block in
case A is filled in black, glass obstacle is filled in grey, field-of-view is indicated by the dashed rectangle filled
in grey.
Figure 2: Schematic of the optical channel segment with OH-PLIF laser sheet and illustrative OH-PLIF image.
Perspective (top) and top view (bottom). Glass obstacle is grey, metal obstacle black.
Figure 3: Flame speed, case A, obtained from schlieren imaging, tests 38, 39, 40. Glass obstacle location shown
with grey box. Frame numbers in circles indicate flame tip positions in Fig.5.
Figure 4: Schlieren sequence, case A, test 38, time difference between images ∆t = 66.7µs.
Figure 5: OH-PLIF images, case A, time difference between images ∆t ≈ 55µs.
Figure 6: Flame speed, case B, obtained from schlieren imaging, tests 85, 86, 87. Metal and glass obstacle
locations shown with black and grey boxes, respectively. Frame numbers in circles indicate flame tip positions
in Fig.8.
Figure 7: Schlieren sequence, case B, test 85, time difference between images ∆t = 53.3µs.
Figure 8: OH-PLIF images, case B, time difference between images ∆t ≈ 45µs.
Figure 9: Flame speed, case C, obtained from schlieren imaging, tests 125, 126, 127. Metal and glass obstacle
locations shown with black and grey boxes, respectively. Frame numbers in circles indicate flame tip positions
in Fig.11.
Figure 10: Schlieren sequence, case C, test 125, time difference between images ∆t = 23.8µs.
Figure 11: OH-PLIF images, case C, time difference between images ∆t ≈ 8.5µs.
List of table captions
Table 1: Experimental parameters: Channel length (L), total number of obstacles (N), center position of first
obstacle (x1), center position of glass obstacle (xg), obstacle spacing (xS), initial pressure p0.
15
Related Documents


![Simultaneous OH-PLIF and schlieren imaging of flame ...ltces.dem.ist.utl.pt/lxlaser/lxlaser2016/finalworks2016/papers/03.1_1... · Dorofeev [4] summarizes the current state-of-knowledge](https://static.cupdf.com/doc/110x72/60651c784366af40bc00320a/simultaneous-oh-plif-and-schlieren-imaging-of-flame-ltcesdemistutlptlxlaserlxlaser2016finalworks2016papers0311.jpg)