1 Simultaneous intracranial EEG and fMRI of interictal epileptic discharges in humans 1,2 Serge Vulliemoz*, 1 David W. Carmichael*, 1 Karin Rosenkranz, 1,3 Beate Diehl, 1 Roman Rodionov, 1 Matthew C. Walker, 4 Andrew W. McEvoy, 1 Louis Lemieux *These authors contributed equally to the manuscript 1 Department of Clinical and Experimental Epilepsy, UCL Institute of Neurology and National Hospital for Neurology and Neurosurgery, Queen Square, London, UK 2 EEG and Epilepsy Unit, Neurology, University Hospital and Faculty of Medicine, Geneva, Switzerland 3 Department of Neurophysiology, National Hospital for Neurology and Neurosurgery, Queen Square, London, UK 4 Victor Horsley Dept. Neurosurgery, National Hospital for Neurology and Neurosurgery, Queen Square, London, UK Running title: simultaneous intracranial EEG and fMRI in humans Key words: epilepsy, intracranial EEG, fMRI Abstract: 248 words; Main text: 3676 Figures: 4 (2 colour figures) + 1 supplementary figure References: 39 Corresponding author: Prof. Louis Lemieux MRI Unit, National Society for Epilepsy Chesham Lane Chalfont St Peter Buckinghamshire SL9 0RJ United Kingdom [email protected] Tel: ++44 1494 601 300 Fax: ++44 1494 875 666 *3. Manuscript Click here to view linked References

Welcome message from author
This document is posted to help you gain knowledge. Please leave a comment to let me know what you think about it! Share it to your friends and learn new things together.
Transcript

1
Simultaneous intracranial EEG and fMRI of interictal epileptic discharges in
humans
1,2Serge Vulliemoz*, 1David W. Carmichael*, 1Karin Rosenkranz, 1,3Beate Diehl,
1Roman Rodionov, 1Matthew C. Walker, 4Andrew W. McEvoy, 1Louis Lemieux
*These authors contributed equally to the manuscript
1Department of Clinical and Experimental Epilepsy, UCL Institute of Neurology and
National Hospital for Neurology and Neurosurgery, Queen Square, London, UK
2EEG and Epilepsy Unit, Neurology, University Hospital and Faculty of Medicine,
Geneva, Switzerland
3Department of Neurophysiology, National Hospital for Neurology and Neurosurgery,
Queen Square, London, UK
4Victor Horsley Dept. Neurosurgery, National Hospital for Neurology and
Neurosurgery, Queen Square, London, UK
Running title: simultaneous intracranial EEG and fMRI in humans
Key words: epilepsy, intracranial EEG, fMRI
Abstract: 248 words; Main text: 3676
Figures: 4 (2 colour figures) + 1 supplementary figure
References: 39
Corresponding author:
Prof. Louis Lemieux
MRI Unit, National Society for Epilepsy
Chesham Lane
Chalfont St Peter
Buckinghamshire SL9 0RJ
United Kingdom
Tel: ++44 1494 601 300
Fax: ++44 1494 875 666
*3. ManuscriptClick here to view linked References

2
DISCLOSURE:
Brain Products (Munich, Germany) are manufacturers of the EEG recording
equipment used in this work and they provided EKG recording equipment on loan.
None of the authors has any other conflict of interest to disclose.

3
ABSTRACT
Simultaneous scalp EEG-fMRI measurements allow the study of epileptic networks
and more generally, of the coupling between neuronal activity and haemodynamic
changes in the brain. Intracranial EEG (icEEG) has greater sensitivity and spatial
specificity than scalp EEG but limited spatial sampling. We performed simultaneous
icEEG and functional MRI recordings in epileptic patients to study the haemodynamic
correlates of intracranial Interictal Epileptic Discharges (IED).
Two patients undergoing icEEG with subdural and depth electrodes as part of the
presurgical assessment of their pharmaco-resistant epilepsy participated in the study.
They were scanned on a 1.5T MR scanner following a strict safety protocol.
Simultaneous recordings of fMRI and icEEG were obtained at rest. IED were
subsequently visually identified on icEEG and their fMRI correlates were mapped
using a General Linear Model (GLM).
On scalp EEG-fMRI recordings performed prior to the implantation, no IED were
detected. icEEG-fMRI was well tolerated and no adverse health effect was observed.
intra-MR icEEG was comparable to that obtained outside the scanner. In both cases,
significant haemodynamic changes were revealed in relation to IED, both close to the
most active electrode contacts and at distant sites. In one case, results showed an
epileptic network including regions that could not be sampled by icEEG, in agreement
with findings from magneto-encephalography, offering some explanation for the
persistence of seizures after surgery.
Hence, icEEG-fMRI allows the study of whole-brain human epileptic networks with
unprecedented sensitivity and specificity. This could help improve our understanding
of epileptic networks with possible implications for epilepsy surgery.

4
INTRODUCTION
In patients with epilepsy, electroencephalographic (EEG) recordings remain the main
tool to investigate functional brain abnormalities and reveal characteristic paroxysmal
events such as Interictal Epileptiform Discharges (IED), reflecting synchronised
changes in post-synaptic potentials of large populations of cortical pyramidal neurons.
Over the last 15 years, the advent of simultaneous scalp EEG and functional Magnetic
Resonance Imaging (fMRI) recordings has allowed the non-invasive mapping of often
complex and widespread transient haemodynamic responses (Blood Oxygenation
Level Dependant or ‘BOLD’ changes) associated to IED and ictal events in focal
epilepsy (Ives, Warach et al. 1993; Seeck, Lazeyras et al. 1998; Krakow, Allen et al.
2000; Al-Asmi, Benar et al. 2003; Salek-Haddadi, Diehl et al. 2006; Tyvaert, Hawco et
al. 2008). IED-related multifocal positive and negative haemodynamic changes have
been commonly revealed both distant and local to the presumed epileptic focus
(Kobayashi, Bagshaw et al. 2006; Salek-Haddadi, Diehl et al. 2006). These findings
have raised questions about the behaviour of the networks associated with
epileptiform discharges, and in particular how haemodynamic responses are coupled
to these events (Logothetis 2008) as the neurovascular coupling could be altered in
pathological states such as epilepsy (Hamandi, Laufs et al. 2008; Lemieux, Laufs et
al. 2008; Grouiller, Vercueil et al. 2010; Masterton, Harvey et al. 2010). Moreover,
scalp EEG-fMRI fails to reveal convincing haemodynamic changes in a significant
proportion of cases, possibly due to the limited sensitivity of scalp EEG and
consequent poor characterisation of the baseline and inefficient modelling of the fMRI
signal (Al-Asmi, Benar et al. 2003; Salek-Haddadi, Diehl et al. 2006). In patients who
are candidates for epilepsy surgery, intracranial EEG (icEEG) remains the gold-
standard to localise the epileptogenic zone and reveal propagation of epileptic activity.
The technique has high sensitivity and spatial discrimination compared to scalp
recording but limited spatial sampling. Simultaneous fMRI could mitigate these
limitations and provide a new source of information about the organisation of
5
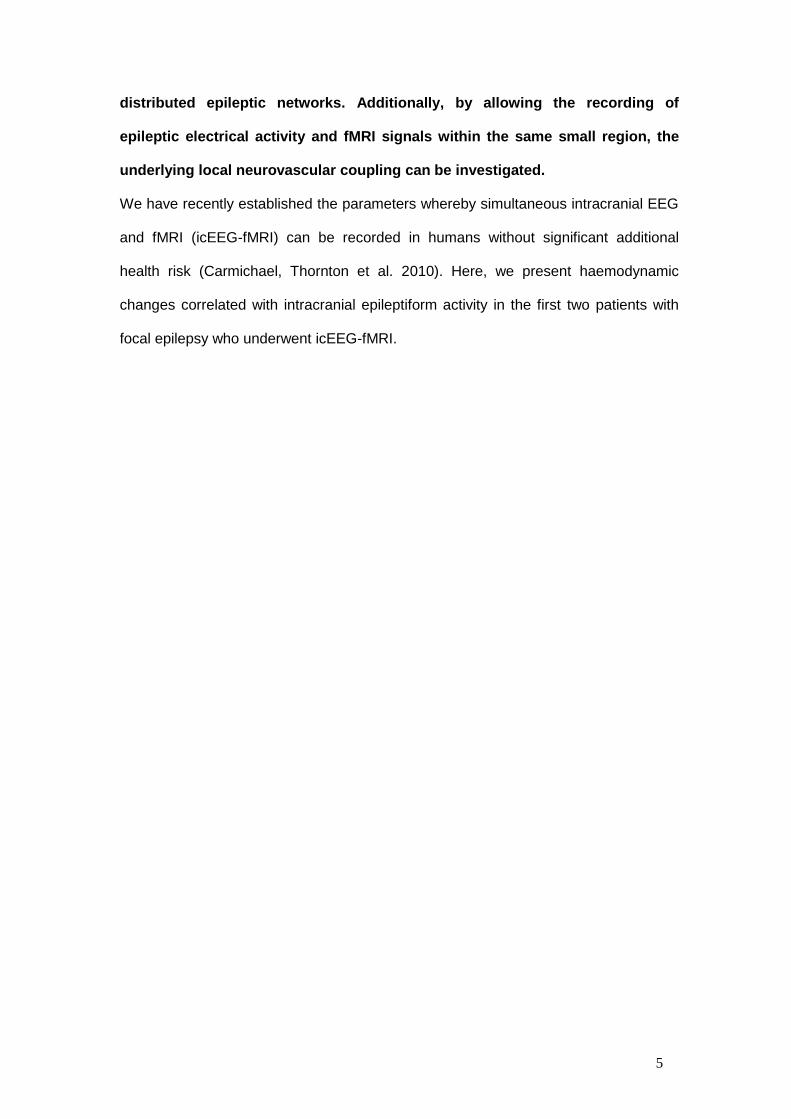
distributed epileptic networks. Additionally, by allowing the recording of
epileptic electrical activity and fMRI signals within the same small region, the
underlying local neurovascular coupling can be investigated.
We have recently established the parameters whereby simultaneous intracranial EEG
and fMRI (icEEG-fMRI) can be recorded in humans without significant additional
health risk (Carmichael, Thornton et al. 2010). Here, we present haemodynamic
changes correlated with intracranial epileptiform activity in the first two patients with
focal epilepsy who underwent icEEG-fMRI.

6
METHODS
Patients
All patients with refractory focal epilepsy undergoing intracranial EEG for presurgical
assessment of their epilepsy between June and September 2009 were considered
for participation in the study between the end of the clinical icEEG recording
and planned removal of the intracranial electrodes. We present the first 2
patients whom we were able to recruit and scan during this period. Patients
were only recruited if they were in good general health, tolerated a post-
operative clinical MRI electrode localisation scan and did not have evidence of
damage to any electrodes (based on CT and clinical recordings).
The study was approved by the Joint UCL/UCLH Committees on the Ethics of Human
Research and patients gave written informed consent.
Prior to implantation of intracranial electrodes (AdTech, Racine, WI, USA), both
patients underwent scalp EEG-fMRI acquisitions using our standard protocol
(Vulliemoz, Thornton et al. 2009), during which no epileptiform abnormality was
detected.
Case reports:
Patient 1 was a 42 year-old left-handed female with pharmaco-resistant cryptogenic
left frontal lobe epilepsy. From the age of 18 she suffered from multiple daily complex
motor seizures starting with stiffening or a feeling of tension in the right arm,
sometimes evolving to impaired awareness. Structural MRI (3 Tesla) was
unremarkable. Long-term video-EEG recording showed occasional (ca. 10/hour) low-
amplitude left paracentral IED with no localisable ictal pattern. Magneto-
encephalography (MEG, 275-channel CTF Omega whole cortex magneto-meter,
VSM MedTech, Coquitlam, BC, Canada; 40 min recording) was also performed.
Source analysis of the 30 IED recorded during MEG (Equivalent Current Dipole
7
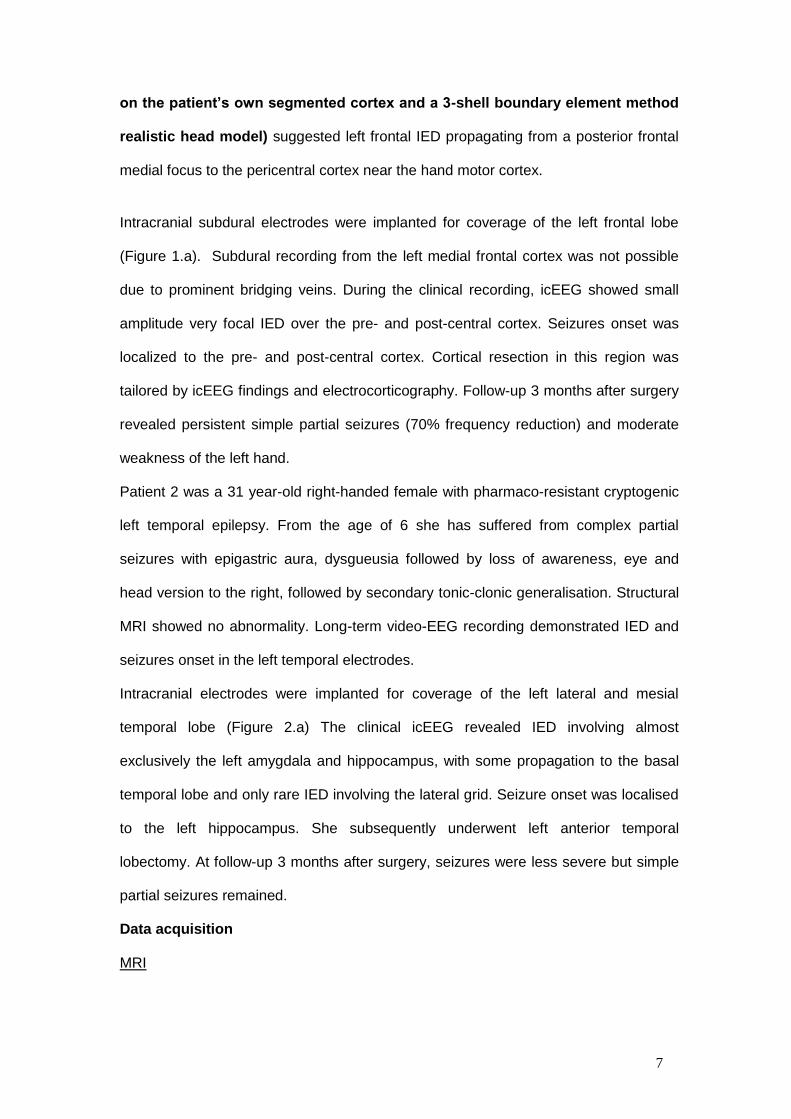
on the patient’s own segmented cortex and a 3-shell boundary element method
realistic head model) suggested left frontal IED propagating from a posterior frontal
medial focus to the pericentral cortex near the hand motor cortex.
Intracranial subdural electrodes were implanted for coverage of the left frontal lobe
(Figure 1.a). Subdural recording from the left medial frontal cortex was not possible
due to prominent bridging veins. During the clinical recording, icEEG showed small
amplitude very focal IED over the pre- and post-central cortex. Seizures onset was
localized to the pre- and post-central cortex. Cortical resection in this region was
tailored by icEEG findings and electrocorticography. Follow-up 3 months after surgery
revealed persistent simple partial seizures (70% frequency reduction) and moderate
weakness of the left hand.
Patient 2 was a 31 year-old right-handed female with pharmaco-resistant cryptogenic
left temporal epilepsy. From the age of 6 she has suffered from complex partial
seizures with epigastric aura, dysgueusia followed by loss of awareness, eye and
head version to the right, followed by secondary tonic-clonic generalisation. Structural
MRI showed no abnormality. Long-term video-EEG recording demonstrated IED and
seizures onset in the left temporal electrodes.
Intracranial electrodes were implanted for coverage of the left lateral and mesial
temporal lobe (Figure 2.a) The clinical icEEG revealed IED involving almost
exclusively the left amygdala and hippocampus, with some propagation to the basal
temporal lobe and only rare IED involving the lateral grid. Seizure onset was localised
to the left hippocampus. She subsequently underwent left anterior temporal
lobectomy. At follow-up 3 months after surgery, seizures were less severe but simple
partial seizures remained.
Data acquisition
MRI

8
MRI was performed using a 1.5T Siemens Avanto scanner (Siemens, Erlangen,
Germany) between the end of the diagnostic invasive EEG recording and removal of
the icEEG electrodes. To limit heating, we used a head transmit and receive RF coil,
low SAR (Specific Absorption Rate) sequences (≤ 0.1W/Kg, head average), as
described elsewhere (Carmichael, Thornton et al. 2008; Carmichael, Thornton et al.
2010). The following scans were performed: 1) localiser, 2) FLASH T1-volume (TR
3s/TE 40 ms/flip angle 90), 3) two 10-minute gradient echo EPI fMRI scans (TR 3s/TE
78ms/ 38 slices/200 volumes, 3x3x3mm), during which intracranial EEG was
recorded.
icEEG
EEG electrode leads were routed directly to the vertex before replacing the bandage.
The cables connecting the electrodes to the amplifiers for the clinical recordings were
replaced by shorter cables (length 90 cm) to minimize radio-frequency induced risk of
heating and laid out precisely in relation to the scanner (Carmichael, Thornton et al.
2008; Carmichael, Thornton et al. 2010). EEG was recorded using an MR-compatible
amplifier system (Brain Products, Munich, Germany) and dedicated recording
software (Brain Vision Recorder) during the fMRI acquisitions. The EEG recording
system sampling at 5000Hz was synchronised to the scanner’s 20kHz gradient
clock.
Data analysis
icEEG
Scanning-related artefacts were removed using standard implementation of template
subtraction and filtering (Allen, Josephs et al. 2000) in Brain Vision Analyzer (V1.3).
On the corrected icEEG, pulse-related artefacts were small compared to the
epileptiform activity and did not interfere with IED identification. IED were detected
and labelled by an expert electroencephalographer (SV). For the purpose of fMRI
modelling, IED were grouped according to their most active contact and spatial extent
(number of contacts involved).

9
fMRI
fMRI analysis was performed using SPM5 software package
(www.fil.ion.ucl.ac.uk/SPM). fMRI time-series were corrected for slice acquisition time,
realigned to the mean image and spatially smoothed with an isotropic Gaussian kernel
of 8 mm full width at half maximum.
Mapping epileptic networks: whole brain IED-related BOLD changes
Pre-processed fMRI time-series data were analysed using a General Linear Model
(GLM) to map regional IED-related changes of the BOLD signal. Discharges were
modelled as zero-duration events (unit impulse, or ‘delta’, functions) or as blocks in
case of sustained IED activity and then convolved with the canonical Haemodynamic
Response Function (HRF (Friston, Fletcher et al. 1998)). Motion-related effects were
included in the GLM in the form of the 6 realignment parameters.
T contrasts (positive and negative) were used to generate SPMt maps, with a
significance threshold of p<0.001 uncorrected for multiple comparisons overlaid onto
T1-weighted volumetric images obtained in the same session and co-registered to the
EPI images (Ashburner and Friston 1997).
Detecting focal BOLD changes in the irritative zone
Given the potential for local signal alteration around the icEEG electrodes and
resulting BOLD sensitivity reduction (Deichmann, Josephs et al. 2002), we
wanted to confirm that local correlation between epileptic icEEG events and BOLD
signal could be measured with our technique. Clinical intracranial macro-electrode
contacts typically record electric signals within a distance of about 1 cm (Lachaux,
Rudrauf et al. 2003) and therefore record events directly from a known brain
region (in contrast to scalp EEG-fMRI recordings, where the EEG represents the
weighted sum of distributed generators). Therefore we looked for IED-correlated
BOLD changes in this region using a similar volume of interest (VOI: 1-cm radius
sphere around the electrode contact location with the strongest epileptic activity).

10
Having an a priori defined VOI, the p-value of the local maxima at a given threshold
(here p<0.05) represents the statistical significance of the result with strong control of
Family-wise type I error (Friston 1997). The VOI analysis is an application of the
small volume correction tool in SPM. Instead of establishing the significance of
a correlation between the predicted and measured BOLD signal for each voxel
over the entire brain (using random field theory for multiple comparisons) it
performs the statistical threshold correction over the pre-specified VOI, taking
into account its shape and volume. Therefore the result is not a map, but rather
the presence or absence of a significant finding within the VOI.
11
RESULTS
Neither patient reported any discomfort, headache or neurological symptom during or
immediately following the icEEG-fMRI sessions. During electrode removal, careful
visual inspection of the neighbouring brain tissue did not reveal any sign of adverse
effect and no unusual abnormality was noted in histological examination.
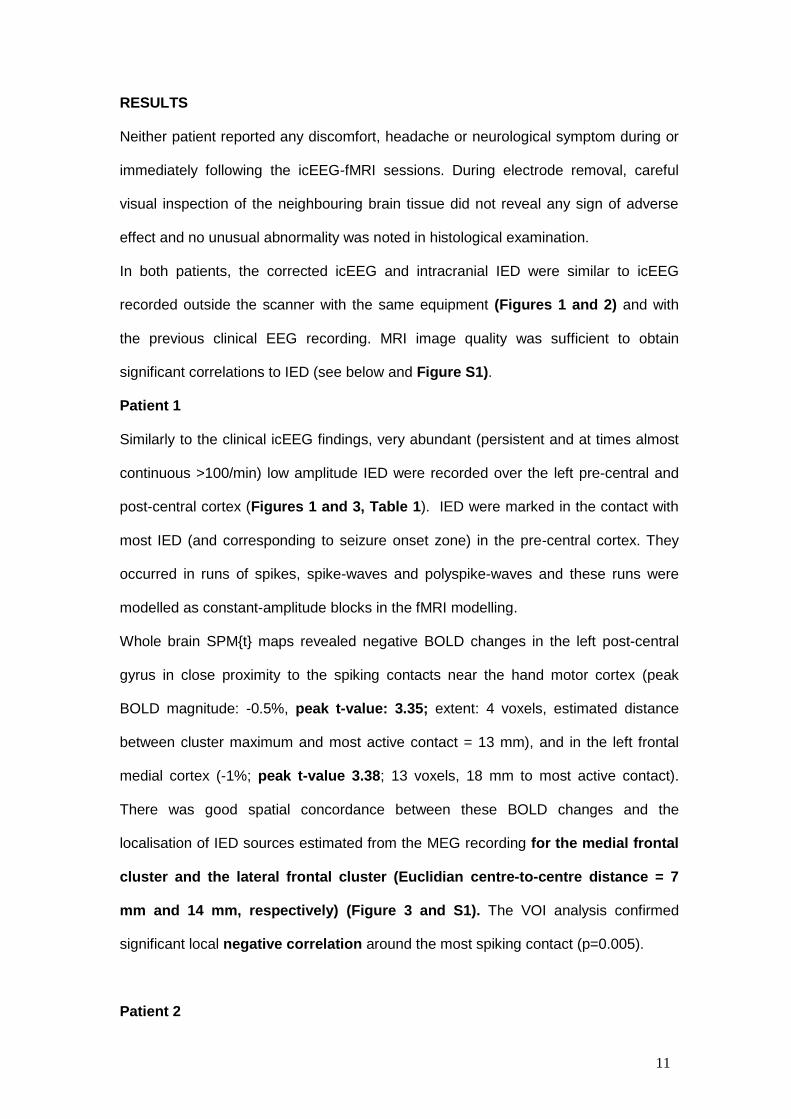
In both patients, the corrected icEEG and intracranial IED were similar to icEEG
recorded outside the scanner with the same equipment (Figures 1 and 2) and with
the previous clinical EEG recording. MRI image quality was sufficient to obtain
significant correlations to IED (see below and Figure S1).
Patient 1
Similarly to the clinical icEEG findings, very abundant (persistent and at times almost
continuous >100/min) low amplitude IED were recorded over the left pre-central and
post-central cortex (Figures 1 and 3, Table 1). IED were marked in the contact with
most IED (and corresponding to seizure onset zone) in the pre-central cortex. They
occurred in runs of spikes, spike-waves and polyspike-waves and these runs were
modelled as constant-amplitude blocks in the fMRI modelling.
Whole brain SPMt maps revealed negative BOLD changes in the left post-central
gyrus in close proximity to the spiking contacts near the hand motor cortex (peak
BOLD magnitude: -0.5%, peak t-value: 3.35; extent: 4 voxels, estimated distance
between cluster maximum and most active contact = 13 mm), and in the left frontal
medial cortex (-1%; peak t-value 3.38; 13 voxels, 18 mm to most active contact).
There was good spatial concordance between these BOLD changes and the
localisation of IED sources estimated from the MEG recording for the medial frontal
cluster and the lateral frontal cluster (Euclidian centre-to-centre distance = 7
mm and 14 mm, respectively) (Figure 3 and S1). The VOI analysis confirmed
significant local negative correlation around the most spiking contact (p=0.005).
Patient 2

12
Very frequent IED (>30/min) were observed, involving the left amygdala (depth
electrode), the left hippocampus (depth electrode), and, less frequently, the left basal
temporal cortex (strip electrode) (Figures 2 and 4, Table 1). Rare IED (N = 2) were
recorded on the lateral temporal grid. SPMt maps of IED with the largest field
(involving the amygdala, hippocampus and basal temporal lobe) showed strong
negative BOLD changes in the medial parietal (-1%; peak t-value: 4.27; 101 voxels)
and lateral parieto-occipito-temporal cortex bilaterally. These BOLD changes show
very good spatial concordance with the posterior part of the Default Mode
Network (Raichle, MacLeod et al. 2001). The VOI-based analysis revealed positive
correlation in the anterior hippocampus (p=0.002).

13
DISCUSSION
To the best of our knowledge this is the first report of simultaneous icEEG and fMRI
recording in humans. Following a strict data acquisition protocol, no adverse effects
were observed and icEEG data quality allowed clear identification of IED. Our
objectives were 2-fold: firstly, to demonstrate the technique’s capability to
reveal IED-related BOLD changes over the whole brain using a simple modelling
approach similar to that used for scalp EEG-fMRI; secondly, to verify if it was
possible to detect significant IED-BOLD coupling from signals recorded from
within the same region. We showed significant IED-related BOLD changes in the
immediate vicinity of the focus localised by icEEG, suggesting good spatial
concordance between neuronal and BOLD changes in focal epileptic activity. Distant
BOLD changes related to specific interictal discharge patterns were also observed
illustrating a potential advantage of simultaneous icEEG-fMRI for investing whole-
brain epileptic networks over icEEG alone and scalp EEG-fMRI.
Methodological considerations
To ensure patient safety, we used the following data acquisition protocol: a 1.5T
scanner with a head transmit-receive coil; RF power limited to 0.1W/Kg head-average;
exact cable lengths and placement in the scanner bore; exact EEG recording
equipment configuration. This approach was devised based on previous specific
testing on a test object with the same arrangement and a safety margin to account for
any differences between in-vitro safety studies and patient/electrode configurations
(Carmichael, Thornton et al. 2008; Carmichael, Thornton et al. 2010).
Despite MR image artefacts (distortion and drop out) near the intracranial
electrode contacts, IED-related BOLD changes within 1.0 cm of the active
electrode were detected. This demonstrates that the technique can detect BOLD
signal changes local to the electrode contacts and can therefore be applied to
investigate local icEEG-fMRI coupling in epilepsy. A more systematic
investigation of data quality issues that will require a larger group of subjects
14
with different implantation strategies, is currently underway in our laboratory. In
the future, optimisation of imaging sequences and intracranial electrodes (e.g. using
material with lower magnetic susceptibility) should further improve fMRI data quality
and detection sensitivity.
Differences in the event-to-slice timing can be accounted for by using a flexible
basis set. Due to the frequency of events in this study the time from events to
slice acquisition was critical to define expected signal changes hence we used
slice timing correction. Uncertainty in the scalp EEG-derived model can be
addressed by using a flexible basis set for the HRF; because of the exquisite
definition of the events in our data and for the sake of simplicity we assumed
that the IED-related BOLD changes are canonical as previously demonstrated
for focal discharges recorded on the scalp (Lemieux, Laufs et al. 2008).
Nonetheless, the availability of co-localised icEEG-fMRI signals will allow more
systematic assessment of inter-regional and inter-individual variability in
epileptic event-related haemodynamic changes and the study of the EEG
correlates of this variability.
The SPMt maps showed significant IED-related BOLD changes with magnitude (0.5
to 1%) and extent (4 to 101 voxels) within the range of commonly observed scalp IED-
related BOLD effects at this field strength (Krakow, Woermann et al. 1999; Benar,
Gross et al. 2002). The location of the clusters was concordant with non-invasive
electroclinical data or with distant regions known to show haemodynamic
changes related to focal temporal lobe IED (Laufs, Hamandi et al. 2007). Thus, it is
highly unlikely that these results are due to insufficient control of false positives. Given
icEEG’s much greater sensitivity, the generators of detected IED on icEEG can be
weaker and of smaller spatial extent than for IED detected on scalp EEG. We would
therefore expect the associated haemodynamic changes to occur over a smaller brain
region and to be of smaller magnitude. Although simultaneous scalp recordings were
not available, the small IED field and, in patient 2, the deep localisation of the IED

15
focus make it unlikely that these events would have been detected with scalp EEG
electrodes, consistent with the lack of IED in previous scalp EEG-fMRI recording for
both patients. The high frequency of events narrows the dynamic range of the
relatively slow haemodynamic response compared to expected BOLD changes in
scalp EEG-fMRI studies, which model rarer events that originate from larger areas of
active cortex (Tao, Ray et al. 2005). In addition, possible non-linear effects (de Zwart,
van Gelderen et al. 2009) related to very close occurrence of successive IED might
also play a role (Bagshaw, Hawco et al. 2005; Salek-Haddadi, Diehl et al. 2006).
In addition to the fMRI artefacts due to the depth electrode, the detection of IED-
related hippocampal BOLD changes with scalp EEG-fMRI is limited by the difficulty of
recording temporal mesial IED even when using fMRI protocols optimised for the
basal temporal lobe (Bagshaw, Torab et al. 2006; Kobayashi, Bagshaw et al. 2006). In
patient 2, we found a highly significant correlation between hippocampal IED and
BOLD signal changes from within the same region.
Neurophysiological relevance
In fMRI studies the starting hypothesis is that focal neuronal activity is coupled to
haemodynamic changes, so that focal BOLD changes can be interpreted as reflecting
changes of neuronal activity (Logothetis 2008). In non-human primates, BOLD
changes are best correlated to synaptic activity (local field potential) (Logothetis,
Pauls et al. 2001) but the coupling between cortical evoked potentials and
haemodynamic responses might not show perfect spatial match (Disbrow, Slutsky et
al. 2000). In humans, non-invasive cerebral perfusion measurements suggested
preserved neurovascular coupling in relation to generalised IED (Stefanovic, Warnking
et al. 2005; Carmichael, Hamandi et al. 2008; Hamandi, Laufs et al. 2008). The non-
invasive study of the neurovascular coupling during epileptic activity in humans is
limited by the poor sensitivity and low spatial resolution of scalp EEG (Alarcon, Guy et
al. 1994) and the resulting suboptimal characterisation of the baseline state. By
contrast, simultaneous recording of local neuronal activity and haemodynamic
16
changes presented here revealed co-localised haemodynamic changes to the most
active icEEG contact as well as distant changes, concordant with invasive animal
studies (Englot, Mishra et al. 2008).
In patient 1, we observed negative BOLD changes at the site of IED. Negative BOLD
changes, linked to decreased local field potential, have been reported in monkeys in
response to decreased visual stimulus and have been related to reduced neuronal
activity (Shmuel, Yacoub et al. 2002). The situation is more complicated for negative
BOLD changes correlated to scalp IED in focal epilepsy, that have been found
predominantly distantly but also in close proximity to the presumed epileptic focus in
humans (Kobayashi, Bagshaw et al. 2006; Salek-Haddadi, Diehl et al. 2006;
Vulliemoz, Thornton et al. 2009). Deviations from the norm in the shape of the focal
IED-related haemodynamic response (initial dip, peak, undershoot) and BOLD
changes preceding scalp detected IED have been reported (Jacobs, Levan et al.
2009), although their significance in epileptic activity is unclear (Salek-Haddadi, Diehl
et al. 2006; Lemieux, Laufs et al. 2008). The negative BOLD changes observed here
could reflect such alterations of the neurovascular coupling due to local pathology or
reflect an imbalance between excitatory and inhibitory neuronal processes (Logothetis
2008) with decreased metabolic demand in the case of the very focal IED. This could
be reversed in the case of IED involving larger patches of cortex and detectable on
scalp EEG, consistent with the observation that, in scalp-EEG studies, most IED-
correlated BOLD changes concordant with the epileptic zone are positive (Kobayashi,
Bagshaw et al. 2006; Salek-Haddadi, Diehl et al. 2006).
In patient 2, we found a highly significant local correlation between
hippocampal IED and BOLD signal changes within the same region (1 cm
around the most spiking contact) by using the spatial specificity of the icEEG
recording. We also observed prominent slow wave activity in the hippocampus
(Figure 2), whereas slow waves were not a prominent feature of spiking contacts in
Patient 1 (Figure 1). This is consistent with previous reports of increased slow wave

17
spectral power at electrodes close to positive vs. negative BOLD changes (Benar,
Grova et al. 2006). In addition, we found distant IED-related negative BOLD
changes in the medial parietal cortex (precuneus) and lateral occipito-temporo-
parietal cortex that are localised in regions shown to participate in the Default
Mode Network (DMN) of the brain (Raichle, MacLeod et al. 2001). This is
consistent with previous observations of DMN involvement in temporal lobe
epileptic activity (Kobayashi, Bagshaw et al. 2006; Salek-Haddadi, Diehl et al. 2006;
Laufs, Hamandi et al. 2007) and with the coupling between the hippocampus and the
DMN revealed by functional connectivity studies (Raichle, MacLeod et al. 2001).
Clinical relevance
The mapping of BOLD changes related to intracranial IED can provide useful
information about the epileptic network, circumventing low spatial resolution (typically
1cm3 around the electrode contact (Lachaux, Rudrauf et al. 2003)) and restricted brain
coverage. In the two patients studied here, intracranially recorded IED were very focal
and invisible to scalp EEG so that only icEEG allowed modelling of the BOLD changes
to confirm focal icEEG findings or to reveal changes at sites not explored by icEEG
electrodes.
In patient 1, scalp IED were recorded during long-term EEG (mostly during
drowsiness or sleep) and during MEG but not during scalp EEG-fMRI. These
differences in activity are common and can result from source orientation or
fluctuations of brain state across recording sessions. icEEG-fMRI showed left
frontal medial IED-related BOLD change and a weaker left lateral BOLD change,
concordant with MEG results showing left medial frontal IED onset with propagation to
left lateral frontal cortex (Figure 3). The concordance of the two results and
persistence of the seizures after surgery limited to portions of the left lateral pre- and
post-central cortex support an important role of the medial frontal cortex in the
epileptic network of this patient. This could not be investigated by icEEG alone for
technical reasons (see case report), while icEEG-fMRI allowed for whole brain

18
investigation providing complementary information. This example suggests that the
icEEG-fMRI results, and the consequently improved knowledge of the epileptic
network, could result in a better planning of epilepsy surgery and estimation of
the odds of seizure freedom. Larger studies will allow better definition of the
sensitivity, specificity and clinical relevance of icEEG-fMRI as a presurgical mapping
tool for patients with pharmaco-resistant epilepsy.

19
ACKNOWLEDGEMENTS
We would like to thank Catherine Scott and Dr Stjepana Kovac in the Epilepsy
Telemetry Unit, Prof. John Duncan in the Epilepsy Department and Lisa Strycharczuk,
Catherine Green, Alison Duncan, Prashanth Kesara, Bruce Metheringham and John
Thornton in the Neuroradiology Department at NHNN (UCLH) for their help. We are
also grateful to Dr. Fergus Rugg-Gunn for the MEG analysis and to Will Penny for
useful discussions about statistics. S. Vulliemoz is supported by a fellowship for
advanced researcher and by SNF grant 33CM30-124089 (SPUM Epilepsy) from the
Swiss National Science Foundation. We acknowledge the financial support of the UK
Medical Research Council (MRC grant G0301067). This work was undertaken at
UCLH/UCL who received a proportion of funding from the Department of Health’s
NIHR Biomedical Research Centres funding scheme.

20
REFERENCES
Al-Asmi, A., C. G. Benar, et al. (2003). "fMRI activation in continuous and spike-triggered
EEG-fMRI studies of epileptic spikes." Epilepsia 44(10): 1328-39.
Alarcon, G., C. N. Guy, et al. (1994). "Intracerebral propagation of interictal activity in partial
epilepsy: implications for source localisation." J Neurol Neurosurg Psychiatry 57(4):
435-49.
Allen, P. J., O. Josephs, et al. (2000). "A method for removing imaging artifact from
continuous EEG recorded during functional MRI." Neuroimage 12(2): 230-9.
Ashburner, J. and K. Friston (1997). "Multimodal image coregistration and partitioning--a
unified framework." Neuroimage 6(3): 209-17.
Bagshaw, A. P., C. Hawco, et al. (2005). "Analysis of the EEG-fMRI response to prolonged
bursts of interictal epileptiform activity." Neuroimage 24(4): 1099-112.
Bagshaw, A. P., L. Torab, et al. (2006). "EEG-fMRI using z-shimming in patients with
temporal lobe epilepsy." J Magn Reson Imaging 24(5): 1025-32.
Benar, C. G., D. W. Gross, et al. (2002). "The BOLD response to interictal epileptiform
discharges." Neuroimage 17(3): 1182-92.
Benar, C. G., C. Grova, et al. (2006). "EEG-fMRI of epileptic spikes: concordance with EEG
source localization and intracranial EEG." Neuroimage 30(4): 1161-70.
Carmichael, D. W., K. Hamandi, et al. (2008). "An investigation of the relationship between
BOLD and perfusion signal changes during epileptic generalised spike wave activity."
Magn Reson Imaging 26(7): 870-3.
Carmichael, D. W., J. S. Thornton, et al. (2008). "Safety of localizing epilepsy monitoring
intracranial electroencephalograph electrodes using MRI: radiofrequency-induced
heating." J Magn Reson Imaging 28(5): 1233-44.
Carmichael, D. W., J. S. Thornton, et al. (2010). "Feasibility of simultaneous intracranial EEG-
fMRI in humans: a safety study." Neuroimage 49(1): 379-90.
de Zwart, J. A., P. van Gelderen, et al. (2009). "Hemodynamic nonlinearities affect BOLD
fMRI response timing and amplitude." Neuroimage 47(4): 1649-58.
Deichmann, R., O. Josephs, et al. (2002). "Compensation of susceptibility-induced BOLD
sensitivity losses in echo-planar fMRI imaging." Neuroimage 15(1): 120-35.
Disbrow, E. A., D. A. Slutsky, et al. (2000). "Functional MRI at 1.5 tesla: a comparison of the
blood oxygenation level-dependent signal and electrophysiology." Proc Natl Acad Sci
U S A 97(17): 9718-23.
Englot, D. J., A. M. Mishra, et al. (2008). "Remote effects of focal hippocampal seizures on the
rat neocortex." J Neurosci 28(36): 9066-81.
Friston, K. J. (1997). "Testing for anatomically specified regional effects." Hum Brain Mapp
5(2): 133-6.
Friston, K. J., P. Fletcher, et al. (1998). "Event-related fMRI: characterizing differential
responses." Neuroimage 7(1): 30-40.
Grouiller, F., L. Vercueil, et al. (2010). "Characterization of the hemodynamic modes
associated with interictal epileptic activity using a deformable model-based analysis of
combined EEG and functional MRI recordings." Hum Brain Mapp [Epub ahead of
print].
Hamandi, K., H. Laufs, et al. (2008). "BOLD and perfusion changes during epileptic
generalised spike wave activity." Neuroimage 39(2): 608-18.
Ives, J. R., S. Warach, et al. (1993). "Monitoring the patient's EEG during echo planar MRI."
Electroencephalogr Clin Neurophysiol 87(6): 417-20.
Jacobs, J., P. Levan, et al. (2009). "Hemodynamic changes preceding the interictal EEG spike
in patients with focal epilepsy investigated using simultaneous EEG-fMRI."
Neuroimage 45(4): 1220-31.
Kobayashi, E., A. P. Bagshaw, et al. (2006). "Temporal and extratemporal BOLD responses to
temporal lobe interictal spikes." Epilepsia 47(2): 343-54.

21
Kobayashi, E., A. P. Bagshaw, et al. (2006). "Negative BOLD responses to epileptic spikes."
Hum Brain Mapp 27(6): 488-97.
Krakow, K., P. J. Allen, et al. (2000). "EEG recording during fMRI experiments: image
quality." Hum Brain Mapp 10(1): 10-5.
Krakow, K., F. G. Woermann, et al. (1999). "EEG-triggered functional MRI of interictal
epileptiform activity in patients with partial seizures." Brain 122 (Pt 9): 1679-88.
Lachaux, J. P., D. Rudrauf, et al. (2003). "Intracranial EEG and human brain mapping." J
Physiol Paris 97(4-6): 613-28.
Laufs, H., K. Hamandi, et al. (2007). "Temporal lobe interictal epileptic discharges affect
cerebral activity in "default mode" brain regions." Hum Brain Mapp 28(10): 1023-32.
Lemieux, L., H. Laufs, et al. (2008). "Noncanonical spike-related BOLD responses in focal
epilepsy." Hum Brain Mapp 29(3): 329-45.
Logothetis, N. K. (2008). "What we can do and what we cannot do with fMRI." Nature
453(7197): 869-78.
Logothetis, N. K., J. Pauls, et al. (2001). "Neurophysiological investigation of the basis of the
fMRI signal." Nature 412(6843): 150-7.
Masterton, R. A., A. S. Harvey, et al. (2010). "Focal epileptiform spikes do not show a
canonical BOLD response in patients with benign rolandic epilepsy (BECTS)."
Neuroimage 51(1): 252-60.
Raichle, M. E., A. M. MacLeod, et al. (2001). "A default mode of brain function." Proc Natl
Acad Sci U S A 98(2): 676-82.
Salek-Haddadi, A., B. Diehl, et al. (2006). "Hemodynamic correlates of epileptiform
discharges: an EEG-fMRI study of 63 patients with focal epilepsy." Brain Res
1088(1): 148-66.
Seeck, M., F. Lazeyras, et al. (1998). "Non-invasive epileptic focus localization using EEG-
triggered functional MRI and electromagnetic tomography." Electroencephalogr Clin
Neurophysiol 106(6): 508-12.
Shmuel, A., E. Yacoub, et al. (2002). "Sustained negative BOLD, blood flow and oxygen
consumption response and its coupling to the positive response in the human brain."
Neuron 36(6): 1195-210.
Stefanovic, B., J. M. Warnking, et al. (2005). "Hemodynamic and metabolic responses to
activation, deactivation and epileptic discharges." Neuroimage 28(1): 205-15.
Tao, J. X., A. Ray, et al. (2005). "Intracranial EEG substrates of scalp EEG interictal spikes."
Epilepsia 46(5): 669-76.
Tyvaert, L., C. Hawco, et al. (2008). "Different structures involved during ictal and interictal
epileptic activity in malformations of cortical development: an EEG-fMRI study."
Brain 131(Pt 8): 2042-60.
Vulliemoz, S., R. Thornton, et al. (2009). "The spatio-temporal mapping of epileptic networks:
combination of EEG-fMRI and EEG source imaging." Neuroimage 46(3): 834-43.

22
Type of IED Events in 20 min EPI recording
Patient 1 Runs of small amplitude IED in the left peri-central cortex
Total time of IED blocks / baseline = 0.26
Patient 2 Left amygdala >> hippocampus N= 23
Left hippocampal>>amygdala IED N= 59
L amygdala + hippocampus N= 202
L amygdala + hippocampus + basal temporal
N= 146
L hippocampus : small IED and large amplitude consecutive slow-wave
N= 222
Table 1: Interictal Epileptiform Discharges (IED) recorded during fMRI scanning
(see Figures for illustration of EEG traces and localisation of electrode
contacts).

23
FIGURE LEGENDS
Figure 1:
Representative sample of intracranial EEG from Patient 1, bipolar montage on
parts of a 8x8 contacts grid (1-8: superior row front to back; etc). Top: outside
the MR scanner; bottom: inside the MR-scanner after correction of MR-gradient
artefacts. For the contacts with the most prominent epileptic activity (red circle,
see Figure 3 for localisation), the runs of IED were marked as blocks (red
boxes). Note the good quality of the corrected EEG inside the scanner and how
similar it is to the recording outside the scanner.
Figure 2:
Representative sample of intracranial EEG in Patient 2: colour ellipses
correspond to the colours of the electrodes as displayed in Figure 4 (yellow:
depth electrode to amygdala, medial to lateral; orange: idem to hippocampus;
red: basal subdural strips, medial to lateral; green: sample of temporal lateral
subdural grid).
Top: icEEG recorded outside the MR scanner; bottom: ic EEG recorded inside
the MR-scanner after correction of MR-gradient artefacts. Short arrows: IED
restricted to mesial temporal lobe (hippocampus>amygdala); long arrows: IED
recorded in the medial temporal and basal temporal lobe. Empty arrows:
prominent slow-wave activity in the hippocampus is also observed. Note the
good quality of the corrected EEG inside the scanner and its similarity to the
recording outside the scanner.
Figure 3:
Patient 1: a) Subdural electrodes positions overlaid onto post-implantation T1-
weighted MRI: one subdural grid (6x8 contacts) over the lateral left frontal lobe (red
dots) and three additional strips (1x8 contacts each, blue and green dots) for

24
comprehensive lateral fronto-temporal coverage. Blue line: irritative zone (were IED
are recorded); red line: contact demonstrating maximal epileptic activity;
b-c) Left panels: statistical maps of BOLD changes correlated to IED showed a left
medial frontal (at crosshair in b) and a left lateral frontal cluster (at crosshair in c); right
panels: Results of MEG analysis showing IED onset in medial frontal lobe propagating
to lateral frontal lobe (courtesy of Dr F. Rugg-Gunn). There is good spatial
concordance between MEG sources and the BOLD changes.
Figure 4:
Patient 2: a) Subdural electrodes positions overlaid onto post-implantation T1-
weighted MRI: two six-contact depth electrodes (lateral-medial orientation) in the left
amygdala (yellow dots) and hippocampus (orange dots). Lateral temporal coverage
was obtained by a subdural grid (4x8 contacts, green dots), basal temporal coverage
was accomplished using 3 subdural strips (1x8 contacts, red dots); 1 subdural strip
(2x8 contacts, blue dots) was placed over the inferior frontal cortex.
b) Coronal view showing the position of the depth electrode in the hippocampus
(orange dots, crosshair at most active contact)
c) Statistical maps of BOLD changes showed bilateral medial and lateral parietal
negative changes correlated to IED.
5. Figure 1Click here to download high resolution image

5. Figure 2 Click here to download high resolution image

5. Figure 3Click here to download high resolution image

6. Supplementary Material: Figure S1Click here to download 6. Supplementary Material: Vulliemoz_icEEGfMRI_FigS1.pdf

6. Supplementary Material: Figure S1 LegendClick here to download 6. Supplementary Material: NIMG-10-677_Supplementary_fig_Legend.doc
Related Documents