International Journal of Scientific & Engineering Research, Volume 10, Issue 3, March-2019 ISSN 2229-5518 IJSER © 2019 http://www.ijser.org Simulator Development for Evaluation of Inflow Performance Relationship of Solution Gas Drive Reservoir Obia Ronald A. 1 , Nmegbu Godwin C. J. 2 , Ehirim Emmanuel O. 3 1 Department of Petroleum Engineering, Rivers State University, Port Harcourt. 2 Department of Petroleum Engineering, Rivers State University, Port Harcourt. 3 Department of Chemical/ Petrochemical Engineering, Rivers State Universiy, Port Harcourt. Abstract— This study evaluates the analysis of Inflow Performance Relationship (IPR) of a solution gas drive oil reservoir system (i.e. Saturated Reservoir, case; Pr ≤ Pb ) using an ad-hoc (simulator Ronald Obia Simulator (ROS)) designed for the purpose of this research work. The computer program (ROS) was developed in the cause of this study to analyze a 6-Test point Inflow performance Relationship problem to give solutions with higher degree of accuracy and precision instead of solving the system manually. IPR describes the behavior of the well’s flowing pressure and production rate, which is an important tool in understanding the reservoir/well behavior and quantifying the production rate. The newly developed simulator is very easy and simple in terms of application. Fast and accurate results were produced after being compared to calculations and results from the manual solution method. From the results obtained, a plot of wellbore flowing pressure (Pwf) vs the simulated wellbore flowrate (Qo) was carried out. The IPR plots obtained revealed that the plot was initially a straight line and then later deviated to a curve line. The straight line indicates a single phase system, whereas the curved line indicates a two-phase system (oil and gas). The point of deviation from the straight line indicates the bubble point pressure. Furthermore, it reveals that the point of deviation which is the bubble point pressure is 2000 psig. Finally, the application of the developed IPR simulator (ROS) was validated with PROSPER and proven to be very accurate and efficient in calculations involving Inflow Performance Relationship and also plotting of the corresponding IPR curves. Hence, the newly developed IPR simulator should be introduced to higher institutions and oil and gas firms to assist them on proffering solutions to problems involving IPR calculations and beyond. Index Terms—Bubble Point Pressure, Graphic User Interface (GUI), Inflow Performance Relationship (IPR), Productivity Index, Saturated Reservoir, Simulator, Wellbore Flowing Pressure. —————————— —————————— 1 INTRODUCTION t is generally assumed that fluid inflow rate is proportional to the difference between wellbore pressure and reservoir pressure. This assumption leads to a linear relationship that is derived from Darcy’s law for steady state flow of an incompressi- ble, single phase fluid and is called productivity in- dex (PI). However, this assumption is valid only above the bubble point pressure. Vogel (1968), presented an empirical inflow per- formance relationship for solution gas drive reser- voirs, based on computer simulation results and a wide range of rock and fluid properties. His famous dimensionless IPR was developed for flow of satu- rated oil from a solution-gas drive reservoir into well ignoring skin effects. After Vogel, several empirical relationships have been developed to predict the performance of oil wells in saturated reservoirs. However, these IPRs are empirical and have been developed for homogenous, solution-gas drive res- ervoirs and may not be applicable to other cases. There are two major correlations to model the be- havior of IPR and can be categorized as empirically- derived and analytically-derived correlations. The empirically-derived are those derived from field or simulation data. The analytically-derived are those from the basic principal of mass balance that de- scribes multiphase flow within the reservoir. The limitations of empirically-derived correlations is in terms of issues in the ranges of data used in its gen- eration and they are not functions of reservoir rock and fluid data that vary per reservoir. For the analyt- ical approach, its limitation is in terms of difficulty in obtaining their data for its application. One simple method of predicting a well's inflow per- formance is the calculation of a productivity index (PI). The PI is a ratio of fluid production rate (Q) in barrels per day (BPD) to the difference between the static bottomhole pressure (BHPs) and the flowing bottomhole pressure (BHPf). The use of PROSPER (Production and Systems Per- formance Analysis Software) allows for efficient modelling of the well component of production sys- tems; Ozdogan and Gutman (2008). PROSPER ena- bles the creation of well models which form the link between subsurface and surface production system components. I 145 IJSER

Welcome message from author
This document is posted to help you gain knowledge. Please leave a comment to let me know what you think about it! Share it to your friends and learn new things together.
Transcript

International Journal of Scientific & Engineering Research, Volume 10, Issue 3, March-2019 ISSN 2229-5518
IJSER © 2019
http://www.ijser.org
Simulator Development for Evaluation of Inflow Performance Relationship of Solution Gas Drive
Reservoir Obia Ronald A.1, Nmegbu Godwin C. J.2, Ehirim Emmanuel O.3
1 Department of Petroleum Engineering, Rivers State University, Port Harcourt.
2 Department of Petroleum Engineering, Rivers State University, Port Harcourt.
3 Department of Chemical/ Petrochemical Engineering, Rivers State Universiy, Port Harcourt.
Abstract— This study evaluates the analysis of Inflow Performance Relationship (IPR) of a solution gas drive oil reservoir system (i.e.
Saturated Reservoir, case; Pr ≤ Pb ) using an ad-hoc (simulator Ronald Obia Simulator (ROS)) designed for the purpose of this research
work. The computer program (ROS) was developed in the cause of this study to analyze a 6-Test point Inflow performance Relationship
problem to give solutions with higher degree of accuracy and precision instead of solving the system manually. IPR describes the behavior
of the well’s flowing pressure and production rate, which is an important tool in understanding the reservoir/well behavior and quantifying
the production rate. The newly developed simulator is very easy and simple in terms of application. Fast and accurate results were
produced after being compared to calculations and results from the manual solution method. From the results obtained, a plot of wellbore
flowing pressure (Pwf) vs the simulated wellbore flowrate (Qo) was carried out. The IPR plots obtained revealed that the plot was initially a
straight line and then later deviated to a curve line. The straight line indicates a single phase system, whereas the curved line indicates a
two-phase system (oil and gas). The point of deviation from the straight line indicates the bubble point pressure. Furthermore, it reveals
that the point of deviation which is the bubble point pressure is 2000 psig. Finally, the application of the developed IPR simulator (ROS)
was validated with PROSPER and proven to be very accurate and efficient in calculations involving Inflow Performance Relationship and
also plotting of the corresponding IPR curves. Hence, the newly developed IPR simulator should be introduced to higher institutions and oil
and gas firms to assist them on proffering solutions to problems involving IPR calculations and beyond.
Index Terms—Bubble Point Pressure, Graphic User Interface (GUI), Inflow Performance Relationship (IPR), Productivity Index, Saturated
Reservoir, Simulator, Wellbore Flowing Pressure.
—————————— ——————————
1 INTRODUCTION
t is generally assumed that fluid inflow rate is proportional to the difference between wellbore pressure and reservoir pressure. This assumption
leads to a linear relationship that is derived from Darcy’s law for steady state flow of an incompressi-ble, single phase fluid and is called productivity in-dex (PI). However, this assumption is valid only above the bubble point pressure.
Vogel (1968), presented an empirical inflow per-formance relationship for solution gas drive reser-voirs, based on computer simulation results and a wide range of rock and fluid properties. His famous dimensionless IPR was developed for flow of satu-rated oil from a solution-gas drive reservoir into well ignoring skin effects. After Vogel, several empirical relationships have been developed to predict the performance of oil wells in saturated reservoirs. However, these IPRs are empirical and have been developed for homogenous, solution-gas drive res-ervoirs and may not be applicable to other cases.
There are two major correlations to model the be-havior of IPR and can be categorized as empirically-derived and analytically-derived correlations. The empirically-derived are those derived from field or simulation data. The analytically-derived are those
from the basic principal of mass balance that de-scribes multiphase flow within the reservoir. The limitations of empirically-derived correlations is in terms of issues in the ranges of data used in its gen-eration and they are not functions of reservoir rock and fluid data that vary per reservoir. For the analyt-ical approach, its limitation is in terms of difficulty in obtaining their data for its application. One simple method of predicting a well's inflow per-formance is the calculation of a productivity index (PI). The PI is a ratio of fluid production rate (Q) in barrels per day (BPD) to the difference between the static bottomhole pressure (BHPs) and the flowing bottomhole pressure (BHPf). The use of PROSPER (Production and Systems Per-formance Analysis Software) allows for efficient modelling of the well component of production sys-tems; Ozdogan and Gutman (2008). PROSPER ena-bles the creation of well models which form the link between subsurface and surface production system components.
I
145
IJSER

International Journal of Scientific & Engineering Research, Volume 10, Issue 3, March-2019 ISSN 2229-5518
IJSER © 2019
http://www.ijser.org
2 DESIGN METHODOLGY
2.1 Programming Tool
An ad-hoc computer simulator (ROS) is developed for the purpose of this project to solve Inflow Per-formance Relationship problems considering a solu-tion gas drive oil reservoir system (case: Saturated reservoir i.e. Pr < Pb). This simulator is developed using Java source codes written in Java programming language with the aid of a java virtual machine incorporated inside a Compiler called NetBeans Integrated Development Environment. A 6-Test Point wellbore flowing pressure data gotten from a Niger Delta well is used for the analyses of the project work.
2.2 IPR Correlations
Many IPR correlations addressed the curvature of the inflow performance curves in case of solution gas drive oil reservoirs in which Pb is the initial reservoir pressure. Based on the literature survey, the most known IPR correlations can be subdivided into em-pirically and analytically derived correlations. Some of the most known empirical correlations are Vogel (1968), Fetkovich (1994), Kilns and Majcher (1992), Wiggins (2005), and Sukarno and Wisnogroho (1995). Some of the most known analytical correla-tions are Wiggins (1993) and Archer & Del Castillo (2003).
2.3 IPR Models
For the purpose of this work, three major models are used for the development of the IPR simulator and computation. The three models used are as follows: Vogel Model
𝑄𝑜=𝑄𝑜𝑚𝑎𝑥[1−0.2(𝑃𝑤𝑓 /𝑃𝑟) −0.8(𝑃𝑤𝑓/𝑃𝑟)2] (1)
Wiggins Model 𝑄𝑜=𝑄𝑜𝑚𝑎𝑥[1−0.52(𝑃𝑤𝑓 /𝑃𝑟) −0.48(𝑃𝑤𝑓/𝑃𝑟)2] (2) Fetkovich Model 𝑄o = c (𝑃r 2 - 𝑃𝑤𝑓 2 )n (3)
Where;
𝑄o = oil flowrate , STB/day
(𝑄o)max = maximum oil flow rate at zero wellbore
pressure, i.e., the AOF
Pr= current average reservoir pressure, psig
Pwf = wellbore pressure, psig
c= performance coefficient
n= reservoir exponent value
AOF= Absolute Open Flow
Assumptions for IPR models
i. Saturated Reservoir
ii. Fluid is slightly compressible
iii. Stabilized wellbore flowing pressure
iv. Homogenous reservoir
v. Reservoir exponent value does not change
across the reservoir
vi. Constant density
vii. The reservoir system is isotropic
viii. No skin effect
2.4 Wellbore and Reservoir Data
A 6-test point wellbore flowing pressure data, a stabilized wellbore pressure, average reservoir pres-sure and a stabilized wellbore flowrate data obtained from a Niger Delta oil well, are being used for this project.
Also, the reservoir performance coefficient (C) and exponents (n) which are factors that accounts for reservoir data are used as well.
2.5 Simulator Design Steps
Step 1: Problem Definition This is the most important step in the simu-lator development which is defining the problem to be solved. Step 2: Project Planning There are constraints involve in the simulator devel-opment which are: Time and Resources. It took so much time to carry out this project. Especially the writing of the source code that gave birth to the simulator. Gathering the required resources was also of primary importance. This involved downloading several Production and Reservoir Engineering books, getting a high speed Laptop, acquiring the latest Microsoft excel Applica-tion Package, downloading the latest NetBeans Inte-grated Development Environment, JFreeChart soft-ware Library and other Java Programming language modules. Step 3: Model Definition Here, the three required mathematical model was identified. That is the Vogel, Wiggins and Fetkovich model.
146
IJSER

International Journal of Scientific & Engineering Research, Volume 10, Issue 3, March-2019 ISSN 2229-5518
IJSER © 2019
http://www.ijser.org
Step 4: Model Formulation Understanding how the actual system behaves and determining the basic requirements. Creating a flowchart and Pseudocode of how the system oper-ates. Step 5: Input Data Collection and Analysis In this step, all the required input data are itemized and then calculated manually using the three differ-ent IPR models to solve for Wellbore Flowrates and production of Inflow Performance Curves. Step 6: Model Transformation In this step, the three different mathematical models are transformed into programming language. That is; the Vogel, Wiggins and Fetkovich model are transformed to programming codes using the Net-Beans Integrated Development Environment. Step 7: Verification and Validation At this stage, the already developed simulator is tested for runtime and compile time errors. That is; the simulator is tested if it will actually run as de-sired. A simulator can be verified but not valid. Hence, the developed simulator (ROS) was validated using numerical values and then the results pro-duced was compared to those gotten from manual solution method and PROSPER.
2.6 Simulator Pseudocode
As a result of the complex nature of the java source code used for developing the ROS simulator, a Pseudocode for the program is presented for better understanding of the simulator design.
Program Start: Importation of the required packages and mod-
ules; Creating the front panel to handle the Graphic
User Interface (GUI); Creating the Text fields for all the required input
data; Creating uneditable text fields to hold the output
data; Adding all the created components to the GUI
panel; addGB( write, x=6,y=0); addGB( new JLabel("Stab Pwf"), x=0,y=2); addGB( stpwf, x=1,y=2);
Creating the buttons to handle the computation-
al task Formatting the keyboard input texts to numbers; Using the IF and TRY statements to check for
errors and exceptions;
try { if(p1str.length() != 0 && p2str.length() != 0 && }
Using the CATCH statement to address the er-rors;
} catch (Exception e){ e.printStackTrace(); }
Converting all the mathematical models to com-puter language. public double Pindex() { double b; b=sqo1/(spr1-spw1); return b; } public double compvq1() { double c; c=compvmax()*(1-(0.2*(p1/spr1))-(0.8*(Math.pow((p1/spr1), 2)))); return c; }
Assigning the computed results to the out-
put GUI textfield. Program End
2.7 Steps to Calculate Percentage Error
1. Subtract the accepted value from the experi-
mental value.
2. Take the absolute value of step 1.
3. Divide that answer by the accepted value.
4. Multiply that answer by 100 and add the % symbol to express answer in percentage.
That is: percentage error (%)
= (ROS – Manual Method)/ Manual Method
and error (%)= (ROS – PROSPER)/ PROSPER
147
IJSER

International Journal of Scientific & Engineering Research, Volume 10, Issue 3, March-2019 ISSN 2229-5518
IJSER © 2019
http://www.ijser.org
Table 1. Input Parameters
Fig.1. GUI of ROS Simulator
SIMULATOR INPUT PARAMETERS
Sta
bil
ized
W
ellb
ore
fl
ow
rate
,
Qo (
ST
B/d
ay
)
Res
erv
oir
Ex
pon
ent
Va
lue
(n
)
Av
era
ge
Res
erv
oir
P
ress
ure
,
Pr
(Psi
g)
Sta
bil
ized
w
ellb
ore
fl
ow
ing
pre
ssu
re ,
Pw
f (P
sig
)
Wellbore flowing
pressure, Pwf
(Psig)
VOGEL
WIGGINS
FETKOVICH
35
0
0.8
5
25
00
20
00
Pwf(1) 2500 2500 2500 Pwf(2) 2200 2200 2200 Pwf(3) 1500 1500 1500 Pwf(4) 1000 1000 1000 Pwf(5) 500 500 500 Pwf(6) 0 0 0
148
IJSER
International Journal of Scientific & Engineering Research, Volume 10, Issue 3, March-2019 ISSN 2229-5518
IJSER © 2019
http://www.ijser.org
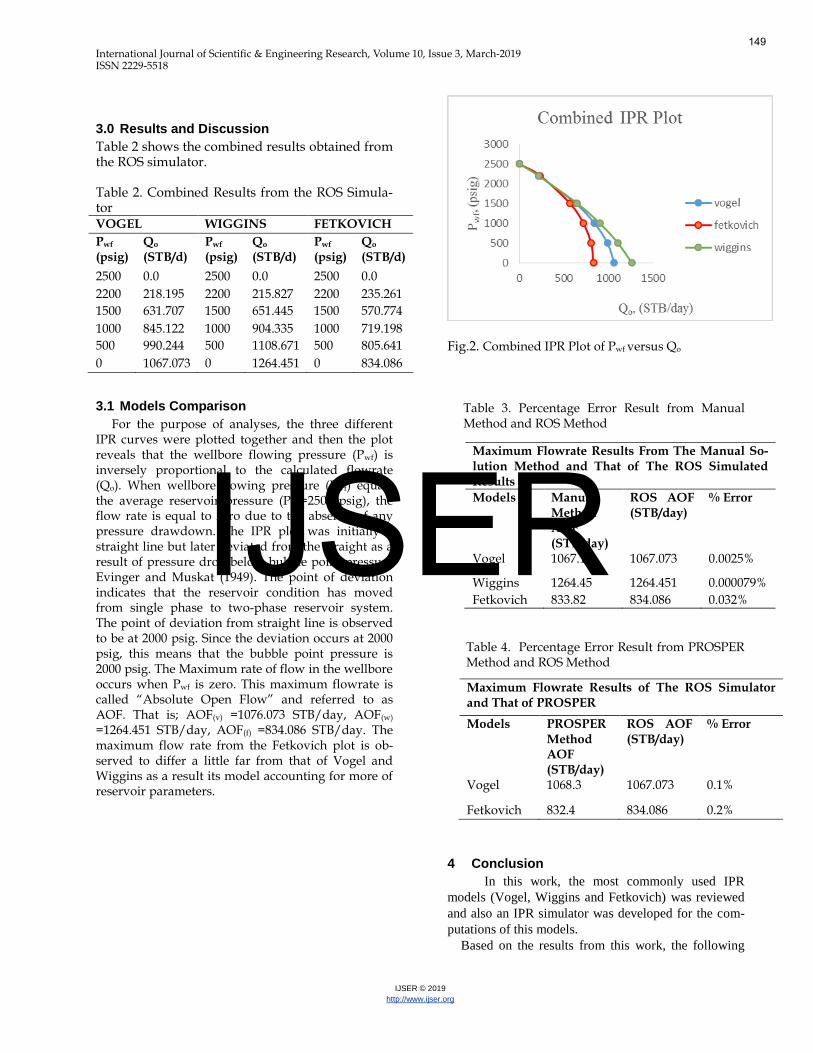
3.0 Results and Discussion
Table 2 shows the combined results obtained from the ROS simulator. Table 2. Combined Results from the ROS Simula-tor VOGEL WIGGINS FETKOVICH
Pwf (psig)
Qo (STB/d)
Pwf (psig)
Qo
(STB/d) Pwf
(psig) Qo (STB/d)
2500 0.0 2500 0.0 2500 0.0
2200 218.195 2200 215.827 2200 235.261
1500 631.707 1500 651.445 1500 570.774
1000 845.122 1000 904.335 1000 719.198
500 990.244 500 1108.671 500 805.641
0 1067.073 0 1264.451 0 834.086
3.1 Models Comparison
For the purpose of analyses, the three different IPR curves were plotted together and then the plot reveals that the wellbore flowing pressure (Pwf) is inversely proportional to the calculated flowrate (Qo). When wellbore flowing pressure (Pwf) equals the average reservoir pressure (Pr =2500 psig), the flow rate is equal to zero due to the absence of any pressure drawdown. The IPR plot was initially a straight line but later deviated from the straight as a result of pressure drop below bubble point pressure Evinger and Muskat (1949). The point of deviation indicates that the reservoir condition has moved from single phase to two-phase reservoir system. The point of deviation from straight line is observed to be at 2000 psig. Since the deviation occurs at 2000 psig, this means that the bubble point pressure is 2000 psig. The Maximum rate of flow in the wellbore occurs when Pwf is zero. This maximum flowrate is called “Absolute Open Flow” and referred to as AOF. That is; AOF(v) =1076.073 STB/day, AOF(w) =1264.451 STB/day, AOF(f) =834.086 STB/day. The maximum flow rate from the Fetkovich plot is ob-served to differ a little far from that of Vogel and Wiggins as a result its model accounting for more of reservoir parameters.
Fig.2. Combined IPR Plot of Pwf versus Qo Table 3. Percentage Error Result from Manual Method and ROS Method
Table 4. Percentage Error Result from PROSPER Method and ROS Method
4 Conclusion
In this work, the most commonly used IPR
models (Vogel, Wiggins and Fetkovich) was reviewed
and also an IPR simulator was developed for the com-
putations of this models.
Based on the results from this work, the following
Maximum Flowrate Results From The Manual So-lution Method and That of The ROS Simulated Results
Models Manual Method AOF (STB/day)
ROS AOF (STB/day)
% Error
Vogel 1067.1 1067.073 0.0025%
Wiggins 1264.45 1264.451 0.000079%
Fetkovich 833.82 834.086 0.032%
Maximum Flowrate Results of The ROS Simulator and That of PROSPER
Models PROSPER Method AOF (STB/day)
ROS AOF (STB/day)
% Error
Vogel 1068.3 1067.073 0.1%
Fetkovich 832.4 834.086 0.2%
149
IJSER
International Journal of Scientific & Engineering Research, Volume 10, Issue 3, March-2019 ISSN 2229-5518
IJSER © 2019
http://www.ijser.org
conclusions were drawn:
The developed simulator produced accurate re-
sults of flowrates and also inflow performance rela-
tionship of the wellbore of a solution gas drive res-
ervoir.
The IPR calculations; if done manually, is a tedious
task but the introduction of the simulator makes it very
easy to compute and analyze. However the simulator
was able to eliminate the stress involve in analyzing
inflow performance relationship using more number of
test-points.
From the combined IPR plot in figure 2, it reveals
that the plot of pressure against flowrate gives a
straight line for a single phase oil reservoir system.
Whereas for two-phase system (oil and gas), the IPR
plot is a curved line.
The pressure and flowrate varies inversely pro-
portional to each other.
Comparing maximum flowrate results from the
manual solution method with that of the ROS simu-
lated results, Vogel’s model gave a percentage error
of 0.0025%, Wiggin’s model gave a percentage error
of 0.000079% and Fetkovich model gave a percentage
error of 0.03%.
Comparing maximum flowrate results from the
ROS solution method with that of PROSPER simu-
lated results, Vogel’s model gave a percentage error
of 0.1% and Fetkovich model gave a percentage error
of 0.2%.
From the percentage error results, it however
proves the ROS simulator to be accurately validated.
5.0 APPENDICES
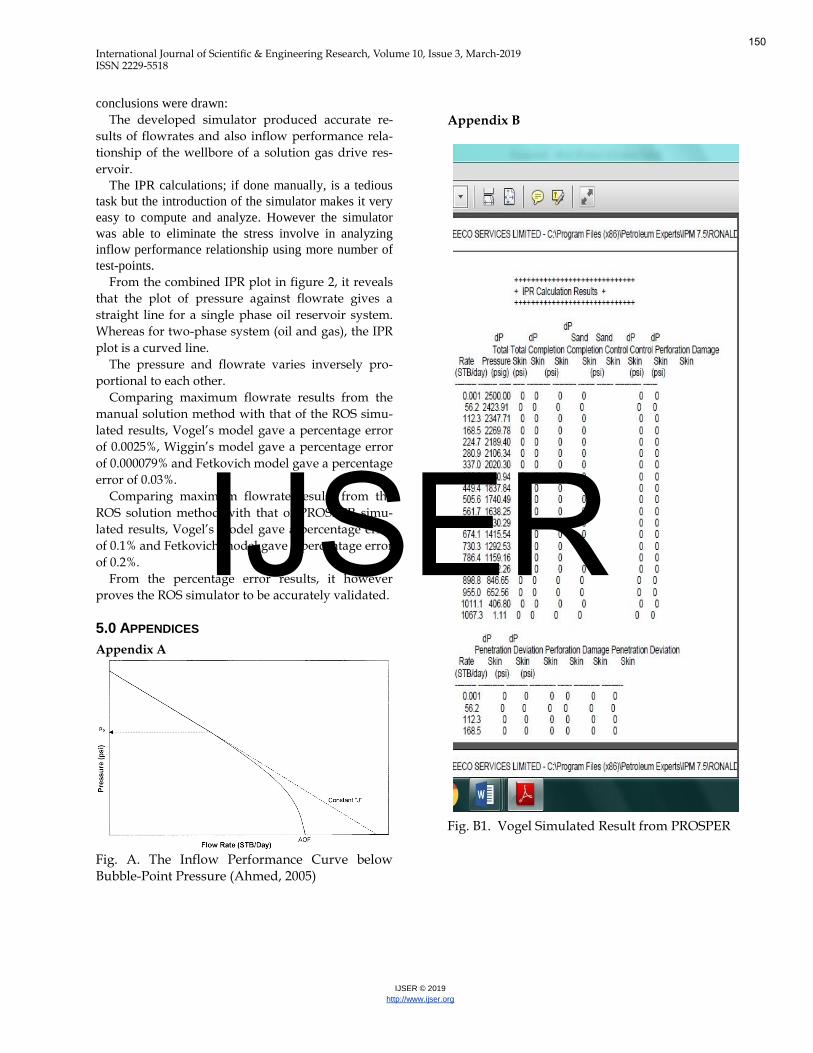
Appendix A
Fig. A. The Inflow Performance Curve below Bubble-Point Pressure (Ahmed, 2005)
Appendix B
Fig. B1. Vogel Simulated Result from PROSPER
150
IJSER
International Journal of Scientific & Engineering Research, Volume 10, Issue 3, March-2019 ISSN 2229-5518
IJSER © 2019
http://www.ijser.org
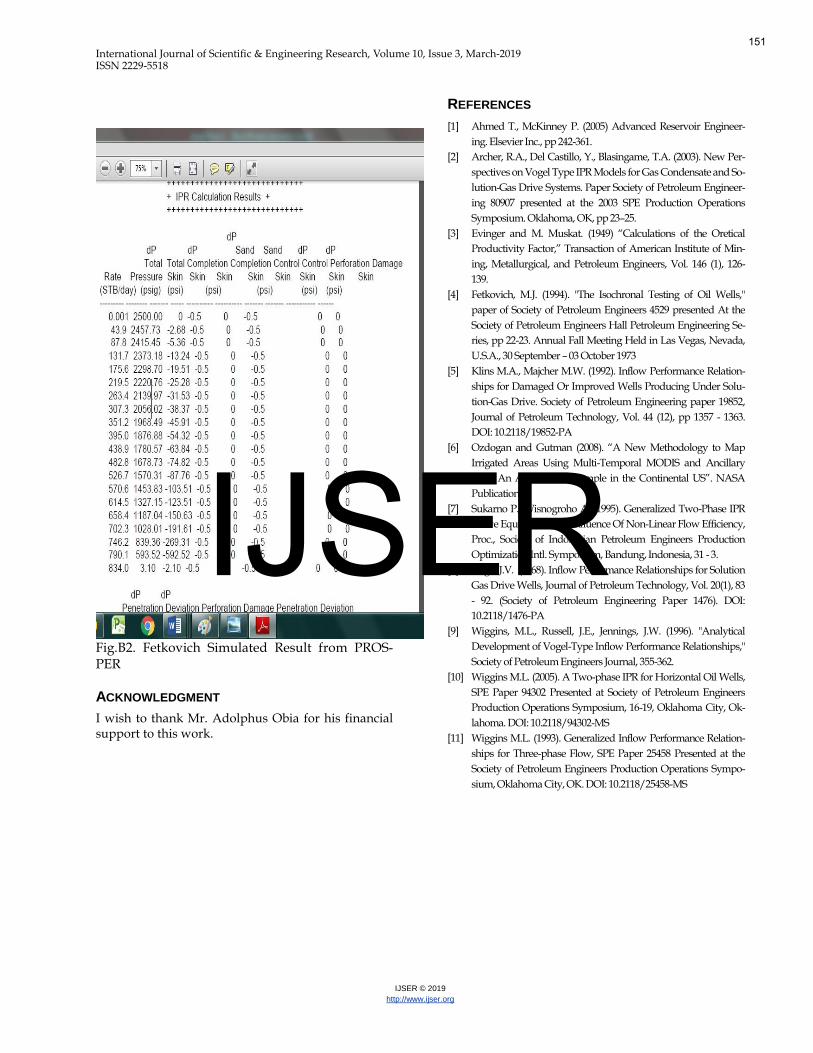
Fig.B2. Fetkovich Simulated Result from PROS-PER
ACKNOWLEDGMENT
I wish to thank Mr. Adolphus Obia for his financial support to this work.
REFERENCES
[1] Ahmed T., McKinney P. (2005) Advanced Reservoir Engineer-
ing. Elsevier Inc., pp 242-361.
[2] Archer, R.A., Del Castillo, Y., Blasingame, T.A. (2003). New Per-
spectives on Vogel Type IPR Models for Gas Condensate and So-
lution-Gas Drive Systems. Paper Society of Petroleum Engineer-
ing 80907 presented at the 2003 SPE Production Operations
Symposium. Oklahoma, OK, pp 23–25.
[3] Evinger and M. Muskat. (1949) “Calculations of the Oretical
Productivity Factor,” Transaction of American Institute of Min-
ing, Metallurgical, and Petroleum Engineers, Vol. 146 (1), 126-
139.
[4] Fetkovich, M.J. (1994). "The Isochronal Testing of Oil Wells,"
paper of Society of Petroleum Engineers 4529 presented At the
Society of Petroleum Engineers Hall Petroleum Engineering Se-
ries, pp 22-23. Annual Fall Meeting Held in Las Vegas, Nevada,
U.S.A., 30 September – 03 October 1973
[5] Klins M.A., Majcher M.W. (1992). Inflow Performance Relation-
ships for Damaged Or Improved Wells Producing Under Solu-
tion-Gas Drive. Society of Petroleum Engineering paper 19852,
Journal of Petroleum Technology, Vol. 44 (12), pp 1357 - 1363.
DOI: 10.2118/19852-PA
[6] Ozdogan and Gutman (2008). “A New Methodology to Map
Irrigated Areas Using Multi-Temporal MODIS and Ancillary
Data. An Application Example in the Continental US”. NASA
Publications.
[7] Sukarno P., Wisnogroho A. (1995). Generalized Two-Phase IPR
Curve Equation Under Influence Of Non-Linear Flow Efficiency,
Proc., Society of Indonesian Petroleum Engineers Production
Optimization Intl. Symposium, Bandung, Indonesia, 31 - 3.
[8] Vogel J.V. (1968). Inflow Performance Relationships for Solution
Gas Drive Wells, Journal of Petroleum Technology, Vol. 20(1), 83
- 92. (Society of Petroleum Engineering Paper 1476). DOI:
10.2118/1476-PA
[9] Wiggins, M.L., Russell, J.E., Jennings, J.W. (1996). "Analytical
Development of Vogel-Type Inflow Performance Relationships,"
Society of Petroleum Engineers Journal, 355-362.
[10] Wiggins M.L. (2005). A Two-phase IPR for Horizontal Oil Wells,
SPE Paper 94302 Presented at Society of Petroleum Engineers
Production Operations Symposium, 16-19, Oklahoma City, Ok-
lahoma. DOI: 10.2118/94302-MS
[11] Wiggins M.L. (1993). Generalized Inflow Performance Relation-
ships for Three-phase Flow, SPE Paper 25458 Presented at the
Society of Petroleum Engineers Production Operations Sympo-
sium, Oklahoma City, OK. DOI: 10.2118/25458-MS
151
IJSER
Related Documents