Accepted Manuscript Simulation of the UQ Gatton natural draft dry cooling tower Xiaoxiao Li, Zhiqiang Guan, Hal Gurgenci, Yuanshen Lu, Suoying He PII: S1359-4311(16)30333-7 DOI: http://dx.doi.org/10.1016/j.applthermaleng.2016.03.041 Reference: ATE 7909 To appear in: Applied Thermal Engineering Received Date: 23 November 2015 Revised Date: 27 February 2016 Accepted Date: 9 March 2016 Please cite this article as: X. Li, Z. Guan, H. Gurgenci, Y. Lu, S. He, Simulation of the UQ Gatton natural draft dry cooling tower, Applied Thermal Engineering (2016), doi: http://dx.doi.org/10.1016/j.applthermaleng.2016.03.041 This is a PDF file of an unedited manuscript that has been accepted for publication. As a service to our customers we are providing this early version of the manuscript. The manuscript will undergo copyediting, typesetting, and review of the resulting proof before it is published in its final form. Please note that during the production process errors may be discovered which could affect the content, and all legal disclaimers that apply to the journal pertain. brought to you by CORE View metadata, citation and similar papers at core.ac.uk provided by University of Queensland eSpace

Welcome message from author
This document is posted to help you gain knowledge. Please leave a comment to let me know what you think about it! Share it to your friends and learn new things together.
Transcript

Accepted Manuscript
Simulation of the UQ Gatton natural draft dry cooling tower
Xiaoxiao Li, Zhiqiang Guan, Hal Gurgenci, Yuanshen Lu, Suoying He
PII: S1359-4311(16)30333-7
DOI: http://dx.doi.org/10.1016/j.applthermaleng.2016.03.041
Reference: ATE 7909
To appear in: Applied Thermal Engineering
Received Date: 23 November 2015
Revised Date: 27 February 2016
Accepted Date: 9 March 2016
Please cite this article as: X. Li, Z. Guan, H. Gurgenci, Y. Lu, S. He, Simulation of the UQ Gatton natural draft dry
cooling tower, Applied Thermal Engineering (2016), doi: http://dx.doi.org/10.1016/j.applthermaleng.2016.03.041
This is a PDF file of an unedited manuscript that has been accepted for publication. As a service to our customers
we are providing this early version of the manuscript. The manuscript will undergo copyediting, typesetting, and
review of the resulting proof before it is published in its final form. Please note that during the production process
errors may be discovered which could affect the content, and all legal disclaimers that apply to the journal pertain.
brought to you by COREView metadata, citation and similar papers at core.ac.uk
provided by University of Queensland eSpace
17th IAHR International Conference on Cooling Tower and Heat Exchanger, 7-11 September 2015, Gold Coast,
Queensland, Australia
Simulation of the UQ Gatton natural draft dry cooling tower
Xiaoxiao Li1 *, Zhiqiang Guan
1, Hal Gurgenci
1, Yuanshen Lu
1, Suoying He
2
1 School of Mechanical and Mining Engineering, The University of Queensland, Brisbane, Australia
2School of Energy Source and Power Engineering, Shandong University, Jinan, China
Highlights:
1. The full scale 1-D and 3-D simulation models of a 20m NDDCT was developed.
2. The ambient temperature and hot water inlet temperature effect had been investigated
3. The crosswind effect on the small NDDCT was analysed and discussed
ABSTRACT: A Natural draft dry cooling tower (NDDCT) is a cost-effective cooling
technology which can be utilized in most of the small renewable power plants. While a
number of numerical studies have been done on NDDCTs in recent decades, experimental
studies on full scale small cooling tower are very few. To fill this gap, Queensland
Geothermal Energy Centre of Excellence (QGECE) has built a 20 m NDDCT. In this study, a
1-D analytical and a 3-D CFD models of this cooling tower were developed and the cooling
performance was investigated at different ambient temperatures, inlet water temperatures and
crosswind speeds. The results show that NDDCT in such a size is capable for a 2~3 MW CST
power plant. The cooling performance of the NDDCT decreases with the increase in the
ambient temperature and the decrease in the inlet water temperature. In terms of the
crosswind, the heat rejection ratio decreases with the increase of the crosswind velocity at
low crosswind speeds. However, when the crosswind speed becomes large enough, the heat
dumped at the bottom of the tower can compensate some losses in cooling capacity caused by
crosswind. The results found in the present study give reference for future tests.
Key words: Natural draft dry cooling tower (NDDCT), Cooling performance, CFD modelling
* Corresponding author. E-mail address: [email protected] (X. Li)
Nomenclature
A Area (m2)
C Inertial resistance factor
Cp Specific heat (J Kg-1
K-1
)
CD Drag coefficient
d Diameter (m)
h Empirical heat transfer (W m-2
K-1
)
H Height, elevation (m)
K Flow resistance
L length (m)
m Mass flow rate (kg/s)
n Number
P Pressure (Pa)
Q Heat transfer rate (W)
q Heat flux (W m-2
)
Re Reynolds Number
T Temperature (°C)
v Velocity scalar (m s-1
)
Greek letters
α Permeability
δ Enthalpy of air (J) σ Compact area ratio of the heat exchanger
ε Turbulent kinetic energy dissipation (m2
s-3
)
η Efficiency
κ Turbulent kinetic energy (m2 s
-2)
ρ, Density, mean density (kg m-3
)
μ Viscosity (kg m-1
s-1
)
Vectors
F
Force
v
Velocity
kji
,, Unit vectors of x-, y-, z- direction in
Cartesian coordinate system
Subscripts
a, w Air side, water side
cw Crosswind
e Effective
fr front area
he Heat exchanger
i, o Inside or inlet, outside or outlet
t Tube
u Over all
0 Reference value
ts Tower support
ctc Heat exchanger compact
cte Heat exchanger expansion
cto Tower outlet
1,2,3,4,5 Different location of cooling tower
1. INTRODUCTION
Natural Draft Dry Cooling Towers (NDDCTs) have been successfully used in traditional
thermal power plants for several decades. Towers used in such plants are typically more than
100 m in height [1, 2]. Geothermal power plants and concentrated solar thermal (CST) power
plants are promising renewable power generation systems. Compared with conventional
thermal power plants, these plants are likely to be smaller and usually located in water
deficient areas [3]. Short-NDDCTs, which can effectively discharge heat and do not consume
any water and electricity, are likely to be a feasible cooling technology for these kinds of
power plants [4, 5] . Past studies have identified the vulnerability of short natural draft towers
to ambient influences, especially the crosswind and the hot ambient temperature [6-9]. This
paper describes the simulated performance of a 20m tall experimental NDDCT constructed at
the University of Queensland.
Kroger et al. [1] summarized the past researches on air-cooled heat exchangers and the
fluids mechanics and proposed a useful 1-D analytical model to predict the cooling efficiency
of NDDCTs in the absence of crosswind. Their 1-D model combines the energy balance
equations and the air flow draft equations and have been validated against the industrial data
[1]. When these two groups of equations are both satisfied, the cooling performance of the
NDDCT can be calculated.
The influence of the crosswind has received significant attention in the last few
decades[10-12]. Su et.al [13] simulated the fluid flow and the temperature distribution of the
dry cooling tower under the crosswind. The results without crosswind have been compared
against those obtained with crosswind, at the speeds of 5 and 10 m/s. Based on the simulation
result, the authors explained how the crosswind affects the cooling performance of the tower.
Al-Waked and Benhia [6] analysed the performance of a NDDCT under crosswind using a
three-dimensional computational model. The effectiveness of the windbreak walls has also
been studied in this paper. The authors proposed the ratio of the amount heat at crosswind
condition to the maximum amount of rejected heat which occurs in the windless condition to
better express the effect of the crosswind. According to their simulation results, the crosswind
velocity has a big effect on the cooling performance of the NDDCT. The cooling
performance drops by 30% when the wind velocity exceeds 10 m.s-1
. Lu et.al [14, 15]
investigated the crosswind effect on small sized NDDCTs. They examined the simulated
performance of a 15 m NDDCT with horizontally-arranged heat exchangers. Different
velocities and different angles of the wind were discussed. Zhao et al [16, 17] studied the
cooling performance of a NDDCT with vertical delta radiators under the constant heat load.
With constant heat load and uniform water inlet temperature, the cooling performance of each
heat exchanger sector was analysed under crosswind impact. The authors claimed that with
increasing crosswind velocity, the cooling performance of NDDCT under constant heat load
deteriorates sharply at low velocity, but varies slightly at high velocity.
QGECE has been developing the small size NDDCT for CST and geothermal power
generation systems [8, 14, 15, 18]. This research is necessary because the existing NDDCT
design is optimised for large stream power plant, and is not optimal for a CST plant. A 20m
high NDDCT designed for CST power plant is commissioned and will be tested for the future
application as a part of CST energy system. Based on the above literature review, for short
NDDCTs (less than 30m height), their cooling performance is more sensitive to the ambient
conditions. Therefore, an accurate simulation of the ambient influence on a small sized
NDDCT is a very important prerequisite for the future test on the same NDDCT. In this paper,
the results of the 1-D and 3-D models of the Gatton NDDCT are presented. The objectives of
this work are as follows: (1) to study the influence of the ambient temperature and crosswind
on this specific small NDDCT. (2) to prepare the future test on the same NDDCT.
2. 1-D SIMULATIONS
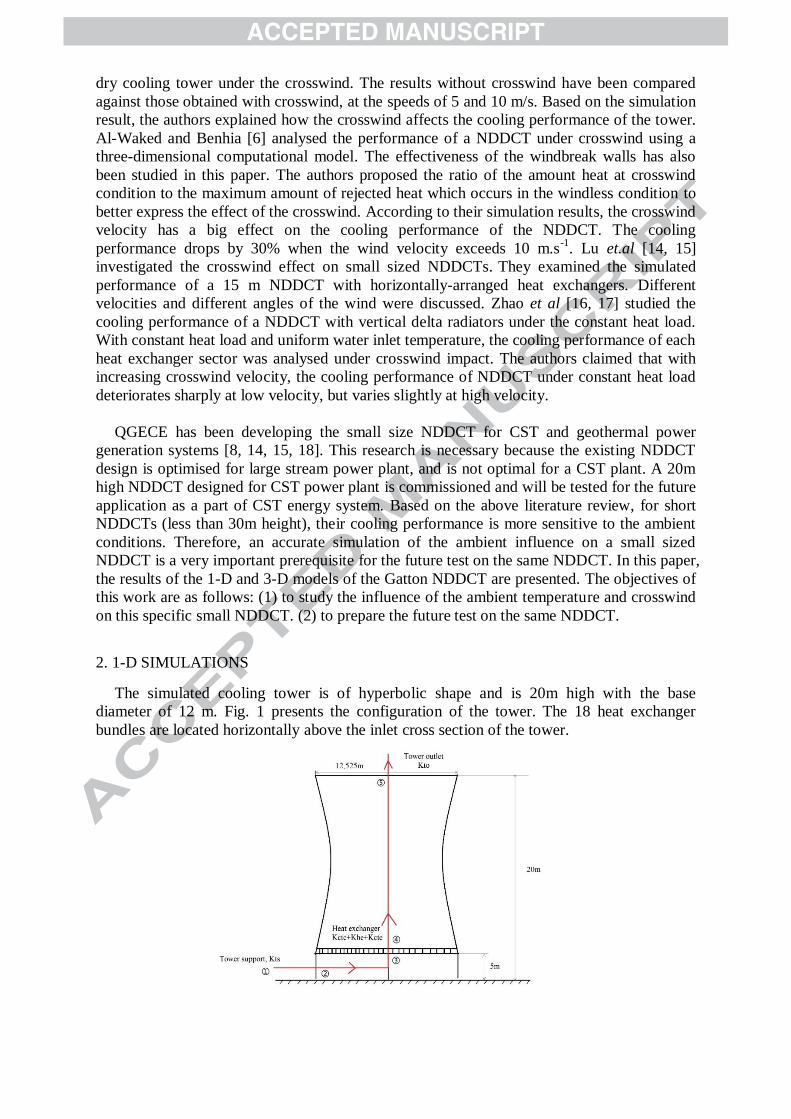
The simulated cooling tower is of hyperbolic shape and is 20m high with the base
diameter of 12 m. Fig. 1 presents the configuration of the tower. The 18 heat exchanger
bundles are located horizontally above the inlet cross section of the tower.
Figure 1: Gatton cooling tower configuration
To calculate the performance of the cooling tower, the energy balance equations and draft
equations must be satisfied simultaneously. The assumptions of the 1D model are as
following: 1) The cooling tower is operated in the stable condition. 2). The flow resistances
other than tower support, the heat exchanger and the tower outlet were neglected. 3) The heat
transfer process only happens in the air-cooled heat exchanger. As presented in Fig. 1, the
pressure drops between positions 1 and 5 include: the tower support resistance (Kts), the heat
exchanger compact resistance (Kctc), the heat exchanger expansion resistance (Kcte), the heat
exchanger bundle resistance (Khe) and the tower outlet resistance (Kto).
Using these five coefficients, the draft equation of the cooling tower can be expressed as
[1]
(1)
The definitions of all terms can be found in the Nomenclature table. The tower support loss
coefficient based on the conditions at the tower support is given by Kroge [1]
(2)
The heat exchanger contraction and expansion loss coefficients can be calculated using the
Eqs. (3) and (4) respectively [1].
(3)
(4)
For towers with cylindrical outlets, the loss coefficient is given by [1]
(5)
where
(6)
The logarithmic mean temperature difference method was selected to calculate heat
transfer process of the heat exchanger [19]. The heat transferred in the air-cooled heat
exchanger can be presented by Eqs. (7) or (8).
(7)
or
(8)
For NDDCTs, the air-cooled heat exchanger is one of the most important part and in an
air-cooled heat exchanger, the air side loss contributes the most heat transfer resistance [19].
To simplify the calculation, this paper correlated the heat transfer coefficient (UA) and the
loss coefficient (Khe) as functions of Reynold number of the air (Reair). The software Aspen
Exchanger Design and Rating was used to get the correlations of Reair with UA and Khe. The
simulation results have been compared with the data provided by the heat exchanger
manufacturer. The deviation of the simulation is less than 3%.
For this particular heat exchanger configuration in the Gatton cooling tower, Eq. (9) and
(10) express the correlations of Reair and UA and Khe., respectively,
(9)
(10)
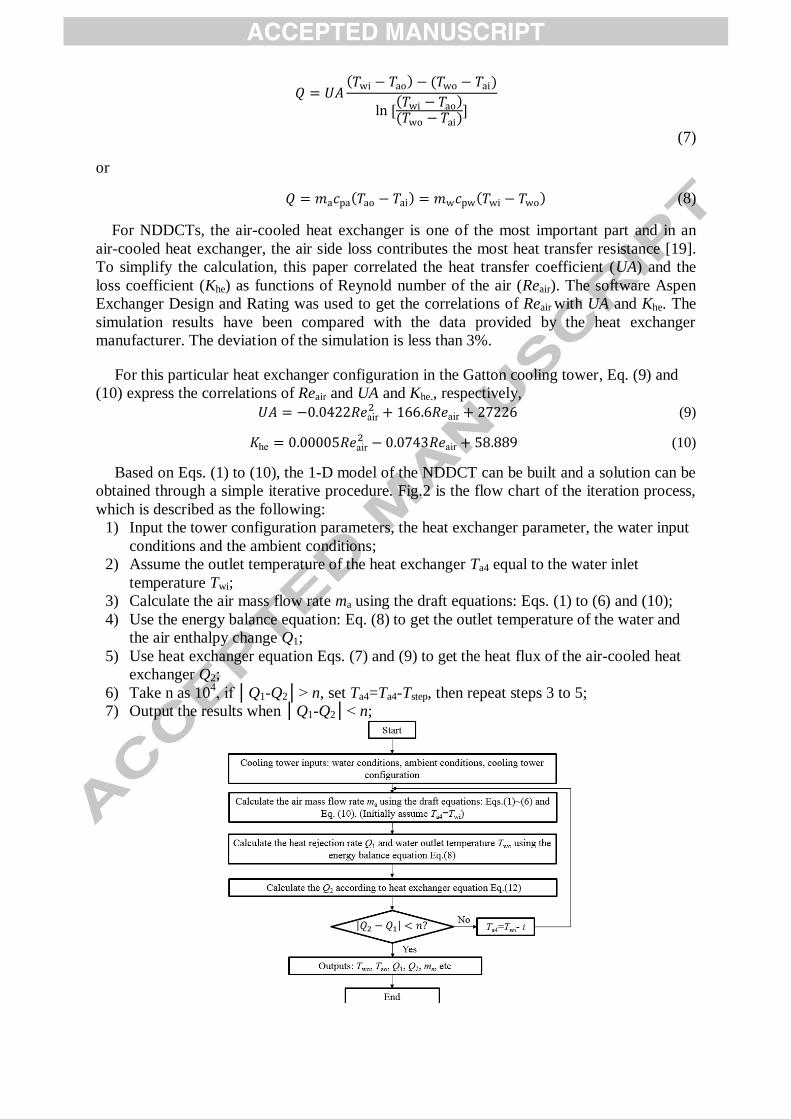
Based on Eqs. (1) to (10), the 1-D model of the NDDCT can be built and a solution can be
obtained through a simple iterative procedure. Fig.2 is the flow chart of the iteration process,
which is described as the following:
1) Input the tower configuration parameters, the heat exchanger parameter, the water input
conditions and the ambient conditions;
2) Assume the outlet temperature of the heat exchanger Ta4 equal to the water inlet
temperature Twi;
3) Calculate the air mass flow rate ma using the draft equations: Eqs. (1) to (6) and (10);
4) Use the energy balance equation: Eq. (8) to get the outlet temperature of the water and
the air enthalpy change Q1;
5) Use heat exchanger equation Eqs. (7) and (9) to get the heat flux of the air-cooled heat
exchanger Q2;
6) Take n as 104, f │Q1-Q2│> n, set Ta4=Ta4-Tstep, then repeat steps 3 to 5;
7) Output the results when │Q1-Q2│< n;
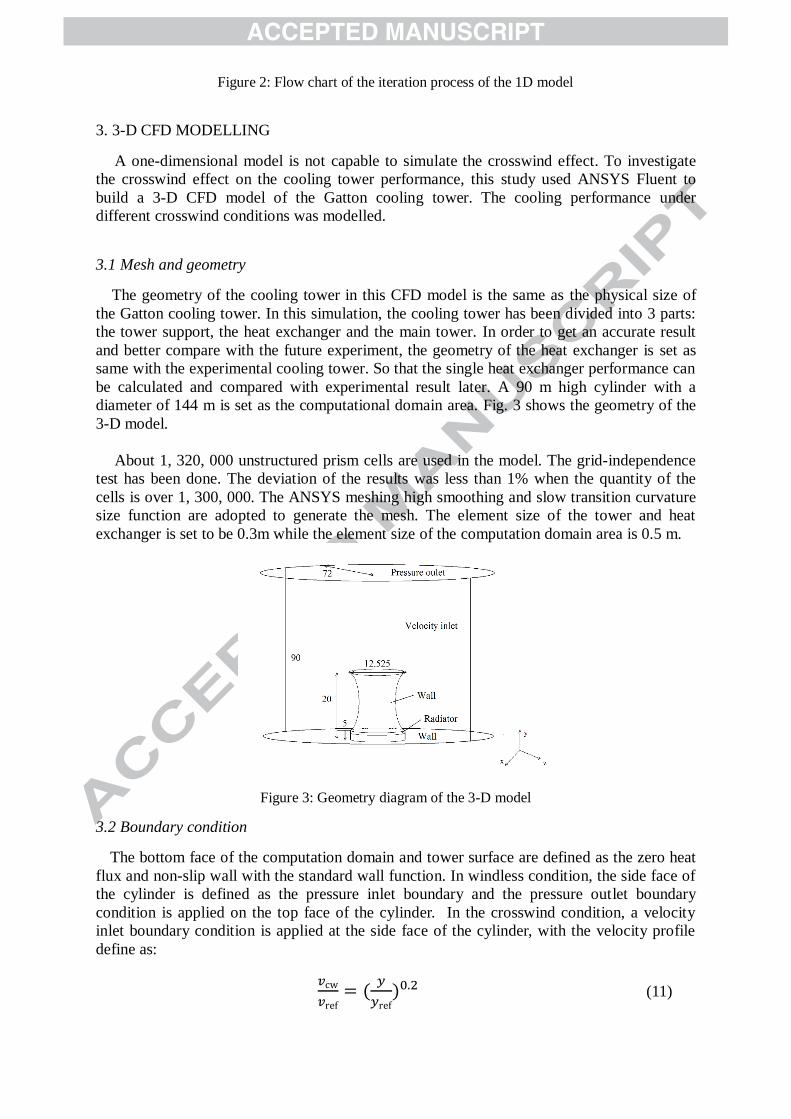
Figure 2: Flow chart of the iteration process of the 1D model
3. 3-D CFD MODELLING
A one-dimensional model is not capable to simulate the crosswind effect. To investigate
the crosswind effect on the cooling tower performance, this study used ANSYS Fluent to
build a 3-D CFD model of the Gatton cooling tower. The cooling performance under
different crosswind conditions was modelled.
3.1 Mesh and geometry
The geometry of the cooling tower in this CFD model is the same as the physical size of
the Gatton cooling tower. In this simulation, the cooling tower has been divided into 3 parts:
the tower support, the heat exchanger and the main tower. In order to get an accurate result
and better compare with the future experiment, the geometry of the heat exchanger is set as
same with the experimental cooling tower. So that the single heat exchanger performance can
be calculated and compared with experimental result later. A 90 m high cylinder with a
diameter of 144 m is set as the computational domain area. Fig. 3 shows the geometry of the
3-D model.
About 1, 320, 000 unstructured prism cells are used in the model. The grid-independence
test has been done. The deviation of the results was less than 1% when the quantity of the
cells is over 1, 300, 000. The ANSYS meshing high smoothing and slow transition curvature
size function are adopted to generate the mesh. The element size of the tower and heat
exchanger is set to be 0.3m while the element size of the computation domain area is 0.5 m.
Figure 3: Geometry diagram of the 3-D model
3.2 Boundary condition
The bottom face of the computation domain and tower surface are defined as the zero heat
flux and non-slip wall with the standard wall function. In windless condition, the side face of
the cylinder is defined as the pressure inlet boundary and the pressure outlet boundary
condition is applied on the top face of the cylinder. In the crosswind condition, a velocity
inlet boundary condition is applied at the side face of the cylinder, with the velocity profile
define as:
(11)
The temperatures and pressures at both the inlet and outlet boundaries are set same as the
ambient one. Because of the low-turbulence level of advection natural wind, the impact of the
turbulence intensity and viscosity ratio was very little at the computation domain boundaries
[24]. They can be set as 0.1% and 0.1, respectively.
The heat exchanger bundles in the cooling tower are modelled by the radiator model with a
porous zone. The internal structure of the air cooled heat exchangers are simplified as a
porous media zone which represents all the air flow resistances within the heat exchangers.
Acco d ng to FLUENT us ’s gu d , the heat transfer process in the radiator can be expressed
by Eq. (12).
o (12)
The pressure drop of the system heat exchanger bundles is modelled by porous zone
through adding a momentum source term into the corresponding momentum equation. As
presented in Eq. (13), the source term is composed by two parts: a viscous loss term and an
inertial loss term.
(13)
The parameters in Eqs (12) and (13) can be correlated by calculating the 1-D model under
different conditions.
3.3 Governing Equations
According to the previous research [16-18, 20-23], the realizable k-ε model has been
selected in this study. The general term of the governing equations can be expressed as:
(14)
Table. 1 presented the expression of the three parameters in the above equation.
Table 1: The 3-D governing equation parameter from Eq. (14)
Continuity 1 0 0
x momentum U
y momentum V
z momentum W
Energy T
Turbulent energy k
Energy dissipation ε
where
;
t n
; Pr=0.74; Prt=0.85
4. RESULTS AND DISCUSSIONS
4.1 1-D simulation result
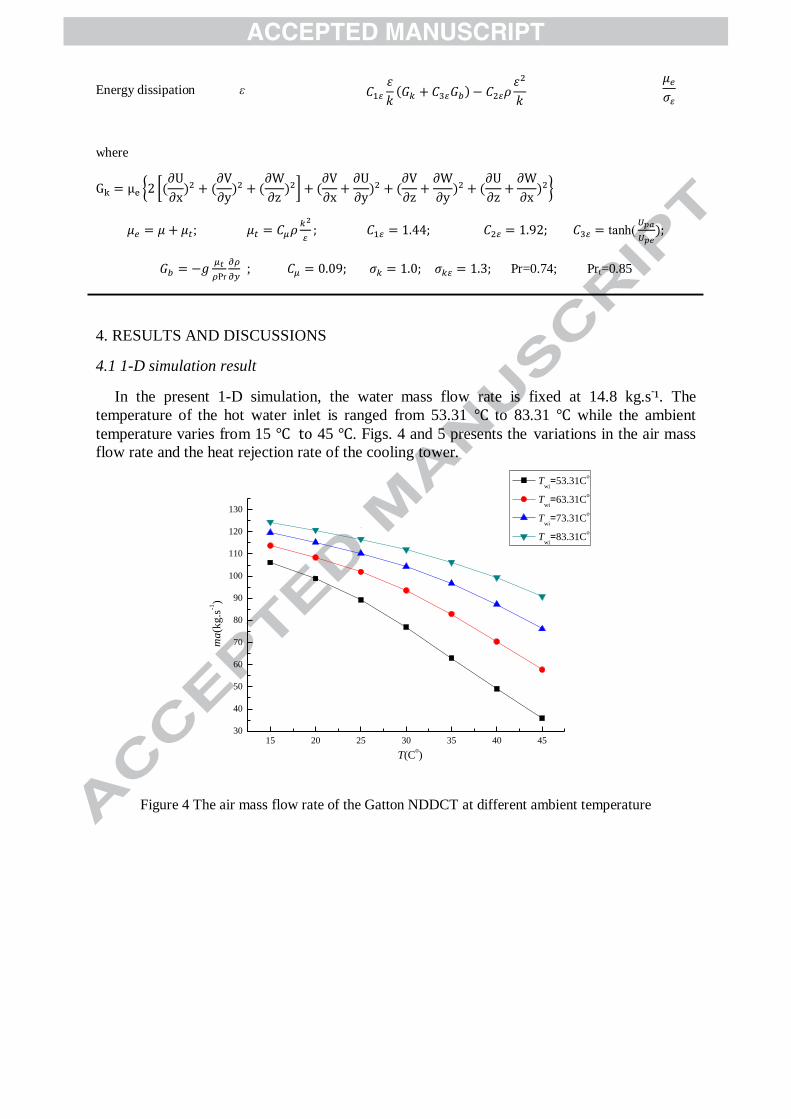
In the present 1-D simulation, the water mass flow rate is fixed at 14.8 kg.s-¹. The
temperature of the hot water inlet is ranged from 53.31 ℃ to 83.31 ℃ while the ambient
temperature varies from 15 ℃ to 45 ℃. Figs. 4 and 5 presents the variations in the air mass
flow rate and the heat rejection rate of the cooling tower.
Figure 4 The air mass flow rate of the Gatton NDDCT at different ambient temperature
15 20 25 30 35 40 4530
40
50
60
70
80
90
100
110
120
130
ma
(kg
.s-1
)
T(Co)
Twi
=53.31Co
Twi
=63.31Co
Twi
=73.31Co
Twi
=83.31Co
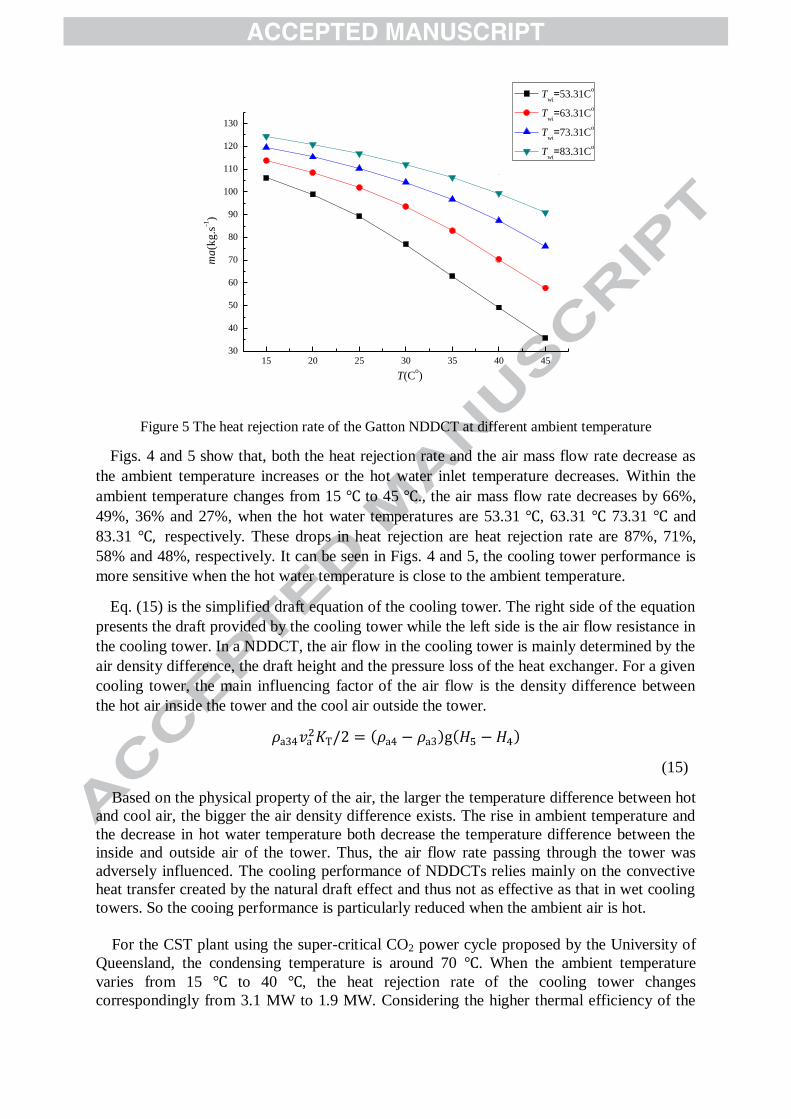
Figure 5 The heat rejection rate of the Gatton NDDCT at different ambient temperature
Figs. 4 and 5 show that, both the heat rejection rate and the air mass flow rate decrease as
the ambient temperature increases or the hot water inlet temperature decreases. Within the
ambient temperature changes from 15 ℃ to 45 ℃., the air mass flow rate decreases by 66%,
49%, 36% and 27%, when the hot water temperatures are 53.31 ℃, 63.31 ℃ 73.31 ℃ and
83.31 ℃, respectively. These drops in heat rejection are heat rejection rate are 87%, 71%,
58% and 48%, respectively. It can be seen in Figs. 4 and 5, the cooling tower performance is
more sensitive when the hot water temperature is close to the ambient temperature.
Eq. (15) is the simplified draft equation of the cooling tower. The right side of the equation
presents the draft provided by the cooling tower while the left side is the air flow resistance in
the cooling tower. In a NDDCT, the air flow in the cooling tower is mainly determined by the
air density difference, the draft height and the pressure loss of the heat exchanger. For a given
cooling tower, the main influencing factor of the air flow is the density difference between
the hot air inside the tower and the cool air outside the tower.
(15)
Based on the physical property of the air, the larger the temperature difference between hot
and cool air, the bigger the air density difference exists. The rise in ambient temperature and
the decrease in hot water temperature both decrease the temperature difference between the
inside and outside air of the tower. Thus, the air flow rate passing through the tower was
adversely influenced. The cooling performance of NDDCTs relies mainly on the convective
heat transfer created by the natural draft effect and thus not as effective as that in wet cooling
towers. So the cooing performance is particularly reduced when the ambient air is hot.
For the CST plant using the super-critical CO2 power cycle proposed by the University of
Queensland, the condensing temperature is around 70 ℃. When the ambient temperature
varies from 15 ℃ to 40 ℃, the heat rejection rate of the cooling tower changes
correspondingly from 3.1 MW to 1.9 MW. Considering the higher thermal efficiency of the
15 20 25 30 35 40 4530
40
50
60
70
80
90
100
110
120
130
ma
(kg
.s-1
)
T(Co)
Twi
=53.31Co
Twi
=63.31Co
Twi
=73.31Co
Twi
=83.31Co
supercritical CO2 cycle and hence the relatively smaller cooling requirement, this small size
NDDCT is suitable for the CST power plant with 2~3MW nominal net power.
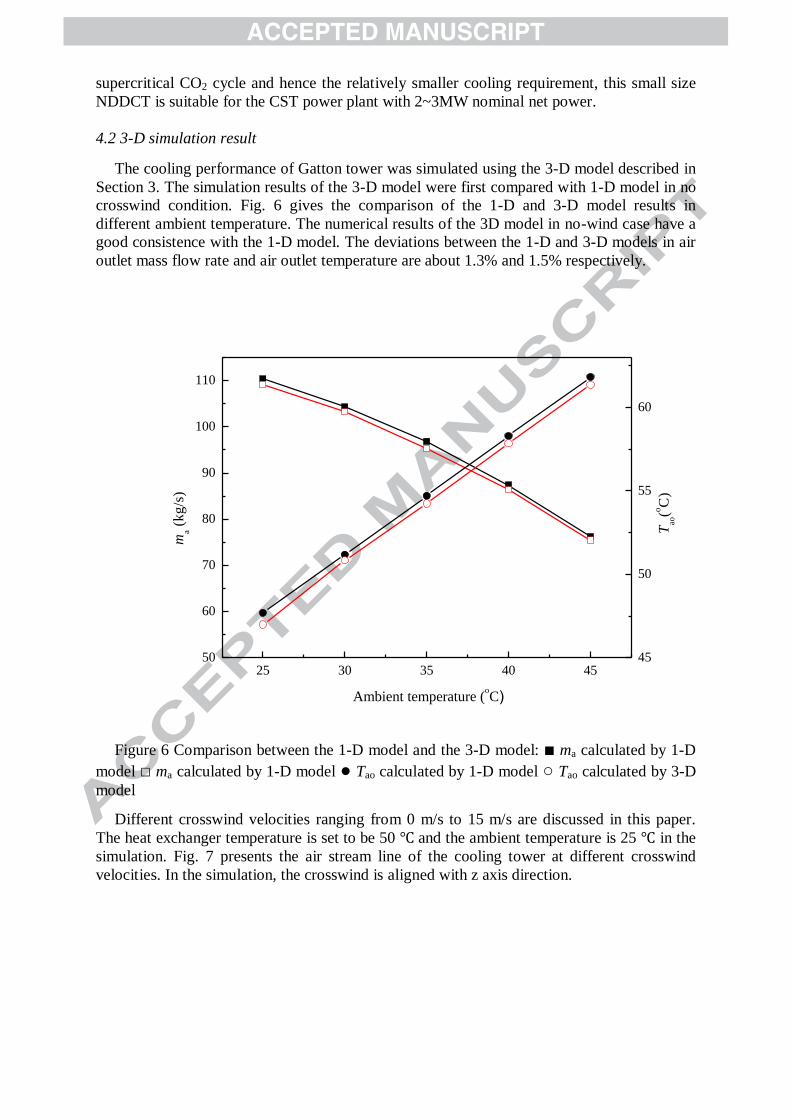
4.2 3-D simulation result
The cooling performance of Gatton tower was simulated using the 3-D model described in
Section 3. The simulation results of the 3-D model were first compared with 1-D model in no
crosswind condition. Fig. 6 gives the comparison of the 1-D and 3-D model results in
different ambient temperature. The numerical results of the 3D model in no-wind case have a
good consistence with the 1-D model. The deviations between the 1-D and 3-D models in air
outlet mass flow rate and air outlet temperature are about 1.3% and 1.5% respectively.
Figure 6 Comparison between the 1-D model and the 3-D model: ■ ma calculated by 1-D
model □ ma calculated by 1-D model ● Tao calculated by 1-D model ○ Tao calculated by 3-D
model
Different crosswind velocities ranging from 0 m/s to 15 m/s are discussed in this paper.
The heat exchanger temperature is set to be 50 ℃ and the ambient temperature is 25 ℃ in the
simulation. Fig. 7 presents the air stream line of the cooling tower at different crosswind
velocities. In the simulation, the crosswind is aligned with z axis direction.
25 30 35 40 4550
60
70
80
90
100
110
Tao
(oC
)
ma (
kg
/s)
Ambient temperature (oC)
45
50
55
60
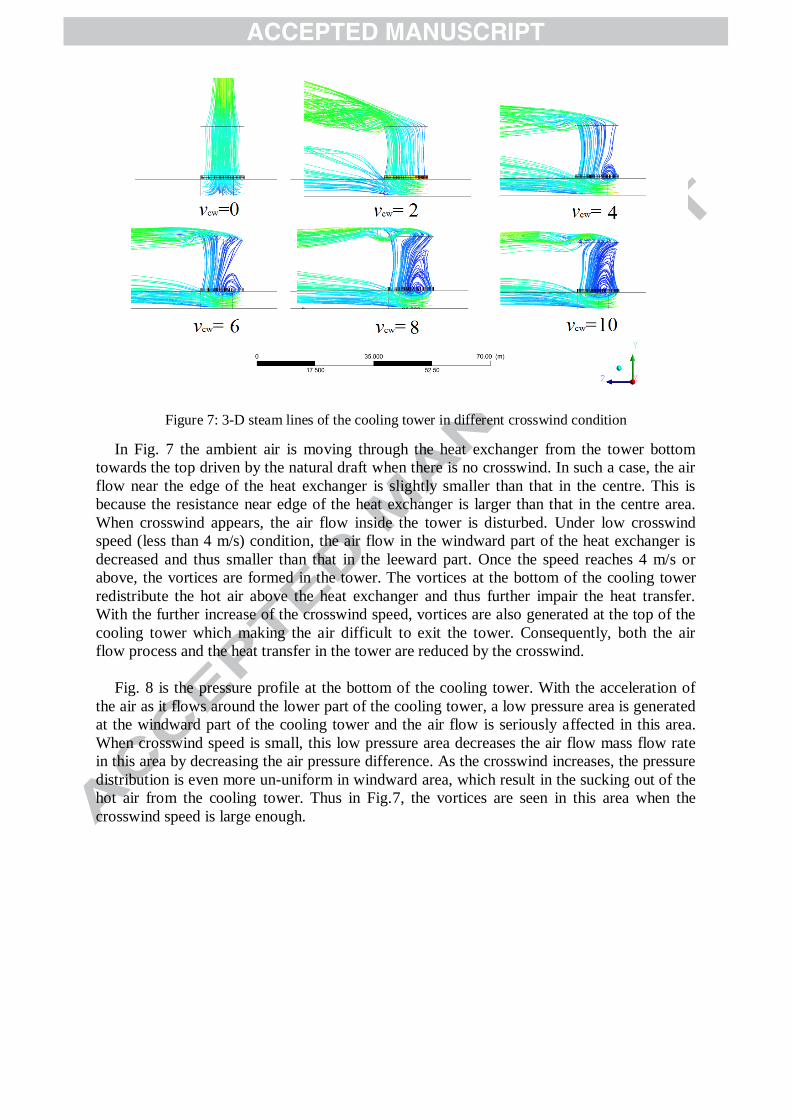
Figure 7: 3-D steam lines of the cooling tower in different crosswind condition
In Fig. 7 the ambient air is moving through the heat exchanger from the tower bottom
towards the top driven by the natural draft when there is no crosswind. In such a case, the air
flow near the edge of the heat exchanger is slightly smaller than that in the centre. This is
because the resistance near edge of the heat exchanger is larger than that in the centre area.
When crosswind appears, the air flow inside the tower is disturbed. Under low crosswind
speed (less than 4 m/s) condition, the air flow in the windward part of the heat exchanger is
decreased and thus smaller than that in the leeward part. Once the speed reaches 4 m/s or
above, the vortices are formed in the tower. The vortices at the bottom of the cooling tower
redistribute the hot air above the heat exchanger and thus further impair the heat transfer.
With the further increase of the crosswind speed, vortices are also generated at the top of the
cooling tower which making the air difficult to exit the tower. Consequently, both the air
flow process and the heat transfer in the tower are reduced by the crosswind.
Fig. 8 is the pressure profile at the bottom of the cooling tower. With the acceleration of
the air as it flows around the lower part of the cooling tower, a low pressure area is generated
at the windward part of the cooling tower and the air flow is seriously affected in this area.
When crosswind speed is small, this low pressure area decreases the air flow mass flow rate
in this area by decreasing the air pressure difference. As the crosswind increases, the pressure
distribution is even more un-uniform in windward area, which result in the sucking out of the
hot air from the cooling tower. Thus in Fig.7, the vortices are seen in this area when the
crosswind speed is large enough.
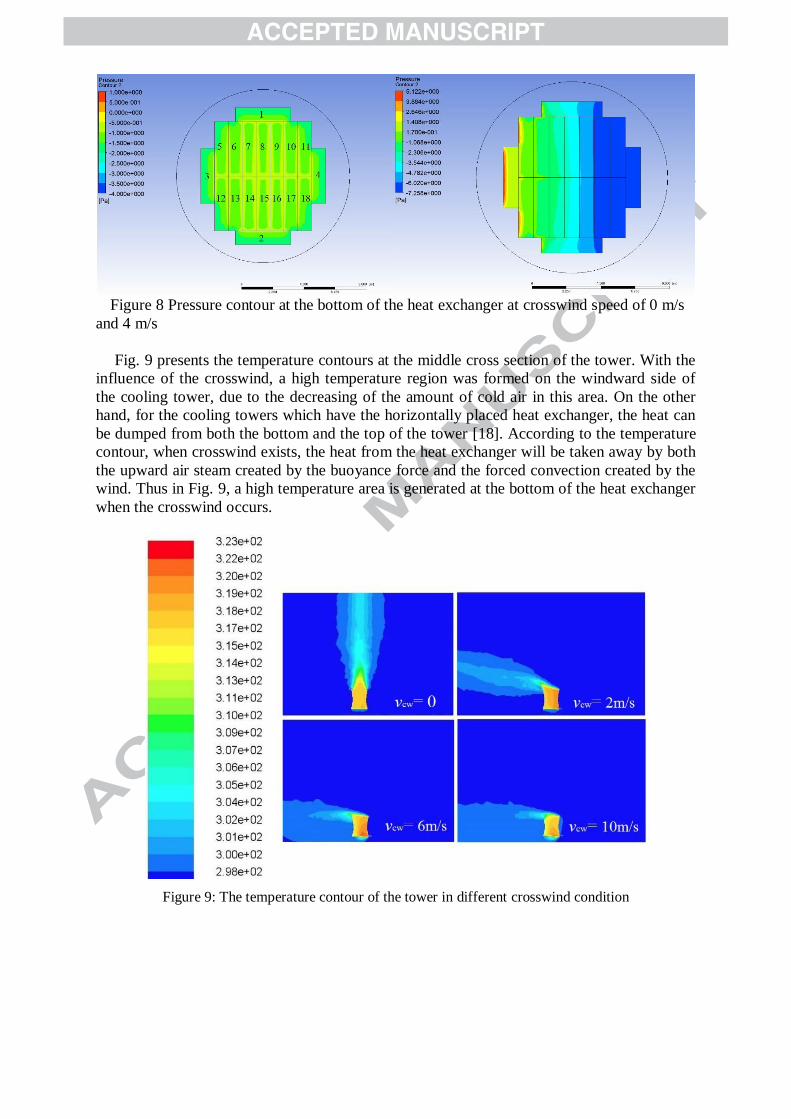
Figure 8 Pressure contour at the bottom of the heat exchanger at crosswind speed of 0 m/s
and 4 m/s
Fig. 9 presents the temperature contours at the middle cross section of the tower. With the
influence of the crosswind, a high temperature region was formed on the windward side of
the cooling tower, due to the decreasing of the amount of cold air in this area. On the other
hand, for the cooling towers which have the horizontally placed heat exchanger, the heat can
be dumped from both the bottom and the top of the tower [18]. According to the temperature
contour, when crosswind exists, the heat from the heat exchanger will be taken away by both
the upward air steam created by the buoyance force and the forced convection created by the
wind. Thus in Fig. 9, a high temperature area is generated at the bottom of the heat exchanger
when the crosswind occurs.
Figure 9: The temperature contour of the tower in different crosswind condition
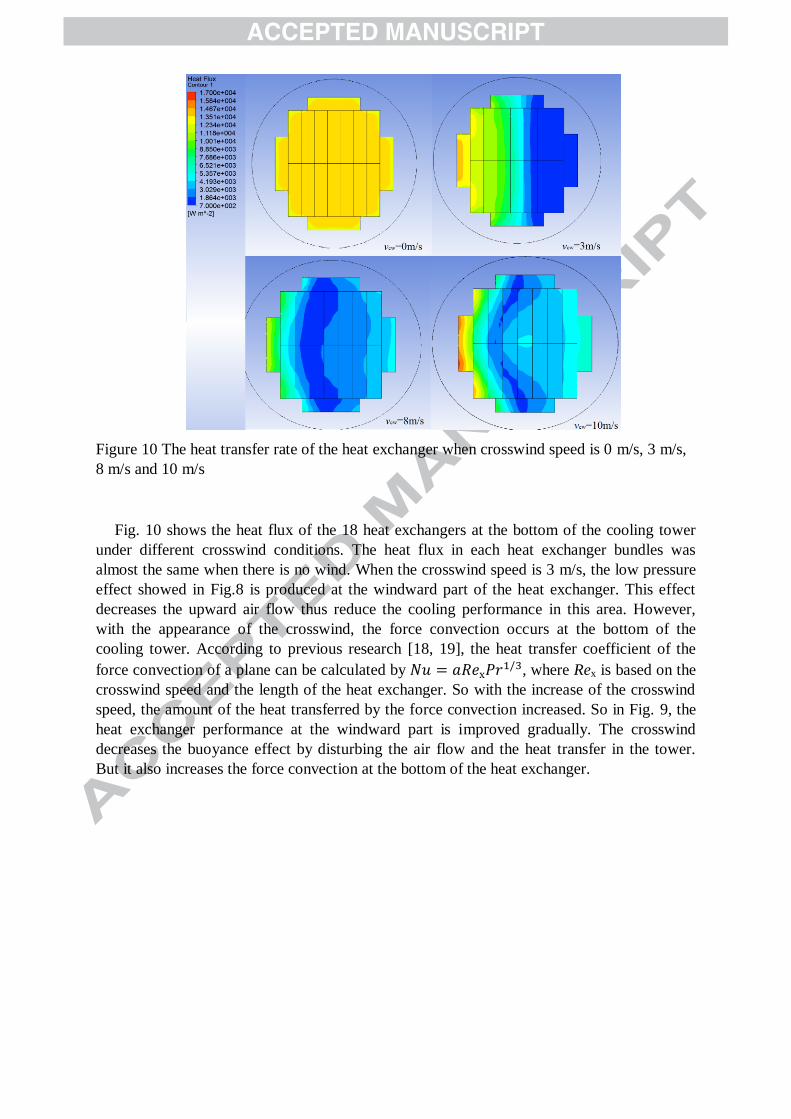
Figure 10 The heat transfer rate of the heat exchanger when crosswind speed is 0 m/s, 3 m/s,
8 m/s and 10 m/s
Fig. 10 shows the heat flux of the 18 heat exchangers at the bottom of the cooling tower
under different crosswind conditions. The heat flux in each heat exchanger bundles was
almost the same when there is no wind. When the crosswind speed is 3 m/s, the low pressure
effect showed in Fig.8 is produced at the windward part of the heat exchanger. This effect
decreases the upward air flow thus reduce the cooling performance in this area. However,
with the appearance of the crosswind, the force convection occurs at the bottom of the
cooling tower. According to previous research [18, 19], the heat transfer coefficient of the
force convection of a plane can be calculated by , where Rex is based on the
crosswind speed and the length of the heat exchanger. So with the increase of the crosswind
speed, the amount of the heat transferred by the force convection increased. So in Fig. 9, the
heat exchanger performance at the windward part is improved gradually. The crosswind
decreases the buoyance effect by disturbing the air flow and the heat transfer in the tower.
But it also increases the force convection at the bottom of the heat exchanger.
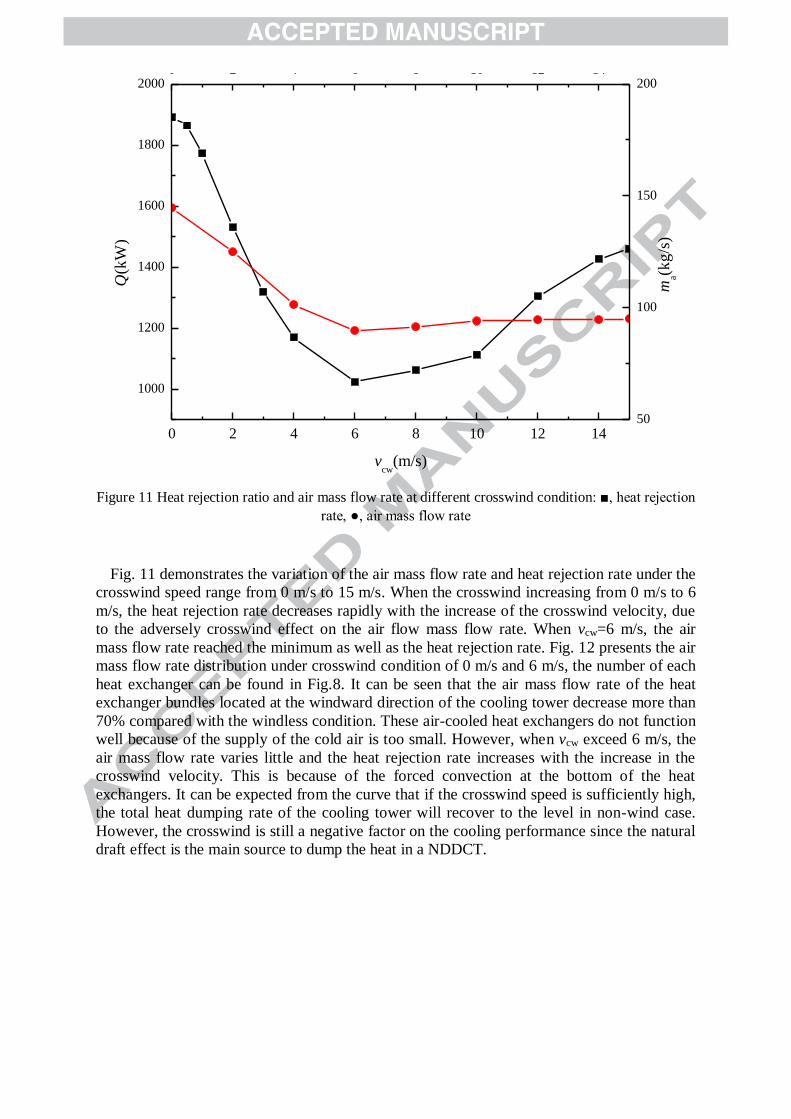
Figure 11 Heat rejection ratio and air mass flow rate at different crosswind condition: ■, t j ct on
t , ●, m ss flow t
Fig. 11 demonstrates the variation of the air mass flow rate and heat rejection rate under the
crosswind speed range from 0 m/s to 15 m/s. When the crosswind increasing from 0 m/s to 6
m/s, the heat rejection rate decreases rapidly with the increase of the crosswind velocity, due
to the adversely crosswind effect on the air flow mass flow rate. When vcw=6 m/s, the air
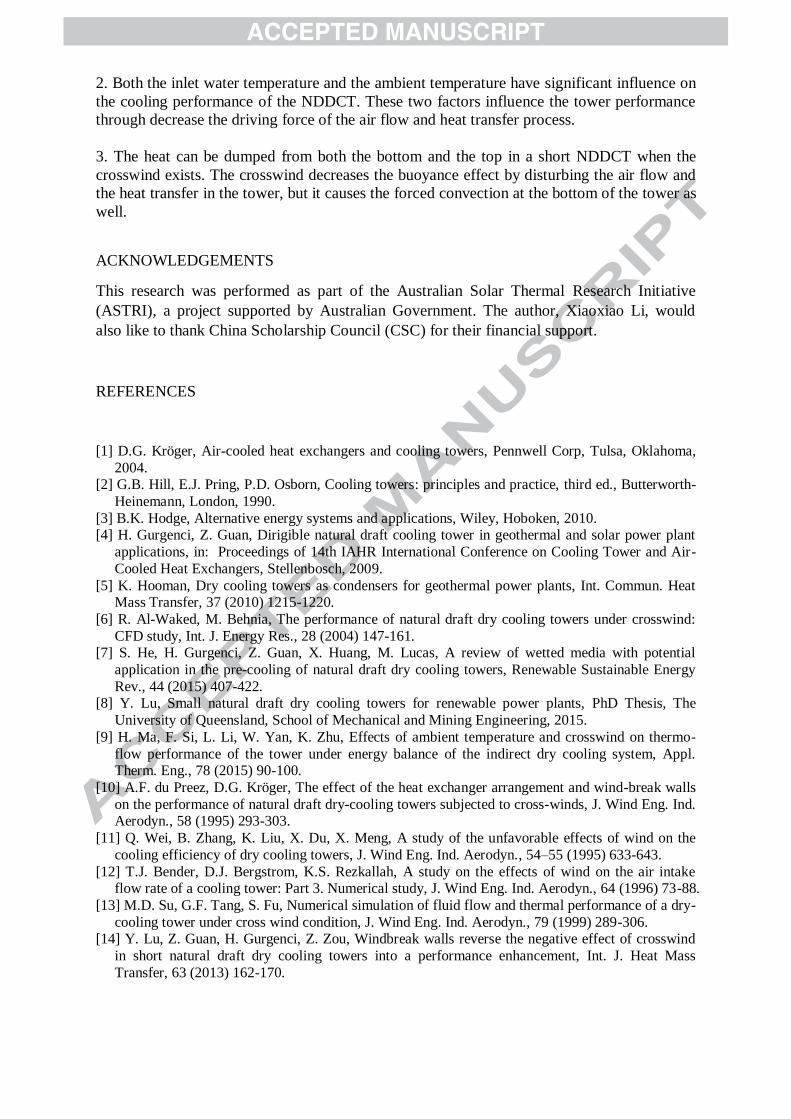
mass flow rate reached the minimum as well as the heat rejection rate. Fig. 12 presents the air
mass flow rate distribution under crosswind condition of 0 m/s and 6 m/s, the number of each
heat exchanger can be found in Fig.8. It can be seen that the air mass flow rate of the heat
exchanger bundles located at the windward direction of the cooling tower decrease more than
70% compared with the windless condition. These air-cooled heat exchangers do not function
well because of the supply of the cold air is too small. However, when vcw exceed 6 m/s, the
air mass flow rate varies little and the heat rejection rate increases with the increase in the
crosswind velocity. This is because of the forced convection at the bottom of the heat
exchangers. It can be expected from the curve that if the crosswind speed is sufficiently high,
the total heat dumping rate of the cooling tower will recover to the level in non-wind case.
However, the crosswind is still a negative factor on the cooling performance since the natural
draft effect is the main source to dump the heat in a NDDCT.
0 2 4 6 8 10 12 14
1000
1200
1400
1600
1800
2000
ma(k
g/s
)
Q(k
W)
vcw
(m/s)
0 2 4 6 8 10 12 14
50
100
150
200
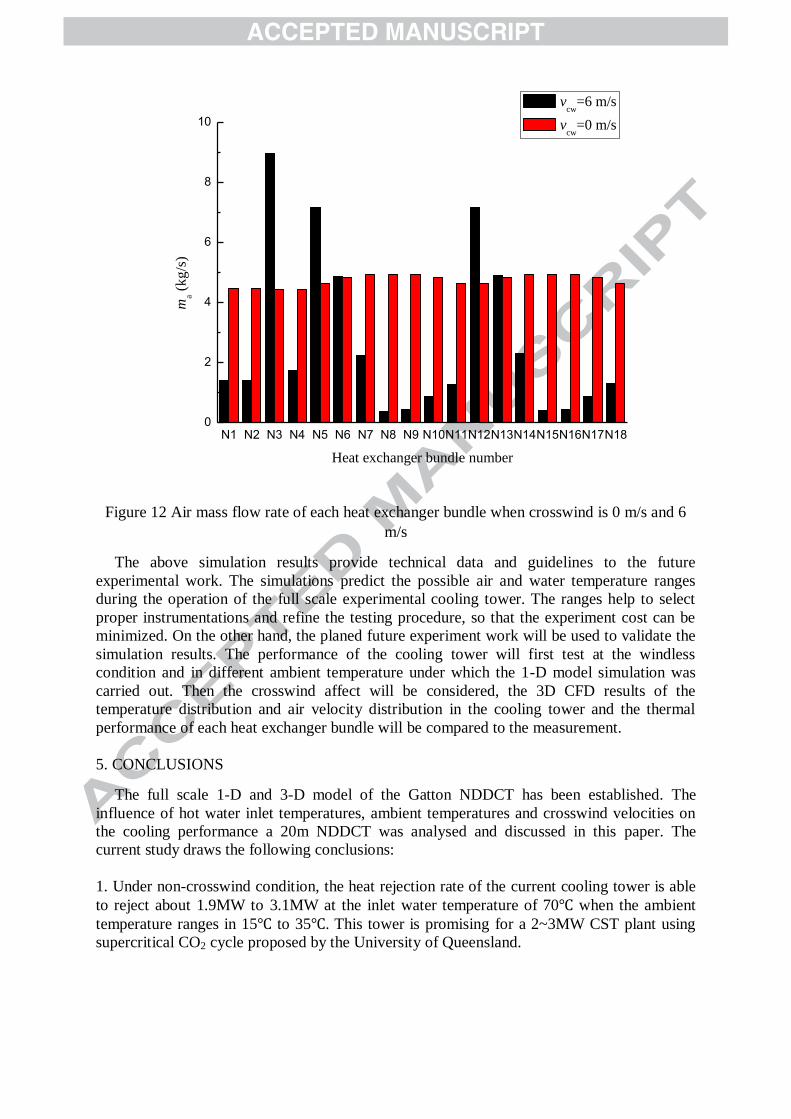
Figure 12 Air mass flow rate of each heat exchanger bundle when crosswind is 0 m/s and 6
m/s
The above simulation results provide technical data and guidelines to the future
experimental work. The simulations predict the possible air and water temperature ranges
during the operation of the full scale experimental cooling tower. The ranges help to select
proper instrumentations and refine the testing procedure, so that the experiment cost can be
minimized. On the other hand, the planed future experiment work will be used to validate the
simulation results. The performance of the cooling tower will first test at the windless
condition and in different ambient temperature under which the 1-D model simulation was
carried out. Then the crosswind affect will be considered, the 3D CFD results of the
temperature distribution and air velocity distribution in the cooling tower and the thermal
performance of each heat exchanger bundle will be compared to the measurement.
5. CONCLUSIONS
The full scale 1-D and 3-D model of the Gatton NDDCT has been established. The
influence of hot water inlet temperatures, ambient temperatures and crosswind velocities on
the cooling performance a 20m NDDCT was analysed and discussed in this paper. The
current study draws the following conclusions:
1. Under non-crosswind condition, the heat rejection rate of the current cooling tower is able
to reject about 1.9MW to 3.1MW at the inlet water temperature of 70℃ when the ambient
temperature ranges in 15℃ to 35℃. This tower is promising for a 2~3MW CST plant using
supercritical CO2 cycle proposed by the University of Queensland.
N1 N2 N3 N4 N5 N6 N7 N8 N9 N10N11N12N13N14N15N16N17N180
2
4
6
8
10
ma (
kg
/s)
Heat exchanger bundle number
vcw
=6 m/s
vcw
=0 m/s
2. Both the inlet water temperature and the ambient temperature have significant influence on
the cooling performance of the NDDCT. These two factors influence the tower performance
through decrease the driving force of the air flow and heat transfer process.
3. The heat can be dumped from both the bottom and the top in a short NDDCT when the
crosswind exists. The crosswind decreases the buoyance effect by disturbing the air flow and
the heat transfer in the tower, but it causes the forced convection at the bottom of the tower as
well.
ACKNOWLEDGEMENTS
This research was performed as part of the Australian Solar Thermal Research Initiative
(ASTRI), a project supported by Australian Government. The author, Xiaoxiao Li, would
also like to thank China Scholarship Council (CSC) for their financial support.
REFERENCES
[1] D.G. Kröger, Air-cooled heat exchangers and cooling towers, Pennwell Corp, Tulsa, Oklahoma,
2004. [2] G.B. Hill, E.J. Pring, P.D. Osborn, Cooling towers: principles and practice, third ed., Butterworth-
Heinemann, London, 1990.
[3] B.K. Hodge, Alternative energy systems and applications, Wiley, Hoboken, 2010. [4] H. Gurgenci, Z. Guan, Dirigible natural draft cooling tower in geothermal and solar power plant
applications, in: Proceedings of 14th IAHR International Conference on Cooling Tower and Air-
Cooled Heat Exchangers, Stellenbosch, 2009.
[5] K. Hooman, Dry cooling towers as condensers for geothermal power plants, Int. Commun. Heat Mass Transfer, 37 (2010) 1215-1220.
[6] R. Al-Waked, M. Behnia, The performance of natural draft dry cooling towers under crosswind:
CFD study, Int. J. Energy Res., 28 (2004) 147-161. [7] S. He, H. Gurgenci, Z. Guan, X. Huang, M. Lucas, A review of wetted media with potential
application in the pre-cooling of natural draft dry cooling towers, Renewable Sustainable Energy
Rev., 44 (2015) 407-422. [8] Y. Lu, Small natural draft dry cooling towers for renewable power plants, PhD Thesis, The
University of Queensland, School of Mechanical and Mining Engineering, 2015.
[9] H. Ma, F. Si, L. Li, W. Yan, K. Zhu, Effects of ambient temperature and crosswind on thermo-
flow performance of the tower under energy balance of the indirect dry cooling system, Appl. Therm. Eng., 78 (2015) 90-100.
[10] A.F. du Preez, D.G. Kröger, The effect of the heat exchanger arrangement and wind-break walls
on the performance of natural draft dry-cooling towers subjected to cross-winds, J. Wind Eng. Ind. Aerodyn., 58 (1995) 293-303.
[11] Q. Wei, B. Zhang, K. Liu, X. Du, X. Meng, A study of the unfavorable effects of wind on the
cooling efficiency of dry cooling towers, J. Wind Eng. Ind. Aerodyn., 54–55 (1995) 633-643.
[12] T.J. Bender, D.J. Bergstrom, K.S. Rezkallah, A study on the effects of wind on the air intake flow rate of a cooling tower: Part 3. Numerical study, J. Wind Eng. Ind. Aerodyn., 64 (1996) 73-88.
[13] M.D. Su, G.F. Tang, S. Fu, Numerical simulation of fluid flow and thermal performance of a dry-
cooling tower under cross wind condition, J. Wind Eng. Ind. Aerodyn., 79 (1999) 289-306. [14] Y. Lu, Z. Guan, H. Gurgenci, Z. Zou, Windbreak walls reverse the negative effect of crosswind
in short natural draft dry cooling towers into a performance enhancement, Int. J. Heat Mass
Transfer, 63 (2013) 162-170.
[15] Y. Lu, H. Gurgenci, Z. Guan, S. He, The influence of windbreak wall orientation on the cooling
performance of small natural draft dry cooling towers, Int. J. Heat Mass Transfer, 79 (2014) 1059-
1069. [16] Y. Zhao, G. Long, F. Sun, Y. Li, C. Zhang, J. Liu, Effect mechanism of air deflectors on the
cooling performance of dry cooling tower with vertical delta radiators under crosswind, Energy
Convers. Manage., 93 (2015) 321-331. [17] Y.B. Zhao, G. Long, F. Sun, Y. Li, C. Zhang, Numerical study on the cooling performance of dry
cooling tower with vertical two-pass column radiators under crosswind, Appl. Therm. Eng., 75
(2015) 1106-1117.
[18] Y. Lu, Z. Guan, H. Gurgenci, K. Hooman, S. He, D. Bharathan, Experimental study of crosswind effects on the performance of small cylindrical natural draft dry cooling towers, Energy Convers.
Manage., 91 (2015) 238-248.
[19] Y.A. Çengel, A.J. Ghajar, Heat and mass transfer: fundamentals & applications, McGraw-Hill, New York, 2015.
[20] R. Al-Waked, Crosswinds effect on the performance of natural draft wet cooling towers, Int. J.
Therm. Sci., 49 (2010) 218-224.
[21] Z. Zou, Z. Guan, H. Gurgenci, Y. Lu, Solar enhanced natural draft dry cooling tower for geothermal power applications, Sol. Energy, 86 (2012) 2686-2694.
[22] L.J. Yang, L. Chen, X.Z. Du, Y.P. Yang, Effects of ambient winds on the thermo-flow
performances of indirect dry cooling system in a power plant, Int. J. Therm. Sci., 64 (2013) 178-187.
[23] L.J. Yang, X.P. Wu, X.Z. Du, Y.P. Yang, Dimensional characteristics of wind effects on the
performance of indirect dry cooling system with vertically arranged heat exchanger bundles, Int. J. Heat Mass Transfer, 67 (2013) 853-866.
[24] Y. Zhao, F. Sun, Y. Li, G. Long, Z. Yang, Numerical study on the cooling performance of
natural draft dry cooling tower with vertical delta radiators under constant heat load, Appl. Energy,
149 (2015) 225-237.
Related Documents