Nahid Maleki-Jirsaraei 1, 2 Mohamad-Nabi Sarbolouki 1 Shahin Rouhani 3 1 Institute of Biophysics and Biochemistry, University of Tehran, Tehran, Iran 2 Physics Department, Alzahra University, Tehran, Iran 3 Physics Department, Sharif University of Technology, Tehran, Iran Received May 13, 2006 Revised July 30, 2006 Accepted July 30, 2006 Research Article Simulation of DNA electrophoresis through microstructures The dependence of the mobility of DNA molecules through an hexagonal array of micropillars on their length and the applied electric field was investigated and it was found that mobility is a nonmonotonic function of their length. Results also revealed that the size dependence of the DNA mobility depends on the applied electric field and there is a crossover around E < 25 V/cm for the mobility of l-DNA and T4-DNA. These observations are explained in terms of the diffusion process inside the structure affected by the solvent and are modeled using the Langevin and its corresponding Fokker–Planck equations. The phenomenon is generalized under three regimes in a phase diagram relating the electric field and the DNA lengths. The model and the associated phase diagram described here provide an explanation for the conflicting results reported by previous authors (Han et al. on the one hand, and Duong et al. and Inatomi et al. on the other) about the dependence of mobility on the DNA size in lattices near or below the radius of gyration. Keywords: Entropy barrier / Micropillars / Microstructures / Mobility / Modeling DOI 10.1002/elps.200600292 1 Introduction DNA electrophoresis is one of the main techniques of separating DNA molecules, and obviously plays an important role in genomic developments [1–6]. DNA electrophoresis is usually carried out in gels, but this technique has its own limitations, namely the ill-defined nonreproducible gel structures and limitations faced when DNA molecules longer than 20 kbp are to be sepa- rated under DC electric fields [7]. Thus, for large DNA molecules PFGE is utilized [8, 9]. This method, however, requires long separation times especially when dealing with large DNA molecules. In 1992, Volkmuth and Austin [10] used optical microlithography to fabricate a micro- structure and reported their observations on epi- fluorescence microscopy of electrophoresis and length fractionation of large DNA molecules confined in an array. With progress in microtechniques, efforts have been di- rected toward separation of DNA molecules with the help of well-defined electrophoretic matrices that lend them- selves to mass fabrication of reproducible matrices [10– 27]. Novel and efficient matrices based on the new con- cept of entropic barrier transport have been developed which allow better resolutions in electrophoretic separa- tion of DNA molecules [28–32]. These studies have had two main purposes: (i) to understand the mechanism of separation of DNA molecules, especially after the devel- opment of fluorescence microscopy with sensitive cam- eras, which allows tracing a single DNA molecule inside such microstructures [10–27]; and (ii) to develop an easier, faster, and more dependable method for genomic analyses [33]. Austin and co-workers [10–17, 25] developed their tech- nique for three purposes: fractionation of megabase DNA molecules employing pulsed fields in hexagonal arrays; to do single molecules mapping using near-field optics; and to fractionate DNA molecules using asymmetric struc- tures. In most of their works, separation of DNA mole- cules is based on lateral displacements, in which the smaller DNAs develop higher velocities and are better fractionated [10–17, 25]. Han et al. [18–21] and Duong et al. [22, 23] were able to separate DNA molecules of different sizes by electropho- resis (constant electric field) through specially designed flat microchannels. The channel geometries used consist of alternative sections having small and large lengths. Of course, the channel widths, the electric field strength, and Correspondence: Professor Mohammad-Nabi Sarbolouki, Institute of Biophysics and Biochemistry, University of Tehran, P.O. Box 13145-1384, Tehran, Iran E-mail: [email protected] Fax: 198-21-66491267 Electrophoresis 2007, 28, 301–308 301 Additional corresponding author: Professor Shahin Rouhani; E-mail: [email protected] © 2007 WILEY-VCH Verlag GmbH & Co. KGaA, Weinheim www.electrophoresis-journal.com

Welcome message from author
This document is posted to help you gain knowledge. Please leave a comment to let me know what you think about it! Share it to your friends and learn new things together.
Transcript
Nahid Maleki-Jirsaraei1, 2
Mohamad-Nabi Sarbolouki1
Shahin Rouhani3
1Institute of Biophysics andBiochemistry,University of Tehran,Tehran, Iran
2Physics Department,Alzahra University,Tehran, Iran
3Physics Department,Sharif University of Technology,Tehran, Iran
Received May 13, 2006Revised July 30, 2006Accepted July 30, 2006
Research Article
Simulation of DNA electrophoresis throughmicrostructures
The dependence of the mobility of DNA molecules through an hexagonal array ofmicropillars on their length and the applied electric field was investigated and it wasfound that mobility is a nonmonotonic function of their length. Results also revealedthat the size dependence of the DNA mobility depends on the applied electric field andthere is a crossover around E < 25 V/cm for the mobility of l-DNA and T4-DNA. Theseobservations are explained in terms of the diffusion process inside the structureaffected by the solvent and are modeled using the Langevin and its correspondingFokker–Planck equations. The phenomenon is generalized under three regimes in aphase diagram relating the electric field and the DNA lengths. The model and theassociated phase diagram described here provide an explanation for the conflictingresults reported by previous authors (Han et al. on the one hand, and Duong et al. andInatomi et al. on the other) about the dependence of mobility on the DNA size in latticesnear or below the radius of gyration.
Keywords: Entropy barrier / Micropillars / Microstructures / Mobility / ModelingDOI 10.1002/elps.200600292
1 Introduction
DNA electrophoresis is one of the main techniques ofseparating DNA molecules, and obviously plays animportant role in genomic developments [1–6]. DNAelectrophoresis is usually carried out in gels, but thistechnique has its own limitations, namely the ill-definednonreproducible gel structures and limitations facedwhen DNA molecules longer than 20 kbp are to be sepa-rated under DC electric fields [7]. Thus, for large DNAmolecules PFGE is utilized [8, 9]. This method, however,requires long separation times especially when dealingwith large DNA molecules. In 1992, Volkmuth and Austin[10] used optical microlithography to fabricate a micro-structure and reported their observations on epi-fluorescence microscopy of electrophoresis and lengthfractionation of large DNA molecules confined in an array.With progress in microtechniques, efforts have been di-rected toward separation of DNA molecules with the helpof well-defined electrophoretic matrices that lend them-selves to mass fabrication of reproducible matrices [10–27]. Novel and efficient matrices based on the new con-cept of entropic barrier transport have been developed
which allow better resolutions in electrophoretic separa-tion of DNA molecules [28–32]. These studies have hadtwo main purposes: (i) to understand the mechanism ofseparation of DNA molecules, especially after the devel-opment of fluorescence microscopy with sensitive cam-eras, which allows tracing a single DNA molecule insidesuch microstructures [10–27]; and (ii) to develop aneasier, faster, and more dependable method for genomicanalyses [33].
Austin and co-workers [10–17, 25] developed their tech-nique for three purposes: fractionation of megabase DNAmolecules employing pulsed fields in hexagonal arrays; todo single molecules mapping using near-field optics; andto fractionate DNA molecules using asymmetric struc-tures. In most of their works, separation of DNA mole-cules is based on lateral displacements, in which thesmaller DNAs develop higher velocities and are betterfractionated [10–17, 25].
Han et al. [18–21] and Duong et al. [22, 23] were able toseparate DNA molecules of different sizes by electropho-resis (constant electric field) through specially designedflat microchannels. The channel geometries used consistof alternative sections having small and large lengths. Ofcourse, the channel widths, the electric field strength, and
Correspondence: Professor Mohammad-Nabi Sarbolouki, Instituteof Biophysics and Biochemistry, University of Tehran, P.O. Box13145-1384, Tehran, IranE-mail: [email protected]: 198-21-66491267
Electrophoresis 2007, 28, 301–308 301
Additional corresponding author: Professor Shahin Rouhani;E-mail: [email protected]
© 2007 WILEY-VCH Verlag GmbH & Co. KGaA, Weinheim www.electrophoresis-journal.com
302 N. Maleki-Jirsaraei et al. Electrophoresis 2007, 28, 301–308
some other experimental factors employed by theseauthors are different. There is, however, an apparentconflict: Han’s group report that the longer DNAs precedethe smaller ones, whereas Duong et al. report the oppo-site. On other hand, Streek et al. [34] used the same typeof geometry; they reproduced Han’s results, and alsoobserved a nonmonotonic dependence of DNA mobilityon its size as well as a two state migration at high electricfields. Inatomi et al. [24] used an hexagonal array at highdirect current (DC) electric fields and, like Duong et al.,observed that the smaller DNA molecules precede. Thecommon feature in the experimental proceduresemployed by these four groups is the use of constant(albeit different) DC electric fields. Since they obtaineddifferent results, in spite of the qualitative similarity of theirworks, it is tempting to try to understand the cause ofthese differences.
The present work is focused on an electrophoretic matrixof the type investigated by Inatomi et al. [24], wherein theDNA is driven under E = 50 V/cm DC electric field throughan array of micropillars (7.5 mm radius, 1 mm apart) ar-ranged in a hexagonal lattice. DNA molecules passthrough the lattice like a flexible spheroid, elongating inthe gaps where pillars are face to face. In their experi-ment, the l-DNA (48.5 kbp) with an average velocity of50 mm/s precedes T4-DNA (166 kbp) with an average ve-locity of 41 mm/s. To simulate this experiment, the motionof DNA is described by the Langevin dynamics, and itscorresponding Fokker–Planck equation. The experi-mental results of Inatomi et al. were therefore taken forgranted in our attempted simulations, thereby allowingthe establishment of some relations for predicting theDNA mobility in the said lattice. The equations thusobtained were subsequently applied to the seeminglycontradictory results of Duong et al. [22] and Inatomi et al.[24] on the one hand and those of Han and Craighead [18]on the other. It was found that the contradiction can beexplained in terms of three regimes in phase diagramrelating the electric field and DNA length.
2 Simulation method
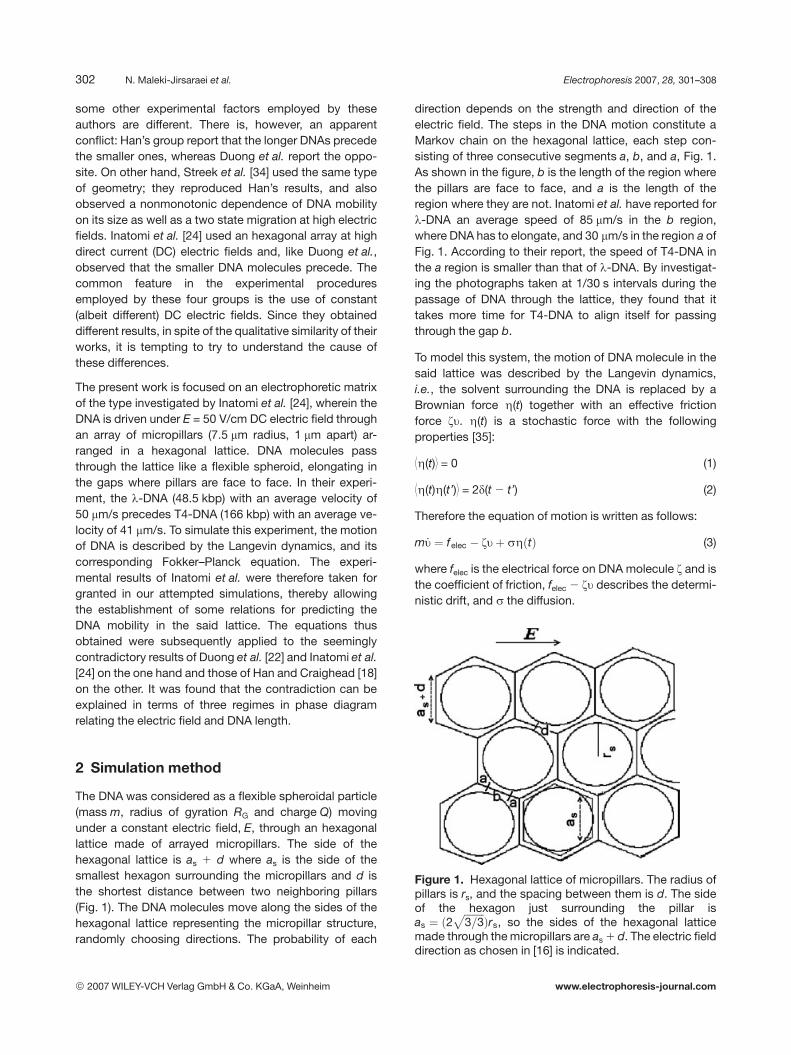
The DNA was considered as a flexible spheroidal particle(mass m, radius of gyration RG and charge Q) movingunder a constant electric field, E, through an hexagonallattice made of arrayed micropillars. The side of thehexagonal lattice is as 1 d where as is the side of thesmallest hexagon surrounding the micropillars and d isthe shortest distance between two neighboring pillars(Fig. 1). The DNA molecules move along the sides of thehexagonal lattice representing the micropillar structure,randomly choosing directions. The probability of each
direction depends on the strength and direction of theelectric field. The steps in the DNA motion constitute aMarkov chain on the hexagonal lattice, each step con-sisting of three consecutive segments a, b, and a, Fig. 1.As shown in the figure, b is the length of the region wherethe pillars are face to face, and a is the length of theregion where they are not. Inatomi et al. have reported forl-DNA an average speed of 85 mm/s in the b region,where DNA has to elongate, and 30 mm/s in the region a ofFig. 1. According to their report, the speed of T4-DNA inthe a region is smaller than that of l-DNA. By investigat-ing the photographs taken at 1/30 s intervals during thepassage of DNA through the lattice, they found that ittakes more time for T4-DNA to align itself for passingthrough the gap b.
To model this system, the motion of DNA molecule in thesaid lattice was described by the Langevin dynamics,i.e., the solvent surrounding the DNA is replaced by aBrownian force Z(t) together with an effective frictionforce zu. Z(t) is a stochastic force with the followingproperties [35]:
7Z(t)8 = 0 (1)
7Z(t)Z(t’)8 = 2d(t 2 t’) (2)
Therefore the equation of motion is written as follows:
m _u ¼ felec � zuþ sZðtÞ (3)
where felec is the electrical force on DNA molecule z and isthe coefficient of friction, felec 2 zu describes the determi-nistic drift, and s the diffusion.
Figure 1. Hexagonal lattice of micropillars. The radius ofpillars is rs, and the spacing between them is d. The sideof the hexagon just surrounding the pillar isas ¼ ð2
ffiffiffiffiffiffiffiffi
3=3p
Þrs, so the sides of the hexagonal latticemade through the micropillars are as 1 d. The electric fielddirection as chosen in [16] is indicated.
© 2007 WILEY-VCH Verlag GmbH & Co. KGaA, Weinheim www.electrophoresis-journal.com
Electrophoresis 2007, 28, 301–308 Nucleic Acids 303
This stochastic differential equation has its associatedFokker–Planck equation of the form:
qqtC ¼ �D1
qqu
Cþ D2q2
qu2 C (4)
where D1 = felec 2 zn and D2 = s2/2, and C(u, t)du is theprobability for the random variable u to have at time t avalue between u and u 1 du [35].
In this system, there are two main deterministic forcesacting on the DNA molecules: the electrostatic force andthe friction force. The electric force is simply: A,Eq, whereA is a constant related to the charge density per unitlength, , is the length of DNA molecule, q is the electroniccharge, and E is the applied electric field. The frictionforce is proportional to the velocity, u, of DNA molecule,[34], in such a way that the coefficient of friction is pro-portional to the contact surface area, that is: BRG
2u,where RG
2 is the mean square radius of gyration of theDNA molecule. Adding these two terms results in:
D1 ¼ fðu; tÞ ¼ A‘Eq� BR2Gu (5)
where B is a constant, which, together with RG2, makes up
the coefficient of friction. We have therefore ended upwith an Ornstein–Uhlenbeck equation which is well-stud-ied [35], and for the stationary case:
qCqt¼ 0; so C ¼ exp �BR2
Gu2
2s2
� �
(6)
To reproduce Inatomi’s experimental results, one has tofind the parameters (a, b, tl, and tT4) and also na0 and nb0
for l-DNA and T4-DNA. Here tl and tT4, respectively,represent the time delays involved in the alignment of l-and T4-DNA molecules for passing through the gap (b inFig. 1), and ua0 and ub0 are the average velocities, in theregions a and b, without the thermal fluctuations, i.e., thedrift term of velocities. This was done by multivariableoptimization in a constrained system, wherein na was setequal to 30 mm/s and ub = 85 mm/s for l-DNA (the averagelocal velocities for l-DNA reported by Inatomi), and thefollowing set of parameters was obtained:
a = 1.245 mm, b = 7.17 mm, tl = 0.075 s, tT4 = 0.035 s, andat E = 50 V/cm, for l-DNA: ua0 = 32.89 mm/s, andub0 = 90.45 mm/s, and for T4-DNA: ua0 = 30.55 mm/s, andub0 = 84.0 mm/s.
With the help of these parameters, the constants in Eq. (5)and subsequently the drift velocities for each DNA can befound.
Next note that here the steps of Markov process are per-formed at constant x and so t = x/u has a mean value of
th i � xu
D E
,xu¼ xe�lnu (7)
1u
� �
¼Z
e�Lnue�BR2Gðu�u0Þ
2
2s2 du (8)
Applying the saddle point approximation one obtains:
u ¼BR2
Gu0 �ffiffiffiffiffiffiffiffiffiffiffiffiffiffiffiffiffiffiffiffiffiffiffiffiffiffiffiffiffiffiffiffiffiffiffiffiffiffiffiffi
B2R4Gu
20 � 4BR2
Gs2q
2BR2G
(9)
u ¼ u0
2� 1
2
ffiffiffiffiffiffiffiffiffiffiffiffiffiffiffiffiffiffiffiffi
u20 �
4s2
BR2G
s
, s2 ¼ DT (10)
Therefore, for a l-DNA molecule, the average velocities,without the thermal fluctuations in the regions a and b,respectively, are
ua0 ¼ 30þ 130
4DT
BR2G
!
(11)
ub0 ¼ 85þ 185
4DT
BR2G
!
(12)
and
uoveralðlDNAÞ ¼ nð2aþ bÞP
n
i¼1
2auaiþ bubiþ tl
� � ¼ 50 (13)
uoveralðT4DNAÞ ¼ nð2aþ bÞP
n
i¼1
2auaiþ bubiþ tT4
� � ¼ 41 (14)
where n is the number of the steps. It is reasonable toassume that the time delay for the DNA to align itself forpassing through the gaps (b in Fig. 1) increases with itssize as confirmed by the data presented by Inatomi et al.[24]. However, the form of this dependence must bedetermined. Since a DNA molecule has to elongate itselfand decrease its conformational entropy during align-ment when passing through the gaps, the greater its sizethe more its elongation will be [36, 37]. Therefore, thetime delay between the normal and elongated state mustbe related to its conformational entropy change.Casassa [36] has shown that the partition coefficient, K,decays exponentially with RG
2/C2, where C is a char-acteristic of the gap size. Therefore, the time delay, t,was scaled with the size of the DNA relative to the gapbetween pillars:
t / expR2
G
d2
!
(15)
so as to correlate it with tl and tT4 which were obtainedvia the initial multivariable optimization constraint meth-od.
This estimation is similar to the transition time veryrecently reported by Sakaue [38].
© 2007 WILEY-VCH Verlag GmbH & Co. KGaA, Weinheim www.electrophoresis-journal.com
304 N. Maleki-Jirsaraei et al. Electrophoresis 2007, 28, 301–308
Equation (10) can now be used to determine ua and ub foreach DNA molecule in every step. With the help of theseparameters, the Langevin equation can be solved via stepby step integration for the general case, involving variousDNA molecules under different electric fields, for a varietyof lattices.
3 Results
3.1 Influence of electric field
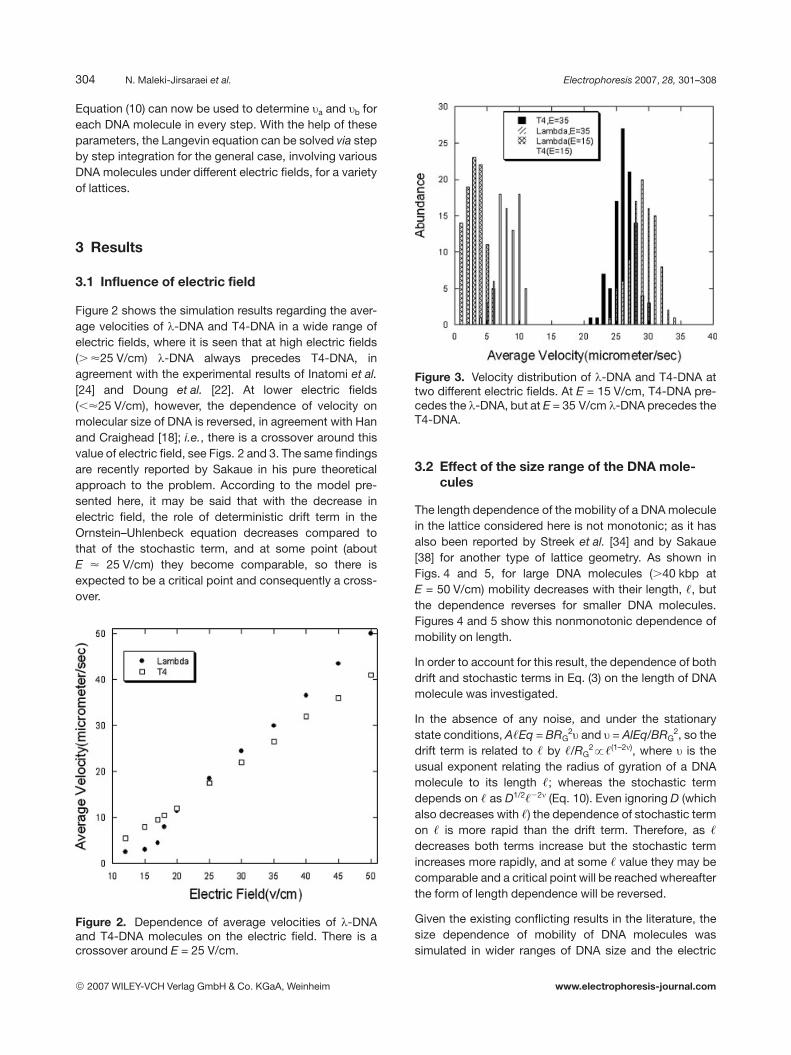
Figure 2 shows the simulation results regarding the aver-age velocities of l-DNA and T4-DNA in a wide range ofelectric fields, where it is seen that at high electric fields(. <25 V/cm) l-DNA always precedes T4-DNA, inagreement with the experimental results of Inatomi et al.[24] and Doung et al. [22]. At lower electric fields(,<25 V/cm), however, the dependence of velocity onmolecular size of DNA is reversed, in agreement with Hanand Craighead [18]; i.e., there is a crossover around thisvalue of electric field, see Figs. 2 and 3. The same findingsare recently reported by Sakaue in his pure theoreticalapproach to the problem. According to the model pre-sented here, it may be said that with the decrease inelectric field, the role of deterministic drift term in theOrnstein–Uhlenbeck equation decreases compared tothat of the stochastic term, and at some point (aboutE < 25 V/cm) they become comparable, so there isexpected to be a critical point and consequently a cross-over.
Figure 2. Dependence of average velocities of l-DNAand T4-DNA molecules on the electric field. There is acrossover around E = 25 V/cm.
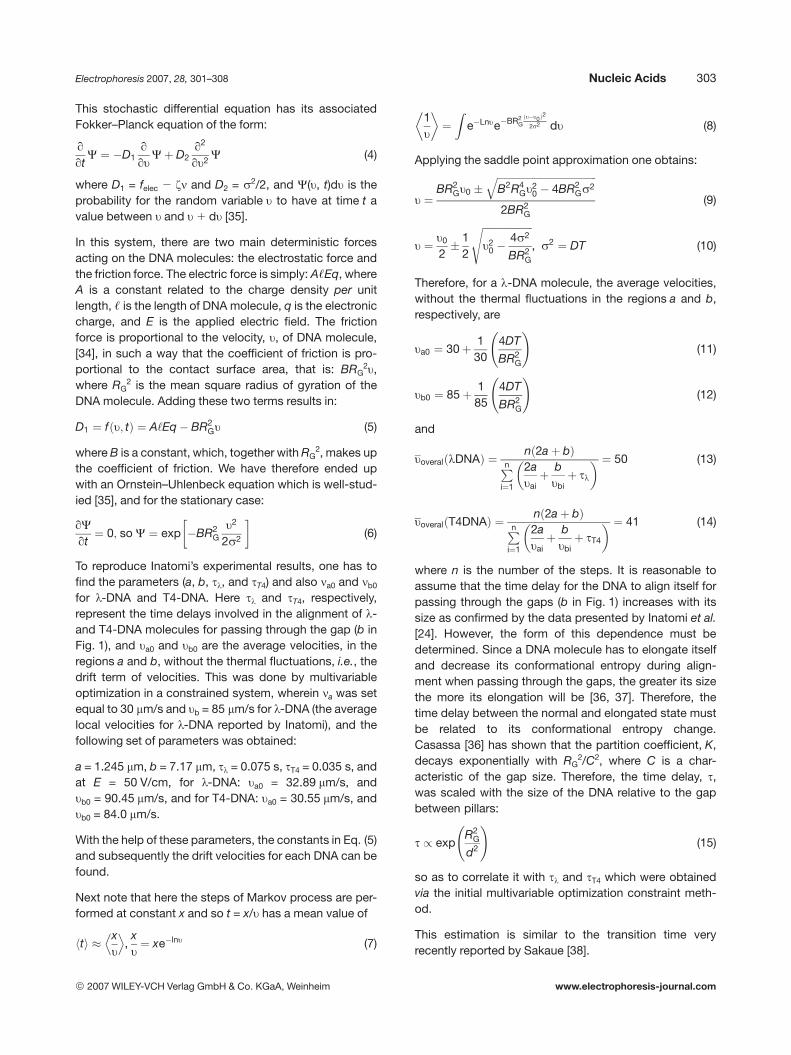
Figure 3. Velocity distribution of l-DNA and T4-DNA attwo different electric fields. At E = 15 V/cm, T4-DNA pre-cedes the l-DNA, but at E = 35 V/cm l-DNA precedes theT4-DNA.
3.2 Effect of the size range of the DNA mole-cules
The length dependence of the mobility of a DNA moleculein the lattice considered here is not monotonic; as it hasalso been reported by Streek et al. [34] and by Sakaue[38] for another type of lattice geometry. As shown inFigs. 4 and 5, for large DNA molecules (.40 kbp atE = 50 V/cm) mobility decreases with their length, ,, butthe dependence reverses for smaller DNA molecules.Figures 4 and 5 show this nonmonotonic dependence ofmobility on length.
In order to account for this result, the dependence of bothdrift and stochastic terms in Eq. (3) on the length of DNAmolecule was investigated.
In the absence of any noise, and under the stationarystate conditions, A,Eq = BRG
2u and u = AlEq/BRG2, so the
drift term is related to , by ,/RG2!,(1–2n), where u is the
usual exponent relating the radius of gyration of a DNAmolecule to its length ,; whereas the stochastic termdepends on , as D1/2,22n (Eq. 10). Even ignoring D (whichalso decreases with ,) the dependence of stochastic termon , is more rapid than the drift term. Therefore, as ,
decreases both terms increase but the stochastic termincreases more rapidly, and at some , value they may becomparable and a critical point will be reached whereafterthe form of length dependence will be reversed.
Given the existing conflicting results in the literature, thesize dependence of mobility of DNA molecules wassimulated in wider ranges of DNA size and the electric
© 2007 WILEY-VCH Verlag GmbH & Co. KGaA, Weinheim www.electrophoresis-journal.com
Electrophoresis 2007, 28, 301–308 Nucleic Acids 305
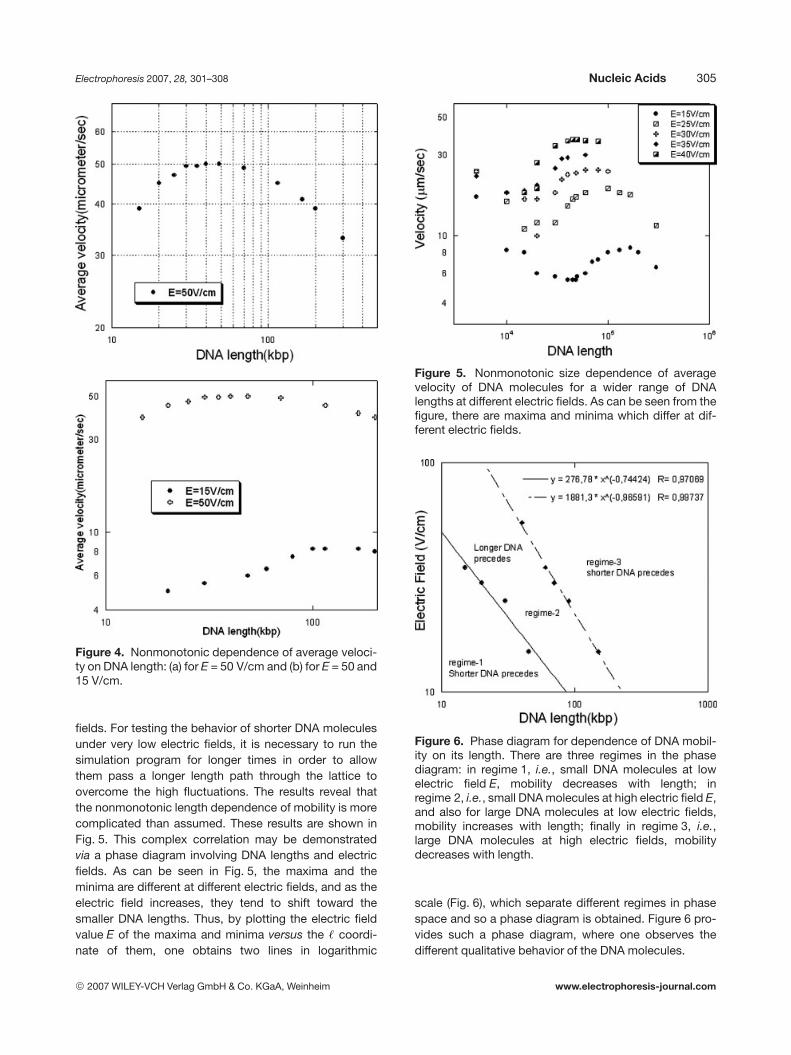
Figure 4. Nonmonotonic dependence of average veloci-ty on DNA length: (a) for E = 50 V/cm and (b) for E = 50 and15 V/cm.
fields. For testing the behavior of shorter DNA moleculesunder very low electric fields, it is necessary to run thesimulation program for longer times in order to allowthem pass a longer length path through the lattice toovercome the high fluctuations. The results reveal thatthe nonmonotonic length dependence of mobility is morecomplicated than assumed. These results are shown inFig. 5. This complex correlation may be demonstratedvia a phase diagram involving DNA lengths and electricfields. As can be seen in Fig. 5, the maxima and theminima are different at different electric fields, and as theelectric field increases, they tend to shift toward thesmaller DNA lengths. Thus, by plotting the electric fieldvalue E of the maxima and minima versus the , coordi-nate of them, one obtains two lines in logarithmic
Figure 5. Nonmonotonic size dependence of averagevelocity of DNA molecules for a wider range of DNAlengths at different electric fields. As can be seen from thefigure, there are maxima and minima which differ at dif-ferent electric fields.
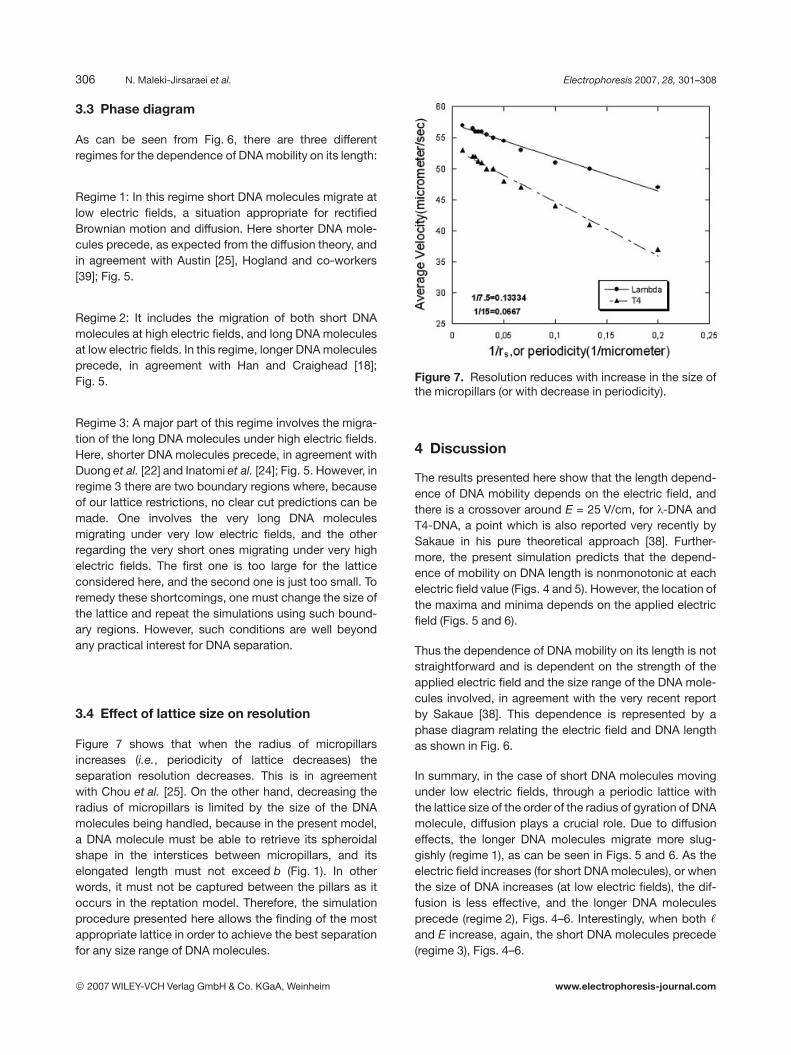
Figure 6. Phase diagram for dependence of DNA mobil-ity on its length. There are three regimes in the phasediagram: in regime 1, i.e., small DNA molecules at lowelectric field E, mobility decreases with length; inregime 2, i.e., small DNA molecules at high electric field E,and also for large DNA molecules at low electric fields,mobility increases with length; finally in regime 3, i.e.,large DNA molecules at high electric fields, mobilitydecreases with length.
scale (Fig. 6), which separate different regimes in phasespace and so a phase diagram is obtained. Figure 6 pro-vides such a phase diagram, where one observes thedifferent qualitative behavior of the DNA molecules.
© 2007 WILEY-VCH Verlag GmbH & Co. KGaA, Weinheim www.electrophoresis-journal.com
306 N. Maleki-Jirsaraei et al. Electrophoresis 2007, 28, 301–308
3.3 Phase diagram
As can be seen from Fig. 6, there are three differentregimes for the dependence of DNA mobility on its length:
Regime 1: In this regime short DNA molecules migrate atlow electric fields, a situation appropriate for rectifiedBrownian motion and diffusion. Here shorter DNA mole-cules precede, as expected from the diffusion theory, andin agreement with Austin [25], Hogland and co-workers[39]; Fig. 5.
Regime 2: It includes the migration of both short DNAmolecules at high electric fields, and long DNA moleculesat low electric fields. In this regime, longer DNA moleculesprecede, in agreement with Han and Craighead [18];Fig. 5.
Regime 3: A major part of this regime involves the migra-tion of the long DNA molecules under high electric fields.Here, shorter DNA molecules precede, in agreement withDuong et al. [22] and Inatomi et al. [24]; Fig. 5. However, inregime 3 there are two boundary regions where, becauseof our lattice restrictions, no clear cut predictions can bemade. One involves the very long DNA moleculesmigrating under very low electric fields, and the otherregarding the very short ones migrating under very highelectric fields. The first one is too large for the latticeconsidered here, and the second one is just too small. Toremedy these shortcomings, one must change the size ofthe lattice and repeat the simulations using such bound-ary regions. However, such conditions are well beyondany practical interest for DNA separation.
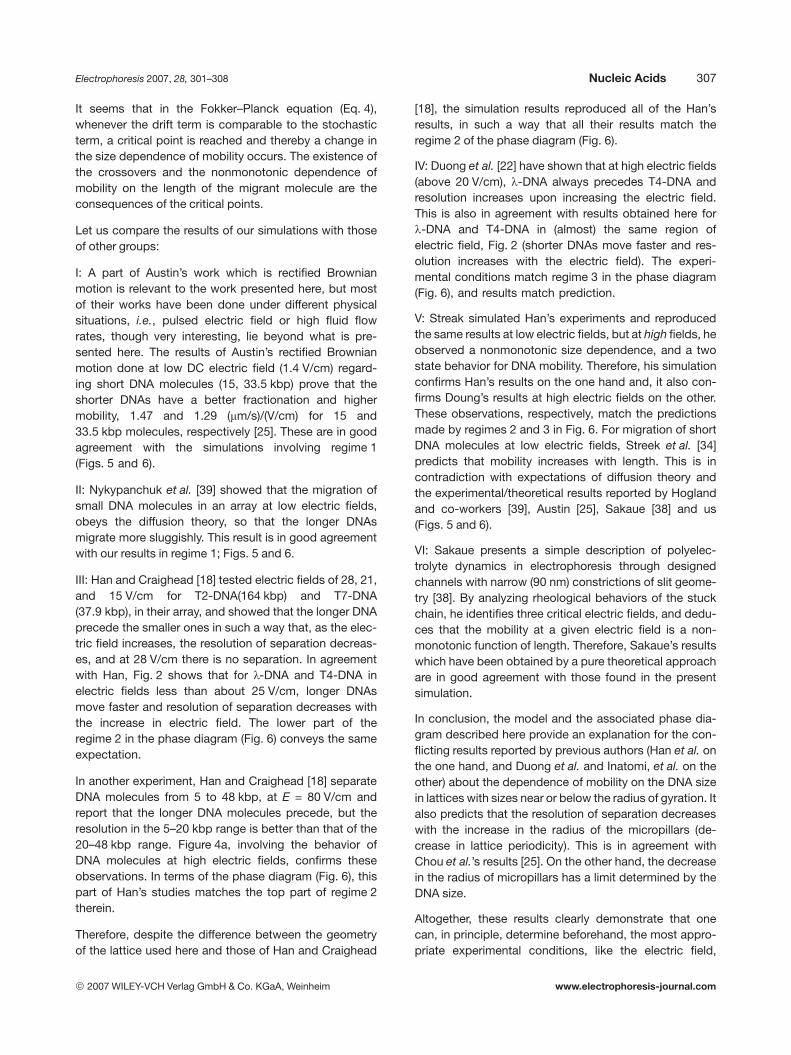
3.4 Effect of lattice size on resolution
Figure 7 shows that when the radius of micropillarsincreases (i.e., periodicity of lattice decreases) theseparation resolution decreases. This is in agreementwith Chou et al. [25]. On the other hand, decreasing theradius of micropillars is limited by the size of the DNAmolecules being handled, because in the present model,a DNA molecule must be able to retrieve its spheroidalshape in the interstices between micropillars, and itselongated length must not exceed b (Fig. 1). In otherwords, it must not be captured between the pillars as itoccurs in the reptation model. Therefore, the simulationprocedure presented here allows the finding of the mostappropriate lattice in order to achieve the best separationfor any size range of DNA molecules.
Figure 7. Resolution reduces with increase in the size ofthe micropillars (or with decrease in periodicity).
4 Discussion
The results presented here show that the length depend-ence of DNA mobility depends on the electric field, andthere is a crossover around E = 25 V/cm, for l-DNA andT4-DNA, a point which is also reported very recently bySakaue in his pure theoretical approach [38]. Further-more, the present simulation predicts that the depend-ence of mobility on DNA length is nonmonotonic at eachelectric field value (Figs. 4 and 5). However, the location ofthe maxima and minima depends on the applied electricfield (Figs. 5 and 6).
Thus the dependence of DNA mobility on its length is notstraightforward and is dependent on the strength of theapplied electric field and the size range of the DNA mole-cules involved, in agreement with the very recent reportby Sakaue [38]. This dependence is represented by aphase diagram relating the electric field and DNA lengthas shown in Fig. 6.
In summary, in the case of short DNA molecules movingunder low electric fields, through a periodic lattice withthe lattice size of the order of the radius of gyration of DNAmolecule, diffusion plays a crucial role. Due to diffusioneffects, the longer DNA molecules migrate more slug-gishly (regime 1), as can be seen in Figs. 5 and 6. As theelectric field increases (for short DNA molecules), or whenthe size of DNA increases (at low electric fields), the dif-fusion is less effective, and the longer DNA moleculesprecede (regime 2), Figs. 4–6. Interestingly, when both ,
and E increase, again, the short DNA molecules precede(regime 3), Figs. 4–6.
© 2007 WILEY-VCH Verlag GmbH & Co. KGaA, Weinheim www.electrophoresis-journal.com
Electrophoresis 2007, 28, 301–308 Nucleic Acids 307
It seems that in the Fokker–Planck equation (Eq. 4),whenever the drift term is comparable to the stochasticterm, a critical point is reached and thereby a change inthe size dependence of mobility occurs. The existence ofthe crossovers and the nonmonotonic dependence ofmobility on the length of the migrant molecule are theconsequences of the critical points.
Let us compare the results of our simulations with thoseof other groups:
I: A part of Austin’s work which is rectified Brownianmotion is relevant to the work presented here, but mostof their works have been done under different physicalsituations, i.e., pulsed electric field or high fluid flowrates, though very interesting, lie beyond what is pre-sented here. The results of Austin’s rectified Brownianmotion done at low DC electric field (1.4 V/cm) regard-ing short DNA molecules (15, 33.5 kbp) prove that theshorter DNAs have a better fractionation and highermobility, 1.47 and 1.29 (mm/s)/(V/cm) for 15 and33.5 kbp molecules, respectively [25]. These are in goodagreement with the simulations involving regime 1(Figs. 5 and 6).
II: Nykypanchuk et al. [39] showed that the migration ofsmall DNA molecules in an array at low electric fields,obeys the diffusion theory, so that the longer DNAsmigrate more sluggishly. This result is in good agreementwith our results in regime 1; Figs. 5 and 6.
III: Han and Craighead [18] tested electric fields of 28, 21,and 15 V/cm for T2-DNA(164 kbp) and T7-DNA(37.9 kbp), in their array, and showed that the longer DNAprecede the smaller ones in such a way that, as the elec-tric field increases, the resolution of separation decreas-es, and at 28 V/cm there is no separation. In agreementwith Han, Fig. 2 shows that for l-DNA and T4-DNA inelectric fields less than about 25 V/cm, longer DNAsmove faster and resolution of separation decreases withthe increase in electric field. The lower part of theregime 2 in the phase diagram (Fig. 6) conveys the sameexpectation.
In another experiment, Han and Craighead [18] separateDNA molecules from 5 to 48 kbp, at E = 80 V/cm andreport that the longer DNA molecules precede, but theresolution in the 5–20 kbp range is better than that of the20–48 kbp range. Figure 4a, involving the behavior ofDNA molecules at high electric fields, confirms theseobservations. In terms of the phase diagram (Fig. 6), thispart of Han’s studies matches the top part of regime 2therein.
Therefore, despite the difference between the geometryof the lattice used here and those of Han and Craighead
[18], the simulation results reproduced all of the Han’sresults, in such a way that all their results match theregime 2 of the phase diagram (Fig. 6).
IV: Duong et al. [22] have shown that at high electric fields(above 20 V/cm), l-DNA always precedes T4-DNA andresolution increases upon increasing the electric field.This is also in agreement with results obtained here forl-DNA and T4-DNA in (almost) the same region ofelectric field, Fig. 2 (shorter DNAs move faster and res-olution increases with the electric field). The experi-mental conditions match regime 3 in the phase diagram(Fig. 6), and results match prediction.
V: Streak simulated Han’s experiments and reproducedthe same results at low electric fields, but at high fields, heobserved a nonmonotonic size dependence, and a twostate behavior for DNA mobility. Therefore, his simulationconfirms Han’s results on the one hand and, it also con-firms Doung’s results at high electric fields on the other.These observations, respectively, match the predictionsmade by regimes 2 and 3 in Fig. 6. For migration of shortDNA molecules at low electric fields, Streek et al. [34]predicts that mobility increases with length. This is incontradiction with expectations of diffusion theory andthe experimental/theoretical results reported by Hoglandand co-workers [39], Austin [25], Sakaue [38] and us(Figs. 5 and 6).
VI: Sakaue presents a simple description of polyelec-trolyte dynamics in electrophoresis through designedchannels with narrow (90 nm) constrictions of slit geome-try [38]. By analyzing rheological behaviors of the stuckchain, he identifies three critical electric fields, and dedu-ces that the mobility at a given electric field is a non-monotonic function of length. Therefore, Sakaue’s resultswhich have been obtained by a pure theoretical approachare in good agreement with those found in the presentsimulation.
In conclusion, the model and the associated phase dia-gram described here provide an explanation for the con-flicting results reported by previous authors (Han et al. onthe one hand, and Duong et al. and Inatomi, et al. on theother) about the dependence of mobility on the DNA sizein lattices with sizes near or below the radius of gyration. Italso predicts that the resolution of separation decreaseswith the increase in the radius of the micropillars (de-crease in lattice periodicity). This is in agreement withChou et al.’s results [25]. On the other hand, the decreasein the radius of micropillars has a limit determined by theDNA size.
Altogether, these results clearly demonstrate that onecan, in principle, determine beforehand, the most appro-priate experimental conditions, like the electric field,
© 2007 WILEY-VCH Verlag GmbH & Co. KGaA, Weinheim www.electrophoresis-journal.com
308 N. Maleki-Jirsaraei et al. Electrophoresis 2007, 28, 301–308
micropillars size, and spacing between them, in order toachieve the best separation resolution for various molec-ular size ranges of DNA molecules, and thus design andfabricate the appropriate matrix required.
5 References
[1] Sarbolouki, M. N., Mahnam, K., Rafee-pour, H. A., Electro-phoresis 2004, 25, 2907–2911.
[2] Holmes, D. L., Stellwagen, N. C., Electrophoresis 1991, 12,253–263.
[3] Chrambach, A., Wheeler, D. L., Electrophoresis 1994, 15,1021–1027.
[4] Chrambach, A., Rodbard, D., Science 1971, 172, 440–451.[5] Tietz, D., Gombocz, E., Chrambach, A., Electrophoresis
1991, 12, 710–721.[6] Tietz, D., Chrambach, A., Electrophoresis 1993, 14, 185–
190.[7] Stellwagen, N. C., Electrophoresis 1997, 18, 34–44.[8] Rickwood, D., Hames, B. D., Gel Electrophoresis of Nucleic
Acids, A Practical Approach, Oxford University Press,Oxford 1990.
[9] Chrambach, A., Dunn, B. J., Radola, B. J., Advances inElectrophoresis, Vol. 5, VCH, New York 1990.
[10] Volkmuth, W. D., Austin, R. H., Nature 1992, 358, 600–602.[11] Chou, C. F., Austin, R. H., Bakajin, O.,Tegenfeldt, J. O. et al.,
Electrophoresis 2000, 21, 81–90.[12] Bakajin, O., Duke, T. A. J., Tegenfeldt, J., Chou, C. F. et al.,
Anal. Chem. 2001. 73, 6053–6056.[13] Huang, L. R., Silberzan, P., Tegenfeldt, J. O., Cox, E. C. et al.,
Phys. Rev. Lett. 2002, 17, 178301.[14] Cao, H., Yu, Z., Wang, J., Tegenfeldt, J. O. et al., Appl. Phys.
Lett. 2002, 81, 174–176.[15] Huang, L. R., Tegenfeldt, J. O., Kraeft, J. J., Sturm, J. C.
et al., Nat Biotechnol. 2002, 20, 1048–1051.[16] Cabodi, M., Chen, Y. F., Turner, S. W. P., Craighead, H. G.,
Austin, R. H., Electrophoresis 2002, 23, 3496–3503.[17] Huang, L. R., Cox, E. C., Austin, R. H., Sturm, J. C., Science
2004, 304, 987–990.
[18] Han, J., Craighead, H. G., Science 2000, 288, 1026–1029.[19] Han, J., Turner, S. W., Craighead, H. G., Phys. Rev. Lett.
1999, 83, 1688–1961.[20] Han, J., Craighead, H. G., Anal. Chem. 2002, 74, 1026.[21] Han, J., Craighead, H. G., Vac. Sci. Tech. A 1999, 17, 2142.[22] Duong, T. T., Ros, R., Streek, M., Schmid, F. et al., Microelec.
Eng. 2003, 67–68, 905–912.[23] Ros, A., Heiimich, W., Duong, T., Anselmetti, D., J. Biotech.
2004, 112, 65–72.[24] Inatomi, K. I., Izuo, S. I., Lee, S. S., Ohji, H., Shiono, S.,
Microelec. Eng. 2003, 70, 13–18.[25] Chou, C. F., Bakajin, O., Turner, S. W. P., Duke, T. A. J. et al.,
ANS 1999, 96, 13762–13765.[26] Yi, S., Seo, K. S., Cho, Y. H., Sens. Actuators A 2005, 120,
429–436.[27] Chou, H. P., Spence, C., Scherer, A., Quake, S., Proc. Natl.
Acad. Sci. USA 1999, 96, 11–13.[28] Hogland, D. A., Muthukumar, M., Macromolecules1992, 25,
6696–6698.
[29] Muthukumar, M., Baumgartner, A., Macromolecules 1989,22, 1937–1941.
[30] Muthukumar, M., Baumgartner, A., Macromolecules 1989,22, 1941–1946.
[31] Halperin, A., Alexander, S., Macromolecules 1987, 20,1146–1152.
[32] Casassa, E. F., Macromolecules 1976, 9, 182–185.[33] Hammond, R. W., Bader, J. S., Henck, S. A., Deem, M. W.
et al., Electrophoresis 2000, 21, 74–80.[34] Streek, M., Schmid, F., Duong, T. T., Anselmetti, D., Ros, A.,
Phys. Rev. E 2005, 71, 011905.[35] Dunweg, B., Paul, W., Int. J. Modern Phys. C 1991, 2, 817–
827.[36] Cassasa, E. F., J. Polym. Sci. Polym. Lett. Ed. 1967, 5, 773;
J. Polym. Sci. Polym. Phys. Ed. 1972, 10, 381; Macro-molecules 1976, 9, 182.
[37] Sakaue, T., Raphael, E., Macromolecules 2006, 39, 2621–2628.
[38] Sakaue, T., arXiv:cond-mat/0509403 v2 8 Jan 2006, 1–12.[39] Nykypanchuk, D., Strey, H. H., Hoagland, D. A., Science
2002, 297, 987–990.
© 2007 WILEY-VCH Verlag GmbH & Co. KGaA, Weinheim www.electrophoresis-journal.com
Related Documents


