Ecological Modelling 170 (2003) 345–361 Simulation modelling of long-term stand dynamics at different scenarios of forest management for coniferous–broad-leaved forests S.I. Chumachenko a , V.N. Korotkov b , M.M. Palenova b,∗ , D.V. Politov c a Moscow State Forest University, 1 Institutskaya, 1 Mytischi 141001, Russia b All-Russian Research Institute for Silviculture and Mechanization of Forestry, 15, Institutskaya str., Pushkino, Moscow reg., 141200, Russia c Vavilov Institute of General Genetics, 3 Gubkin St., GSP-1, Moscow 119991, Russia Abstract The computer program package FORRUS-S (FORest of RUSsia—Stand) has been developed for simulation modelling of forest ecosystems dynamics. The program package FORRUS-S consists of the model of natural development of multispecies uneven-aged stand, the model of exogenous influence (including sylvicultural activities) and a set of accessory programs (standard GIS, reference databases, modules recoding input and output information, etc.). The available to date set of reference databases allows forecasting of stand dynamics in the zone of mixed coniferous–broad-leaved forests in European Russia. Since within this zone photosynthetic active radiation (PAR) is the main limiting factor, it is recalculated at each step while other factors as soil richness and humidity are considered constant throughout the modelling cycle. Modelling is performed for each cohort separately, i.e. a group of individuals of same species and ontogenetic state. Each cohort is described by a set of biological parameters stored in specially compiled reference databases (biometrics of tree crown, demand for light, gaps in the canopy, crown transparency to light, seed dispersal distance, sprouting ability, growth tables, potential stand quality index, etc.). Growth increment, thinning and natural regeneration are modelled with the step equal to 5 years. The model utilizes the principle of subdivision of the space into discrete three-dimensional elements. This approach makes it possible to consider the available PAR in the zone of active growth in a tree crown, and also to take into account spatial heterogeneity of growth conditions such as relief and soil characteristics. Modelling area can be up to several thousands of hectares. A number of external modules simulating sylvicultural measures can be enabled or disabled at any modelling step. FORRUS-S allows modelling of various scenarios of sylvicultural activity including: (1) natural stand development, (2) complete cycles of sylvicultural measures according to the current regulations and specifications of Russian Forest Service, (3) with infringement of technology specifications (heavy upper thinning and removing the best trees, clear cutting with destroying natural regeneration without planting). A set of tools was developed for analysis of various output databases and forecasted maps produced by means of GIS-technology. Model utilizes the standard input data have traditionally been using in forestry of the Russian Federation (taxation site descriptions, forest stand maps) and available for virtually all Russian territory. Paper describes the results of computational experiments at three scenarios of forest management using sample forest stand in the south of Moscow region. © 2003 Elsevier B.V. All rights reserved. Keywords: Simulation modelling; Multispecies uneven-aged stand; Forest ecosystems; Forest management; Mixed coniferous–broad-leaved forest; Photosynthetic active radiation ∗ Corresponding author. Tel.: +7-95-1739752; fax: +7-95-9934191. E-mail address: [email protected] (M.M. Palenova). 0304-3800/$ – see front matter © 2003 Elsevier B.V. All rights reserved. doi:10.1016/S0304-3800(03)00238-2

Welcome message from author
This document is posted to help you gain knowledge. Please leave a comment to let me know what you think about it! Share it to your friends and learn new things together.
Transcript
Ecological Modelling 170 (2003) 345–361
Simulation modelling of long-term stand dynamics atdifferent scenarios of forest management for
coniferous–broad-leaved forests
S.I. Chumachenkoa, V.N. Korotkovb, M.M. Palenovab,∗, D.V. Politovc
a Moscow State Forest University, 1 Institutskaya, 1 Mytischi 141001, Russiab All-Russian Research Institute for Silviculture and Mechanization of Forestry, 15, Institutskaya str., Pushkino, Moscow reg., 141200, Russia
c Vavilov Institute of General Genetics, 3 Gubkin St., GSP-1, Moscow 119991, Russia
Abstract
The computer program package FORRUS-S (FORest of RUSsia—Stand) has been developed for simulation modelling offorest ecosystems dynamics. The program package FORRUS-S consists of the model of natural development of multispeciesuneven-aged stand, the model of exogenous influence (including sylvicultural activities) and a set of accessory programs (standardGIS, reference databases, modules recoding input and output information, etc.). The available to date set of reference databasesallows forecasting of stand dynamics in the zone of mixed coniferous–broad-leaved forests in European Russia. Since withinthis zone photosynthetic active radiation (PAR) is the main limiting factor, it is recalculated at each step while other factorsas soil richness and humidity are considered constant throughout the modelling cycle. Modelling is performed for each cohortseparately, i.e. a group of individuals of same species and ontogenetic state. Each cohort is described by a set of biologicalparameters stored in specially compiled reference databases (biometrics of tree crown, demand for light, gaps in the canopy,crown transparency to light, seed dispersal distance, sprouting ability, growth tables, potential stand quality index, etc.). Growthincrement, thinning and natural regeneration are modelled with the step equal to 5 years.
The model utilizes the principle of subdivision of the space into discrete three-dimensional elements. This approach makesit possible to consider the available PAR in the zone of active growth in a tree crown, and also to take into account spatialheterogeneity of growth conditions such as relief and soil characteristics. Modelling area can be up to several thousands of hectares.
A number of external modules simulating sylvicultural measures can be enabled or disabled at any modelling step. FORRUS-Sallows modelling of various scenarios of sylvicultural activity including: (1) natural stand development, (2) complete cycles ofsylvicultural measures according to the current regulations and specifications of Russian Forest Service, (3) with infringement oftechnology specifications (heavy upper thinning and removing the best trees, clear cutting with destroying natural regenerationwithout planting). A set of tools was developed for analysis of various output databases and forecasted maps produced by meansof GIS-technology.
Model utilizes the standard input data have traditionally been using in forestry of the Russian Federation (taxation sitedescriptions, forest stand maps) and available for virtually all Russian territory. Paper describes the results of computationalexperiments at three scenarios of forest management using sample forest stand in the south of Moscow region.© 2003 Elsevier B.V. All rights reserved.
Keywords:Simulation modelling; Multispecies uneven-aged stand; Forest ecosystems; Forest management; Mixed coniferous–broad-leavedforest; Photosynthetic active radiation
∗ Corresponding author. Tel.:+7-95-1739752; fax:+7-95-9934191.E-mail address:[email protected] (M.M. Palenova).
0304-3800/$ – see front matter © 2003 Elsevier B.V. All rights reserved.doi:10.1016/S0304-3800(03)00238-2
346 S.I. Chumachenko et al. / Ecological Modelling 170 (2003) 345–361
1. Introduction
With development of computer techniques duringthe last decade mathematical modelling in ecologyhas substantially improved. The possibility appearedof direct simulation computer modelling of complexspatial discrete ecosystems. Ecological physiologicalexplanatory models can be realized at different levelsof biological system organization, from computationof changes in parameters of individual trees up to fore-casting of succession course covering some territory.Specific models and supporting those programmingtools are needed for sustainable forest management.Development of such models requires that along withnatural forest dynamics simulation of sylviculturalmeasures they would be able to take into account het-erogeneity of the modelled space, e.g. different relief,ecological conditions of the stands, difference in theheight of the adjacent stands, various configurationsof cutover patches, etc.
Possibilities of widely used Gap-models to solvethese tasks are limited by the concept of Gap-modelling itself: forest object is considered as an as-semblage of independent gaps (Botkin, 1993; Botkinet al., 1972; Leemans and Prentice, 1989; Pacalaet al., 1995; Shugart, 1984, 1992; Urban et al., 1991).Gap-models ignore such processes as: (1) naturalregeneration of species lacking in a given gap butpresent in the adjacent ones; (2) the influence ofthe adjacent gaps onto light conditions of trees; (3)heterogeneity of growing conditions.
The alternative Grid-based approach to mod-elling allows to partly solve these tasks (Bergerand Hildenbrandt, 2000). However, the absence ofthree-dimensional (3-D) space within the modellingelement does not allow taking into account light con-ditions in complex multi-storey uneven-aged stands.
We developed a model that is intermediate be-tween Gap- and Grid-modelling approaches and usesthe technique of ecophysiological (explanatory) mod-elling. The modelling is based on repeated calcula-tions of the current growth increment (by diameterand height) and thinning out in terms of 3-D crownstructure. The calculations are performed for eachcohort (a group of individuals of same species andage) in a multispecies uneven-aged stand. Growth in-crement values are calculated based on the influenceof the local light environment on a tree crown with
implications for properties as degree of closeness,species interactions and availability of basic resources(soil water and nitrogen). In this paper, we presentthe developed model and demonstrate its applicabil-ity in solving the following tasks: (1) forecasting ofnatural stand development; (2) modelling of differentsylvicultural activities and their impact onto standdynamics; (3) examining of dynamic processes inboth populations of separate forest tree species andforest communities; (4) comparative estimation ofecosystem parameters at different scenarios of forestmanagement.
2. Description of the model
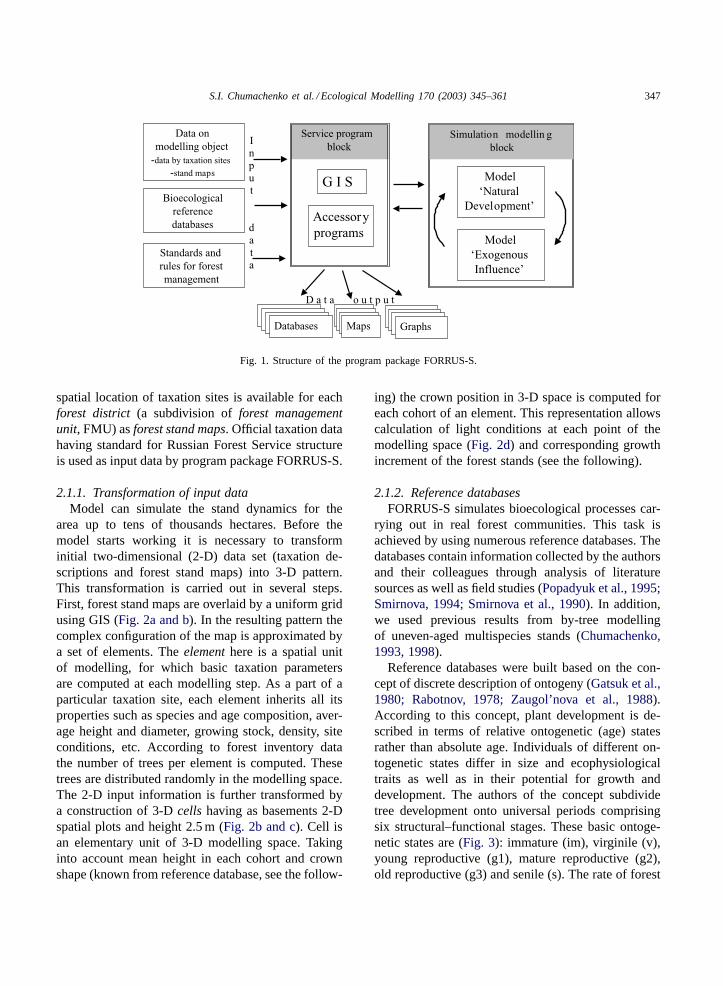
A computer program package FORRUS-S (FORestof RUSsia—Stand) was designed for simulation mod-elling and analysis of dynamic processes being car-ried out in forest ecosystems (Chumachenko, 1993;Chumachenko et al., 1997, 2000). General outline ofthe program package is shown inFig. 1. FORRUS-Sconsists of models ‘Natural Development’, ‘Exoge-nous Influence’ (including sylvicultural activities) anda service block comprising GIS and a set of acces-sory programs (reference databases, modules convert-ing raw input data into format used by the models,software for recoding and visualization of output in-formation, etc.). The present paper is focused on a de-scription of the model of natural development.
2.1. Input data and reference databases
The primary unit of forest inventory, planning andmanagement in Russia is ataxation sitedefined asa parcel of forest homogenous with respect to itseconomic importance, evaluation characteristics, dis-similar of neighboring plots and requiring uniformsylvicultural regime. Duringtaxation (a complex ofmeasures for inventory, evaluation of qualitative andquantitative characteristics of forest resources) theinventory databases are being compiled for each taxa-tion site. The databases contain data on species com-position, age, average height and diameter for eachspecies, site conditions, stand quality index (SQI),etc. Information obtained during forest taxation at thetaxation site level is the most accurate and reliable in-formation on forest resources in Russia. Besides, the
S.I. Chumachenko et al. / Ecological Modelling 170 (2003) 345–361 347
Standards and
rules for forest
management
Data on
modelling object
-data by taxation sites
-stand maps
Bioecological
reference
databases
I
n
p
u
t
d
a
t
a
Model
‘Natural
Development’
Model
‘Exogenous
Influence’
Simulation modellin g
block
Databases Databases Databases Databases
DatabDatabDatabMaps DatabaseDatabaseDatabaseGraphs
D a t a o u t p u t
G I S
Accessory
programs
Service program
block
Fig. 1. Structure of the program package FORRUS-S.
spatial location of taxation sites is available for eachforest district (a subdivision offorest managementunit, FMU) asforest stand maps. Official taxation datahaving standard for Russian Forest Service structureis used as input data by program package FORRUS-S.
2.1.1. Transformation of input dataModel can simulate the stand dynamics for the
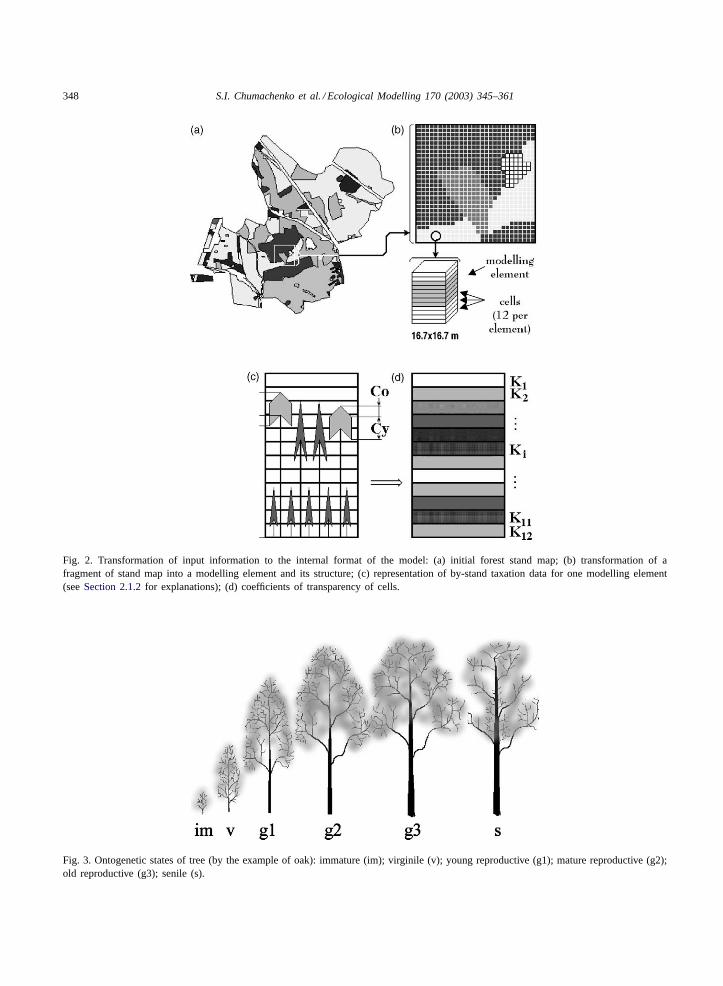
area up to tens of thousands hectares. Before themodel starts working it is necessary to transforminitial two-dimensional (2-D) data set (taxation de-scriptions and forest stand maps) into 3-D pattern.This transformation is carried out in several steps.First, forest stand maps are overlaid by a uniform gridusing GIS (Fig. 2a and b). In the resulting pattern thecomplex configuration of the map is approximated bya set of elements. Theelementhere is a spatial unitof modelling, for which basic taxation parametersare computed at each modelling step. As a part of aparticular taxation site, each element inherits all itsproperties such as species and age composition, aver-age height and diameter, growing stock, density, siteconditions, etc. According to forest inventory datathe number of trees per element is computed. Thesetrees are distributed randomly in the modelling space.The 2-D input information is further transformed bya construction of 3-Dcells having as basements 2-Dspatial plots and height 2.5 m (Fig. 2b and c). Cell isan elementary unit of 3-D modelling space. Takinginto account mean height in each cohort and crownshape (known from reference database, see the follow-
ing) the crown position in 3-D space is computed foreach cohort of an element. This representation allowscalculation of light conditions at each point of themodelling space (Fig. 2d) and corresponding growthincrement of the forest stands (see the following).
2.1.2. Reference databasesFORRUS-S simulates bioecological processes car-
rying out in real forest communities. This task isachieved by using numerous reference databases. Thedatabases contain information collected by the authorsand their colleagues through analysis of literaturesources as well as field studies (Popadyuk et al., 1995;Smirnova, 1994; Smirnova et al., 1990). In addition,we used previous results from by-tree modellingof uneven-aged multispecies stands (Chumachenko,1993, 1998).
Reference databases were built based on the con-cept of discrete description of ontogeny (Gatsuk et al.,1980; Rabotnov, 1978; Zaugol’nova et al., 1988).According to this concept, plant development is de-scribed in terms of relative ontogenetic (age) statesrather than absolute age. Individuals of different on-togenetic states differ in size and ecophysiologicaltraits as well as in their potential for growth anddevelopment. The authors of the concept subdividetree development onto universal periods comprisingsix structural–functional stages. These basic ontoge-netic states are (Fig. 3): immature (im), virginile (v),young reproductive (g1), mature reproductive (g2),old reproductive (g3) and senile (s). The rate of forest
348 S.I. Chumachenko et al. / Ecological Modelling 170 (2003) 345–361
Fig. 2. Transformation of input information to the internal format of the model: (a) initial forest stand map; (b) transformation of afragment of stand map into a modelling element and its structure; (c) representation of by-stand taxation data for one modelling element(seeSection 2.1.2for explanations); (d) coefficients of transparency of cells.
Fig. 3. Ontogenetic states of tree (by the example of oak): immature (im); virginile (v); young reproductive (g1); mature reproductive (g2);old reproductive (g3); senile (s).
S.I. Chumachenko et al. / Ecological Modelling 170 (2003) 345–361 349
tree development depends on a particular species: un-der normal conditions each individual of this speciespasses all the above-mentioned ontogenetic stagesconsecutively. However, under suboptimal conditions(for instance, heavy shading) a tree can significantlydecrease development rate and retard at one of onto-genetic states. For instance, spruce (Piceasp.) undercanopy of birch (Betula sp.) experience such delayfor 30–40 years at immature of virginile state, i.e.by its appearance and growth potential such trees aresignificantly “younger” than their really achieved age.This phenomenon leads to occurrence of differentontogenetic states among trees of the same absoluteage. Thus, FORRUS-S operates with relative agesrather than with absolute ages, and by this describesthe state of a stand more accurately.
Reference databases were compiled for 18 foresttree species. All parameters of these databases are at-tributed to each ontogenetic state for each species, i.e.separate values describe each cohort. Most importantreference databases of bioecological parameters usedby the model are listed in the following.
2.1.2.1. Biometric characteristics of tree crown.The model approximates a tree crown shape by a com-bination of simple bodies of revolution: cone (withheight Co) and cylinder (with heightCy) (Fig. 2c).In order to assay the structure and distribution ofphytomass the model describes internal space of treecrown: a shading cone and a zone of active growth.The shading cone contains no photosynthetic elementswhile the zone of active growth is a part of tree crownwhere most of its active green biomass is concentrated(Nosova et al., 1995). Comparison of development ofstands having different density has shown that apicalgrowth increment depends on solar radiation in thezone of active growth rather than in the tree top. Thedatabase was compiled basing on field measurements.
2.1.2.2. Demand for light. The minimal value ofphotoactive radiation(PAR) is determined for eachcohort and marks the die-back of lower branches(the shading tolerance of the cohort). . . (Alekseev,1975; Evstigneev, 1991, 1996; Tsel’niker, 1978). Theoptimal PAR value is characteristic to normal devel-opment of even-aged single-species stand accordingto growth tables. The database was based on fieldmeasurements.
• Gaps in the canopyare values additional to maximaltree canopy densities of pure stands for each cohortsummed to 1. The database was compiled basing onfield measurements.
• Coefficient of crown transparency to lightis deter-mined as a ratio of input solar radiation to outputradiation per unit of crown length (Alekseev, 1975).The data of this database was computed basing onfield measurements of crown height and diameter inhigh dense stands and PAR values under canopy insuch stands.
2.1.2.3. Seed dispersal distance.The databasestores field-measured values of effective distance ofseed dispersal (Pijl, 1982; Ridley, 1930; Udra, 1988,1990).
2.1.2.4. Sprouting ability. For each cohort it is anaverage amount of sprouts per stump (Smirnova et al.,1990; Udra, 1990). The database was compiled basingon field measurements.
2.1.2.5. Age coefficients.The database contains co-efficients allowing to determine ontogenetic state oftrees basing on taxation parameters. The values wereestimated for each cohort and based on the ratio ofcurrent height to maximal height in a pure stand.This database was compiled basing on field measure-ments and literature references (Gatsuk et al., 1980;Smirnova, 1994).
Some of the reference databases allow tuning of theprogram package for modelling of stand dynamics atdifferent climatic and ecological conditions.
2.1.2.6. Growth tables of pure (unispecies) stands.The database contains standard relationships betweenheight or diameter and age for different stand qual-ity indices obtained during long-termed field stud-ies for forest stands of coniferous–broad-leaved zone.(Kozlovski and Pawlov, 1967; Regulations, 1993).
2.1.2.7. Potential stand quality index.Referencedatabase of potential stand quality indices (PSQI) isformed on the base of edaphic network by Pogrebniakand Vorobiev (Pogrebnyak, 1968) and a database con-taining raw taxation data for the modelling territory.Edaphic network has two dimensions (soil humid-

350 S.I. Chumachenko et al. / Ecological Modelling 170 (2003) 345–361
Fig. 4. Dependence of potential stand quality index (PSQI) on soil richness and humidity of the modelling element (by the example ofoak). Russian scales: the stand quality index varies between Ia (corresponds to 1 on the graph)—the best, and Vb (9)—the worst class;soil richness (A: low,. . . , D: high); soil humidity (1: low,. . . , 5: high).
ity and richness) and describes all possible variantsof site conditions for forest ecosystems in EuropeanRussia. The database contains information aboutmaximal (potential) stand quality indices that speciescan achieve under different site conditions within themodelling territory. An example of this base is shownon Fig. 4. In the Russian scale the stand quality indexvaries between Ia (corresponds to 1 on the graph)—the best, and Vb (9)—the worst class.
2.2. Model of natural development
It is well-known, that principal limiting factorsof forest stand development are: PAR, available ni-trogen and water. The relative importance of these
Fig. 5. Outline of the model of natural development for multispecies uneven-aged stands. Boxes represent submodels, arrows designatedata flow.
factors varies depending on climatic conditions. Intaiga zone the main limiting factor is nitrogen, insteppe–forest zone it is water, while in the zone ofmixed coniferous–broad-leaved forest it is PAR. Theother factors, available nitrogen and soil humidity aretaken into account as input data (site conditions) whenheterogeneity of the modelled space is described.
The model of natural development consists of foursubmodels (Fig. 5): ‘Light’, ‘Growth’, ‘Thinning’and ‘Natural Reproduction’. Correspondingly, themodel performs simulation of substantial processesbeing carried out in forest stands: growth increment,endogenous thinning and natural reproduction of aforest stand. Dynamics of basic taxation parameters(height, diameter, age, forest stock, etc.), and changes
S.I. Chumachenko et al. / Ecological Modelling 170 (2003) 345–361 351
in species and age composition of the stand are mod-elled.
Each modelling step starts from calculation of lightconditions. The submodel ‘Light’ computes availablePAR for each cell of each element of the modellingspace. Then submodel ‘Growth’ determines currentgrowth increment values by height and diameter andother basic stand characteristics. The results from thissubmodel are processed by the submodel ‘Thinning’responsible for natural thinning of the stand. The sub-model ‘Light’ processes the results again and deter-mines new light conditions for the stand. Then sub-model ‘Natural Reproduction’ computes parameters ofregeneration. This ends the step of the model of natu-ral development. Modelling step is equal to 5 years.
2.2.1. Submodel ‘Light’When calculating light regime, FORRUS-S utilizes
data from observation of solar radiation at particularlatitude. According to meteorological data (Radiationcharacteristics, 1969) in latitudes of Moscow, Copen-hagen and Glasgow (56◦N) the solar radiation fromsouthern sector of the sky equals to 20% while radi-ation from upper sector is only 8% of the total. Thisdemonstrates that for more precise estimation of PARin a tree crown it is necessary to take into account so-lar radiation from different directions of the sky.
Values of luminous flux are defined in the modelseparately by azimuth and by angle of the sun standingabove the horizon and also by the quantitative ratio be-tween direct and scattered radiation. A number of ref-erence databases were compiled specially for this taskincluding: average annual number of sunny/cloudydays during summertime; the changes in cloudinessand dust content of the atmosphere depending on day-light hours and others. All the above-mentioned basescontain data for the region where the modelling objectsare located, i.e. for coniferous–broad-leaved forests ofthe European Russia.
The step size of the grid subdividing the modellingspace onto the elements (see above) is 16.7 m forthe latitude of Moscow region, and the area of eachelement is correspondingly 280 m2. Earlier we havedemonstrated (Chumachenko, 1993) that by choosingthis grid step size PAR values under forest canopy arecomputed significantly faster (Fig. 6). Value of thisparameter depends on the geographic latitude of thesite (and the corresponding angle of the sun standing
above the horizon) and on the maximal stand height ofthe upper storey of forest (about 30 m in the latitudeof Moscow).
For more precise calculation of PAR of the treecrown one of the authors of this paper developed amodel where crown is represented as a limited set ofcells having the shape of rectangular parallelepipeds(Chumachenko, 1998; Popadyuk and Chumachenko,1991). From the view of light parameters calculationa cell is semi-transparent. This allows computation oflight conditions taking into account daily sun move-ment from east to west, its changing angle of standingand intensity of both direct and scattered solar radia-tion. The presented here model uses algorithms of theabove-mentioned model for calculation of light con-ditions in the forest stands.
Submodel ‘Light’ first determines coefficient oflight transparency for each cell of each element tak-ing into account species composition of each element(Fig. 6):
Ki =∑
PjVij
Vc,
where is thePj is a coefficient of transparency of PARby-tree crowns injth cohort;Vij is a volume of crownsin jth cohort in theith cell; Vc is volume of the cell.
Then the submodel calculates the available PAR foreach cell. The overall PAR value for each cell is calcu-lated taking into account self-shadowing and shadow-ing from the adjacent cells using the following formula(Fig. 6). The algorithm of calculation of available PARis described in details earlier (Chumachenko, 1998).
2.2.2. Submodel ‘Growth’Submodel ‘Growth’ calculates current growth in-
crement by diameter and height. Growth incrementsare computed for each cohort of each element sep-arately. The calculations are based on the data fromreference database on growth tables for individual for-est tree species. It is noteworthy that at this stage thePAR values calculated by submodel ‘Light’ for eachcell of each element at particular step are being used.
The model assumes the available PAR (its valuesin the active growth zone of a tree) to be the mainfactor determining the tree growth rate under the forestcanopy. Other factors substantial for this process (suchas humidity and soil richness) are taken into accountthrough a reference database of potential (maximal

352 S.I. Chumachenko et al. / Ecological Modelling 170 (2003) 345–361
Fig. 6. Outline of calculation of available PAR (Ci) for a modelling element (Ki: light transparency coefficient ofith cell, Li: ray distancethrough ith cell, Dn: direct radiation,Sm: scattered radiation).
possible) stand quality indices. A stand quality indexvalue is set for each element basing on site conditionsof the taxation site to which this particular elementbelongs. ThePSQIis the highest possible stand qualityindex for a given species in particular site conditions.In coniferous–broad-leaved forests these factors arechanging very slowly, so that the proposed approachseems to adequately take them into account.
It is known that relationship between PAR and pho-tosynthesis is linear and if other factors are optimalwithin the range 1–15% of full PAR photosynthe-sis is increased proportionally with light (Shirley,1945). Similar data are obtained for European Rus-sia (Tsel’niker, 1978). Taken the absence of moredetailed data for different age groups model ap-proximates growth increment function. Relationshipbetween growth increment and available PAR arecollected in reference databases for each cohort sep-
arately. Characteristic points of this curve are lightminimum (Cmin), light optimum (Copt), growth in-crement at optimal PAR (�Hopt), growth incrementat 100% illumination (�H100). Values of all charac-teristic points of the reference curve are defined byspecies and age composition of particular cohort andpotential stand quality class in a given spatial element.The calculation of the current growth increment uti-lizes information from this database for each cohortof the modelling element. The calculations take intoaccount PAR in the zone of active growth (Ci) fortrees of particular cohort.
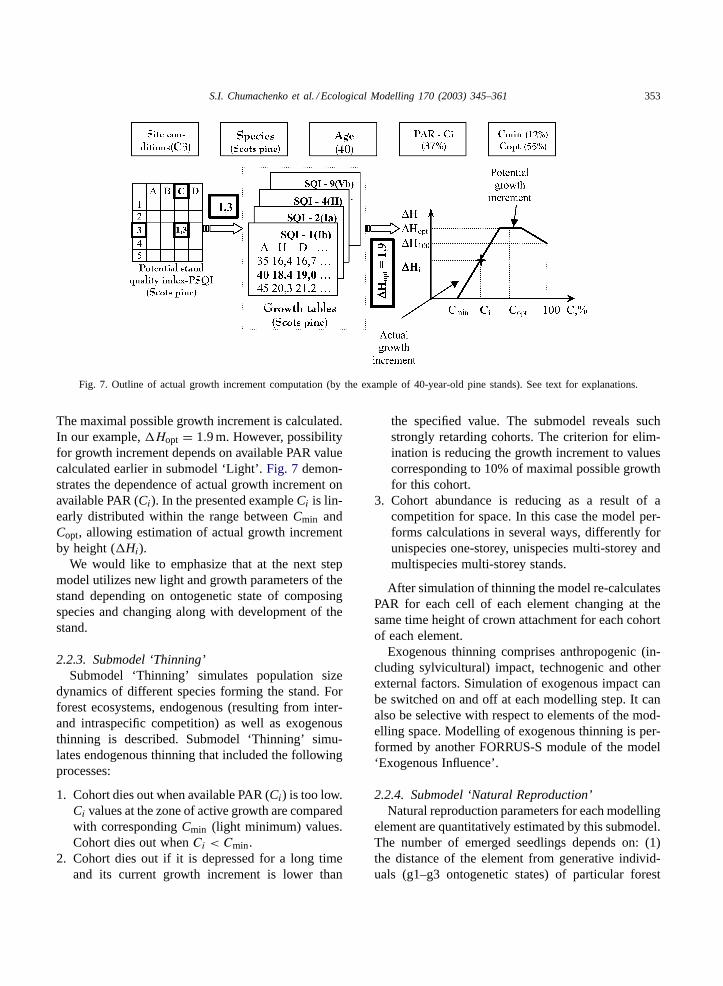
Let us consider an example of the growth incrementcalculation by height for a taxation site containingpine stand (Fig. 7). First, using data on site conditionsone should determine maximal PSQI for a pine stand(for instance, 1.3). Then, using growth tables for pine(A-age, H-height, D-diameter) having SQI Ia and Ib.
S.I. Chumachenko et al. / Ecological Modelling 170 (2003) 345–361 353
Fig. 7. Outline of actual growth increment computation (by the example of 40-year-old pine stands). See text for explanations.
The maximal possible growth increment is calculated.In our example,�Hopt = 1.9 m. However, possibilityfor growth increment depends on available PAR valuecalculated earlier in submodel ‘Light’.Fig. 7 demon-strates the dependence of actual growth increment onavailable PAR (Ci). In the presented exampleCi is lin-early distributed within the range betweenCmin andCopt, allowing estimation of actual growth incrementby height (�Hi).
We would like to emphasize that at the next stepmodel utilizes new light and growth parameters of thestand depending on ontogenetic state of composingspecies and changing along with development of thestand.
2.2.3. Submodel ‘Thinning’Submodel ‘Thinning’ simulates population size
dynamics of different species forming the stand. Forforest ecosystems, endogenous (resulting from inter-and intraspecific competition) as well as exogenousthinning is described. Submodel ‘Thinning’ simu-lates endogenous thinning that included the followingprocesses:
1. Cohort dies out when available PAR (Ci) is too low.Ci values at the zone of active growth are comparedwith correspondingCmin (light minimum) values.Cohort dies out whenCi < Cmin.
2. Cohort dies out if it is depressed for a long timeand its current growth increment is lower than
the specified value. The submodel reveals suchstrongly retarding cohorts. The criterion for elim-ination is reducing the growth increment to valuescorresponding to 10% of maximal possible growthfor this cohort.
3. Cohort abundance is reducing as a result of acompetition for space. In this case the model per-forms calculations in several ways, differently forunispecies one-storey, unispecies multi-storey andmultispecies multi-storey stands.
After simulation of thinning the model re-calculatesPAR for each cell of each element changing at thesame time height of crown attachment for each cohortof each element.
Exogenous thinning comprises anthropogenic (in-cluding sylvicultural) impact, technogenic and otherexternal factors. Simulation of exogenous impact canbe switched on and off at each modelling step. It canalso be selective with respect to elements of the mod-elling space. Modelling of exogenous thinning is per-formed by another FORRUS-S module of the model‘Exogenous Influence’.
2.2.4. Submodel ‘Natural Reproduction’Natural reproduction parameters for each modelling
element are quantitatively estimated by this submodel.The number of emerged seedlings depends on: (1)the distance of the element from generative individ-uals (g1–g3 ontogenetic states) of particular forest
354 S.I. Chumachenko et al. / Ecological Modelling 170 (2003) 345–361
tree species and (2) on the presence of suitable lightconditions for seedling development. This submodelis also responsible for modelling of possibility forsprouting reproduction of each cohort. Due to differ-ent growth rate and ontogeny duration and because ofdifference between growth tables for stands developedfrom sprouts and seedlings all calculations for themare performed separately.
After each step of the model ‘Natural Development’the modelling element contains characteristics ofspecies and age composition and its biometric param-eters. For each forest tree species the following pa-rameters are calculated: number of stems, age and on-togenetic state, mean tree height and height of crownattachment, average stem diameter and crown shape,the achieved stand quality index. In addition, grow-ing stock and stand density are estimated. These dataserve as the basis for the performance of the model‘Exogenous Influence’ and programs of the serviceblock.
2.3. Model ‘Exogenous Influence’
Model ‘Exogenous Influence’ supplements thecomputer program package FORRUS-S by the possi-bilities of solving various applied tasks, e.g. modellingof different variants of cleaning cutting, sylviculturalactivities, forest fires, etc. This model consists ofsubmodels ‘Final Felling’, ‘Cleaning Cutting’ and‘Sylvicultural Activities’ that process output datafrom the model ‘Natural Development’. All program-ming algorithms of these submodels are based on theregulations for sylvicultural activities officially rec-ommended for European part of the Russian Federa-tion. Model ‘Exogenous Influence’ can be switchedon and off at any step of FORRUS-S operation. Adetailed description of this model is beyond the scopeof this paper.
2.4. Accessory programs
A set of accessory programs is designed to supportthe execution of models comprising the core modelsof FORRUS-S and to provide additional possibilitiesof data processing and analysis. A special computerprogram performs re-coding of input forest taxationinformation to internal format of the model. This op-eration is executed every time when processing of a
new modelling object is being started. Another mod-ule transforms output data from the model ‘NaturalDevelopment’ into input format of the model ‘Exoge-nous Influence’. Besides, data for various analyses andvisualization of the modelling results are also trans-formed in a special way. This is necessary for analy-sis of the modelling results and the obtained forecastsas well as for presentation of the results in the formtraditional for forestry practice. This aspect is espe-cially important if the model is used for decision mak-ing. All spatial information of the program packageFORRUS-S is prepared, transformed and visualized bythe geoinformation system TopoL (TopoL Software,1998).
3. Model testing, verification and validation
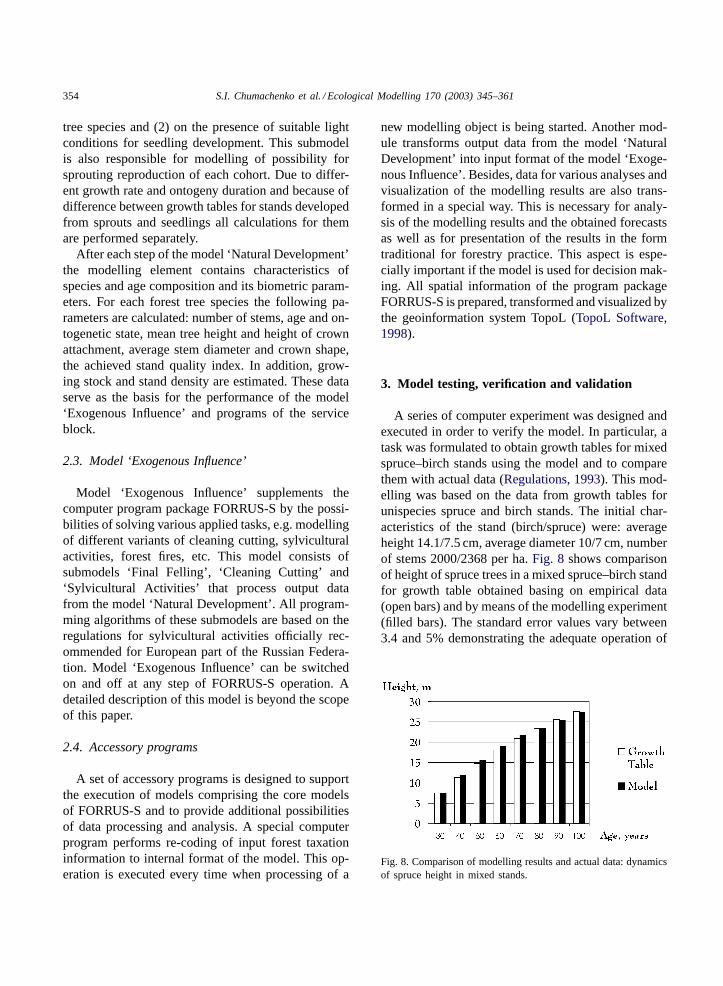
A series of computer experiment was designed andexecuted in order to verify the model. In particular, atask was formulated to obtain growth tables for mixedspruce–birch stands using the model and to comparethem with actual data (Regulations, 1993). This mod-elling was based on the data from growth tables forunispecies spruce and birch stands. The initial char-acteristics of the stand (birch/spruce) were: averageheight 14.1/7.5 cm, average diameter 10/7 cm, numberof stems 2000/2368 per ha.Fig. 8 shows comparisonof height of spruce trees in a mixed spruce–birch standfor growth table obtained basing on empirical data(open bars) and by means of the modelling experiment(filled bars). The standard error values vary between3.4 and 5% demonstrating the adequate operation of
Fig. 8. Comparison of modelling results and actual data: dynamicsof spruce height in mixed stands.
S.I. Chumachenko et al. / Ecological Modelling 170 (2003) 345–361 355
the forecasting package when modelling mixed for-est dynamics. In the same experiment, similar resultswere obtained for other stand characteristics includingsum of cross-section areas for each species.
4. Application of the model
The computer experiments were carried out us-ing sample data of Experimental Forestry ‘RusskiiLes’, located south of Moscow region in theconiferous–broad-leaved forest zone. The duration ofvegetation period is 170–180 days, average precip-itation 491 mm. Soils consists of sod-podsolic soils(93.7%), Gary forest soils (3.4%), other are wet-lands. Soil drainage is generally poor and well, soiltexture is mostly loamy and sandy. The total area ofthe FMU is 69,200 ha, forested area is 63,800 ha. Inaverage, the stand is composed of: 50% birch,BetulapendulaRoth andBetula pubescensEhrh., 20% Nor-way spruce,Picea abies(L.) Karst, 10% Scots pine,Pinus sylvestrisL., 7% aspen,Populus tremulaL.with small proportion of oak,Quercus roburL. andsmall-leaved lime,Tilia cordata Mill. Average age is53 years, the stand density is high (0.73 in Russianscale from 0 to 1.0), average stand quality index is1.4, annual increment makes 4.0 m3 ha−1.
The territory of ‘Russkii Les’ forestry has been sub-jected to severe anthropogenic impact (ploughing up,fires, repeated cutting). At present time, zonal-typeforests are absent from the area of the experimen-tal forestry. The Dankovskii district of ‘Russkii Les’forestry with area cf. 7351 ha was chosen as a mod-elling object.
The modelling was carried out at the following sce-narios of forest management: (1) ‘Protective’: natu-ral development with formation of uneven-aged mul-tispecies stands; (2) ‘Legal practice’: complete cyclesof sylvicultural measures according to the current reg-ulations and specifications of Russian Forest Service;(3) ‘Illegal practice’: forest management with infringe-ment of the current specifications, heavy upper thin-ning and removing the best trees, clear cutting withdestroying natural regeneration with no planting. Al-gorithm of cleaning cutting simulation is describedthoroughly inKorotkov et al. (2001).
The comparative analysis of changes of forest fundparameters (distribution of the stand area by predom-
inant tree species, forest stock of basic forest trees,volume of intermediate using) is given according todifferent scenarios of modelling.
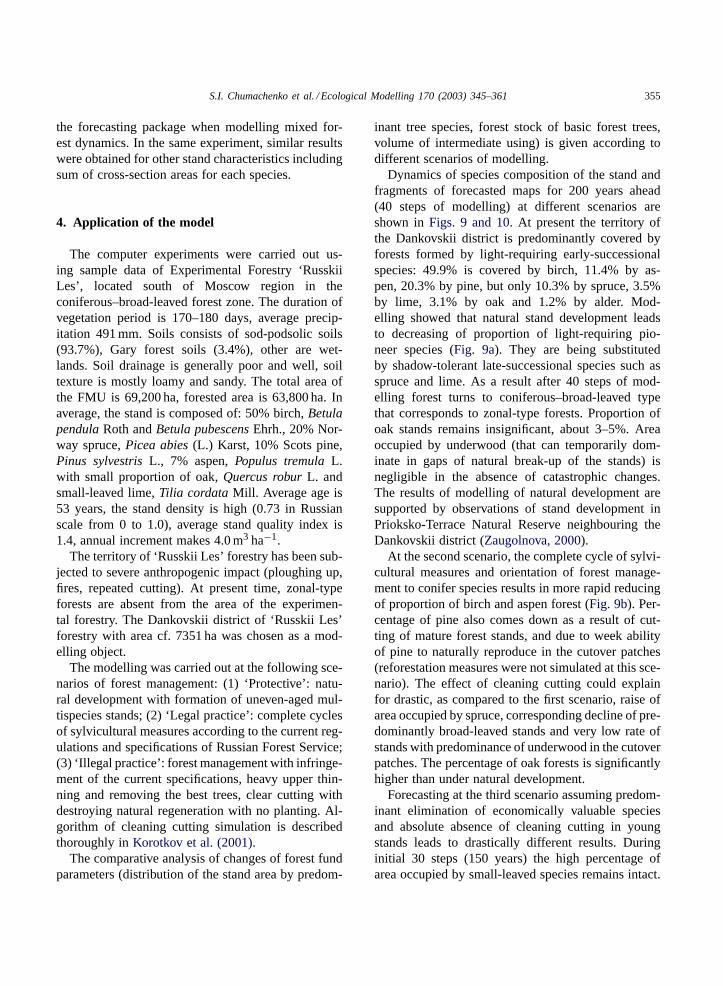
Dynamics of species composition of the stand andfragments of forecasted maps for 200 years ahead(40 steps of modelling) at different scenarios areshown inFigs. 9 and 10. At present the territory ofthe Dankovskii district is predominantly covered byforests formed by light-requiring early-successionalspecies: 49.9% is covered by birch, 11.4% by as-pen, 20.3% by pine, but only 10.3% by spruce, 3.5%by lime, 3.1% by oak and 1.2% by alder. Mod-elling showed that natural stand development leadsto decreasing of proportion of light-requiring pio-neer species (Fig. 9a). They are being substitutedby shadow-tolerant late-successional species such asspruce and lime. As a result after 40 steps of mod-elling forest turns to coniferous–broad-leaved typethat corresponds to zonal-type forests. Proportion ofoak stands remains insignificant, about 3–5%. Areaoccupied by underwood (that can temporarily dom-inate in gaps of natural break-up of the stands) isnegligible in the absence of catastrophic changes.The results of modelling of natural development aresupported by observations of stand development inPrioksko-Terrace Natural Reserve neighbouring theDankovskii district (Zaugolnova, 2000).
At the second scenario, the complete cycle of sylvi-cultural measures and orientation of forest manage-ment to conifer species results in more rapid reducingof proportion of birch and aspen forest (Fig. 9b). Per-centage of pine also comes down as a result of cut-ting of mature forest stands, and due to week abilityof pine to naturally reproduce in the cutover patches(reforestation measures were not simulated at this sce-nario). The effect of cleaning cutting could explainfor drastic, as compared to the first scenario, raise ofarea occupied by spruce, corresponding decline of pre-dominantly broad-leaved stands and very low rate ofstands with predominance of underwood in the cutoverpatches. The percentage of oak forests is significantlyhigher than under natural development.
Forecasting at the third scenario assuming predom-inant elimination of economically valuable speciesand absolute absence of cleaning cutting in youngstands leads to drastically different results. Duringinitial 30 steps (150 years) the high percentage ofarea occupied by small-leaved species remains intact.
356 S.I. Chumachenko et al. / Ecological Modelling 170 (2003) 345–361
Fig. 9. Modelling results after 40 modelling steps, the forecast of species composition (area occupied by predominant species) for Dankovskiidistrict at different modelling scenarios: (a) ‘Protective’; (b) ‘Legal practice’; (c) ‘Illegal practice’. Species: 1, pine; 2, spruce; 3, oak; 4,lime; 5, birch+ aspen+ alder; 6, underwood (hazel, rowan).
Later on, there occurs increase of area with predom-inance of small-leaved trees and shrubs, especiallyhazel. The underwood development hampers regenera-tion of small-leaved hardwoods that results to decreaseof area occupied by this group of species between 34and 40 steps of modelling. Area predominantly oc-cupied by spruce remains at steadily low level dur-ing the whole period of modelling at first and secondscenarios. Proportion of pine stands reduces exclu-sively fast reaching minimal values already at 18 stepsof modelling (in 90 years). As far as predominantlybroad-leaved stands are concerned, starting with 20thstep of modelling (after 100 years) these species havebeen gradually increasing their areas. However, thesestands are formed by sprouting and represent forests oflittle economic value. Thus, forest management cou-
pled with infringement of federal regulations results inexpansion of inferior stands, i.e. to gradual depletionof forest resources.
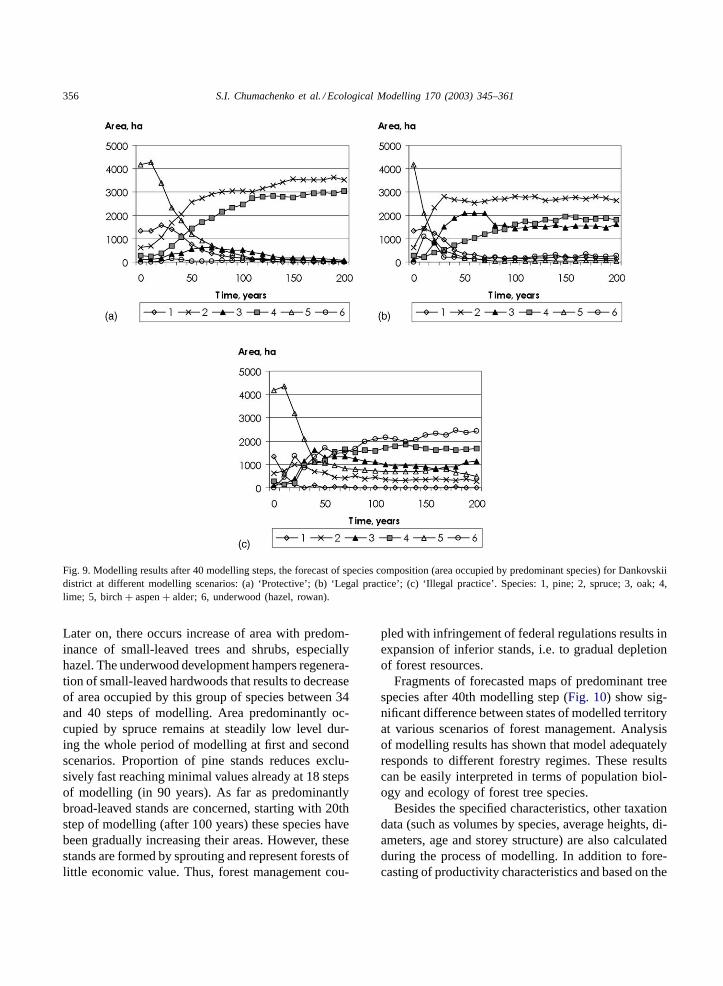
Fragments of forecasted maps of predominant treespecies after 40th modelling step (Fig. 10) show sig-nificant difference between states of modelled territoryat various scenarios of forest management. Analysisof modelling results has shown that model adequatelyresponds to different forestry regimes. These resultscan be easily interpreted in terms of population biol-ogy and ecology of forest tree species.
Besides the specified characteristics, other taxationdata (such as volumes by species, average heights, di-ameters, age and storey structure) are also calculatedduring the process of modelling. In addition to fore-casting of productivity characteristics and based on the
S.I. Chumachenko et al. / Ecological Modelling 170 (2003) 345–361 357
Fig. 10. Modelling results, fragments of forecasted maps: (a) current state of tree stands; (b–d) forecast for 200 years at different scenarios:(b) ‘Protective’; (c) ‘Legal practice’; (d) ‘Illegal practice’. Species: 1. pine; 2, spruce; 3, oak; 4, lime; 5, birch+aspen+alder; 6, underwood(hazel, rowan).
same data, values of ecological parameters of standswere estimated at each step.Fig. 11represents the levelof species biodiversity of forest ecosystems estimateddepending on the scenario of forest management (seePalenova et al., 2001for more details).
5. Discussion
Interference between elements of mosaic-storeycommunity structure and the dynamics of forest treepopulations appear as local changes in competitionrelationships. Horizontal mosaic of storeys leads tolocal competition for light between different cohortsin the windows. Side shadow projection formed bycohorts of adult trees is spread over the distance ofup to two tree heights (Alekseev, 1975), while ab-sorption of moisture and minerals is limited by the
space of rhizosphere. This results in the fact that lightregime of the stands has more pronounced effect tocompetition relationships that other factors have.
Thus, modelling of forest stand dynamics requiresspatial environment to be taken into account whenlight conditions of the modelling element are to becalculated. To examine this problem, two series of ex-periments were designed. In the first series, the modelwas adjusted to static sun position in zenith. Fixedposition of the light source is analogous to that ac-cepted in modelling of luminous flux in Gap-models(Botkin, 1993; Botkin et al., 1972; Leemans andPrentice, 1989; Pacala et al., 1995; Shugart, 1984,1992; Urban et al., 1991). In Gap-models competitionwithin a gap (‘window’ in forest canopy) is supposedto be higher than competition among gaps. Each gap,therefore, is considered independently of its neigh-bours, and spatial structure of the stand is not taken

358 S.I. Chumachenko et al. / Ecological Modelling 170 (2003) 345–361
Fig. 11. Modelling results, distribution of number of taxation sites with different number of species per site for Dankovskii district atvarious forest management scenarios (after 40th step).
into account. Results from each gap are extrapolatedonto the whole stand.
In the second series of experiments the describedabove algorithm of daily sun movement through thesky is applied. The model utilizes information of il-lumination intensity in different time of a day; bothdirect and scattered radiations are taken into consider-ation as well as the influence of the surrounding treeson the light conditions of forest cultures.
Let us consider a uniform part of forest (taxationsite) with 40-year-old oak stand derived from sproutsof average height 16.6 m. The task is formulated tomake a forecast of development of oak cultures plantedon a cutover patch within this stand. Gap felling of dif-ferent size and stripped-coupe felling of various widthare modelled.
In the first series of modelling all the studied com-binations of felling types lead to the same result: oakcultures develop according to the given stand qual-ity index, in this case equal to 1. Sixty years old oakcultures reached height of 22.1 m while sprouted oakgrew up to 26 m. This, in this modelling series, inspite of substantial dominance of the surrounding for-
est stand, the development of cultures is not delayed.This fact can be explained by position of the sun ontop, and therefore, shadowing from the really existingsurrounding trees did not affect the dynamics of tax-ation characteristics of the stand.
Results from the second series were substantiallydifferent. When the sun movement is modelled, themodel takes into account the shadowing from the sur-roundings. For instance, with gap cutting covering area270 m2 oak cultures reached only 15 m height to theage of 60 years, i.e. lower than in the first series by7.1 m or 48% (Table 1).
Table 1Modelling results, average height values for 60-year-old oak standat gap felling of different size
Gap felling
Size 1× 1element
3 × 3elements
5 × 5elements
GAP-models (m) 22.1 22.1 22.1Our model (m) 15 17.1 19.9
Discrepancy 7.1 (48%) 5 (29%) 2.2 (11%)

S.I. Chumachenko et al. / Ecological Modelling 170 (2003) 345–361 359
Fig. 12. Modelling results, forecast of height distribution (vertical axis, meters) for 60-year-old oak trees at the size of gap felling equalto 5× 5 modelling elements in 100-year-old oak forest.
A series of modelling experiments was carried outwith different sizes of gap cuttings (270–2500 m2) andstripped-coupe fellings of various width (16–80 m)and direction (N–S versus W–E). With increase of thecutting area size the difference between compared se-ries of experiments are decreasing (Table 1). Here wediscuss average deviation, because light conditions areunequal in different parts of the cutting area due toboth shadowing by forest surrounding the cultures anda self-shadowing. For example, according to the re-sults of the second series, individual oak trees reachedmaximal height in the central and northern parts ofthe cutting area while the lowest height was observedin southeast and southwest parts. Taken gap fellingsize equal to 5× 5 modelling elements (Fig. 12) thedifference between maximal and minimal height ofindividuals for 60-year-old oak stand growing within100-year-old oak forest was 6.1 m (22.1 and 16 m, cor-respondingly). When the model simulates cutting bynarrow stripes the difference among series was mainlydependent on width of the cutting area rather than onits orientation (Table 2).
The conducted experiments allow us to concludethat the field of applicability of Gap-model is limited toforecasting of large scale forest stand dynamics under
Table 2Modelling results, average height values for 60-year-old oak standat stripped-coupe felling of different width
Stripped-coupe felling
Width 1 element 3 elements 5 elements
GAP-models (m) 22.1 22.1 22.1Our model (m) 16.2 19.6 20.3
Discrepancy 5.9 (36%) 2.5 (13%) 1.8 (9%)
the influence of global environmental changes. Fore-casting of dynamics of particular forest stands undervarious sylvicultural measures (first of all cleaning cut-tings, and final felling with narrow cutting areas) re-quires taking into account spatial structure of the stand.
6. Conclusion
The presented program package FORRUS-S hasan open structure, i.e. it allows adding various sup-plemental target modules. Using these modules themodel will make possible to simulate action of dif-ferent catastrophic factors (fires, windfalls, etc.) and

360 S.I. Chumachenko et al. / Ecological Modelling 170 (2003) 345–361
sylvicultural activities (final felling of various config-uration, cleaning cutting, reforestation, etc.). Targetmodules can be switched on and off at each step of themodel functioning. They aid to substantially broadenthe area of the model applicability by involvement ofadditional scenarios of timber management. For in-stance, by changing a map of PSQI one can modelthe influence of environmental pollution, flooding, soilerosion, amelioration, etc. By changing parameters ofreference databases, in particular, for growth tables, itis possible to model the influence of climatic changesonto forest stands.
Comparative analysis of prognostic databases ob-tained to use with different scenarios will help not onlyto forecast production characteristics of forest ecosys-tems. It will also facilitate both evaluation of diversityof population behaviour of individual species and dy-namics of biodiversity level of forest ecosystems onthe modelled territory. Modelling at different forestryscenarios and analytic possibilities of accessory pro-grams make the presented program package a usefultool addressed to both researchers and forest man-agers. We believe that FORRUS-S will be helpful inassessment of efficiency of various planned sylvicul-tural measures and timber management, in evaluationof their potential impact onto forest improvement andsustainable management of forest resources.
Acknowledgements
The authors are greatful to Olga V. Smirnova, DmitriA. Starostenko, Yuri V. Nesterenko, Yulia G. Lebe-deva, Elena V. Zubkova, Svetlana I. Ripa, Alex S. Ko-marov and Oleg G. Chertov for their valuable assis-tance at different stages of the study execution. Direc-tor Ivan B. Khazinov and specialists of ExperimentalForestry ‘Russian Forest’ provided necessary forestinventory information for the model testing and com-putation experiments.
The research is supported by INTAS, Project 9730255, FORMOD and project 01 0633 SILVICS.
References
Alekseev, V.A., 1975. Forest Light Regime. Nauka, Moscow, 228pp. (in Russian).
Berger, U., Hildenbrandt, H., 2000. A new approach to spatiallyexplicit modeling of forest dynamics: spacing, ageing andneighbourhood competition of mangrove trees. Ecol. Model.132, 287–302.
Botkin, D.B., 1993. Forest Dynamics: An Ecological Model.Oxford University Press, Oxford, New York, 310 pp.
Botkin, D.B., Janack, J.F., Wallis, J.R., 1972. Some ecologicalconsequence of a computer model of forest growth. J. Ecol.60, 849–872.
Chumachenko, S.I., 1993. Basic model of dynamics ofmultispecies uneven-aged forest coenosis. In: Problems ofEcology and Modelling of Forest Ecosystems. Transactions ofMoscow Forestry Institute. Moscow Forest Institute, Moscow,pp. 147–180 (in Russian).
Chumachenko, S.I., 1998. The modelling of dynamic of all-agedmultispecies forest coenoses. Zhurnal Obshchei Biologii 59,363–376 (in Russian).
Chumachenko, S.I., Syssouev, V.V., Palyonova, M.M., Bredikhin,M.A., Korotkov, V.N., 1997. Simulation of stand dynamics withaccount of forestry impacts. In: Sustainable Development ofBoreal Forests. Proceedings of the Seventh Annual Conferenceof the IBFRA, August 19–23, 1996, St. Petersburg. ARICFR,Moscow, pp. 177–184.
Chumachenko, S.I., Syssouev, V.V., Palyonova, M.M., Bredikhin,M.A., Korotkov, V.N., 2000. Simulation of heterogeneousuneven-aged stands dynamics under human-induced distur-bance. In: Disturbance in Boreal Forest Ecosystems: HumanImpacts and Natural Processes. Proceedings of the InternationalBoreal Forest Research Association 1997 Annual Meeting,August 4–7, 1997, Duluth, Minnesota, USA. Gen. Tech. Rep.NC-209. U.S. Department of Agriculture, Forest Service, NorthCentral Station, St. Paul, MN, pp. 104–112.
Evstigneev, O.I., 1991. The attitude of deciduous trees to light.Biologicheskie Nauki 8, 20–29 (in Russian).
Evstigneev, O.I., 1996. Relation of deciduous trees to light andwater supply depending on forest structure. Lesovedenie 6, 26–35 (in Russian).
Gatsuk, L.E., Smirnova, O.V., Vorontzova, L.I., Zaugolnova, L.B.,Zhukova, L.A., 1980. Age states of plants of various growthforms: a review. J. Ecol. 68, 675–696.
Korotkov, V.N., Palenova, M.M., Chumachenko, S.I., 2001.Forecasting dynamics of taxation characteristics of forest standsat different scenarios of forest management: development ofsylvicultural activity algorithms. In: Ecology, Monitoring andSustainable Nature Management. Federal Program ‘Integration’Research Papers. Moscow Forest State University, Moscow,pp. 146–163 (in Russian).
Kozlovski, M.D., Pawlov, V.M., 1967. Yield Tables of MainForest Species. Lesnaya Promyshlennost, Moscow, 540 pp. (inRussian).
Leemans, R., Prentice, F., 1989. FORSKA: A General ForestSuccession Model. Uppsala, 60 pp.
Nosova, L.M., Frantsuzov, A.V., Chumachenko, S.I., 1995.Modelling of stand biomass structure of forest ecosystems.In: Problems of Monitoring and Modelling Forest EcosystemDynamics. Ecos-Inform, Moscow, pp. 244–251 (in Russian).

S.I. Chumachenko et al. / Ecological Modelling 170 (2003) 345–361 361
Pacala, S.W., Canham, C.D., Silander, J.A., Kobe, J.R.K., 1995.Sapling growth as a function of resources in a north temperateforest. Can. J. For. Res. 24, 2172–2183.
Palenova, M.M., Korotkov, V.N., Chumachenko, S.I., 2001.Forecasting dynamics of taxation characteristics of foreststands at different scenarios of forest management: assessmentof biodiversity and ecological characteristics of forestfund. In: Ecology, Monitoring and Sustainable NatureManagement. Federal Program ‘Integration’ Research Papers.Moscow Forest State University, Moscow, pp. 164–174 (inRussian).
Pijl, L., 1982. Principles of Dispersal in Higher Plants. Springer,Berlin, 215 pp.
Pogrebnyak, P.S., 1968. General Forestry. Kolos, Moscow, 440pp. (in Russian).
Popadyuk, R.V., Chumachenko, S.I., 1991. Simulation bio-ecological model of the development of multispecies uneven-aged stand. Biologicheskie Nauki 8, 67–78 (in Russian).
Popadyuk, R.V., Smirnova, O.V., Chumachenko, S.I., 1995. CurrentState of Broad-Leaved Forests in Russia, Belorussia, Ukraine:Historical Development, Biodiversity, Structure and Dynamics.Russian Academy of Sciences, Pushchino Research Center,Pushchino, 74 pp.
Rabotnov, T.A., 1978. On coenopopulation of plants reproducingby seeds. In: Structure and Functioning of Plant Population.Amsterdam, pp. 1–26.
Radiation characteristics of atmosphere and Earth surface, 1969.Gidrometeoizdat, Leningrad, 564 pp. (in Russian).
Regulations for Forest Taxation of Central and Southern Regionsof European Part of Russian Federation (a reference book).Lesnaya Promyshlennost, Moscow, 420 pp.
Ridley, H.N., 1930. The Dispersal of Plants Throughout the World.L. Reeve & Co, London, 744 pp.
Shirley, H.L., 1945. Light as an ecological factor and itsmeasurement. Bot. Rev. 11.
Shugart, H.H., 1984. A Theory of Forest Dynamics. The EcologyImplications of Forest Succession Models. Springer, Berlin, 278pp.
Shugart, H.H., 1992. System Analysis of the Boreal Forests.Springer, Berlin, 265 pp.
Smirnova, O.V. (Ed.), 1994. East-European Broad-leaved Forests.Nauka, Moscow, 363 pp. (in Russian).
Smirnova, O.V., Chistyakova, A.A., Popadyuk, R.V., Evstigneev,O.I., Korotkov, V.N., Mitrofanova, M.V., 1990. PopulationOrganization of Vegetation Cover of Forest Territories. RussianAcademy of Sciences, Pushchino Research Center, Pushchino,92 pp. (in Russian).
TopoL Software s.r.o., 1998. TOPOL. 5.001. TopoL Software s.r.o.,Prague, Czech Republic.
Tsel’niker, Y.L., 1978. Physiological Bases of Shade Tolerance ofWoody Plants. Nauka, Moscow, 212 pp. (in Russian).
Udra, I.F., 1988. Dispersal of Plants and the Issues of Paleo- andBiogeography. Naukova Dumka, Kiev, 197 pp. (in Russian).
Udra, I.F., 1990. Dispersal and Migrations of Arboreal Plants in theTemperate Zone of Eurasia. Synopsis of Doctoral (BiologicalSciences) Thesis. Central Botanical Garden, Russian Academyof Sciences, Moscow, 38 pp. (in Russian).
Urban, D.L., Bonan, G.B., Smith, T.M., Shugart, H.H., 1991.Spatial applications of gap models. For. Ecol. Manag. 52, 95–110.
Zaugolnova, L.B. (Ed.), 2000. Estimation and Conservation ofForest Cover Biodiversity in Natural Reserves of the EuropeanRussia. Nauchnyi Mir, Moscow, 196 pp. (in Russian).
Zaugol’nova, L.B., Zhukova, L.A., Komarov, A.S., Smirnova, O.V.,1988. Coenopopulation of Plants: Essays on Population Biology.Nauka, Moscow, 183 pp. (in Russian).
Related Documents