1 Simulation and testing of adaptive FRP- substructures for automotive safety Gregor Gstrein Vehicle Safety Institute – Graz University of Technology Austria Christian Kurzböck Virtual Vehicle Research Center Austria Jan-Mark Opelka Daimler AG Germany Jan Krollmann Institute of Carbon Composites – Technische Universität München Germany Paper Number 15-0068 ABSTRACT This paper describes the development of a basic finite element simulation model of a concept for an adaptive structure made with carbon fiber reinforced plastic materials. Thereby in particular the prediction of the mechanical properties of necessary deformation zones in the structure, that are realized with an elastomer matrix system, is challenging due to the different properties of this material compared to conventional composites. Available material models in the FE-Code LS-DYNA are analyzed for their usability in this task. For the parameterization of the material models a number of coupon tests are conducted and the deviations between the material with the elastomer matrix and the material with the conventional duromer matrix system is analyzed. The results of these tests is used to validate the material models for both, the material used in the expansion zone and the conventional composite material in the rest of the structure. It is shown, that the prediction of the shear properties of the elastomer based material creates difficulties with the used material model (MAT_54) but in total the correlation between test and simulation is good and comparable for both materials. The first task that has to be approved for an adaptive structure made of FRP-materials is the expansion-process from the initial to the pressurized final geometry. For this purpose a quasistatic inflation test is performed. The results of the test and a corresponding simulation correlate well for the pressure at which the expansion of the structure begins. Regarding the maximum burst pressure and the location of the material failure deviations between test and simulation occur. Possible reasons for this deviations are analyzed and discussed. Finally the additional necessary steps in the creation of a predictive simulation model for an adaptive FRP structure under crash-load and possible approaches for the latter are discussed. INTRODUCTION Currently the automotive industry is highly demanding simulation models that are able to predict and optimise the crash behaviour of mass produced Fibre Reinforced Polymer (FRP) composite structures, which will be increasingly used in vehicles in the future. The ability to investigate crashworthiness of FRP vehicle structures by numerical simulation is very important for these lightweight materials to see widespread use in future cars. In this paper, the current status of the development of simulation models for shape-adaptive FRP-Structures, as shown in (1), is described. It is analysed if state-of-the-art modelling-approaches and existing material models can be used, or if novel developments are necessary to predict the mechanical properties and behaviour of such components. The process of the parameterization of a material model, including the conduction of material tests as well as the validation of the models, is described. MOTIVATION Shape-adaptive FRP-Structures address the demand for lightweight vehicles structures as well as the need for reduced injury-risk of car occupants. The potential benefits of those two topics are summarized in the following:

Welcome message from author
This document is posted to help you gain knowledge. Please leave a comment to let me know what you think about it! Share it to your friends and learn new things together.
Transcript

1
Simulation and testing of adaptive FRP-substructures for automotive safety
Gregor GstreinVehicle Safety Institute – Graz University of TechnologyAustria
Christian KurzböckVirtual Vehicle Research CenterAustria
Jan-Mark OpelkaDaimler AGGermany
Jan KrollmannInstitute of Carbon Composites – Technische Universität MünchenGermany
Paper Number 15-0068
ABSTRACT
This paper describes the development of a basic finite element simulation model of a concept for an adaptivestructure made with carbon fiber reinforced plastic materials. Thereby in particular the prediction of themechanical properties of necessary deformation zones in the structure, that are realized with an elastomer matrixsystem, is challenging due to the different properties of this material compared to conventional composites.Available material models in the FE-Code LS-DYNA are analyzed for their usability in this task. For theparameterization of the material models a number of coupon tests are conducted and the deviations between thematerial with the elastomer matrix and the material with the conventional duromer matrix system is analyzed. Theresults of these tests is used to validate the material models for both, the material used in the expansion zone andthe conventional composite material in the rest of the structure. It is shown, that the prediction of the shearproperties of the elastomer based material creates difficulties with the used material model (MAT_54) but in totalthe correlation between test and simulation is good and comparable for both materials.The first task that has to be approved for an adaptive structure made of FRP-materials is the expansion-processfrom the initial to the pressurized final geometry. For this purpose a quasistatic inflation test is performed. Theresults of the test and a corresponding simulation correlate well for the pressure at which the expansion of thestructure begins. Regarding the maximum burst pressure and the location of the material failure deviationsbetween test and simulation occur. Possible reasons for this deviations are analyzed and discussed.Finally the additional necessary steps in the creation of a predictive simulation model for an adaptive FRP structureunder crash-load and possible approaches for the latter are discussed.
INTRODUCTION
Currently the automotive industry is highly demanding simulation models that are able to predict and optimisethe crash behaviour of mass produced Fibre Reinforced Polymer (FRP) composite structures, which will beincreasingly used in vehicles in the future. The ability to investigate crashworthiness of FRP vehicle structures bynumerical simulation is very important for these lightweight materials to see widespread use in future cars.In this paper, the current status of the development of simulation models for shape-adaptive FRP-Structures, asshown in (1), is described. It is analysed if state-of-the-art modelling-approaches and existing material models canbe used, or if novel developments are necessary to predict the mechanical properties and behaviour of suchcomponents. The process of the parameterization of a material model, including the conduction of material testsas well as the validation of the models, is described.
MOTIVATION
Shape-adaptive FRP-Structures address the demand for lightweight vehicles structures as well as the need forreduced injury-risk of car occupants. The potential benefits of those two topics are summarized in the following:
2
Use of FRP-Materials in automotive application
The increasing demand on reduced emissions, lower fuel consumption and higher safety in the automotiveindustry requires not only a development of alternatively powered vehicles, but also consistent lightweight design.The use of lightweight materials such as glass or carbon FRP is a possible approach to achieve these goals. Incontrast to metal materials FRP have very high values for specific stiffness and strength. The usage of FRPstructures within new vehicle concepts beneficially leads to a further enhancement of structural safety whilelowering the vehicle’s mass.Compared to metal materials the use of FRP for the Body-in-White (BIW) shows a weight saving potential of upto 60% to 70% (2), (3). This potential has been exploited for many years in motorsport and comes more and moreinto focus for conventional cars. In particular for future alternatively powered vehicles, weight saving is directlylinked to increased range which brings FRP-materials into such cars in greater extent (e.g. BMW i3 (4)).In addition to the weight saving potential FRP also show a very high ratio of energy absorption per weight,compared to metal structures (CFK~ 100kJ/kg vs. Al ~50kJ/kg (5)). This makes it a very interesting material forthe crash-structures in a car. Actual applications can be found predominantly in sports cars (e.g. Mercedes SLR(6)) but as soon as some shortcomings of those materials (e.g. cost, recycling, …) are solved, it is very likely thatthey are applied also in more vehicle types in the future.
Adaptive structures in automotive application
Recently expandable structures, which provide different mechanical properties due to a geometrical adaptivity,have come into focus of vehicle safety development. These structures are principally folded in their undeployedstate to minimize the cross section. Thus these adaptive structures are very compact, which brings benefitsregarding packaging in the vehicle. Due to the fact of cross sectional adaptivity, the structure shows very highpotential concerning weight reduction. Wall thickness can be reduced due to increased stiffness, as a result of theincreased moment of inertia by the expansion of the structure and additionally also due to the pressure within thestructure (7).Adaptive crash structures show potential for further increase of safety and lightweight performance. Differentapproaches with varying design goals and realisations have been discussed in recent publications. The main goalsfor the use of adaptive structures can be summarized as described in (8):
- Increase of deformation length- Increase/decrease of crash load levels- Increase of energy absorption- Weight reduction- Packaging benefits
One alternative approach describes the goal of improving the driver’s vision by use of adaptive A-pillars (9).Adaptive structures made of steel have already been developed by Daimler AG and used in prototype vehiclessuch as the Experimental Safety Vehicle (ESF 2009). For example, by expanding structural components to theouside of the car, additional space for deceleration of impacting objects is created, which leads to a significantreduction of intrusion velocities of the door in case of a side impact (10).
When one tries to combine the above described benefits of FRP material and crash adaptive structures, anelementary question arises: Is it possible to realize a structure that allows for geometrical adaptivity with FRP-materials that are typically very stiff and allow only very low enlongations at failure?One possible concept for a successful realisation of such a solution is described in (1). For a better understandingof the development of a corresponding numerical model, the chosen approach for this structure is summarizedbriefly.
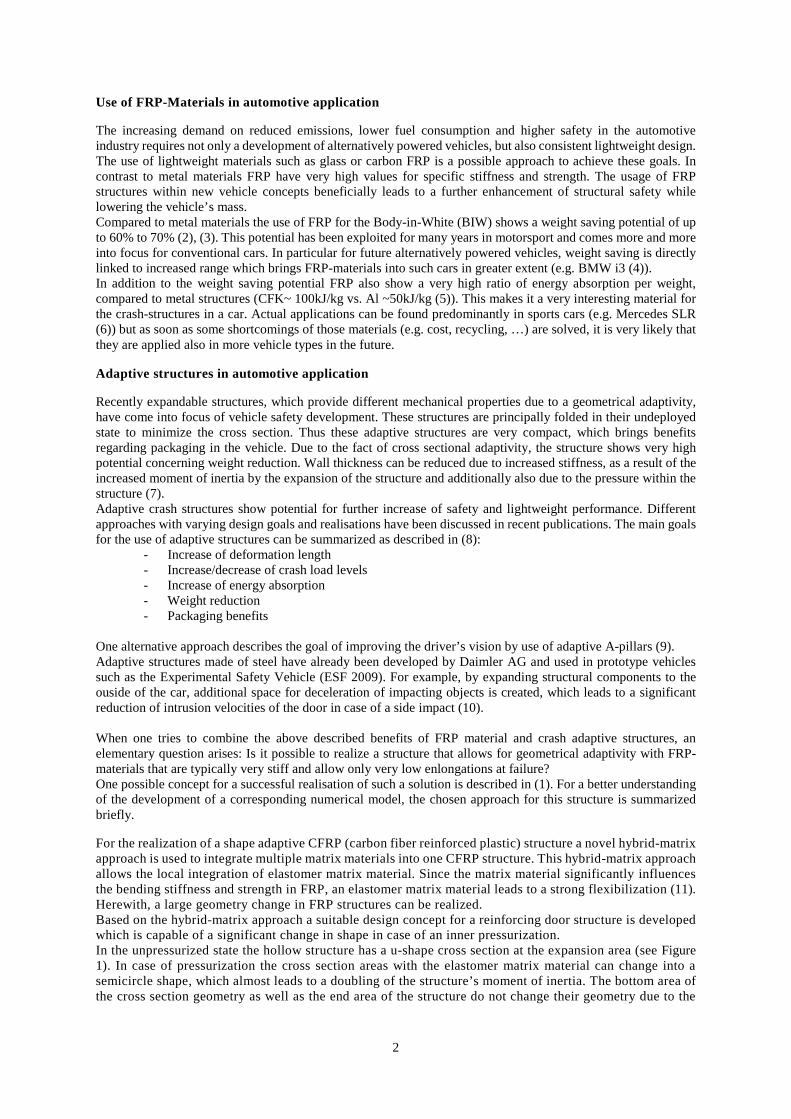
For the realization of a shape adaptive CFRP (carbon fiber reinforced plastic) structure a novel hybrid-matrixapproach is used to integrate multiple matrix materials into one CFRP structure. This hybrid-matrix approachallows the local integration of elastomer matrix material. Since the matrix material significantly influencesthe bending stiffness and strength in FRP, an elastomer matrix material leads to a strong flexibilization (11).Herewith, a large geometry change in FRP structures can be realized.Based on the hybrid-matrix approach a suitable design concept for a reinforcing door structure is developedwhich is capable of a significant change in shape in case of an inner pressurization.In the unpressurized state the hollow structure has a u-shape cross section at the expansion area (see Figure1). In case of pressurization the cross section areas with the elastomer matrix material can change into asemicircle shape, which almost leads to a doubling of the structure’s moment of inertia. The bottom area ofthe cross section geometry as well as the end area of the structure do not change their geometry due to the
3
rigidity of the thermoset matrix material. At the rigid end areas both, the fixation to the door frame and theintegration of the pressurization device can be realized.
Figure 1: Shape adaptive FRP-Structure
This design concept represents the background for the manufacturing of prototypes which are tested regarding theinflation behaviour and their mechanical properties in pressurized and un-pressurized state.The materials in the expansion area of this structure vary considerably to conventional FRP-materials with rigidthermoset resins as matrix materials. In particular the large strains that have to be sustained in the expansion-arearequire tailored material properties.In addition to the proof of concept with prototypes as described above, numerical models of the used materialsare developed and validated with coupon- and component-tests. In this paper the process of the development andvalidation of the material models, that are able to predict the mechanical behavior the adaptive FRP-Structuredescribed in (1) is shown. Prior to that the state-of-the-art modelling techniques as well as the available standardmaterial models are analyzed.
METHODS
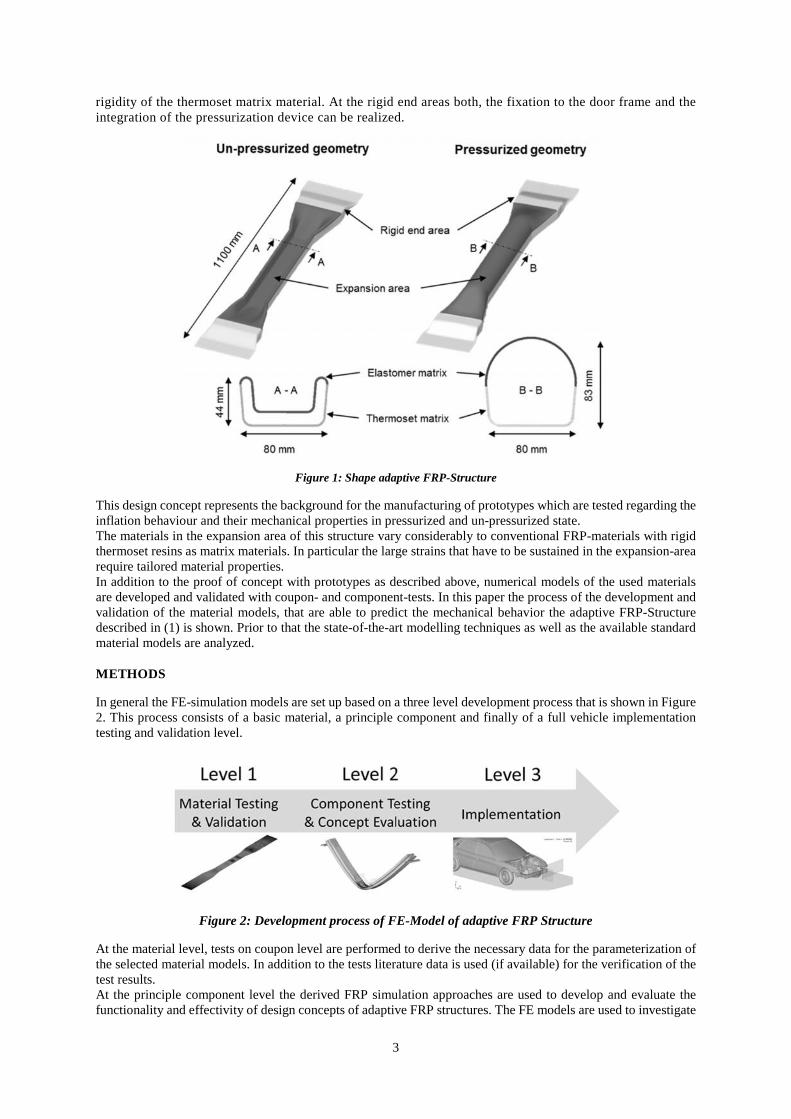
In general the FE-simulation models are set up based on a three level development process that is shown in Figure2. This process consists of a basic material, a principle component and finally of a full vehicle implementationtesting and validation level.
Figure 2: Development process of FE-Model of adaptive FRP Structure
At the material level, tests on coupon level are performed to derive the necessary data for the parameterization ofthe selected material models. In addition to the tests literature data is used (if available) for the verification of thetest results.At the principle component level the derived FRP simulation approaches are used to develop and evaluate thefunctionality and effectivity of design concepts of adaptive FRP structures. The FE models are used to investigate
4
and evaluate the adaptive behaviour of the FRP structure. Therefore all essential influencing parameters to theadaptive structure like, for instance, the use of different materials, wall thickness, FRP lay-up, position of theelastic areas, needed internal pressure for the unfolding process as well as the maximum burst pressure of suchstructures will be investigated in detail. Moreover, the FE simulation will be used to configure the setup for thecomponent tests.Once the second validation step is finished, the designed adaptive structure can be integrated into a full-vehiclesimulation model and its potential regarding weight saving and increase of occupant safety can be assessed.
Beginning with a review of possible modelling techniques and available material models, a first simulationapproach which is capable of predicting the behaviour of the laminate is defined. In order to derive the parametersnecessary for the material models, a series of coupon tests are conducted and for each test a correspondingsimulation model with the adjusted boundary conditions is created. Beginning with literature values andinformation of data-sheets, the material parameters are optimized iteratively to fit the test results as closely aspossible. For this process also optimization tools (LS Opt) are applied.In the following, the used data and the selected numerical tools are described in detail and the results of the firsttwo validation steps are presented.
MATERIAL TESTING AND VALIDATION
Simulation approach for the laminate
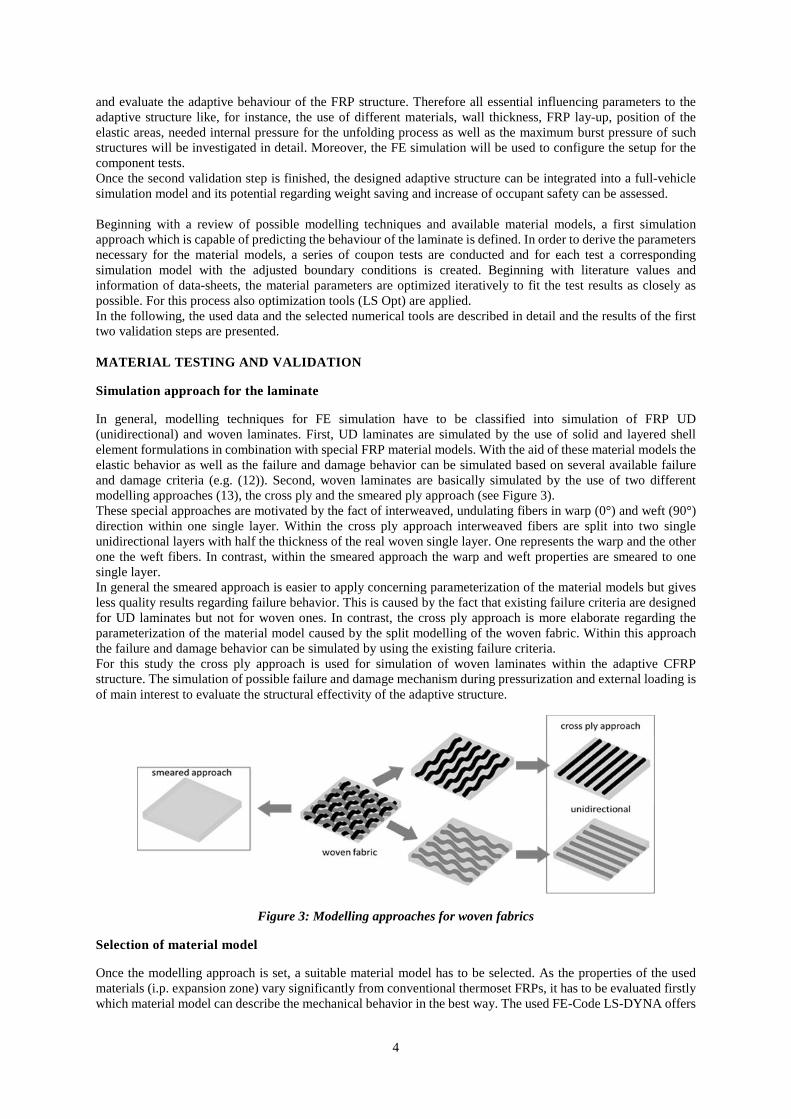
In general, modelling techniques for FE simulation have to be classified into simulation of FRP UD(unidirectional) and woven laminates. First, UD laminates are simulated by the use of solid and layered shellelement formulations in combination with special FRP material models. With the aid of these material models theelastic behavior as well as the failure and damage behavior can be simulated based on several available failureand damage criteria (e.g. (12)). Second, woven laminates are basically simulated by the use of two differentmodelling approaches (13), the cross ply and the smeared ply approach (see Figure 3).These special approaches are motivated by the fact of interweaved, undulating fibers in warp (0°) and weft (90°)direction within one single layer. Within the cross ply approach interweaved fibers are split into two singleunidirectional layers with half the thickness of the real woven single layer. One represents the warp and the otherone the weft fibers. In contrast, within the smeared approach the warp and weft properties are smeared to onesingle layer.In general the smeared approach is easier to apply concerning parameterization of the material models but givesless quality results regarding failure behavior. This is caused by the fact that existing failure criteria are designedfor UD laminates but not for woven ones. In contrast, the cross ply approach is more elaborate regarding theparameterization of the material model caused by the split modelling of the woven fabric. Within this approachthe failure and damage behavior can be simulated by using the existing failure criteria.For this study the cross ply approach is used for simulation of woven laminates within the adaptive CFRPstructure. The simulation of possible failure and damage mechanism during pressurization and external loading isof main interest to evaluate the structural effectivity of the adaptive structure.
Figure 3: Modelling approaches for woven fabrics
Selection of material model
Once the modelling approach is set, a suitable material model has to be selected. As the properties of the usedmaterials (i.p. expansion zone) vary significantly from conventional thermoset FRPs, it has to be evaluated firstlywhich material model can describe the mechanical behavior in the best way. The used FE-Code LS-DYNA offers
5
a large variety of available material models dedicated for the simulation of FRP-materials (14) with differentadvantages and disadvantages (15).With the chosen modelling approach of the laminate comes the need for the definition of material parameters thatdescribe the integral mechanical properties of the FRP-material. A possible first step is to calculate the laminateproperties (e.g. stiffness, strength in principal axis) based on the material properties of fiber, matrix system andthe layup (16). This generally provides a good initial value for the subsequent validation with experimental data.With these determined first material parameters the different available material models of LS-DYNA were filledin, to provide an initial estimation of the usability of the different material models. With the comparably simplemodels: MAT_22, MAT_54 and MAT_58A, already a good correlation can be achieved. For those materialmodels the previous calculation of the mechanical properties provide most of the required input parameters. Fornon-existing input parameters the material card must be completed with literature data and assumptions.The application of more recent material models such as MAT_261 and MAT_262 is currently not considered,because they require very extensive material testing for the determination of the individual input parameters. Forthese material models many assumptions would have been necessary, which would have led to a worsepredictability of the models.
Performed coupon tests
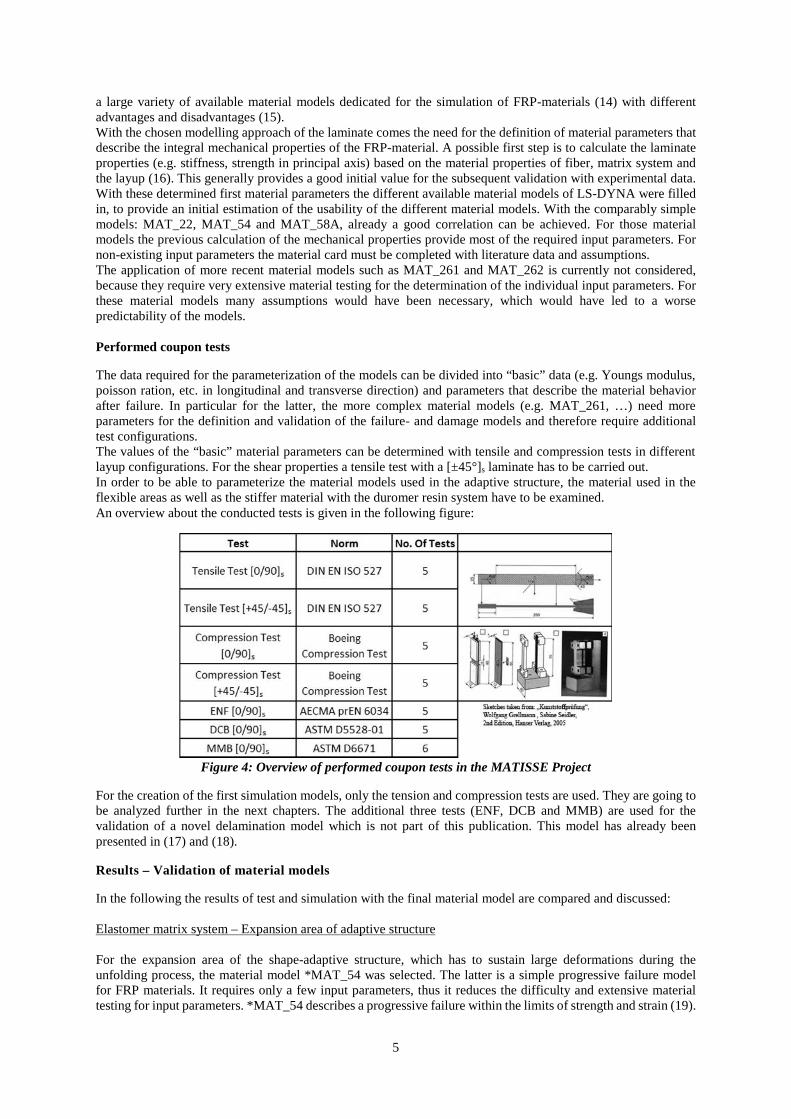
The data required for the parameterization of the models can be divided into “basic” data (e.g. Youngs modulus,poisson ration, etc. in longitudinal and transverse direction) and parameters that describe the material behaviorafter failure. In particular for the latter, the more complex material models (e.g. MAT_261, …) need moreparameters for the definition and validation of the failure- and damage models and therefore require additionaltest configurations.The values of the “basic” material parameters can be determined with tensile and compression tests in differentlayup configurations. For the shear properties a tensile test with a [±45°]s laminate has to be carried out.In order to be able to parameterize the material models used in the adaptive structure, the material used in theflexible areas as well as the stiffer material with the duromer resin system have to be examined.An overview about the conducted tests is given in the following figure:
Figure 4: Overview of performed coupon tests in the MATISSE Project
For the creation of the first simulation models, only the tension and compression tests are used. They are going tobe analyzed further in the next chapters. The additional three tests (ENF, DCB and MMB) are used for thevalidation of a novel delamination model which is not part of this publication. This model has already beenpresented in (17) and (18).
Results – Validation of material models
In the following the results of test and simulation with the final material model are compared and discussed:
Elastomer matrix system – Expansion area of adaptive structure
For the expansion area of the shape-adaptive structure, which has to sustain large deformations during theunfolding process, the material model *MAT_54 was selected. The latter is a simple progressive failure modelfor FRP materials. It requires only a few input parameters, thus it reduces the difficulty and extensive materialtesting for input parameters. *MAT_54 describes a progressive failure within the limits of strength and strain (19).
6
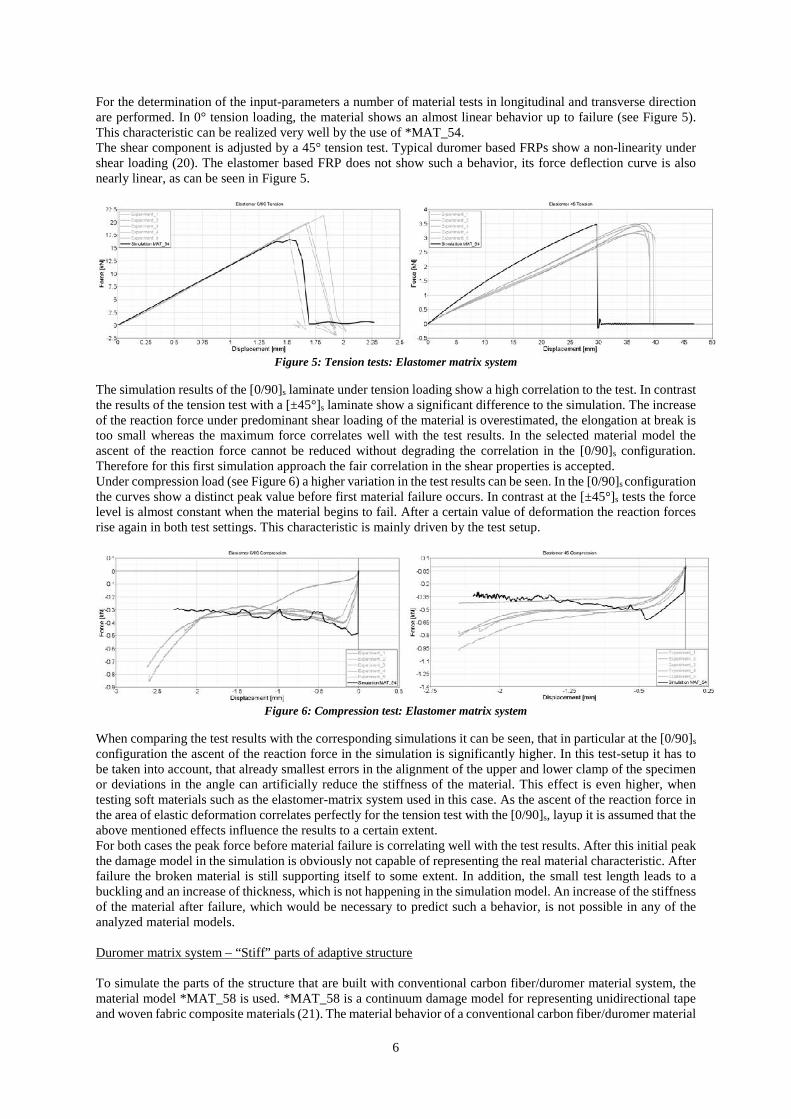
For the determination of the input-parameters a number of material tests in longitudinal and transverse directionare performed. In 0° tension loading, the material shows an almost linear behavior up to failure (see Figure 5).This characteristic can be realized very well by the use of *MAT_54.The shear component is adjusted by a 45° tension test. Typical duromer based FRPs show a non-linearity undershear loading (20). The elastomer based FRP does not show such a behavior, its force deflection curve is alsonearly linear, as can be seen in Figure 5.
Figure 5: Tension tests: Elastomer matrix system
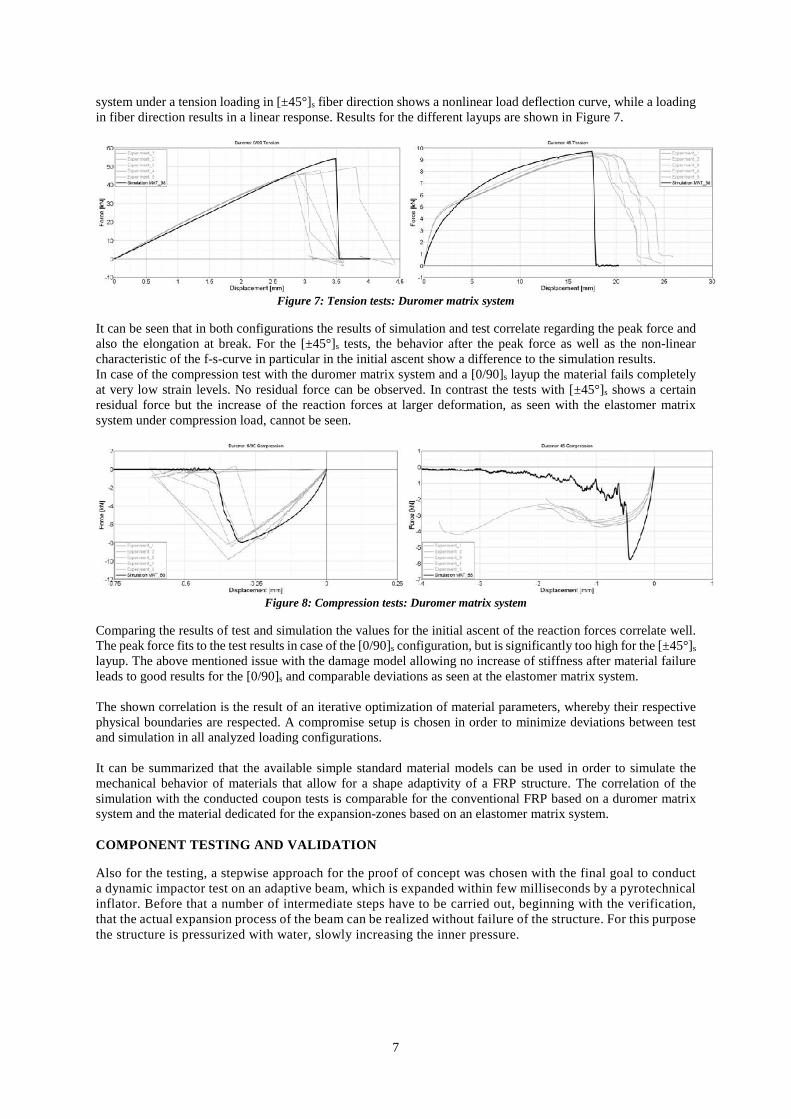
The simulation results of the [0/90]s laminate under tension loading show a high correlation to the test. In contrastthe results of the tension test with a [±45°]s laminate show a significant difference to the simulation. The increaseof the reaction force under predominant shear loading of the material is overestimated, the elongation at break istoo small whereas the maximum force correlates well with the test results. In the selected material model theascent of the reaction force cannot be reduced without degrading the correlation in the [0/90]s configuration.Therefore for this first simulation approach the fair correlation in the shear properties is accepted.Under compression load (see Figure 6) a higher variation in the test results can be seen. In the [0/90]s configurationthe curves show a distinct peak value before first material failure occurs. In contrast at the [±45°]s tests the forcelevel is almost constant when the material begins to fail. After a certain value of deformation the reaction forcesrise again in both test settings. This characteristic is mainly driven by the test setup.
Figure 6: Compression test: Elastomer matrix system
When comparing the test results with the corresponding simulations it can be seen, that in particular at the [0/90]s
configuration the ascent of the reaction force in the simulation is significantly higher. In this test-setup it has tobe taken into account, that already smallest errors in the alignment of the upper and lower clamp of the specimenor deviations in the angle can artificially reduce the stiffness of the material. This effect is even higher, whentesting soft materials such as the elastomer-matrix system used in this case. As the ascent of the reaction force inthe area of elastic deformation correlates perfectly for the tension test with the [0/90]s, layup it is assumed that theabove mentioned effects influence the results to a certain extent.For both cases the peak force before material failure is correlating well with the test results. After this initial peakthe damage model in the simulation is obviously not capable of representing the real material characteristic. Afterfailure the broken material is still supporting itself to some extent. In addition, the small test length leads to abuckling and an increase of thickness, which is not happening in the simulation model. An increase of the stiffnessof the material after failure, which would be necessary to predict such a behavior, is not possible in any of theanalyzed material models.
Duromer matrix system – “Stiff” parts of adaptive structure
To simulate the parts of the structure that are built with conventional carbon fiber/duromer material system, thematerial model *MAT_58 is used. *MAT_58 is a continuum damage model for representing unidirectional tapeand woven fabric composite materials (21). The material behavior of a conventional carbon fiber/duromer material
7
system under a tension loading in [±45°]s fiber direction shows a nonlinear load deflection curve, while a loadingin fiber direction results in a linear response. Results for the different layups are shown in Figure 7.
Figure 7: Tension tests: Duromer matrix system
It can be seen that in both configurations the results of simulation and test correlate regarding the peak force andalso the elongation at break. For the [±45°]s tests, the behavior after the peak force as well as the non-linearcharacteristic of the f-s-curve in particular in the initial ascent show a difference to the simulation results.In case of the compression test with the duromer matrix system and a [0/90]s layup the material fails completelyat very low strain levels. No residual force can be observed. In contrast the tests with [±45°]s shows a certainresidual force but the increase of the reaction forces at larger deformation, as seen with the elastomer matrixsystem under compression load, cannot be seen.
Figure 8: Compression tests: Duromer matrix system
Comparing the results of test and simulation the values for the initial ascent of the reaction forces correlate well.The peak force fits to the test results in case of the [0/90]s configuration, but is significantly too high for the [±45°]s
layup. The above mentioned issue with the damage model allowing no increase of stiffness after material failureleads to good results for the [0/90]s and comparable deviations as seen at the elastomer matrix system.
The shown correlation is the result of an iterative optimization of material parameters, whereby their respectivephysical boundaries are respected. A compromise setup is chosen in order to minimize deviations between testand simulation in all analyzed loading configurations.
It can be summarized that the available simple standard material models can be used in order to simulate themechanical behavior of materials that allow for a shape adaptivity of a FRP structure. The correlation of thesimulation with the conducted coupon tests is comparable for the conventional FRP based on a duromer matrixsystem and the material dedicated for the expansion-zones based on an elastomer matrix system.
COMPONENT TESTING AND VALIDATION
Also for the testing, a stepwise approach for the proof of concept was chosen with the final goal to conducta dynamic impactor test on an adaptive beam, which is expanded within few milliseconds by a pyrotechnicalinflator. Before that a number of intermediate steps have to be carried out, beginning with the verification,that the actual expansion process of the beam can be realized without failure of the structure. For this purposethe structure is pressurized with water, slowly increasing the inner pressure.
8
Inflation-Test of expandable beam with quasistatic pressure
This test also gives some essential information for the validation of a corresponding numerical model:
- Pressure at which the structure begins to unfold- Unfolded beam-geometry- Burst pressure of entire beam
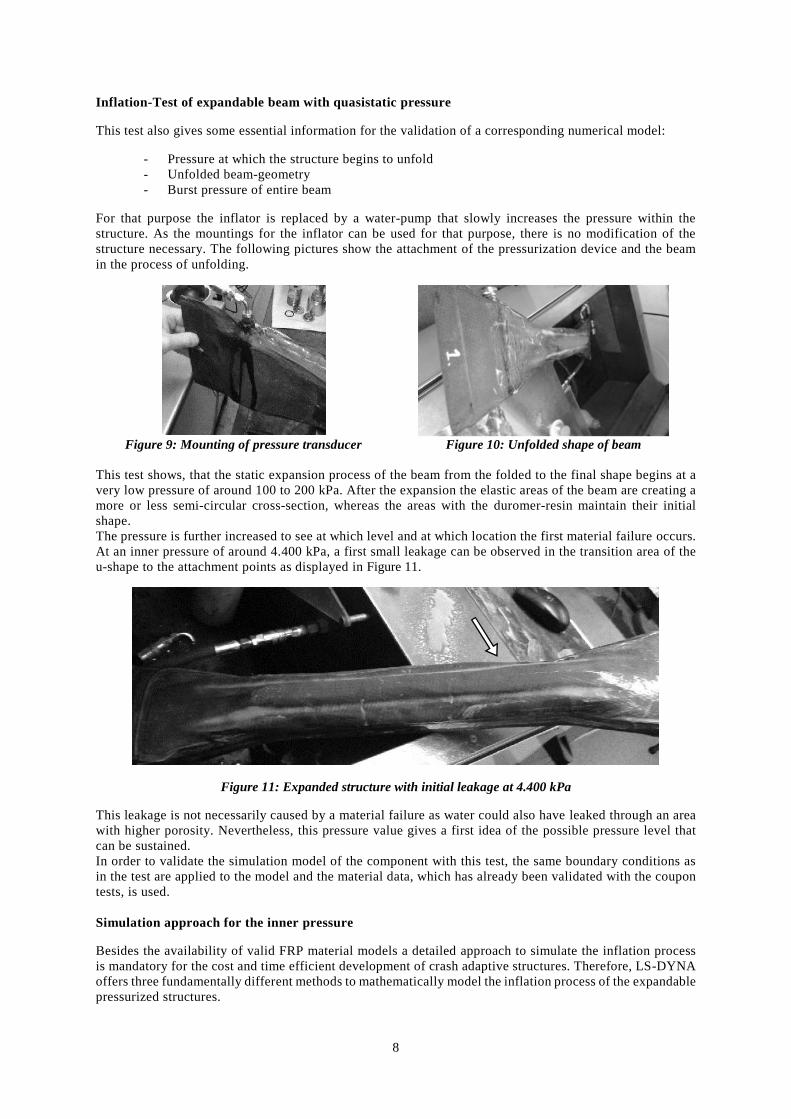
For that purpose the inflator is replaced by a water-pump that slowly increases the pressure within thestructure. As the mountings for the inflator can be used for that purpose, there is no modification of thestructure necessary. The following pictures show the attachment of the pressurization device and the beamin the process of unfolding.
Figure 9: Mounting of pressure transducer Figure 10: Unfolded shape of beam
This test shows, that the static expansion process of the beam from the folded to the final shape begins at avery low pressure of around 100 to 200 kPa. After the expansion the elastic areas of the beam are creating amore or less semi-circular cross-section, whereas the areas with the duromer-resin maintain their initialshape.The pressure is further increased to see at which level and at which location the first material failure occurs.At an inner pressure of around 4.400 kPa, a first small leakage can be observed in the transition area of theu-shape to the attachment points as displayed in Figure 11.
Figure 11: Expanded structure with initial leakage at 4.400 kPa
This leakage is not necessarily caused by a material failure as water could also have leaked through an areawith higher porosity. Nevertheless, this pressure value gives a first idea of the possible pressure level thatcan be sustained.In order to validate the simulation model of the component with this test, the same boundary conditions asin the test are applied to the model and the material data, which has already been validated with the coupontests, is used.
Simulation approach for the inner pressure
Besides the availability of valid FRP material models a detailed approach to simulate the inflation processis mandatory for the cost and time efficient development of crash adaptive structures. Therefore, LS-DYNAoffers three fundamentally different methods to mathematically model the inflation process of the expandablepressurized structures.
9
Depending on the optimization task and the level of detail, one of the following approaches can be used:- Uniform Pressure Method (UP)- Arbitrary-Lagrangian-Eulerian Method (ALE)- Corpuscular Particle Method (CPM)
Typically, in the early development stage of crash adaptive structures no inflator specifications like heat capacity,mass flow rate and temperature profile of the inflowing gas mixture are known (22). Instead of calculating theinner pressure based on the inflator data the UP-approach offers the possibility to specify an idealized pressureversus time profile.Due to the not existing discretization of the inflowing gas mixture the pressure distribution within the structuralcomponent is uniform. Accordingly, this yields to the following drawbacks:
- exact representation of the internal pressure requires technical measurement during inflation tests ofthe original component (hardware needed)
- no local interaction between gas and structure due to global pressure value- evaluation of local temperature or pressure peaks (eg. close to the inflator) not possible
It is obvious that, as soon as the pressurization is realized with an inflator, the CPM or ALE-Method has tobe applied in order to achieve a realistic loading of the structure in the simulation model. For the test withthe quasistatic water-pressurization there is no benefit by applying this more complex approach, therefor theUP-Method is used.
Results – Validation of component test
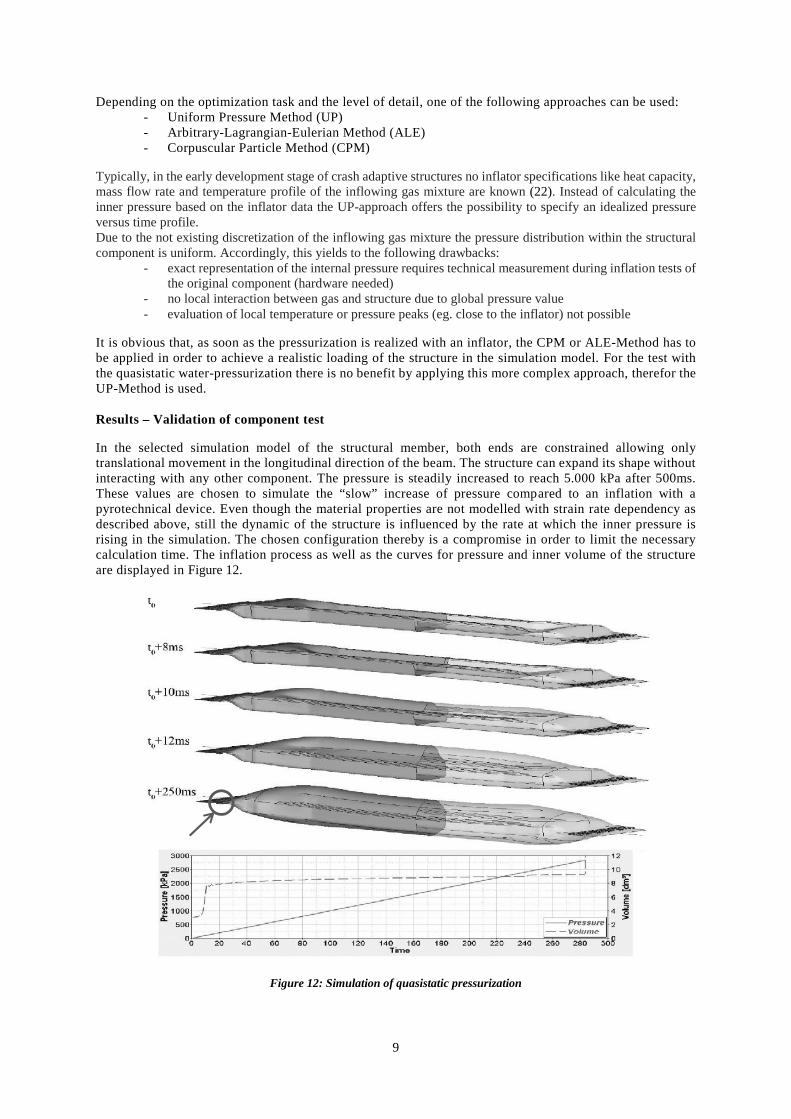
In the selected simulation model of the structural member, both ends are constrained allowing onlytranslational movement in the longitudinal direction of the beam. The structure can expand its shape withoutinteracting with any other component. The pressure is steadily increased to reach 5.000 kPa after 500ms.These values are chosen to simulate the “slow” increase of pressure compared to an inflation with apyrotechnical device. Even though the material properties are not modelled with strain rate dependency asdescribed above, still the dynamic of the structure is influenced by the rate at which the inner pressure isrising in the simulation. The chosen configuration thereby is a compromise in order to limit the necessarycalculation time. The inflation process as well as the curves for pressure and inner volume of the structureare displayed in Figure 12.
Figure 12: Simulation of quasistatic pressurization
10
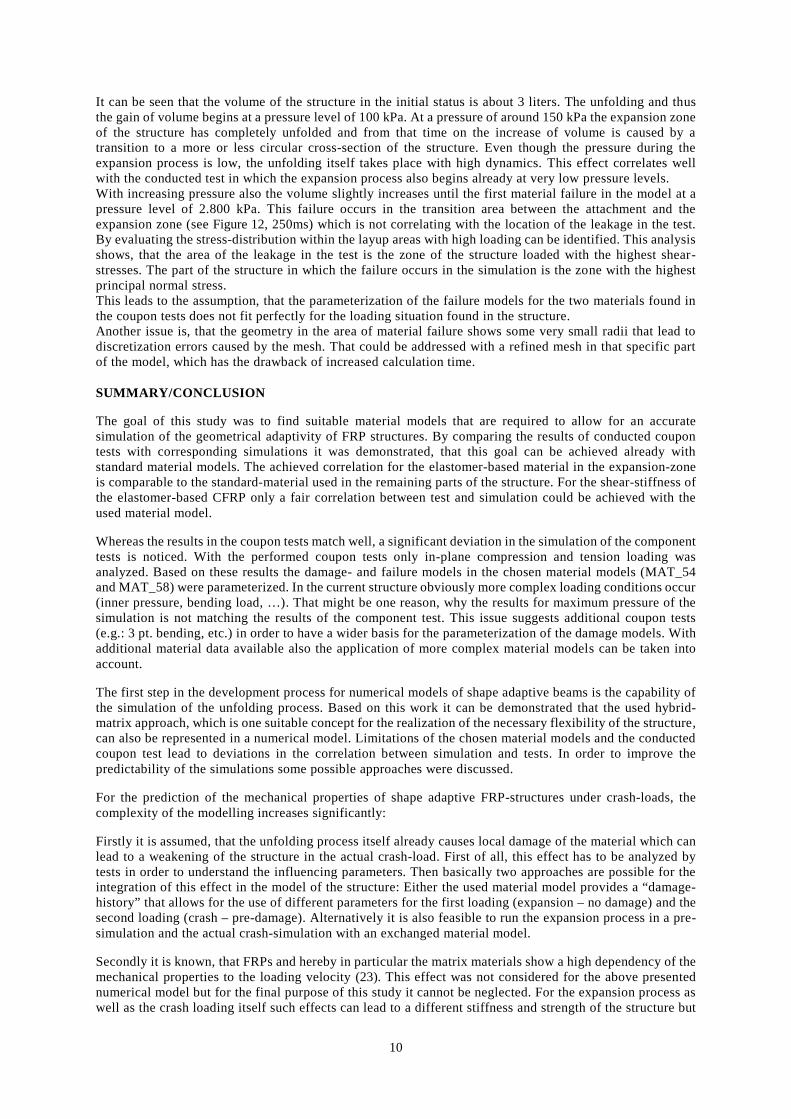
It can be seen that the volume of the structure in the initial status is about 3 liters. The unfolding and thusthe gain of volume begins at a pressure level of 100 kPa. At a pressure of around 150 kPa the expansion zoneof the structure has completely unfolded and from that time on the increase of volume is caused by atransition to a more or less circular cross-section of the structure. Even though the pressure during theexpansion process is low, the unfolding itself takes place with high dynamics. This effect correlates wellwith the conducted test in which the expansion process also begins already at very low pressure levels.With increasing pressure also the volume slightly increases until the first material failure in the model at apressure level of 2.800 kPa. This failure occurs in the transition area between the attachment and theexpansion zone (see Figure 12, 250ms) which is not correlating with the location of the leakage in the test.By evaluating the stress-distribution within the layup areas with high loading can be identified. This analysisshows, that the area of the leakage in the test is the zone of the structure loaded with the highest shear-stresses. The part of the structure in which the failure occurs in the simulation is the zone with the highestprincipal normal stress.This leads to the assumption, that the parameterization of the failure models for the two materials found inthe coupon tests does not fit perfectly for the loading situation found in the structure.Another issue is, that the geometry in the area of material failure shows some very small radii that lead todiscretization errors caused by the mesh. That could be addressed with a refined mesh in that specific partof the model, which has the drawback of increased calculation time.
SUMMARY/CONCLUSION
The goal of this study was to find suitable material models that are required to allow for an accuratesimulation of the geometrical adaptivity of FRP structures. By comparing the results of conducted coupontests with corresponding simulations it was demonstrated, that this goal can be achieved already withstandard material models. The achieved correlation for the elastomer-based material in the expansion-zoneis comparable to the standard-material used in the remaining parts of the structure. For the shear-stiffness ofthe elastomer-based CFRP only a fair correlation between test and simulation could be achieved with theused material model.
Whereas the results in the coupon tests match well, a significant deviation in the simulation of the componenttests is noticed. With the performed coupon tests only in-plane compression and tension loading wasanalyzed. Based on these results the damage- and failure models in the chosen material models (MAT_54and MAT_58) were parameterized. In the current structure obviously more complex loading conditions occur(inner pressure, bending load, …). That might be one reason, why the results for maximum pressure of thesimulation is not matching the results of the component test. This issue suggests additional coupon tests(e.g.: 3 pt. bending, etc.) in order to have a wider basis for the parameterization of the damage models. Withadditional material data available also the application of more complex material models can be taken intoaccount.
The first step in the development process for numerical models of shape adaptive beams is the capability ofthe simulation of the unfolding process. Based on this work it can be demonstrated that the used hybrid-matrix approach, which is one suitable concept for the realization of the necessary flexibility of the structure,can also be represented in a numerical model. Limitations of the chosen material models and the conductedcoupon test lead to deviations in the correlation between simulation and tests. In order to improve thepredictability of the simulations some possible approaches were discussed.
For the prediction of the mechanical properties of shape adaptive FRP-structures under crash-loads, thecomplexity of the modelling increases significantly:
Firstly it is assumed, that the unfolding process itself already causes local damage of the material which canlead to a weakening of the structure in the actual crash-load. First of all, this effect has to be analyzed bytests in order to understand the influencing parameters. Then basically two approaches are possible for theintegration of this effect in the model of the structure: Either the used material model provides a “damage-history” that allows for the use of different parameters for the first loading (expansion – no damage) and thesecond loading (crash – pre-damage). Alternatively it is also feasible to run the expansion process in a pre-simulation and the actual crash-simulation with an exchanged material model.
Secondly it is known, that FRPs and hereby in particular the matrix materials show a high dependency of themechanical properties to the loading velocity (23). This effect was not considered for the above presentednumerical model but for the final purpose of this study it cannot be neglected. For the expansion process aswell as the crash loading itself such effects can lead to a different stiffness and strength of the structure but
11
also to different failure modes. Strain rate dependencies can be considered also with the material modelsused in this study but the parameterization of these models requires an enormous amount of material testing.
Finally, it has to be considered that for the pressurization of the structure an inflator is used. Depending onthe used inflator-technology the exhaust gas can reach several hundred degrees Celsius. The combination ofhot gas and its high velocity in the area of the inflator, abrasive damage of the structure material can occur.This needs to be considered in the design of the structure. This effect cannot be simulated, so extensivetesting is necessary.
The global heating of the structure during and after the inflation leads to varying material properties, whichcan be significant for plastic materials (24). Due to the very short time of interaction of the hot gas with thestructure, this effect is possibly neglectable but it has to be confirmed for concept evaluation. A heat-dependency of material properties is not yet realized in available material models of LS-DYNA. Soalternatively, after a pre-simulation for the expansion process the material model can be adjusted to simulatethe material with the actual temperature during the crash-load.
It can be concluded that still a lot of research topics have to be solved in order to create a predictive numericalmodel of a shape-adaptive FRP structure but with this work a first step was achieved.
ACKNOWLEDGEMENT
The research leading to these results receives funding from the European Community’s SeventhFramework Programme (FP7/2007-2013) under grant agreement no. 314182 (the MATISSE project).This publication solely reflects the author’s views. The European Community is not liable for anyuse that may be made of the information contained herein.
12
REFERENCES
1. Krollmann J. Design and Manufacturing of Shape Adaptive CFRP Structures in a Multi-Matrix Approach.SICOMP Conference on Manufacturing and Design of Composites; 2014 Jun 30; Lulea, Sweden.
2. Wacker M. Hochleistungsfaserverbunde in der Großserie [Internet]. 2012 Oct 17 [cited 2015 Feb 5].Available from: www.fill.co.at
3. Giddons N, White, Mark. OEMs’ Visions for Cost-Effective Adoption of Advanced Lightweight Materialsto Deliver Improved Fuel Economy & CO2 reduction. Global Automotive Lightweight Materials 2012; 2012.
4. Scott P. The new BMW i3 [Internet]. 2013 Nov [cited 2015 Feb 6]. Available from: www.asymcar.com
5. Feindler N. Charakterisierungs- und Simulationsmethodik zum Versagensverhalten energieabsorbierenderFaserverbundstrukturen. TU Munich; 2012.
6. Krüger J, Dölle N. FVK-Anwendungen bei Daimler - Lessons learned – [Internet]. [cited 2015 Feb 5].Available from: http://www.carbon-composites.eu
7. Etzler M. Conceptual Study on adaptive crash structures. Bachelor Thesis, TU Graz;
8. Nohr M. Crash adaptive vehicle structures and components. 2009;
9. Pipkorn B, Lundström J, Ericsson M. Safety and vision improvements by expandable A-pillars. 2011.
10. Mellinghoff U. The Mercedes-Benz Experimental Safety Vehicle 2009. 2009.
11. Koschmieder M. Verarbeitung und Eigenschaften von Faserverbundkunststoffen mit Elastomermatrix. 2010.
12. Hartmann S. Neue Materialmodelle für Composites in LS-DYNA. 2013.
13. Hinterhölzl R. Auslegung und Bauweise von Composite Strukturen. Skriptum, TU München Institut fürCarbon Composites; 2013.
14. LS-DYNA Keyword User’s Manual, Version R7.0. LSTC;15. Peinhaupt C. Numerische Untersuchung zur Eignung eines CFK-Crashelements als Energieabsorber. 2013.
16. Daniel IM, Ishai O. Engineering Mechanics of Composite Materials, 2nd Edition. Oxford University Press;
17. Brouzoulis J, Fagerström M. Modelling of multiple delaminations in shells using XFEM. 2013.
18. Brouzoulis J, Fagerström M, Svenning E. A shell element formulation for the simulation of propagatingdelamination and through-thickness cracks. 2014.
19. Wade B, Feraboli P, Osborne M. Simulating laminated composites using LS-DYNA material model MAT54part I: [0] and [90] ply single-element investigation. 2012.
20. Schweizerhof K, Weimar K, Münz T, Rottner T. Crashworthiness analysis with enhanced composite materialmodels in LS-DYNA–merits and limits. 1998.
21. LS-DYNA Keyword User’s Manual. Livermore Software Technology Corporation (LSTC); 2014.
22. Opelka J-M, Nohr M, Blume K-H, Neutz J. PRE-SAFE® Structure als automobile Anwendung –Entwicklung intelligenter Tür-/Rohbaustrukturen. VDI Berichte 2204. 2013.
23. Eyerer P, Woidasky J, Dominighaus H, Elsner P. Einführung in Polymer Engineering. Springer BerlinHeidelberg; 2008.
24. Schürmann H. Konstruieren mit Faser-Kunststoff-Verbunden. Springer Berlin Heidelberg; 2006.
Lukaszewicz 1
A DESIGN METHOD FOR ROBUST AUTOMOTIVE AND AEROSPACE COMPOSITE
STRUCTURES INCLUDING MANUFACTURING VARIATIONS
AUTHOR: Dr Dirk Lukaszewicz, BMW AG, Research and Innovation Centre, Knorrstraße 147, 80788
München, Germany, Email: [email protected]
Paper Number: 15-0135
ABSTRACT
Objective
Composites may enable further weight reductions for plastic composite intensive vehicles. Among the challenges associated
with greater adoption of composites in the automotive industry are the need for novel design procedures, the use of
composites in impact applications and the greater variability during composite manufacture. Here, are method is presented to
account for composite manufacturing variability in the design phase.
Methods
The method is based on measuring the variability in a part and the translation into a simulation. As an example a side-pole
impact into a doorsill subassembly was chosen. The test data are used to validate numerical simulations models for the
impact situation. The simulation is then used to study the sensitivity of the system with respect to manufacturing variability.
A novel optimization was also used that decouples multiple manufacturing variations and allows identifying limits on
acceptable variability levels.
Results
The experimental tests exhibit changes in mechanical performance due to the existence of manufacturing variations. The
numerical simulation including these manufacturing variations shows reasonable agreement with the experimental data. The
FE model was then used to vary the manufacturing variations and to identify allowable intervals within defined performance
criteria.
Conclusion
The design methodology has significant benefits for automotive composite design and manufacturing since it may enhance
the robustness of composite crash-structures, reduce part cost and eliminate excessive safety factors to account for unknown
manufacturing variations.
KEY WORDS: Crash, Crashworthiness, Finite Elements, Vehicle Design
Lukaszewicz 2
INTRODUCTION
To enable further weight reductions and fuel savings for future vehicles, Plastic Composite Intensive Vehicles
(PCIVs) (Barnes, Coles, Roberts, Adams, & Garner 2011) may become more widespread. Advanced Fibre
Reinforced Plastics (FRPs) exhibit excellent mechanical and crash performance when compared with
conventional metallic structures. Both the specific stiffness and energy absorption capability of FRPs exceed
common automotive materials, such as aluminium and steel, making them highly suitable for crash application
for frontal, side and rear impact.
However, composites exhibit different deformation behaviour than steel or aluminium, thus requiring an
adaptation of design philosophies for vehicle safety (Ferenczi, Kerscher, & Möller 2014). In addition, FRP
mechanical performance may vary significantly due to manufacturing variations (MV) such as fibre
misalignment, fibre waviness, gaps or folding. Safe structural design of composite vehicles containing MVs
may thus require enhanced design methods and processes. An example for this is introduced here.
Impact Of Imperfections On Mechanical Performance
Some of the most common MVs are fibre misalignment, fibre waviness, laps and gaps, and porosity. The focus
of this work will be on preforming MVs, which include in- and out-of-plane waviness and longitudinal and
transverse folding. An early study into the impact of fibre waviness by Mrse and Pigott (Mrse & Piggott 1993)
studied the compressive properties of thermoplastic carbon fibre prepreg, which had some initial waviness and
were crimped to introduce additional waviness. The authors observed some reduction in compression modulus
but a significant reduction of compressive strength with increasing wave character.
Daniel and co-workers (Chun, Shin, & Daniel 2001; Hsiao & Daniel 1996a, 1996b) focused on the impact of
fibre waviness on the elastic properties of carbon-fibre reinforced epoxy prepreg. An analytical model was used
to evaluate the impact of waviness on tensile and shear modulus as well as Poisson’s ratio. In-plane tensile
modulus was found to degrade significantly as a function of waviness, up to 35% for a graded wave with
characteristic value of 0.1, while transverse in-plane tensile modulus were found to increase.
Compressive stiffness and strength were more significantly affected and the reduction in compressive strength
could be up to 80% for a graded wave with a characteristic value of 0.1. Similar observations were made for
Poisson’s ratios and shear moduli. Trends were consistent for uniform and graded waviness but significantly
less pronounced for localized waviness, which had only a small impact on overall property changes. Garnich
and Karamani (Garnich 2005; Garnich & Karami 2004a, 2004b) used Finite Element (FE) simulations to
demonstrate that fibre waviness had increasing impact on mechanical performance with increasing fibre
misalignment and obtained stiffness reductions of up to 70%. Chan and Chou (Chan & Chou 1995) studied the
impact of misalignment on the flexural properties of laminates and observed that waviness yielded more severe
stiffness and strength reductions in highly stressed plies.
Most of this early numerical work assumed either some form of symmetry, such as a sinusoidal waviness, or
that the waviness would be confined. However, as mentioned previously out-of-plane waviness may affect
neighbouring plies making it very difficult to separate the effects of waviness in individual plies. For example,
Joffe et. al. (Joffe, Mattsson, Modniks, & Varna 2005) studied the mechanical properties and deformation
behaviour of NCF using both FE-models and extensive testing proposing a linear approximation between
misalignment angle and obtaining a reduction of 40% in mechanical performance for a misalignment angle of
15°. A linear relationship between MV and mechanical property had previously not been predicted. In addition
the reduction was lower than what might have been expected. Pansart, Sinapius and Gabbert (Pansart, Sinapius,
& Gabbert 2009) presented a coupled FEM/analytical approach to study the impact of both fibre misalignment
and fibre waviness on the compressive strength of NCF and reported increasing reductions in compressive
strength with increasing fibre waviness angle and wave half wavelength of up to 40% for 10deg waviness and a
half wavelength of 5. El-Hajjar and Petersen (El-Hajjar & Petersen 2011) proposed a new approach to model
waviness using a Gaussian function as opposed to the sinusoidal approach used previously and tested the tensile
stiffness and strength of wavy laminates with reported strength reductions of up to 60%. Potter and co-workers
(Bloom, Wang, & Potter 2013; Lightfoot, Wisnom, & Potter 2013a, 2013b) have studied waviness including
wrinkles experimentally and observed a reduction of up to 50% for the tensile strength. While most of the
experimental work thus tends to confirm the initial analytical predictions we can conclude that experimentally
measured reductions in mechanical properties are lower than the predictions from early models. In addition most
experimental results tend to show a linear relationship between MV characteristics and mechanical property.
Since the focus of this work is the crashworthiness of composite vehicle structure an important aspect is the
impact of such MVs during dynamic deformation as opposed to the quasi-static tests commonly employed. This
has been studied by Hsiao and Daniel (Hsiao & Daniel 1999) for fibre waviness. It was demonstrated that the
effect of waviness was less severe for increasingly dynamic loading due to the strain rate dependent increase in
Lukaszewicz 3
stiffness. It can thus be concluded that the used of quasi-static test data to model the impact of MVs on the
crashworthiness will represent a conservative estimate.
METHODS
Two sets of carbon fibre reinforced plastic (CFRP) subassemblies of a doorsill were manufactured with different
MV distributions. The sets where then mechanically tested to measure the maximum deformation into the
doorsill assembly, representing a loading situation comparable to an FMVSS214 side pole impact (Anon 1998).
Additionally, MVs were recorded through destructive testing and the information was incorporated into a
numerical simulation to replicate the test results. The simulation was then validated against the test data. Based
on this validated FE simulation a method is introduced that enables direct simulation of MVs and their impact
on structural performance for a side pole impact. Latin hypercube (LHC) sampling is then used to vary the
characteristics of the MV. The sampling results are then used to generate an analytical regression model. A
novel optimization method is then used that aims at finding the largest hyperbox containing good designs within
the solution space, thus generating limits on the characteristics of the MV.
Component Manufacture The subassembly studied here is the side frame of a composite vehicle body structure made from carbon fibre
reinforced epoxy. Within the vehicle architecture one of the functions of the side frame is protection of the
passengers in an impact event, such as a side pole test. During a side pole test the intrusion into the passenger
cell have to be mitigated, while the supplementary restrained systems, i.e. airbags and curtains, are being
deployed and the vehicle is stopped at the pole.
This occurs while the side frame undergoes significant deformation, which can exceed 100mm locally. To
prevent large deformations of the side frame the incoming loads are normally redistributed in the floor structure
and then to the vehicle non-struck side. Consequently, the side frame is supported by cross members and
ancillary structural elements, which enable load transfer to the non-struck side of the impact, Figure 1. The side
frame is an assembly of individual parts through co-curing for the inside and outside parts and adhesive bonding
for the inside and outside. The key components under investigation here are the inner and outer doorsill parts,
the inner reinforcement and the inner top cap and frontal cap, five parts in total, Figure A 1. This assembly is
referred to as side frame-set of which a total of six was manufactured for two different MV combinations,
referred to as “A” and “B”. To manufacture parts with different MV severities and types the temperature of the
mould as well as the mounting of the plies in the frame was modified. Of the six side frame-sets each, three
were visually inspected and three were cured with resin and tested mechanically. This way it was ensured that
the side frame-sets for inspection and mechanical inspection were from the same batch. This was important as
the MVs were assumed to be identical between visually inspected and mechanically tested subassemblies. For
visual inspection the parts were segmented into plies again and for each segment the MV’s in the plies were
recorded. To record the MV’s a grid with a side length of 50x50mm was projected onto the vehicle in all
projection planes. Here we are concerned with a side frame subassembly only and consequently only the y-z-
vehicle plane is used to record MV’s. For each ply the part was then inspected visually progressing from one
quadrant of the grid to the next.
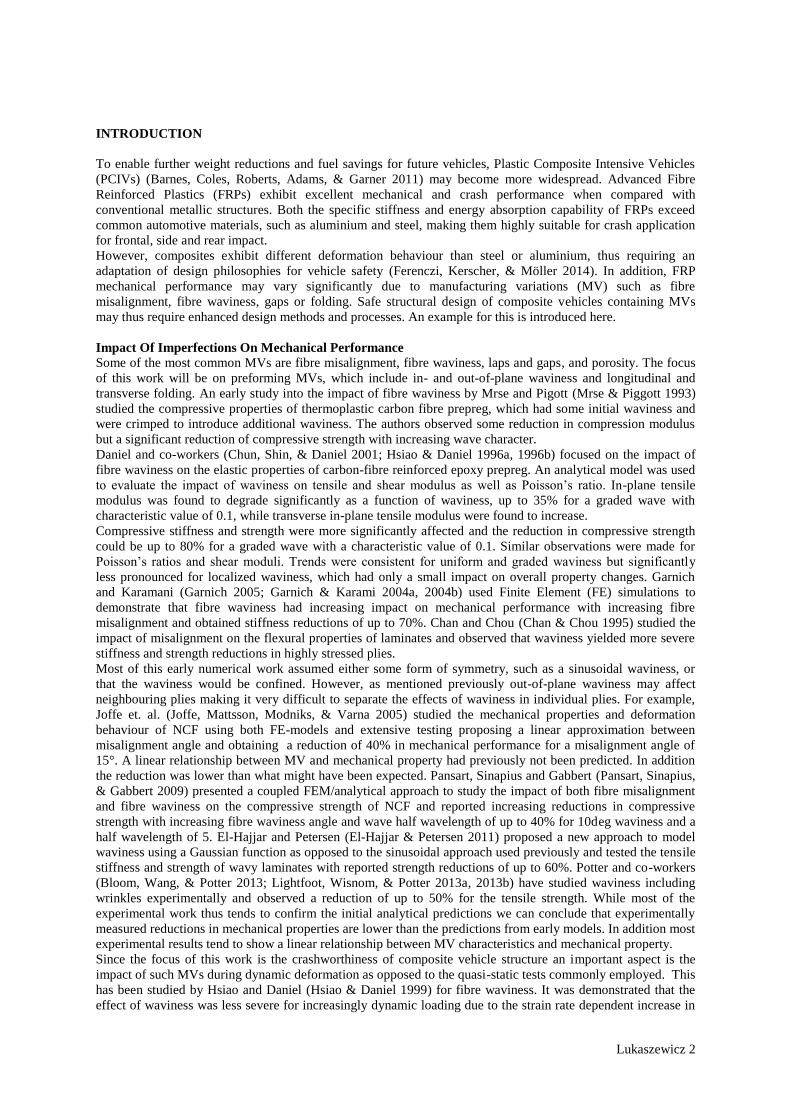
Figure 1a) Overview of the vehicle layout and coordinate system with the side frame highlighted and b) Illustration of
principal loading of a doorsill in a side pole impact. The loading conditions are comparable to a five point
bending configuration.
Lukaszewicz 4
For each quadrant the in- and out-of-plane waviness, longitudinal and transverse folding amongst other MV’s
such as tearing of the stitching yarn was recorded. Then each MV was categorized according to its
characteristics, with six different characteristics categories for each MV. The categories are dependent on the
MV type but can generally be related to physical variables for a given MV, for example for waviness the MV
category is related to the waviness height and length. This process for both MV locations as well as MV
characteristics was then carried out by three different quality inspection staff to ensure that all MVs were
recorded and that the characteristics was recorded correctly. In case of disagreement between individual
recordings the defect with the highest severity was retained. This process was then repeated for each ply in the
part and for all three produced parts. The result was a feature map for all three parts combined for every ply
were both the location of the MV’s as well as their characteristics could be easily accessed. Table 1 provides an
overview of the recorded MVs that were used in this study to develop the simulation model.
Table 1: Varied MVs and Characteristic Range. The Characteristic Range is a normalized classification relating to the physical
dimensions or shape of a given MV.
MV O
ut-
of-
pla
ne
wav
ines
s
In-p
lan
e
wav
ines
s
Lo
ng
itu
din
al
Fo
ldin
g
Tra
nsv
erse
Fo
ldin
g
Size Range 1-6 1-6 1-6 1-6
Testing
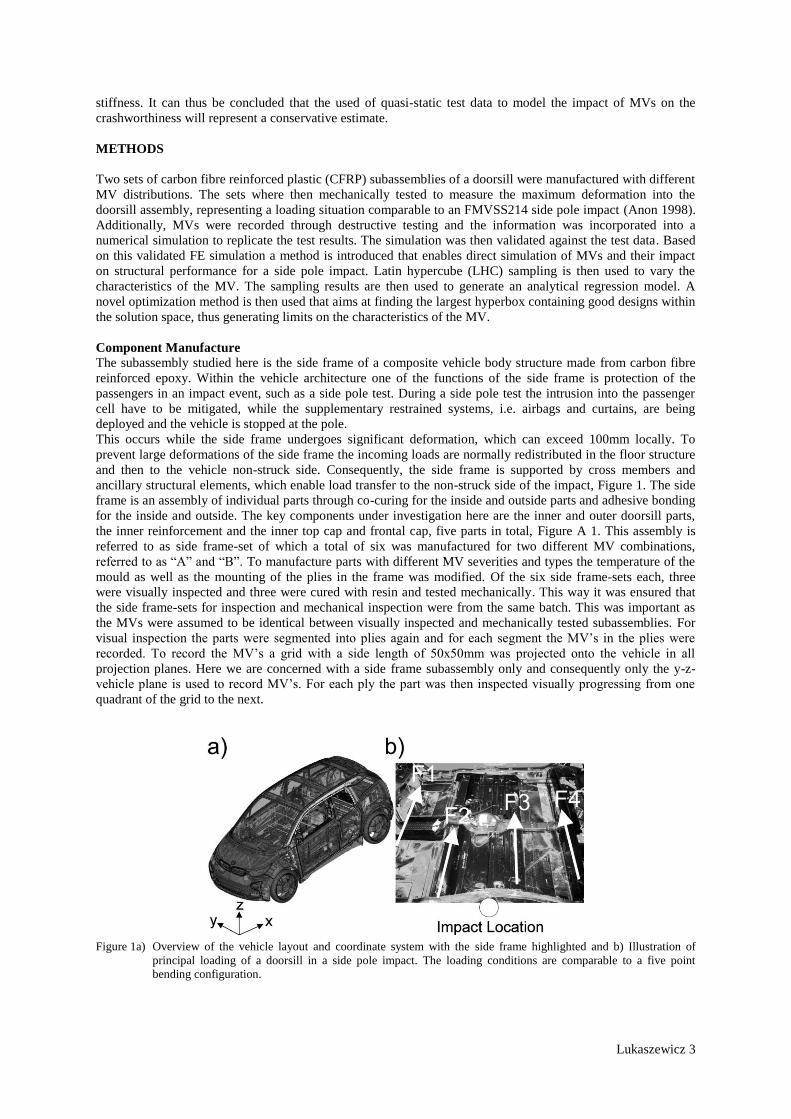
The principal loading of a side frame in a vehicle may be approximated using a five-point bending configuration,
Figure 1. Consequently, the test set-up was designed to replicate this vehicle situation as shown in Figure 2. A
loading frame consisting of two supports on the lower and two supports on the upper side was manufactured.
The mounting positions were equipped with machined interfaces that would fit the complex geometry of the
doorsill and would prevent torsion and bending while allowing some transverse movement. The entire setup
with the side frame section mounted into the loading frame was placed into a drop tower where an impactor
with a diameter of 254mm would impact the side frame in the same position as the side pole in a full vehicle test.
An accelerometer on the impactor was used after testing to calculate the force on the impact side. A laser beam
system was used to measure the displacement of the impactor. This was levelled to zero on top of the side
frame for each test. The loading frame was then aligned with the impactor and fixed to the ground to prevent
further movement during testing.
An initial FE simulation was setup to generate a test configuration, were the load level and energy absorption of
the side frame were comparable to the full vehicle loading. From the FE-simulation a total drop weight of 352kg
and a test speed of 5.65m/s were found to be comparable to the full vehicle-loading situation. For each feature
map “A” and “B” three side frames were tested and the acceleration and displacement at the impactor were
recorded. After recording, the data were filtered using a Butterworth filter with a channel frequency class of 60
(Anon 1995). The experimental results are summarized in Table 2.
Figure 2: Test setup for dynamic five-point-bending of a doorsill in a drop tower.
Lukaszewicz 5
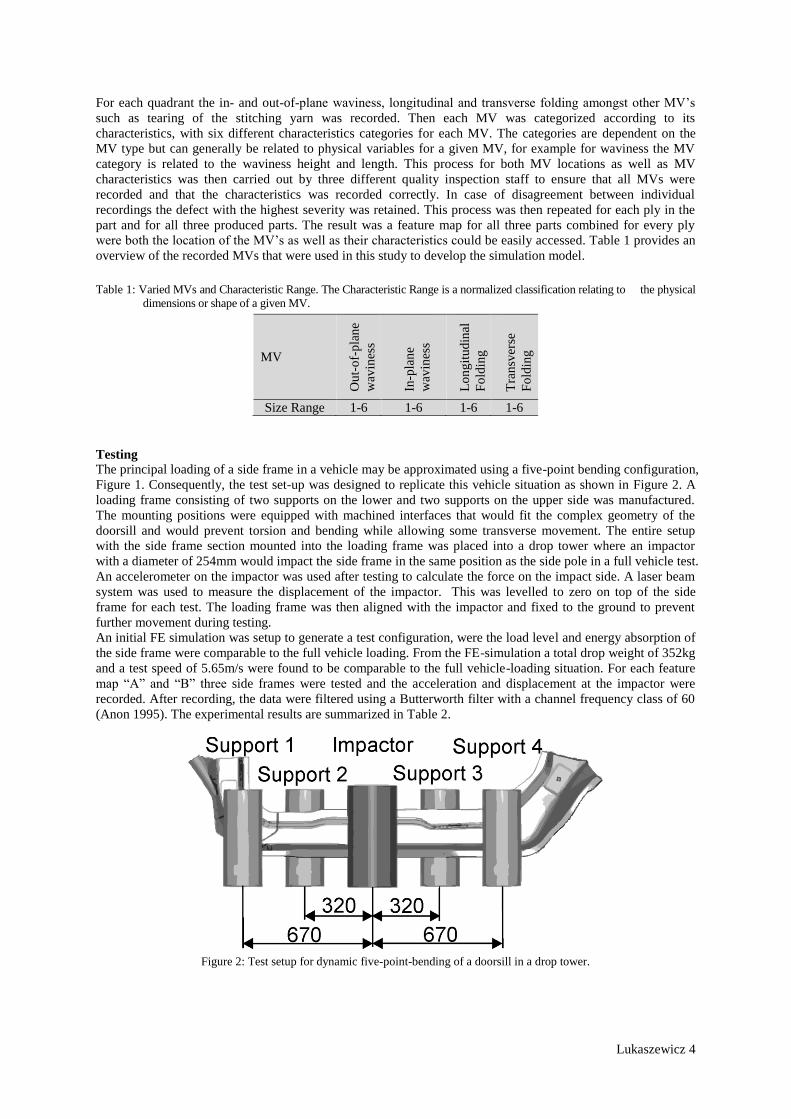
Table 2: Experimental Results. The labels “A” and “B” designate two subassembly configurations with known, but different
MVs in the parts.
Test
[-]
Maximum Intrusion
[mm]
Mean
[mm]
A1 99.7
101.1 ± 1.2 A2 101.9
A3 101.7
B1 111.4
108.9 ± 3.0 B2 105.7
B3 109.7
FE Model with Manufacturing Variations
To replicate the experimental results a baseline model was set up in the commercial FE-Code Abaqus 6.11-2A
(Dassault Simulia 2013). The composite parts were modelled using the ABQPly-Fabric composite material
model within Abaqus using a single shell element over the thickness incorporating the physical layers into a
shell section. Typical mesh size was 10mm for the composite parts. In total the model consists of 240613
elements, while the composite parts were modelled using 67107 shell elements of the type S4R. The composite
parts stacking sequence, ply thickness and ply orientation were modelled as composite sections with an offset
from the respective shell element plane. The inner and outer side frame were glued together, this was modelled
by cohesive elements along the bond line, which had energy based material degradation behaviour.
The Impactor and the four supports were modelled as rigid bodies. The impactor had a reference node on the
perimeter in line with the impact point to enable simple comparison with experimental results. All six degrees of
freedom of the supports were fixed. The impactor was attached to a reference point, with and impact mass of
352kg and the impact velocity of 5.65m/s as initial condition with displacement in the z-direction (vehicle y-
direction) only. Total simulation time was 0.7s. Forces and displacements from the simulation were measured at
the reference node, which was identical to the accelerometer location in the physical test. To translate the MVs
from visual inspection onto the FE-model material definitions were necessary. These were generated through
extensive mechanical testing of coupons, for example in tension and compression. The generation of these FE
material definitions are not the focus of this paper. As a result specific material data for different MV types and
their characteristics were available.
The MV’s from specimen manufacture that were translated into the FE model were in- and out-of-plane
waviness, longitudinal and transverse folding, Table 1. The mapping of the MV’s was scripted in ANSA (Beta
CAE 2014). First the visual inspection data was used to segment the side frame into areas with different material
behaviour, depending on whether defects were present or not and taking into account individual plies as well.
This information was recorded in the shell section definition of each element by modifying the material
definition of all the affected plies. As an example in one element the third ply and sixth ply might be associated
with in-plane waviness material definition while all remaining plies would retain their nominal material
definition. A neighbouring element might be associated with through-thickness waviness in the 4th to 6th ply of
the shell section.
Then, for each area the plies were associated with the corresponding MV severity ranging from 1 to 6 from the
visual inspection data. The result is a model with a significant number of unique shell sections.
This is illustrated in Figure A 2 where the different shell section definitions are shown through colour coding.
The grey area contains nominal material properties, while the coloured areas are associated with MVs in the
shell sections. Since data from multiple preforms and inspectors were mapped simultaneously an approach was
needed to identify which MVs would be mapped onto the final simulation part. As mentioned previously the
aim was to map the most severe MV onto the geometry. Here a stiffness based mapping approach was used,
where the MV’s were ranked according to their combined impact on tensile and compressive stiffness in the
fibre direction, E11+ and E11-. The plies were then associated with appropriate material definitions, which were
generated through testing. Since material definitions for out-of-plane waviness were not available the material
definition for in plane waviness was used here as well.
Optimization
The goal of the optimisation proposed here is to simultaneously define allowables for multiple optimisation
goals, such as multiple MVs. In other words the process is aimed at defining a maximum solution space. To
achieve this, the approach proposed by Zimmermann and Edler von Hoessle (Zimmermann & von Hoessle
2013) is adapted here for the optimisation of composite structural MVs. The optimization algorithm by
Lukaszewicz 6
Zimmermann and Edler von Hoessle combines stochastic sampling and Bayesian interference to generate a
feasible maximum solution space.
Initially, a good design is created using classical optimization techniques such as gradient based
optimization or genetic algorithms (GA). Starting from this good design a randomly defined search box is
populated with sampling points. The iteration can be divided into two phases, Phase 1 and Phase 2.
In the first phase the search box is generated and the results are evaluated with respect to a performance
criterion, for example the maximum intrusion. By removing poor designs from the initial search box the largest
possible box is computed that contains no poor designs and a maximum of good designs. This may not
necessarily be the largest bounding box for all good designs. In additional steps this box is extended or reshaped
and new Latin Hypercube samples in the bounding box are calculated. This process is repeated until the
bounding box is stationary and at maximum size.
In the second phase new samples are generated inside the box and the box is shrunk or reshaped until
the bounding box contains only good designs. The new box is then populated again using Latin Hypercube
sampling. This process is repeated until a number of consecutive Latin Hypercube seeds within a bounding box
produce only good designs, after which the process is stopped.
Performance criterion: Since the optimization approach described above uncouples all MVs, which are simulated
simultaneously, it is possible to generate allowable intervals for each MV independent of the others. All repeated
tests including full vehicle crash tests exhibit a standard deviation that is their tests results vary to a certain extent
between nominally identical tests. This may be due to the fact that no vehicle undergoing testing is free of MVs,
variability in the test facility or the accuracy of the measurement equipment to name a few here, this fact is being
used as definition for the performance criterion for the MV optimization. If the scatter between two nominally
identical tests is equal to or greater than the change in performance that can be attributed to different MVs in the
vehicle, then MVs are having an insignificant impact on vehicle performance since a distinction between scatter due
to MVs and the test configuration cannot be made. This may be defined as
∆dMV ≤ ∆dTest (1)
where ∆dMV is the relative change in Intrusion due to MV’s and ∆dTest is the relative change between
tests. While this repeatability of the BMW test facility is established it is not being used in this paper for
confidentiality reasons. Instead, the scatter of the impact tests for side frame configuration “A” of 1.2% is being
used here. This value has no connection to the repeatability of the full vehicle test facility and is simply used
here to illustrate the process. Since the base simulation without any MVs had a maximum intrusion of 97.6mm,
the maximum allowable intrusion in a model containing any MVs is 98.8mm.
Workflow: The following section introduces a workflow, which controls the creation, execution and result handling
for the FE simulation and optimization. The goal of the optimization procedure is to identify allowable intervals for
MVs, which will ensure that the variability of the response, or intrusion, stays within certain limits.
The optimization workflow is shown in Figure A 3. The optimization starts with the setup of the initial
model. Here all MVs are mapped onto the respective locations on the part and plies as described previously for
the validation simulation. Lastly, all characteristics are set to zero, i.e. the material card without knockdown is
used to calculate the baseline result for the simulation. From this model variants are then generated using a
scripted Latin Hypercube simulation approach. By varying the characteristics of the MVs 400 variants were
generated. They location on the part and the ply was fixed. The models were then solved in parallel on an HPC
Cluster with 16 CPUS for variant. Abaqus Explicit 6.11-2A was used as solver. Typical runtime was 75 minutes.
From the simulation the intrusion of the Impactor was evaluated as Latin Hypercube Output. The nodal
displacement of the impactor was extracted using a python script and the maximum value was recorded.
ClearVuAnalytics (Divis 2014) was then used to generate a Response Surface Model (RSM). From the available
methods within the software the random forest tree algorithm consistently generated the highest degree of
correlation R2 between the FE-data and the regression model for the optimization. It was thus used to compute
the RSM. Allowable intervals for the MV characteristics were then calculated based on the RSM using the
bounding box optimization described previously. This process was then repeated by setting the maximum
severity of the MV characteristics to the allowable intervals from the previous optimization. Here, the process
was stopped after two iterations. Lastly, the allowable intervals form the optimization were validated using 10
FE simulations with discreet MV characteristics.
RESULTS
The FE-simulation was computed using Abaqus 6.11-2A on 16 cores with double precision. Results are
shown in Figure 3.
Lukaszewicz 7
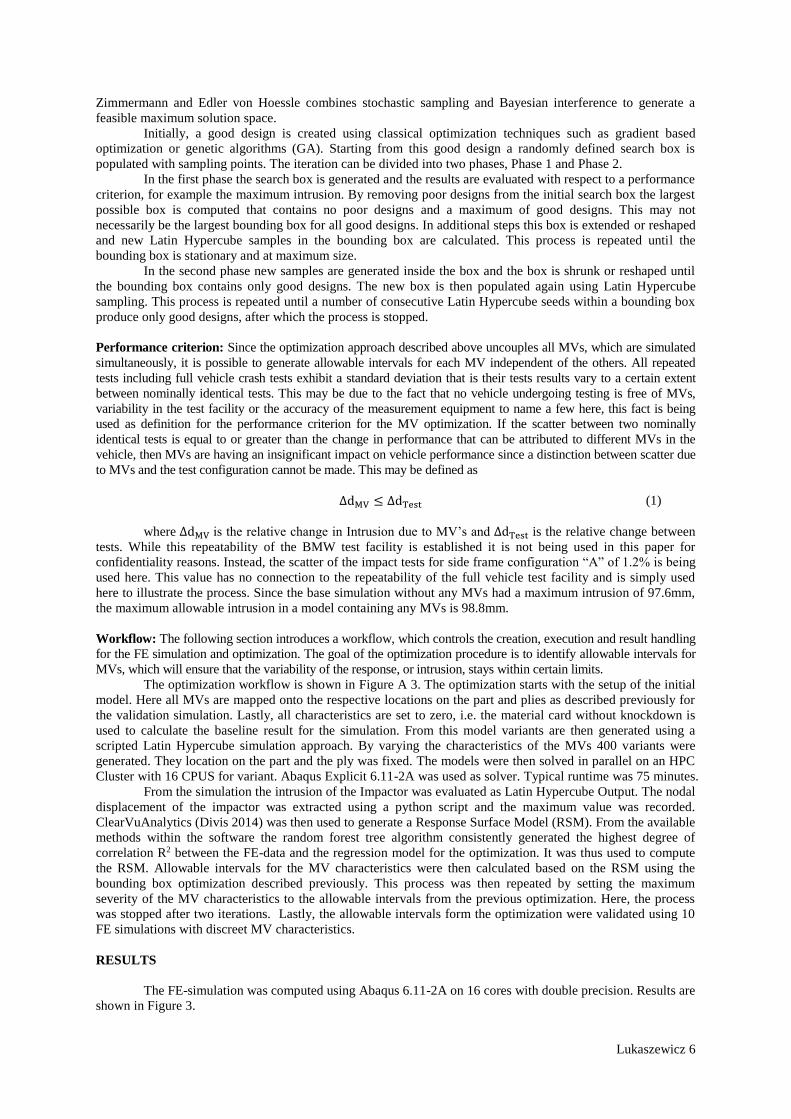
Figure 3a): Experimental and numerical load-displacement curves for MV’s for subassembly A with comparison to the
baseline simulation and MV simulation and b) for subassembly B.
The base simulation without any MV’s yielded a maximum intrusion of 97.6mm, 101.9mm for MV
map A and 102.5mm for MV map B. When comparing the simulation results with the experimental results in
Table 2 it can be seen that the simulation replicates the experimental results well for MV map A, while it
significantly under predicts the experimental results for MV map B. This may be explained through the fact that
now all MVs are mapped and that the mapping of through-thickness waviness is based on the material data for
in-plane waviness. For the subsequent optimization of the limiting samples for each part model A was used.
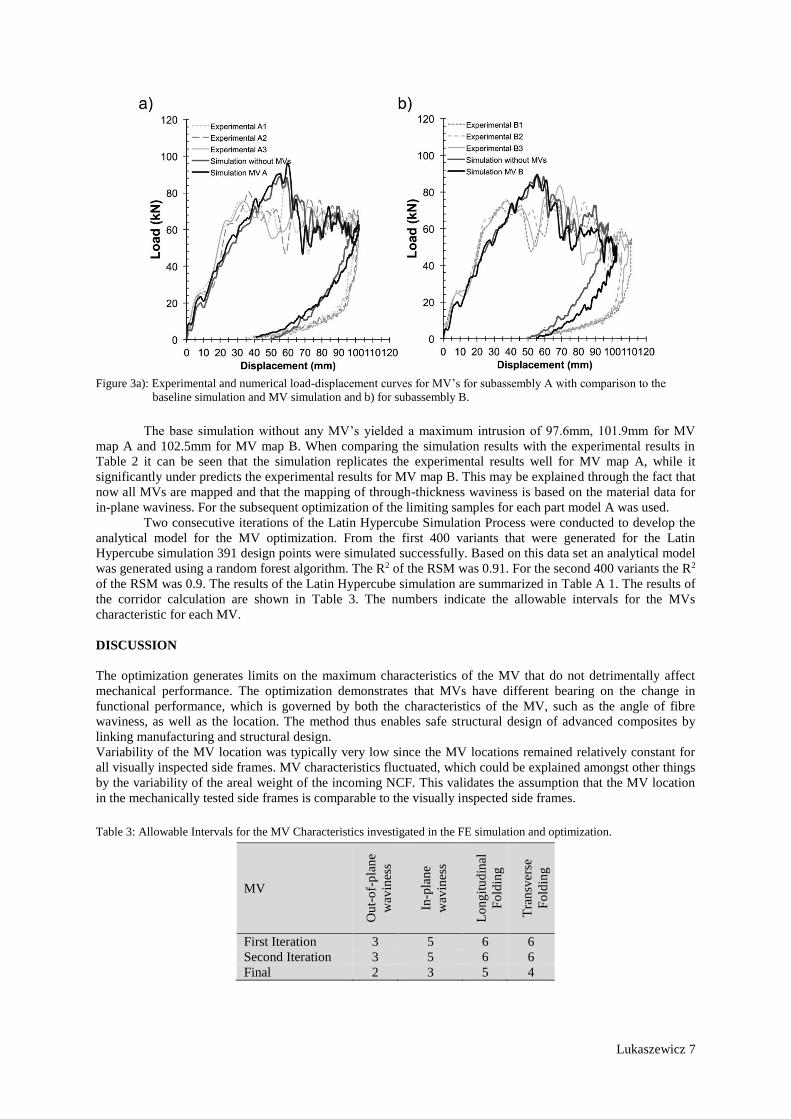
Two consecutive iterations of the Latin Hypercube Simulation Process were conducted to develop the
analytical model for the MV optimization. From the first 400 variants that were generated for the Latin
Hypercube simulation 391 design points were simulated successfully. Based on this data set an analytical model
was generated using a random forest algorithm. The R2 of the RSM was 0.91. For the second 400 variants the R2
of the RSM was 0.9. The results of the Latin Hypercube simulation are summarized in Table A 1. The results of
the corridor calculation are shown in Table 3. The numbers indicate the allowable intervals for the MVs
characteristic for each MV.
DISCUSSION
The optimization generates limits on the maximum characteristics of the MV that do not detrimentally affect
mechanical performance. The optimization demonstrates that MVs have different bearing on the change in
functional performance, which is governed by both the characteristics of the MV, such as the angle of fibre
waviness, as well as the location. The method thus enables safe structural design of advanced composites by
linking manufacturing and structural design.
Variability of the MV location was typically very low since the MV locations remained relatively constant for
all visually inspected side frames. MV characteristics fluctuated, which could be explained amongst other things
by the variability of the areal weight of the incoming NCF. This validates the assumption that the MV location
in the mechanically tested side frames is comparable to the visually inspected side frames.
Table 3: Allowable Intervals for the MV Characteristics investigated in the FE simulation and optimization.
MV
Ou
t-o
f-p
lan
e
wav
ines
s
In-p
lan
e
wav
ines
s
Lo
ng
itu
din
al
Fo
ldin
g
Tra
nsv
erse
Fo
ldin
g
First Iteration 3 5 6 6
Second Iteration 3 5 6 6
Final 2 3 5 4
Lukaszewicz 8
This is a significant shortcoming of the results presented herein, and further work is aimed at addressing this in
the future (Deobald et al. 2014). Further, it should be noted that not all manufacturing variations present in the
as manufactured side frames were translated into the model.
One Interesting result is the fact that certain combinations of manufacturing variations result in a
reduction of the maximum intrusion. There are several possible explanations for this that need to be explored
further. The first would be numerical noise, for example due to different domain decompositions for various
models. The second is the fact that certain MV’s, such as longitudinal and transverse folding as well as in-plane
waviness can actually improve the stiffness of a ply either in the fibre direction or transverse which may
improve stiffness locally and this effect was also captured by the FE model. The third explanation would be a
change of failure sequence due to MV’s which would result in a redistribution of the load on a part and could
change the severity of a MV, this effect is explored in more detail for out-of-plane waviness in another paper
(Deobald et al. 2014).
Here, a novel concept for designing composite structures has been shown which is based around
optimization of the entire product development including manufacturing. Historically, most MVs in composite
parts are not accepted because they may be detrimental to safety and are difficult to reproduce in a serial
prototype-manufacturing environment often encountered in the aerospace industry. In addition, they are
detrimental to achieving ultimate lightweight designs. However, ultimate lightweight design is not desirable if
cost and production volume constraints are taken into account. Consequently, designing with MVs becomes a
potential target for improving the composite development process with respect to automotive requirements.
Potential improvements include a direct link between manufacturing and design to simultaneously optimize both.
Further, design with MVs may enable a trade-off between lightweight design, cost and production volume.
A workflow that enables safe structural design with MVs is demonstrated here for a generic composite crash
structure. An approach for translating MVs from testing into an FE simulation is first shown. The FE model that
was developed here demonstrated reasonable correlation between the simulated and experimentally observed
structural response for two representative MVs maps. One model was then subsequently used to optimize the
manufacturing variations with respect to their impact on structural performance. The method and simulation
approach shown herein may enable significant improvements to production cost, rate and part quality for
composites components for the aerospace and automotive industry.
ACKNOWLEDGEMENTS
The author would like to thanks BMW Group for the opportunity to carry out and publish this research. The
author acknowledges the support from David Becherer, Viorel-Constantin Ionescu and Dr Stefan Kerscher from
the BMW Group. The author would also like to thank Lyle Deobald, Chul Y. Park, Nihar Desai and Mary
Matthews from the Boeing Company for the invaluable feedback and discussions.
REFERENCES
Anon. (1995). Instrumentation for impact test - Part 1 - Electronic Instrumentation (Vol. J211-1): SAE
International.
Anon. (1998). U.S. Department of Transportation: Federal Motor Vehicle Safety Standards and Regulations.
Retrieved 23rd February 2013, from http://www.nhtsa.gov/cars/rules/import/fmvss/index.html
Barnes, G., Coles, I., Roberts, R., Adams, D. O., & Garner, D. M. J. (2011). Crash Safety Assurance Strategies
for Future Plastic and Composite Intensive Vehicles (PCIVs). Cambridge, Massachusetts, USA: Volpe
National Transportation Systems Centre.
Beta CAE. (2014). ANSA.
Bloom, L., Wang, J., & Potter, K. (2013). Damage progression and defect sensitivity: An experimental study of
representative wrinkles in tension. Composites Part B, 45(1), 449-458.
Chan, W., & Chou, C. (1995). Effects of delamination and ply fibre waviness on effective axial and bending
stiffness’s in composite laminates. Composite structures, 30, 299-306.
Chun, H. J., Shin, J. Y., & Daniel, I. M. (2001). Effects of material and geometric nonlinearities on the tensile
and compressive behaviour of composite materials with fibre waviness. Composites Science And
Technology, 61(1), 125-134.
Dassault Simulia. (2013). Abaqus 6.11-2A.
Deobald, L., Park, C., Desai, N., Ramnath, M., Jin, O., Lukaszewicz, D., & Kerscher, S. (2014). Simulation of
Composite Manufacturing Variations to Determine Stiffness and Strength Reductions in Automotive
and Aerospace Structure. Paper presented at the ACS 29th Technical Conferences, San Diego
Divis. (2014). ClearVu Analytics.
El-Hajjar, R. F., & Petersen, D. R. (2011). Gaussian function characterization of unnotched tension behaviour in
a carbon/epoxy composite containing localized fibre waviness. Composite structures, 93(9), 2400-2408.
Lukaszewicz 9
Ferenczi, I., Kerscher, S., & Möller, F. (2014). Energy Dissipation and structural integrity in frontal impact.
Paper presented at the 23rd ESV 2013 International Technical Conference on the Enhanced Safety of
the Vehicles, Seoul, Korea.
Garnich, M. (2005). Localized Fibre Waviness and Implications for Failure in Unidirectional Composites.
Journal Of Composite Materials, 39(14), 1225-1245.
Garnich, M., & Karami, G. (2004a). Finite element micromechanics for stiffness and strength of wavy fibre
composites. Journal Of Composite Materials, 38, 273.
Garnich, M., & Karami, G. (2004b). Finite Element Micromechanics for Stiffness and Strength of Wavy Fibre
Composites. Journal Of Composite Materials, 38(4), 273-292.
Hsiao, H. M., & Daniel, I. M. (1996a). Effect of fibre waviness on stiffness and strength reduction of
unidirectional composites under compressive loading. Composites Science And Technology, 56, 581-
593.
Hsiao, H. M., & Daniel, I. M. (1996b). Elastic properties of composites with fibre waviness. Composites Part A-
Applied Science And Manufacturing, 27, 931-941.
Hsiao, H. M., & Daniel, I. M. (1999). Effects of strain rate and fibre waviness on the compressive behaviour of
composite laminates. Paper presented at the ICCM-12, Paris France.
Joffe, R., Mattsson, D., Modniks, J., & Varna, J. (2005). Compressive failure analysis of non-crimp fabric
composites with large out-of-plane misalignment of fibre bundles. Composites Part A: applied science
and manufacturing, 36, 1030-1046.
Lightfoot, J. S., Wisnom, M. R., & Potter, K. (2013a). Defects in woven preforms: formation mechanisms and
the effects of laminate design and layup protocol. Composites Part A, 1-35.
Lightfoot, J. S., Wisnom, M. R., & Potter, K. (2013b). A new mechanism for the formation of ply wrinkles due
to shear between plies. Composites Part A, 49(C), 139-147.
Mrse, A., & Piggott, M. (1993). Compressive properties of unidirectional carbon fibre laminates: II. The effects
of unintentional and intentional fibre misalignments. Composites Science And Technology, 46, 219-227.
Pansart, S., Sinapius, M., & Gabbert, U. (2009). A comprehensive explanation of compression strength
differences between various CFRP materials: Micro-meso model, predictions, parameter studies.
Composites Part A, 40(4), 376-387.
Zimmermann, M., & von Hoessle, J. (2013). Computing solution spaces for robust design. International Journal
for Numerical Methods in Engineering, 94(3), 290-307.
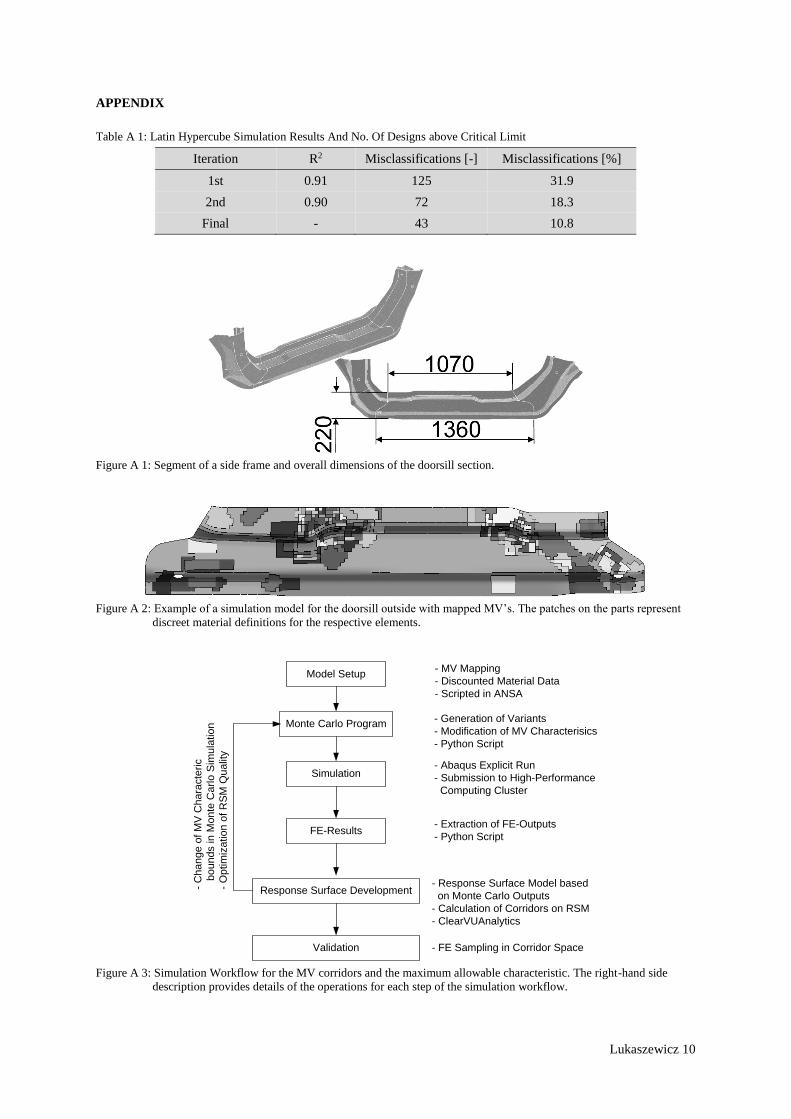
Lukaszewicz 10
APPENDIX
Table A 1: Latin Hypercube Simulation Results And No. Of Designs above Critical Limit
Iteration R2 Misclassifications [-] Misclassifications [%]
1st 0.91 125 31.9
2nd 0.90 72 18.3
Final - 43 10.8
Figure A 1: Segment of a side frame and overall dimensions of the doorsill section.
Figure A 2: Example of a simulation model for the doorsill outside with mapped MV’s. The patches on the parts represent
discreet material definitions for the respective elements.
Figure A 3: Simulation Workflow for the MV corridors and the maximum allowable characteristic. The right-hand side
description provides details of the operations for each step of the simulation workflow.
Model Setup
Monte Carlo Program
Simulation
FE-Results
Response Surface Development
Validation
- MV Mapping- Discounted Material Data- Scripted in ANSA
- Generation of Variants- Modification of MV Characterisics- Python Script
- Abaqus Explicit Run- Submission to High-Performance Computing Cluster
- Extraction of FE-Outputs- Python Script
- Response Surface Model based on Monte Carlo Outputs- Calculation of Corridors on RSM- ClearVUAnalytics
- FE Sampling in Corridor Space
- Cha
nge
of M
V C
hara
cter
ic
bo
unds
in M
onte
Car
lo S
imul
atio
n- O
ptim
izat
ion
of R
SM Q
ualit
y
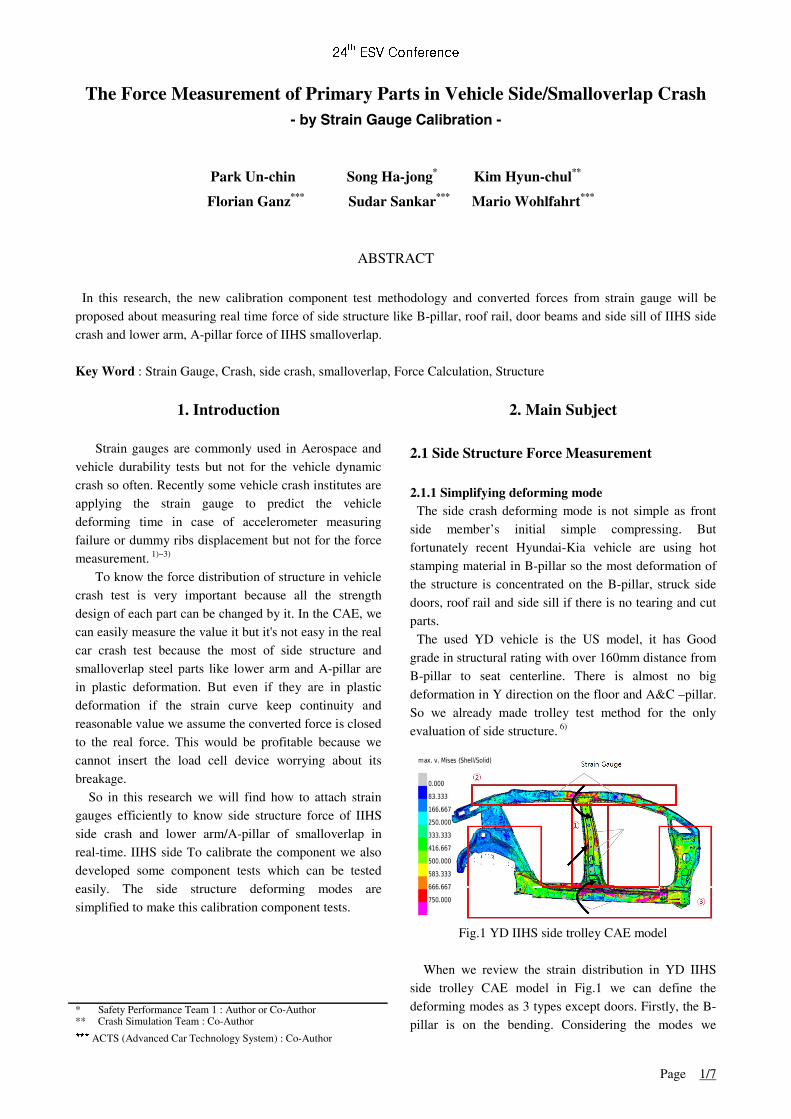
24th ESV Conference
Page 1/7
The Force Measurement of Primary Parts in Vehicle Side/Smalloverlap Crash - by Strain Gauge Calibration -
Park Un-chin Song Ha-jong* Kim Hyun-chul**
Florian Ganz*** Sudar Sankar*** Mario Wohlfahrt***
ABSTRACT
In this research, the new calibration component test methodology and converted forces from strain gauge will be proposed about measuring real time force of side structure like B-pillar, roof rail, door beams and side sill of IIHS side crash and lower arm, A-pillar force of IIHS smalloverlap. Key Word : Strain Gauge, Crash, side crash, smalloverlap, Force Calculation, Structure
1. Introduction
Strain gauges are commonly used in Aerospace and vehicle durability tests but not for the vehicle dynamic crash so often. Recently some vehicle crash institutes are applying the strain gauge to predict the vehicle deforming time in case of accelerometer measuring failure or dummy ribs displacement but not for the force measurement. 1)~3)
To know the force distribution of structure in vehicle crash test is very important because all the strength design of each part can be changed by it. In the CAE, we can easily measure the value it but it's not easy in the real car crash test because the most of side structure and smalloverlap steel parts like lower arm and A-pillar are in plastic deformation. But even if they are in plastic deformation if the strain curve keep continuity and reasonable value we assume the converted force is closed to the real force. This would be profitable because we cannot insert the load cell device worrying about its breakage.
So in this research we will find how to attach strain gauges efficiently to know side structure force of IIHS side crash and lower arm/A-pillar of smalloverlap in real-time. IIHS side To calibrate the component we also developed some component tests which can be tested easily. The side structure deforming modes are simplified to make this calibration component tests.
2. Main Subject
2.1 Side Structure Force Measurement 2.1.1 Simplifying deforming mode
The side crash deforming mode is not simple as front side member’s initial simple compressing. But fortunately recent Hyundai-Kia vehicle are using hot stamping material in B-pillar so the most deformation of the structure is concentrated on the B-pillar, struck side doors, roof rail and side sill if there is no tearing and cut parts.
The used YD vehicle is the US model, it has Good grade in structural rating with over 160mm distance from B-pillar to seat centerline. There is almost no big deformation in Y direction on the floor and A&C –pillar. So we already made trolley test method for the only evaluation of side structure. 6)
Fig.1 YD IIHS side trolley CAE model When we review the strain distribution in YD IIHS
side trolley CAE model in Fig.1 we can define the deforming modes as 3 types except doors. Firstly, the B-pillar is on the bending. Considering the modes we
* Safety Performance Team 1 : Author or Co-Author ** Crash Simulation Team : Co-Author
*** ACTS (Advanced Car Technology System) : Co-Author
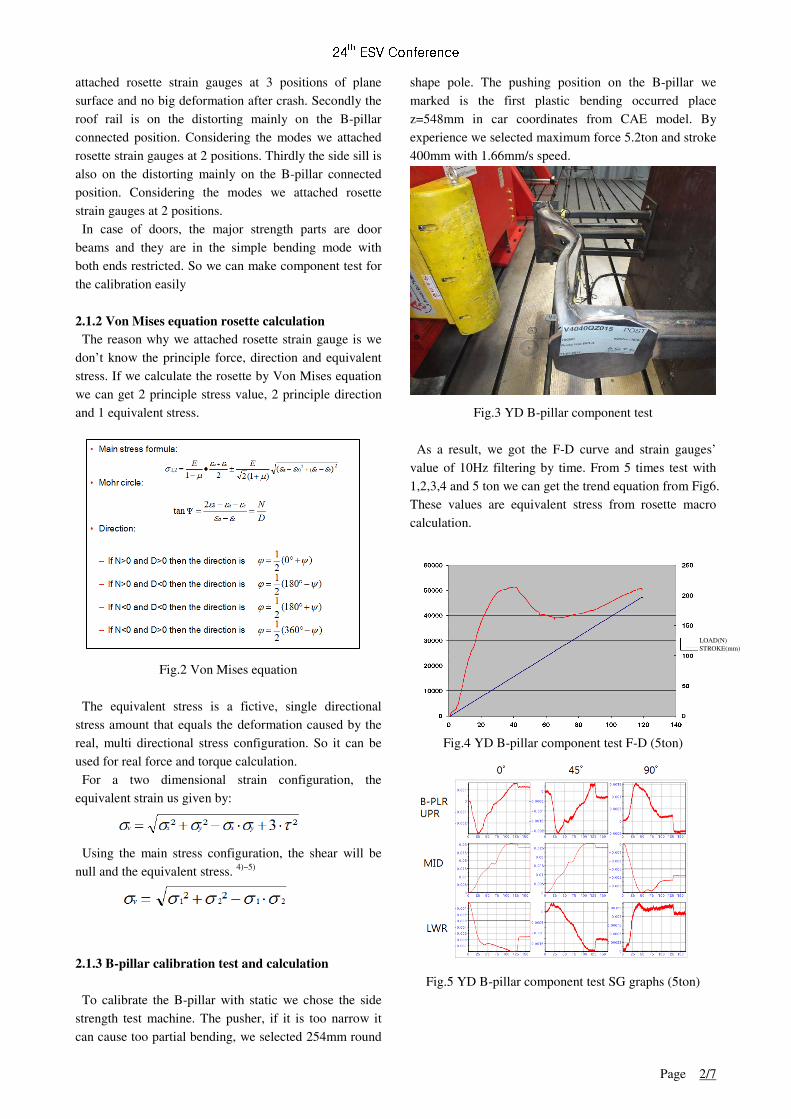
24th ESV Conference
Page 2/7
attached rosette strain gauges at 3 positions of plane surface and no big deformation after crash. Secondly the roof rail is on the distorting mainly on the B-pillar connected position. Considering the modes we attached rosette strain gauges at 2 positions. Thirdly the side sill is also on the distorting mainly on the B-pillar connected position. Considering the modes we attached rosette strain gauges at 2 positions. In case of doors, the major strength parts are door beams and they are in the simple bending mode with both ends restricted. So we can make component test for the calibration easily
2.1.2 Von Mises equation rosette calculation The reason why we attached rosette strain gauge is we
don’t know the principle force, direction and equivalent stress. If we calculate the rosette by Von Mises equation we can get 2 principle stress value, 2 principle direction and 1 equivalent stress.
Fig.2 Von Mises equation The equivalent stress is a fictive, single directional stress amount that equals the deformation caused by the real, multi directional stress configuration. So it can be used for real force and torque calculation. For a two dimensional strain configuration, the equivalent strain us given by:
Using the main stress configuration, the shear will be null and the equivalent stress. 4)~5)
2.1.3 B-pillar calibration test and calculation To calibrate the B-pillar with static we chose the side strength test machine. The pusher, if it is too narrow it can cause too partial bending, we selected 254mm round
shape pole. The pushing position on the B-pillar we marked is the first plastic bending occurred place z=548mm in car coordinates from CAE model. By experience we selected maximum force 5.2ton and stroke 400mm with 1.66mm/s speed.
Fig.3 YD B-pillar component test
As a result, we got the F-D curve and strain gauges’ value of 10Hz filtering by time. From 5 times test with 1,2,3,4 and 5 ton we can get the trend equation from Fig6. These values are equivalent stress from rosette macro calculation.
Fig.4 YD B-pillar component test F-D (5ton)
Fig.5 YD B-pillar component test SG graphs (5ton)
LOAD(N) STROKE(mm)
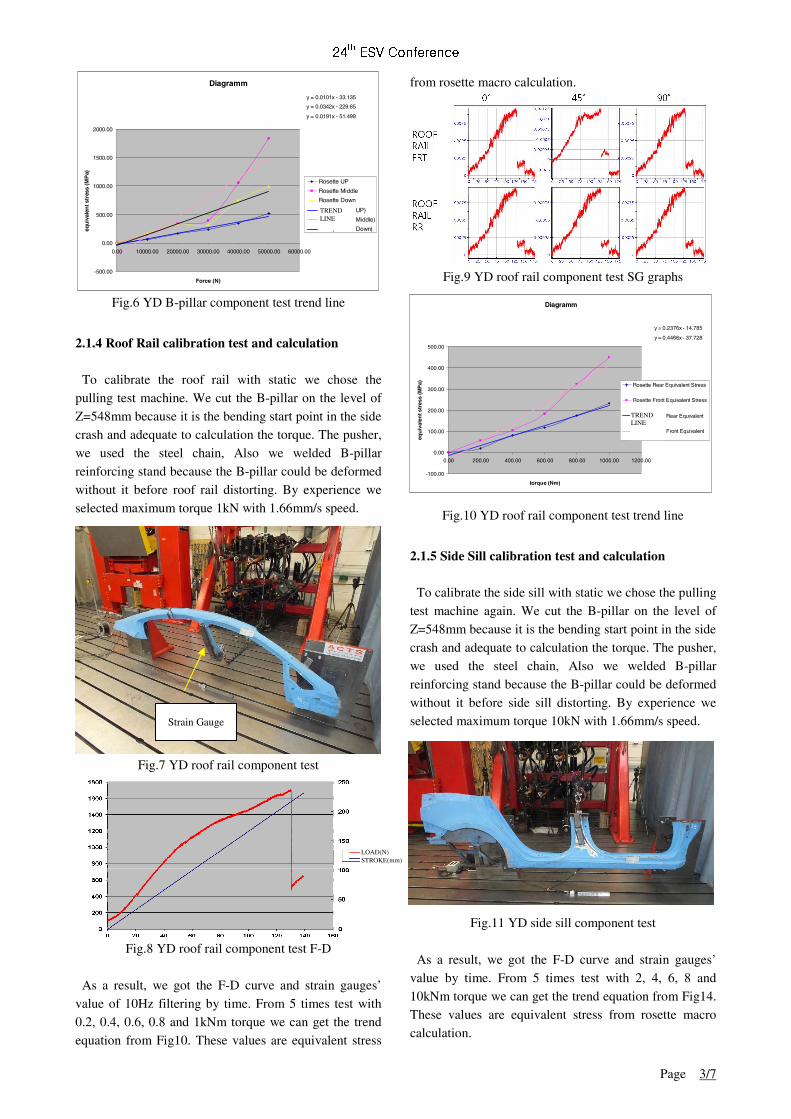
24th ESV Conference
Page 3/7
Fig.6 YD B-pillar component test trend line
2.1.4 Roof Rail calibration test and calculation To calibrate the roof rail with static we chose the pulling test machine. We cut the B-pillar on the level of Z=548mm because it is the bending start point in the side crash and adequate to calculation the torque. The pusher, we used the steel chain, Also we welded B-pillar reinforcing stand because the B-pillar could be deformed without it before roof rail distorting. By experience we selected maximum torque 1kN with 1.66mm/s speed.
Fig.7 YD roof rail component test
Fig.8 YD roof rail component test F-D As a result, we got the F-D curve and strain gauges’
value of 10Hz filtering by time. From 5 times test with 0.2, 0.4, 0.6, 0.8 and 1kNm torque we can get the trend equation from Fig10. These values are equivalent stress
from rosette macro calculation.
Fig.9 YD roof rail component test SG graphs
Fig.10 YD roof rail component test trend line
2.1.5 Side Sill calibration test and calculation To calibrate the side sill with static we chose the pulling test machine again. We cut the B-pillar on the level of Z=548mm because it is the bending start point in the side crash and adequate to calculation the torque. The pusher, we used the steel chain, Also we welded B-pillar reinforcing stand because the B-pillar could be deformed without it before side sill distorting. By experience we selected maximum torque 10kN with 1.66mm/s speed.
Fig.11 YD side sill component test
As a result, we got the F-D curve and strain gauges’ value by time. From 5 times test with 2, 4, 6, 8 and 10kNm torque we can get the trend equation from Fig14. These values are equivalent stress from rosette macro calculation.
Diagramm
y = 0.0101x - 33.135
y = 0.0342x - 229.65
y = 0.0191x - 51.499
-500.00
0.00
500.00
1000.00
1500.00
2000.00
0.00 10000.00 20000.00 30000.00 40000.00 50000.00 60000.00
Force (N)
equ
ival
ent
stre
ss (
MP
a)
Rosette UP
Rosette Middle
Rosette Down
선형 (Rosette UP)
선형 (Rosette Middle)
선형 (Rosette Down)
Diagramm
y = 0.2376x - 14.785
y = 0.4466x - 37.728
-100.00
0.00
100.00
200.00
300.00
400.00
500.00
0.00 200.00 400.00 600.00 800.00 1000.00 1200.00
torque (Nm)
equ
ival
ent s
tres
s (M
Pa) Rosette Rear Equivalent Stress
Rosette Front Equivalent Stress
선형 (Rosette Rear EquivalentStress)
선형 (Rosette Front EquivalentStress )
Strain Gauge
TREND LINE
LOAD(N) STROKE(mm)
TREND LINE
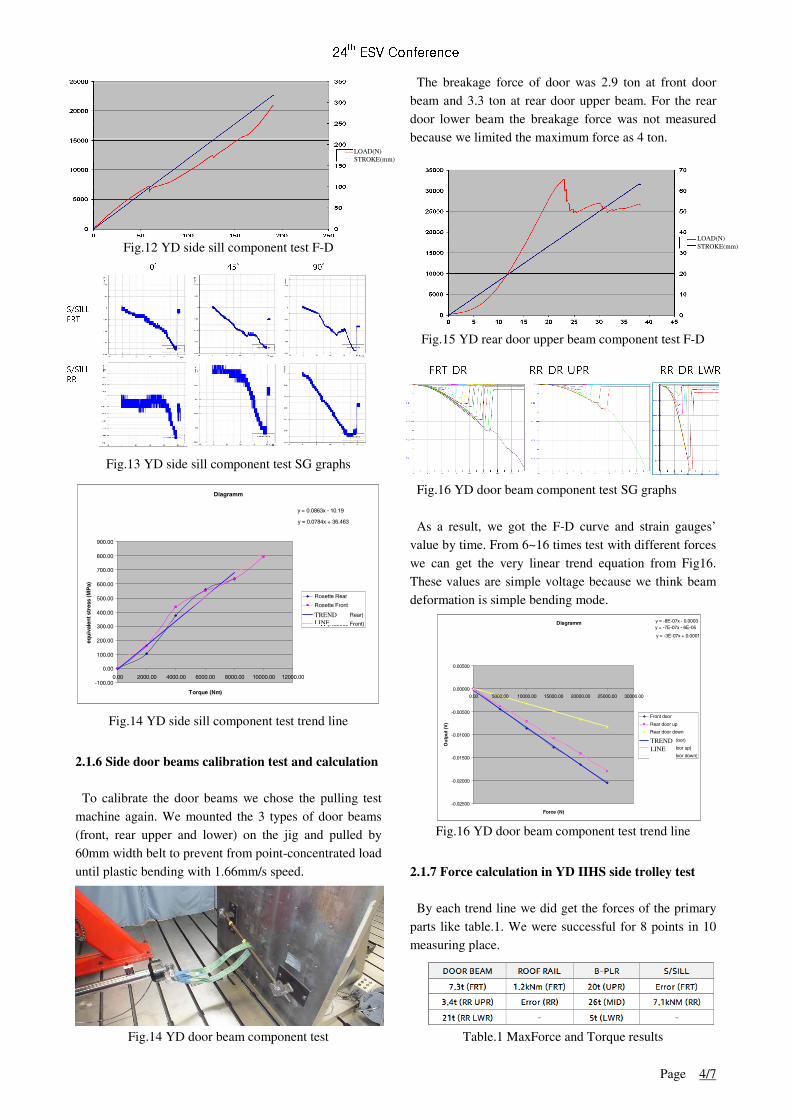
24th ESV Conference
Page 4/7
Fig.12 YD side sill component test F-D
Fig.13 YD side sill component test SG graphs
Fig.14 YD side sill component test trend line
2.1.6 Side door beams calibration test and calculation To calibrate the door beams we chose the pulling test machine again. We mounted the 3 types of door beams (front, rear upper and lower) on the jig and pulled by 60mm width belt to prevent from point-concentrated load until plastic bending with 1.66mm/s speed.
Fig.14 YD door beam component test
The breakage force of door was 2.9 ton at front door beam and 3.3 ton at rear door upper beam. For the rear door lower beam the breakage force was not measured because we limited the maximum force as 4 ton.
Fig.15 YD rear door upper beam component test F-D
Fig.16 YD door beam component test SG graphs As a result, we got the F-D curve and strain gauges’
value by time. From 6~16 times test with different forces we can get the very linear trend equation from Fig16. These values are simple voltage because we think beam deformation is simple bending mode.
Fig.16 YD door beam component test trend line
2.1.7 Force calculation in YD IIHS side trolley test By each trend line we did get the forces of the primary parts like table.1. We were successful for 8 points in 10 measuring place.
Table.1 MaxForce and Torque results
Diagramm
y = 0.0863x - 10.19
y = 0.0784x + 36.463
-100.00
0.00
100.00
200.00
300.00
400.00
500.00
600.00
700.00
800.00
900.00
0.00 2000.00 4000.00 6000.00 8000.00 10000.00 12000.00
Torque (Nm)
equ
ival
ent
stre
ss (
MP
a)
Rosette Rear
Rosette Front
선형 (Rosette Rear)
선형 (Rosette Front) Diagramm y = -8E-07x - 0.0003y = -7E-07x - 6E-05
y = -3E-07x + 0.0001
-0.02500
-0.02000
-0.01500
-0.01000
-0.00500
0.00000
0.00500
0.00 5000.00 10000.00 15000.00 20000.00 25000.00 30000.00
Force (N)
Ou
tpu
t (V
)
Front door
Rear door up
Rear door down
선형 (Front door)
선형 (Rear door up)
선형 (Rear door down)
LOAD(N) STROKE(mm)
TREND LINE
LOAD(N) STROKE(mm)
TREND LINE
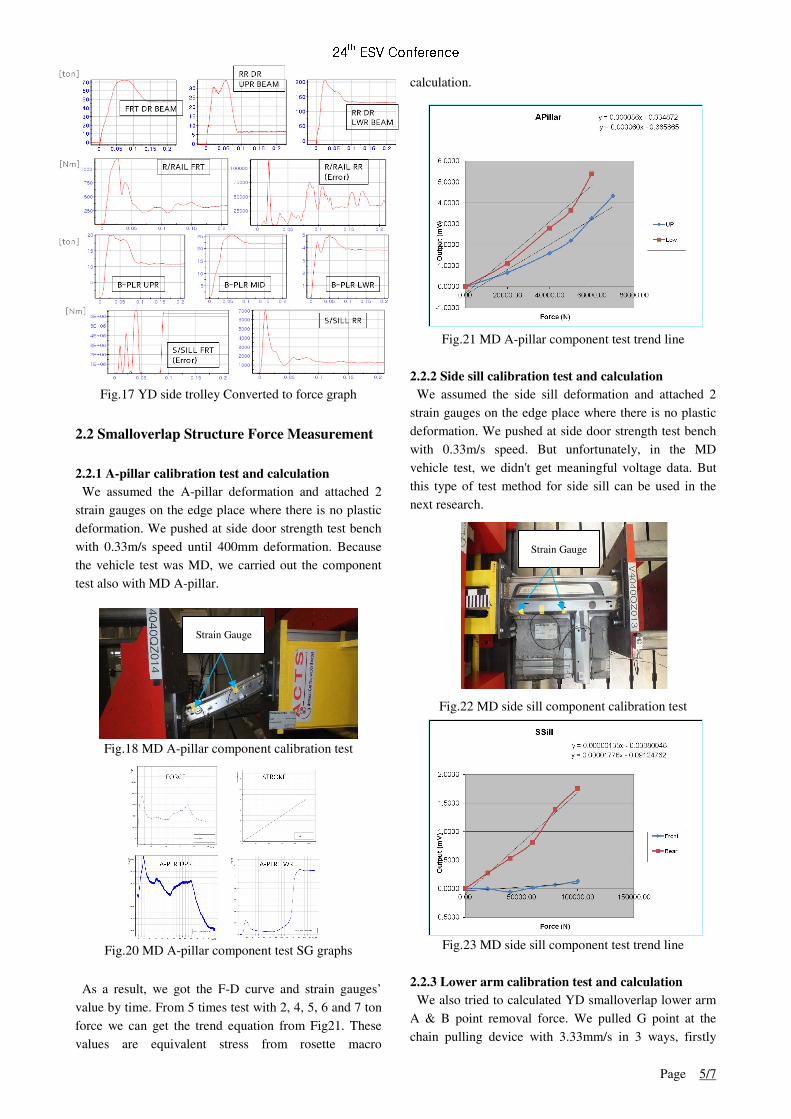
24th ESV Conference
Page 5/7
Fig.17 YD side trolley Converted to force graph 2.2 Smalloverlap Structure Force Measurement 2.2.1 A-pillar calibration test and calculation
We assumed the A-pillar deformation and attached 2 strain gauges on the edge place where there is no plastic deformation. We pushed at side door strength test bench with 0.33m/s speed until 400mm deformation. Because the vehicle test was MD, we carried out the component test also with MD A-pillar.
Fig.18 MD A-pillar component calibration test
Fig.20 MD A-pillar component test SG graphs
As a result, we got the F-D curve and strain gauges’
value by time. From 5 times test with 2, 4, 5, 6 and 7 ton force we can get the trend equation from Fig21. These values are equivalent stress from rosette macro
calculation.
Fig.21 MD A-pillar component test trend line
2.2.2 Side sill calibration test and calculation We assumed the side sill deformation and attached 2 strain gauges on the edge place where there is no plastic deformation. We pushed at side door strength test bench with 0.33m/s speed. But unfortunately, in the MD vehicle test, we didn't get meaningful voltage data. But this type of test method for side sill can be used in the next research.
Fig.22 MD side sill component calibration test
Fig.23 MD side sill component test trend line
2.2.3 Lower arm calibration test and calculation We also tried to calculated YD smalloverlap lower arm A & B point removal force. We pulled G point at the chain pulling device with 3.33mm/s in 3 ways, firstly
Strain Gauge
Strain Gauge
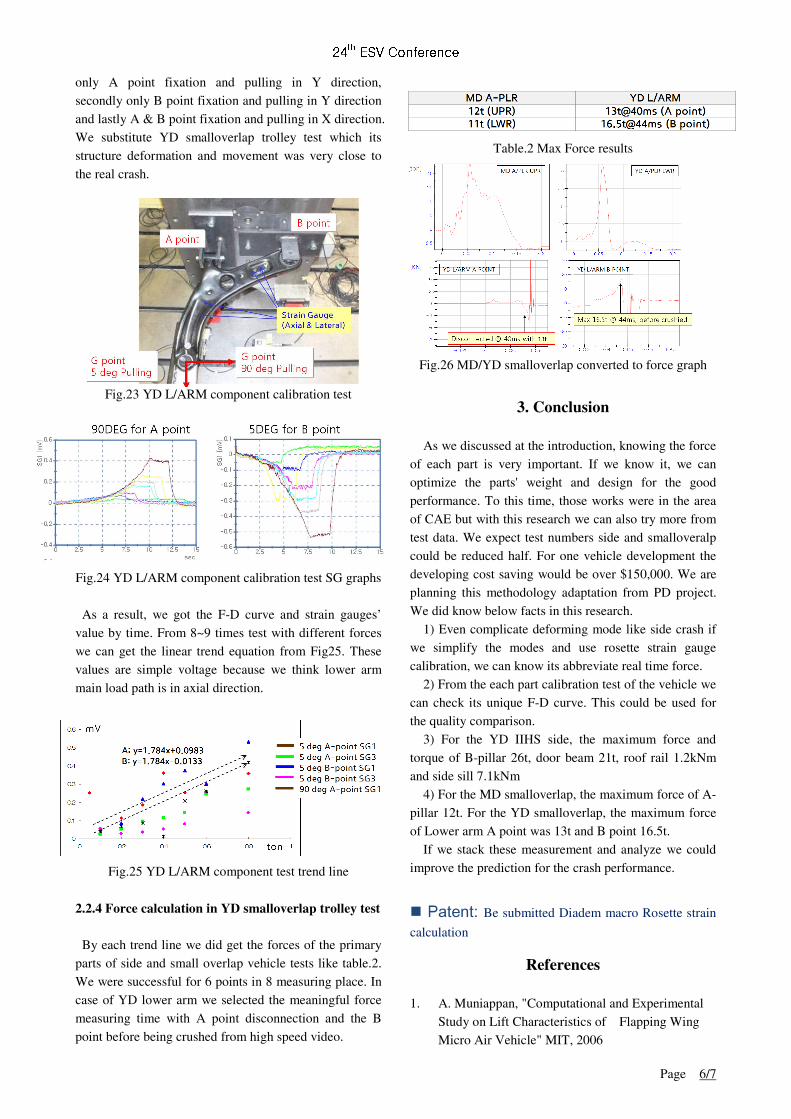
24th ESV Conference
Page 6/7
only A point fixation and pulling in Y direction, secondly only B point fixation and pulling in Y direction and lastly A & B point fixation and pulling in X direction. We substitute YD smalloverlap trolley test which its structure deformation and movement was very close to the real crash.
Fig.23 YD L/ARM component calibration test Fig.24 YD L/ARM component calibration test SG graphs As a result, we got the F-D curve and strain gauges’
value by time. From 8~9 times test with different forces we can get the linear trend equation from Fig25. These values are simple voltage because we think lower arm main load path is in axial direction.
Fig.25 YD L/ARM component test trend line
2.2.4 Force calculation in YD smalloverlap trolley test By each trend line we did get the forces of the primary parts of side and small overlap vehicle tests like table.2. We were successful for 6 points in 8 measuring place. In case of YD lower arm we selected the meaningful force measuring time with A point disconnection and the B point before being crushed from high speed video.
Table.2 Max Force results
Fig.26 MD/YD smalloverlap converted to force graph
3. Conclusion
As we discussed at the introduction, knowing the force of each part is very important. If we know it, we can optimize the parts' weight and design for the good performance. To this time, those works were in the area of CAE but with this research we can also try more from test data. We expect test numbers side and smalloveralp could be reduced half. For one vehicle development the developing cost saving would be over $150,000. We are planning this methodology adaptation from PD project. We did know below facts in this research.
1) Even complicate deforming mode like side crash if we simplify the modes and use rosette strain gauge calibration, we can know its abbreviate real time force.
2) From the each part calibration test of the vehicle we can check its unique F-D curve. This could be used for the quality comparison.
3) For the YD IIHS side, the maximum force and torque of B-pillar 26t, door beam 21t, roof rail 1.2kNm and side sill 7.1kNm
4) For the MD smalloverlap, the maximum force of A-pillar 12t. For the YD smalloverlap, the maximum force of Lower arm A point was 13t and B point 16.5t.
If we stack these measurement and analyze we could improve the prediction for the crash performance.
Patent: Be submitted Diadem macro Rosette strain
calculation
References 1. A. Muniappan, "Computational and Experimental
Study on Lift Characteristics of Flapping Wing Micro Air Vehicle" MIT, 2006
24th ESV Conference
Page 7/7
2. Janko Slavic, "Accelerated Fatigue and Modal Parameter Identification of Lightweight Structures" University of Ljubljana, 2014
3. Paul Lemmen, "Development of an Advanced Thorax / Shoulder Complex for the THOR Dummy" Paul Lemmen and Bernard Been, 2013
4. Karl Hoffmann, "Eine Einfüfrung in die Technik des Messens mit Dehnungsmeßstreifen", Herausgeber: Hottinger Baldwin Messtechnik GmbH, Sarmtadt
5. Herausgegeben von W.Beitz und K.-H., "DUBBEL TASCHENBUCH FÜR DEN MASCHINENBAU" 20. AUFLAGE
6. Park Un-chin "The trolley test way of IIHS small overlap and side test with minimized structure usage", HKMC, 2014
■ Author ■
Park Un-chin Song Ha-jong Kim Hyun-chul Florian Ganz Sudar Sankar Mario Wohlfahrt
Photograph
Photograph
Photograph
Photo graph
Photograph
Photograph
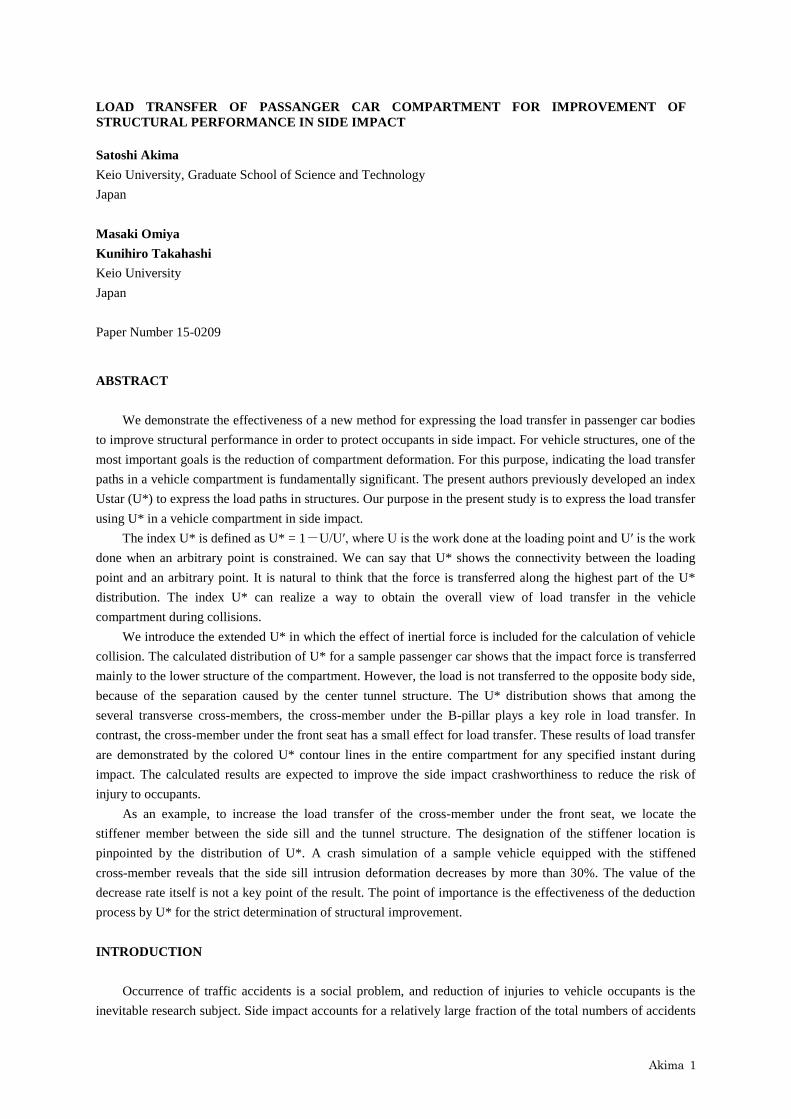
Akima 1
LOAD TRANSFER OF PASSANGER CAR COMPARTMENT FOR IMPROVEMENT OF
STRUCTURAL PERFORMANCE IN SIDE IMPACT
Satoshi Akima
Keio University, Graduate School of Science and Technology
Japan
Masaki Omiya
Kunihiro Takahashi
Keio University
Japan
Paper Number 15-0209
ABSTRACT
We demonstrate the effectiveness of a new method for expressing the load transfer in passenger car bodies
to improve structural performance in order to protect occupants in side impact. For vehicle structures, one of the
most important goals is the reduction of compartment deformation. For this purpose, indicating the load transfer
paths in a vehicle compartment is fundamentally significant. The present authors previously developed an index
Ustar (U*) to express the load paths in structures. Our purpose in the present study is to express the load transfer
using U* in a vehicle compartment in side impact.
The index U* is defined as U* = 1-U/U′, where U is the work done at the loading point and U′ is the work
done when an arbitrary point is constrained. We can say that U* shows the connectivity between the loading
point and an arbitrary point. It is natural to think that the force is transferred along the highest part of the U*
distribution. The index U* can realize a way to obtain the overall view of load transfer in the vehicle
compartment during collisions.
We introduce the extended U* in which the effect of inertial force is included for the calculation of vehicle
collision. The calculated distribution of U* for a sample passenger car shows that the impact force is transferred
mainly to the lower structure of the compartment. However, the load is not transferred to the opposite body side,
because of the separation caused by the center tunnel structure. The U* distribution shows that among the
several transverse cross-members, the cross-member under the B-pillar plays a key role in load transfer. In
contrast, the cross-member under the front seat has a small effect for load transfer. These results of load transfer
are demonstrated by the colored U* contour lines in the entire compartment for any specified instant during
impact. The calculated results are expected to improve the side impact crashworthiness to reduce the risk of
injury to occupants.
As an example, to increase the load transfer of the cross-member under the front seat, we locate the
stiffener member between the side sill and the tunnel structure. The designation of the stiffener location is
pinpointed by the distribution of U*. A crash simulation of a sample vehicle equipped with the stiffened
cross-member reveals that the side sill intrusion deformation decreases by more than 30%. The value of the
decrease rate itself is not a key point of the result. The point of importance is the effectiveness of the deduction
process by U* for the strict determination of structural improvement.
INTRODUCTION
Occurrence of traffic accidents is a social problem, and reduction of injuries to vehicle occupants is the
inevitable research subject. Side impact accounts for a relatively large fraction of the total numbers of accidents
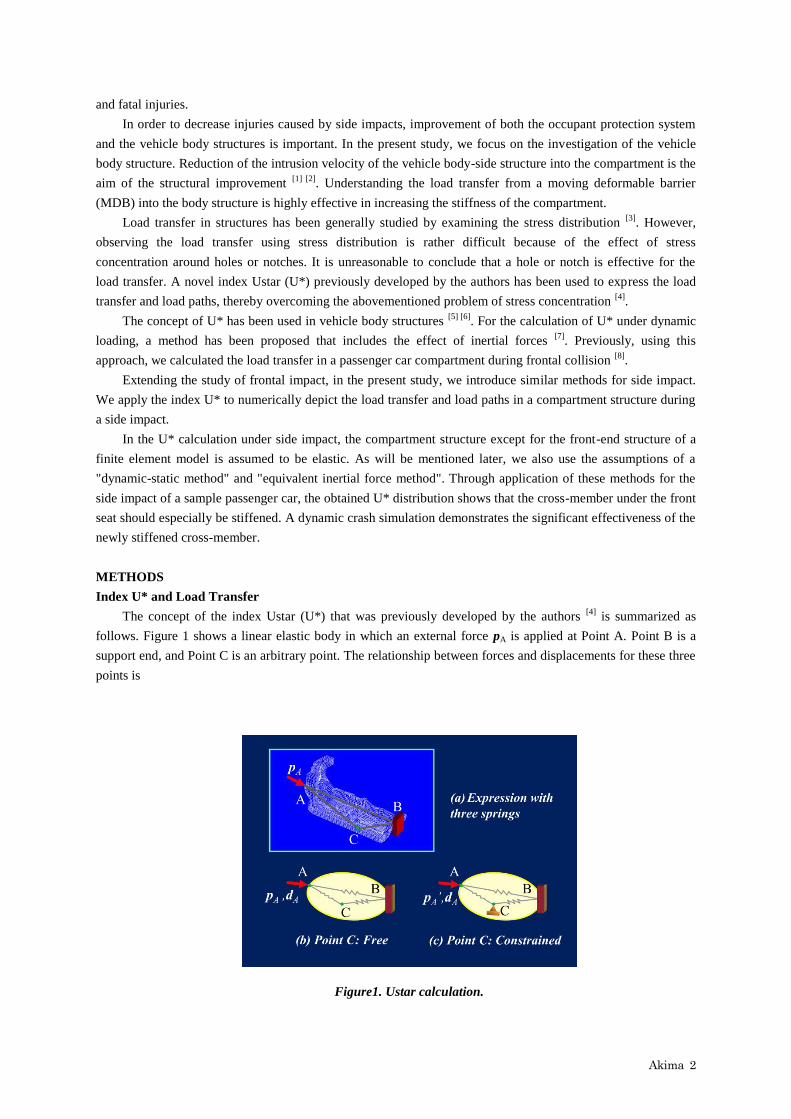
Akima 2
and fatal injuries.
In order to decrease injuries caused by side impacts, improvement of both the occupant protection system
and the vehicle body structures is important. In the present study, we focus on the investigation of the vehicle
body structure. Reduction of the intrusion velocity of the vehicle body-side structure into the compartment is the
aim of the structural improvement [1] [2]
. Understanding the load transfer from a moving deformable barrier
(MDB) into the body structure is highly effective in increasing the stiffness of the compartment.
Load transfer in structures has been generally studied by examining the stress distribution [3]
. However,
observing the load transfer using stress distribution is rather difficult because of the effect of stress
concentration around holes or notches. It is unreasonable to conclude that a hole or notch is effective for the
load transfer. A novel index Ustar (U*) previously developed by the authors has been used to express the load
transfer and load paths, thereby overcoming the abovementioned problem of stress concentration [4]
.
The concept of U* has been used in vehicle body structures [5] [6]
. For the calculation of U* under dynamic
loading, a method has been proposed that includes the effect of inertial forces [7]
. Previously, using this
approach, we calculated the load transfer in a passenger car compartment during frontal collision [8]
.
Extending the study of frontal impact, in the present study, we introduce similar methods for side impact.
We apply the index U* to numerically depict the load transfer and load paths in a compartment structure during
a side impact.
In the U* calculation under side impact, the compartment structure except for the front-end structure of a
finite element model is assumed to be elastic. As will be mentioned later, we also use the assumptions of a
"dynamic-static method" and "equivalent inertial force method". Through application of these methods for the
side impact of a sample passenger car, the obtained U* distribution shows that the cross-member under the front
seat should especially be stiffened. A dynamic crash simulation demonstrates the significant effectiveness of the
newly stiffened cross-member.
METHODS
Index U* and Load Transfer
The concept of the index Ustar (U*) that was previously developed by the authors [4]
is summarized as
follows. Figure 1 shows a linear elastic body in which an external force pA is applied at Point A. Point B is a
support end, and Point C is an arbitrary point. The relationship between forces and displacements for these three
points is
Figure1. Ustar calculation.
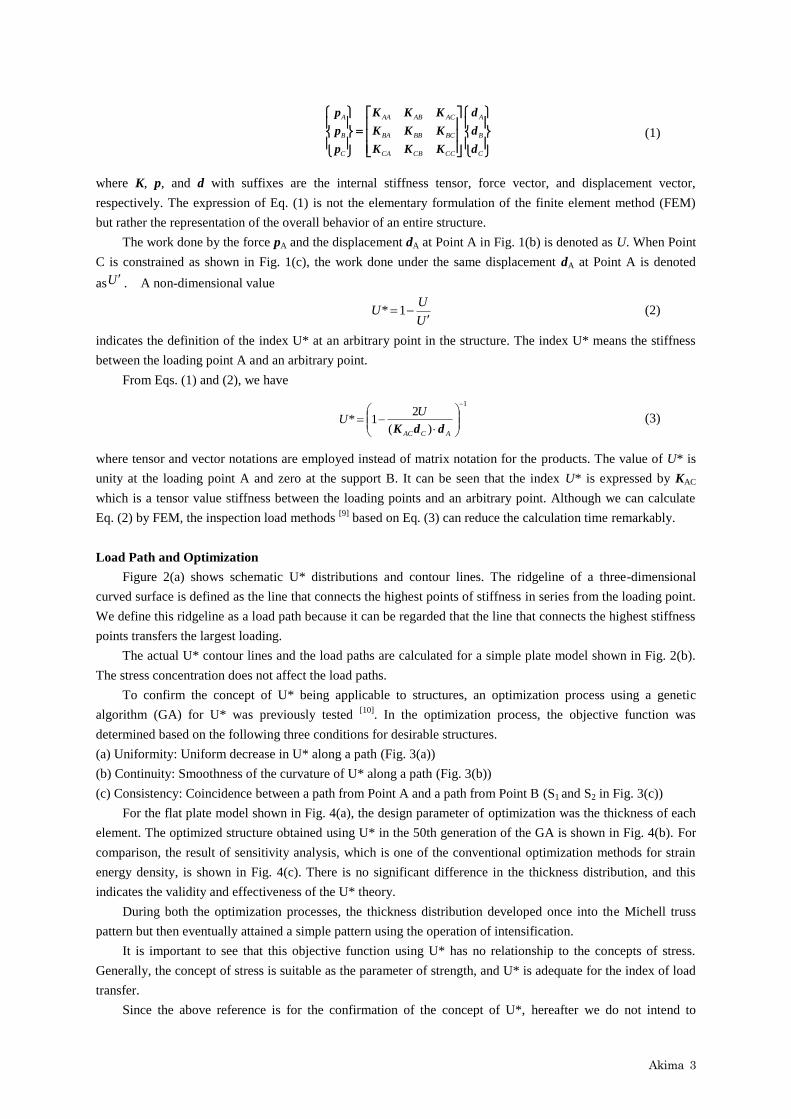
Akima 3
C
B
A
CCCBCA
BCBBBA
ACABAA
C
B
A
d
d
d
KKK
KKK
KKK
p
p
p
(1)
where K, p, and d with suffixes are the internal stiffness tensor, force vector, and displacement vector,
respectively. The expression of Eq. (1) is not the elementary formulation of the finite element method (FEM)
but rather the representation of the overall behavior of an entire structure.
The work done by the force pA and the displacement dA at Point A in Fig. 1(b) is denoted as U. When Point
C is constrained as shown in Fig. 1(c), the work done under the same displacement dA at Point A is denoted
asU . A non-dimensional value
U
UU
1*
(2)
indicates the definition of the index U* at an arbitrary point in the structure. The index U* means the stiffness
between the loading point A and an arbitrary point.
From Eqs. (1) and (2), we have
1
)(
21*
ACAC
UU
ddK
(3)
where tensor and vector notations are employed instead of matrix notation for the products. The value of U* is
unity at the loading point A and zero at the support B. It can be seen that the index U* is expressed by KAC
which is a tensor value stiffness between the loading points and an arbitrary point. Although we can calculate
Eq. (2) by FEM, the inspection load methods [9]
based on Eq. (3) can reduce the calculation time remarkably.
Load Path and Optimization
Figure 2(a) shows schematic U* distributions and contour lines. The ridgeline of a three-dimensional
curved surface is defined as the line that connects the highest points of stiffness in series from the loading point.
We define this ridgeline as a load path because it can be regarded that the line that connects the highest stiffness
points transfers the largest loading.
The actual U* contour lines and the load paths are calculated for a simple plate model shown in Fig. 2(b).
The stress concentration does not affect the load paths.
To confirm the concept of U* being applicable to structures, an optimization process using a genetic
algorithm (GA) for U* was previously tested [10]
. In the optimization process, the objective function was
determined based on the following three conditions for desirable structures.
(a) Uniformity: Uniform decrease in U* along a path (Fig. 3(a))
(b) Continuity: Smoothness of the curvature of U* along a path (Fig. 3(b))
(c) Consistency: Coincidence between a path from Point A and a path from Point B (S1 and S2 in Fig. 3(c))
For the flat plate model shown in Fig. 4(a), the design parameter of optimization was the thickness of each
element. The optimized structure obtained using U* in the 50th generation of the GA is shown in Fig. 4(b). For
comparison, the result of sensitivity analysis, which is one of the conventional optimization methods for strain
energy density, is shown in Fig. 4(c). There is no significant difference in the thickness distribution, and this
indicates the validity and effectiveness of the U* theory.
During both the optimization processes, the thickness distribution developed once into the Michell truss
pattern but then eventually attained a simple pattern using the operation of intensification.
It is important to see that this objective function using U* has no relationship to the concepts of stress.
Generally, the concept of stress is suitable as the parameter of strength, and U* is adequate for the index of load
transfer.
Since the above reference is for the confirmation of the concept of U*, hereafter we do not intend to
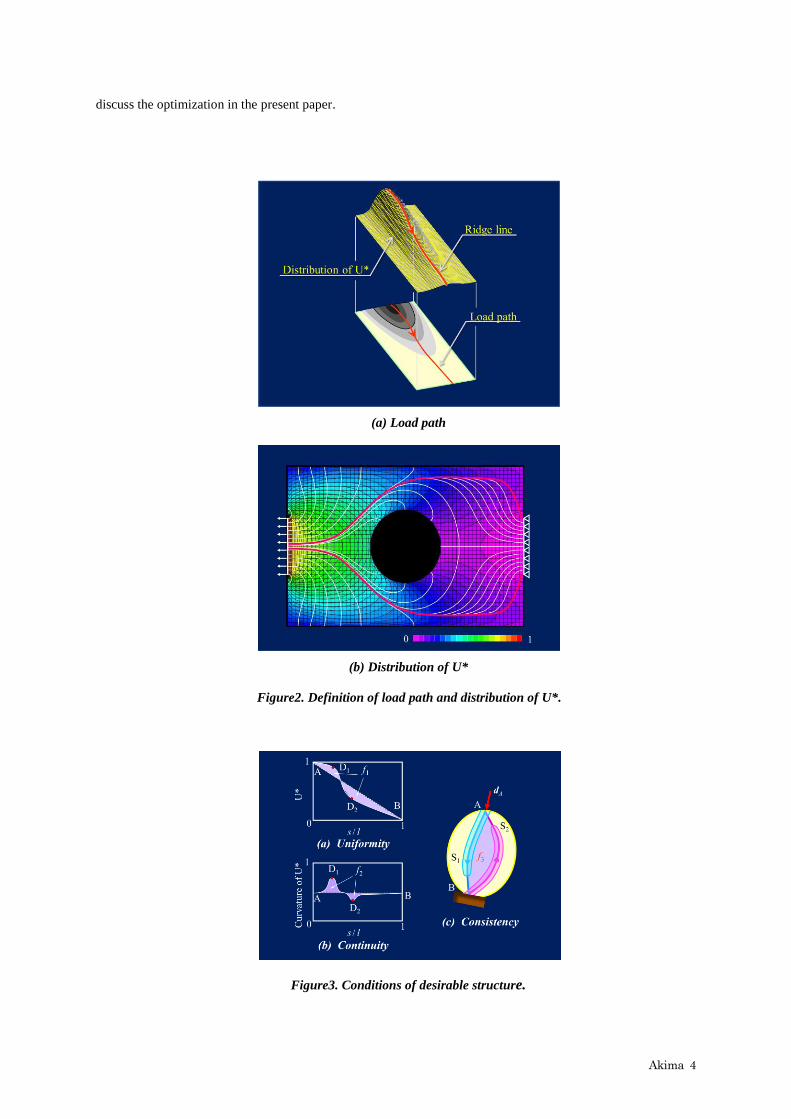
Akima 4
(a) Load path
(b) Distribution of U*
Figure2. Definition of load path and distribution of U*.
discuss the optimization in the present paper.
Figure3. Conditions of desirable structure.
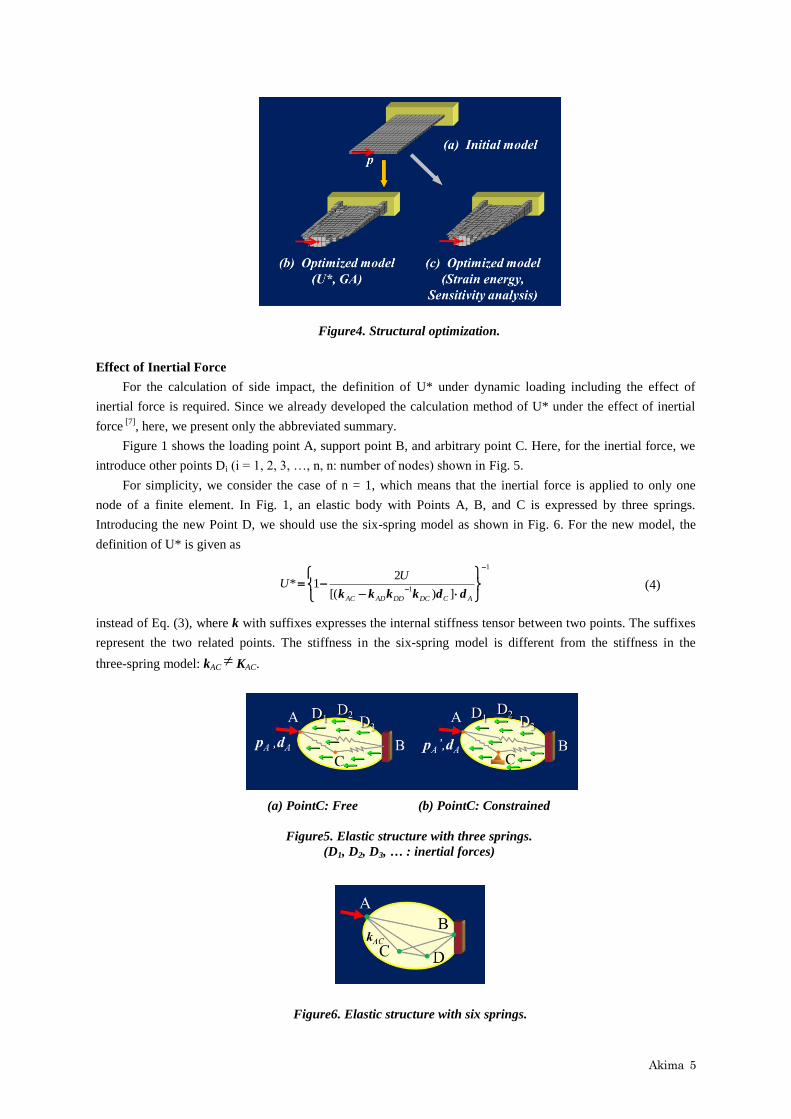
Akima 5
Figure4. Structural optimization.
(a) PointC: Free (b) PointC: Constrained
Figure5. Elastic structure with three springs.
(D1, D2, D3, … : inertial forces)
Effect of Inertial Force
For the calculation of side impact, the definition of U* under dynamic loading including the effect of
inertial force is required. Since we already developed the calculation method of U* under the effect of inertial
force [7]
, here, we present only the abbreviated summary.
Figure 1 shows the loading point A, support point B, and arbitrary point C. Here, for the inertial force, we
introduce other points Di (i = 1, 2, 3, …, n, n: number of nodes) shown in Fig. 5.
For simplicity, we consider the case of n = 1, which means that the inertial force is applied to only one
node of a finite element. In Fig. 1, an elastic body with Points A, B, and C is expressed by three springs.
Introducing the new Point D, we should use the six-spring model as shown in Fig. 6. For the new model, the
definition of U* is given as
1
1])[(
21*
ACDCDDADAC
UU
ddkkkk
(4)
instead of Eq. (3), where k with suffixes expresses the internal stiffness tensor between two points. The suffixes
represent the two related points. The stiffness in the six-spring model is different from the stiffness in the
three-spring model: kAC KAC.
Figure6. Elastic structure with six springs.
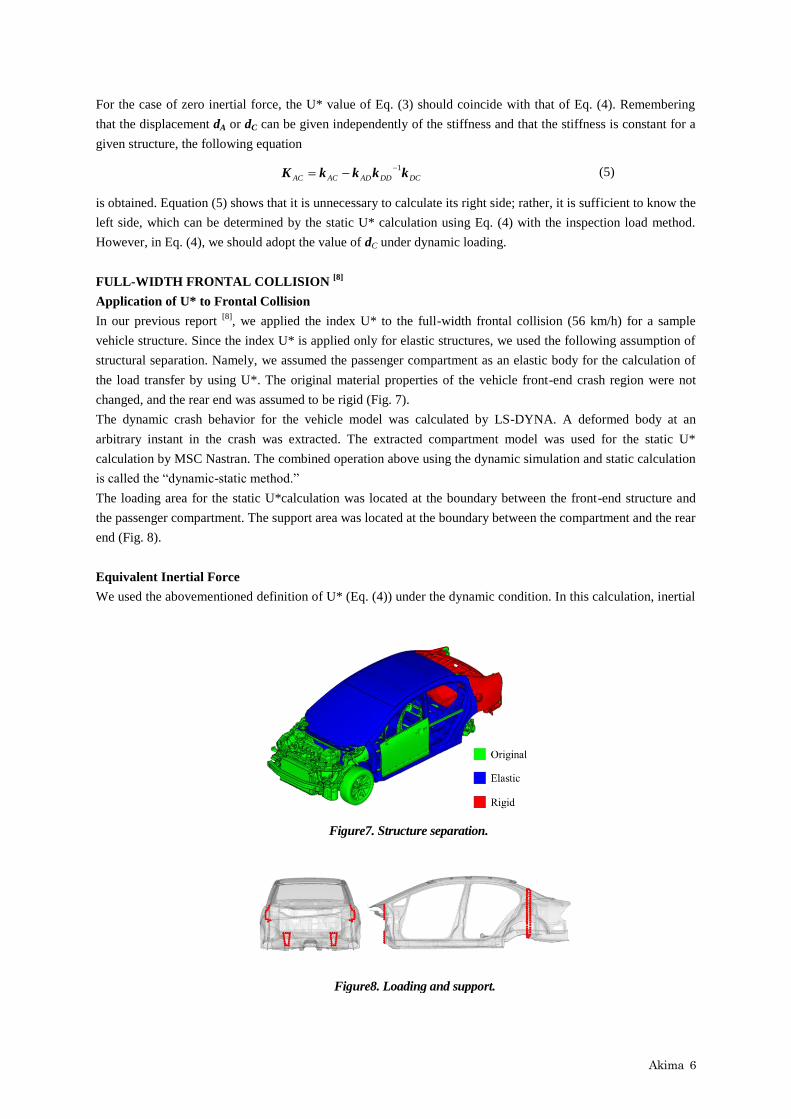
Akima 6
Figure7. Structure separation.
Figure8. Loading and support.
For the case of zero inertial force, the U* value of Eq. (3) should coincide with that of Eq. (4). Remembering
that the displacement dA or dC can be given independently of the stiffness and that the stiffness is constant for a
given structure, the following equation
DCDDADACAC kkkkK1
(5)
is obtained. Equation (5) shows that it is unnecessary to calculate its right side; rather, it is sufficient to know the
left side, which can be determined by the static U* calculation using Eq. (4) with the inspection load method.
However, in Eq. (4), we should adopt the value of dC under dynamic loading.
FULL-WIDTH FRONTAL COLLISION [8]
Application of U* to Frontal Collision
In our previous report [8]
, we applied the index U* to the full-width frontal collision (56 km/h) for a sample
vehicle structure. Since the index U* is applied only for elastic structures, we used the following assumption of
structural separation. Namely, we assumed the passenger compartment as an elastic body for the calculation of
the load transfer by using U*. The original material properties of the vehicle front-end crash region were not
changed, and the rear end was assumed to be rigid (Fig. 7).
The dynamic crash behavior for the vehicle model was calculated by LS-DYNA. A deformed body at an
arbitrary instant in the crash was extracted. The extracted compartment model was used for the static U*
calculation by MSC Nastran. The combined operation above using the dynamic simulation and static calculation
is called the “dynamic-static method.”
The loading area for the static U*calculation was located at the boundary between the front-end structure and
the passenger compartment. The support area was located at the boundary between the compartment and the rear
end (Fig. 8).
Equivalent Inertial Force
We used the abovementioned definition of U* (Eq. (4)) under the dynamic condition. In this calculation, inertial
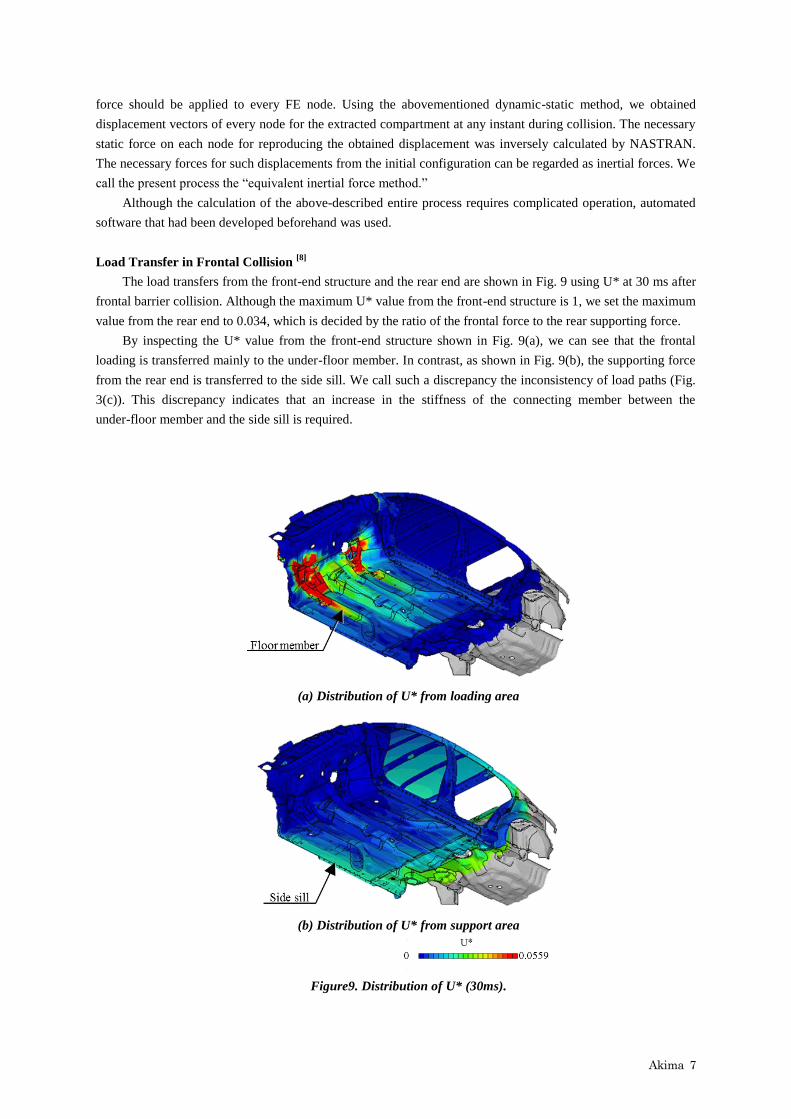
Akima 7
(a) Distribution of U* from loading area
(b) Distribution of U* from support area
Figure9. Distribution of U* (30ms).
force should be applied to every FE node. Using the abovementioned dynamic-static method, we obtained
displacement vectors of every node for the extracted compartment at any instant during collision. The necessary
static force on each node for reproducing the obtained displacement was inversely calculated by NASTRAN.
The necessary forces for such displacements from the initial configuration can be regarded as inertial forces. We
call the present process the “equivalent inertial force method.”
Although the calculation of the above-described entire process requires complicated operation, automated
software that had been developed beforehand was used.
Load Transfer in Frontal Collision [8]
The load transfers from the front-end structure and the rear end are shown in Fig. 9 using U* at 30 ms after
frontal barrier collision. Although the maximum U* value from the front-end structure is 1, we set the maximum
value from the rear end to 0.034, which is decided by the ratio of the frontal force to the rear supporting force.
By inspecting the U* value from the front-end structure shown in Fig. 9(a), we can see that the frontal
loading is transferred mainly to the under-floor member. In contrast, as shown in Fig. 9(b), the supporting force
from the rear end is transferred to the side sill. We call such a discrepancy the inconsistency of load paths (Fig.
3(c)). This discrepancy indicates that an increase in the stiffness of the connecting member between the
under-floor member and the side sill is required.
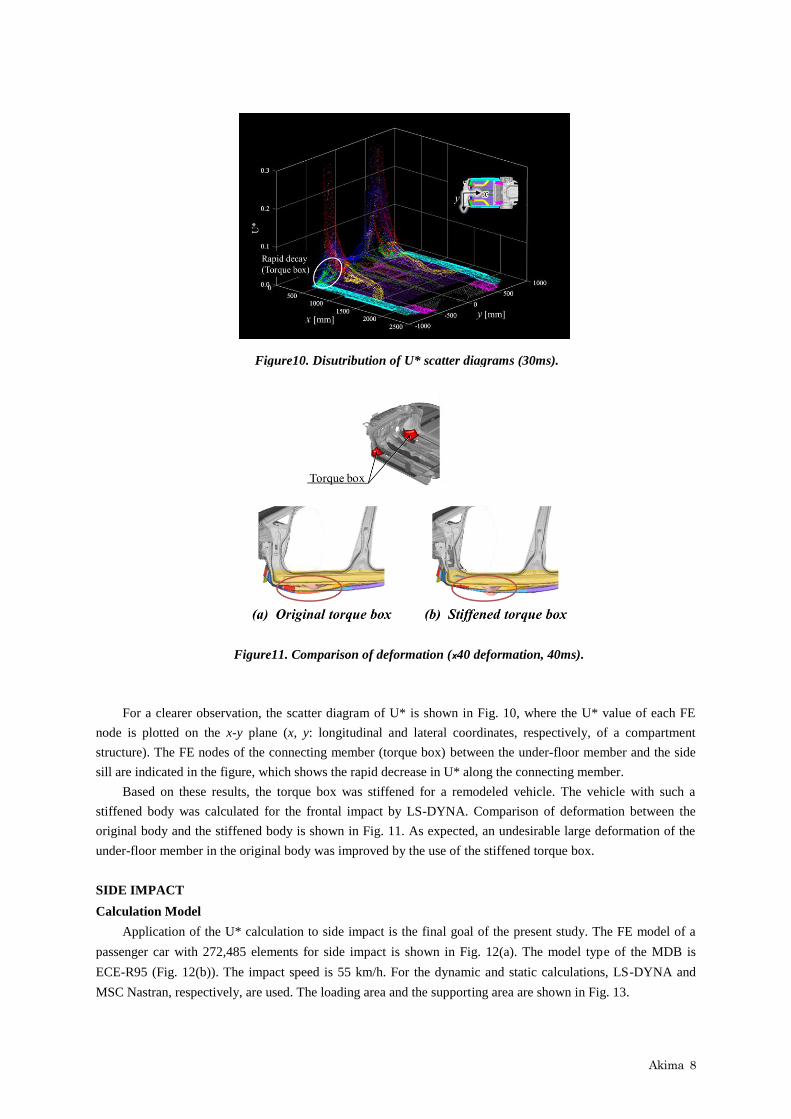
Akima 8
Figure10. Disutribution of U* scatter diagrams (30ms).
Figure11. Comparison of deformation (x40 deformation, 40ms).
For a clearer observation, the scatter diagram of U* is shown in Fig. 10, where the U* value of each FE
node is plotted on the x-y plane (x, y: longitudinal and lateral coordinates, respectively, of a compartment
structure). The FE nodes of the connecting member (torque box) between the under-floor member and the side
sill are indicated in the figure, which shows the rapid decrease in U* along the connecting member.
Based on these results, the torque box was stiffened for a remodeled vehicle. The vehicle with such a
stiffened body was calculated for the frontal impact by LS-DYNA. Comparison of deformation between the
original body and the stiffened body is shown in Fig. 11. As expected, an undesirable large deformation of the
under-floor member in the original body was improved by the use of the stiffened torque box.
SIDE IMPACT
Calculation Model
Application of the U* calculation to side impact is the final goal of the present study. The FE model of a
passenger car with 272,485 elements for side impact is shown in Fig. 12(a). The model type of the MDB is
ECE-R95 (Fig. 12(b)). The impact speed is 55 km/h. For the dynamic and static calculations, LS-DYNA and
MSC Nastran, respectively, are used. The loading area and the supporting area are shown in Fig. 13.
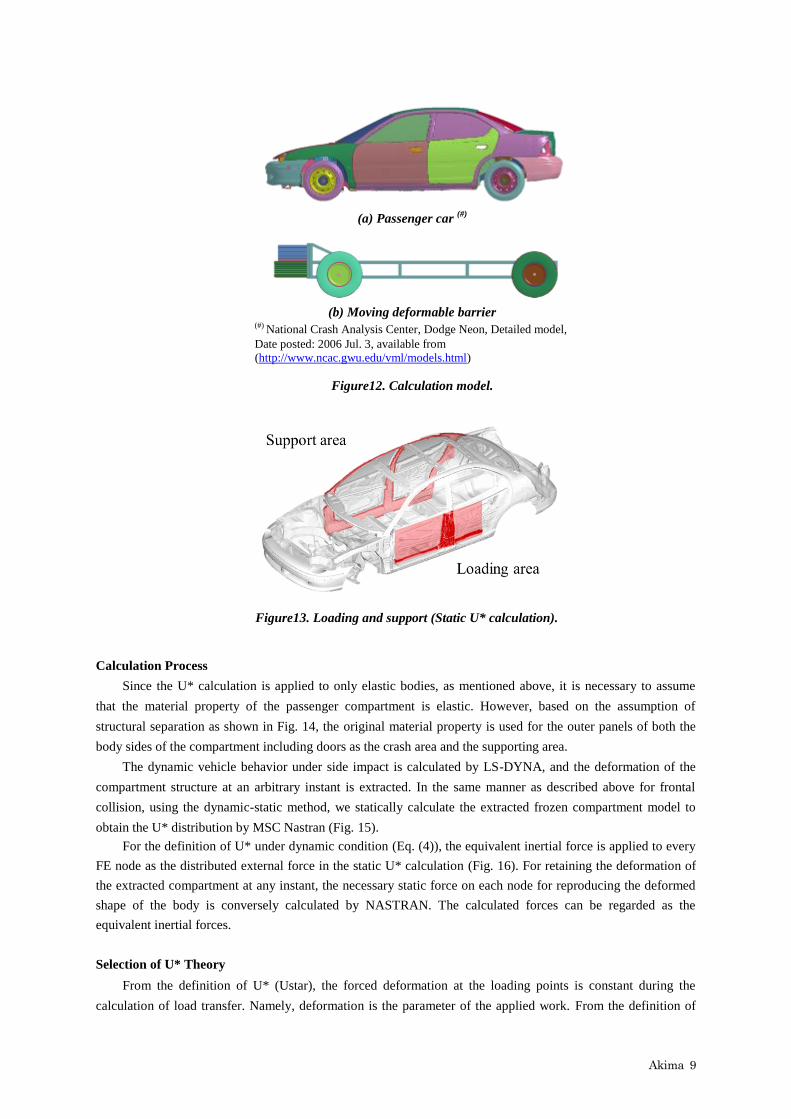
Akima 9
(a) Passenger car
(#)
(b) Moving deformable barrier
(#) National Crash Analysis Center, Dodge Neon, Detailed model,
Date posted: 2006 Jul. 3, available from
(http://www.ncac.gwu.edu/vml/models.html)
Figure12. Calculation model.
Figure13. Loading and support (Static U* calculation).
Calculation Process
Since the U* calculation is applied to only elastic bodies, as mentioned above, it is necessary to assume
that the material property of the passenger compartment is elastic. However, based on the assumption of
structural separation as shown in Fig. 14, the original material property is used for the outer panels of both the
body sides of the compartment including doors as the crash area and the supporting area.
The dynamic vehicle behavior under side impact is calculated by LS-DYNA, and the deformation of the
compartment structure at an arbitrary instant is extracted. In the same manner as described above for frontal
collision, using the dynamic-static method, we statically calculate the extracted frozen compartment model to
obtain the U* distribution by MSC Nastran (Fig. 15).
For the definition of U* under dynamic condition (Eq. (4)), the equivalent inertial force is applied to every
FE node as the distributed external force in the static U* calculation (Fig. 16). For retaining the deformation of
the extracted compartment at any instant, the necessary static force on each node for reproducing the deformed
shape of the body is conversely calculated by NASTRAN. The calculated forces can be regarded as the
equivalent inertial forces.
Selection of U* Theory
From the definition of U* (Ustar), the forced deformation at the loading points is constant during the
calculation of load transfer. Namely, deformation is the parameter of the applied work. From the definition of
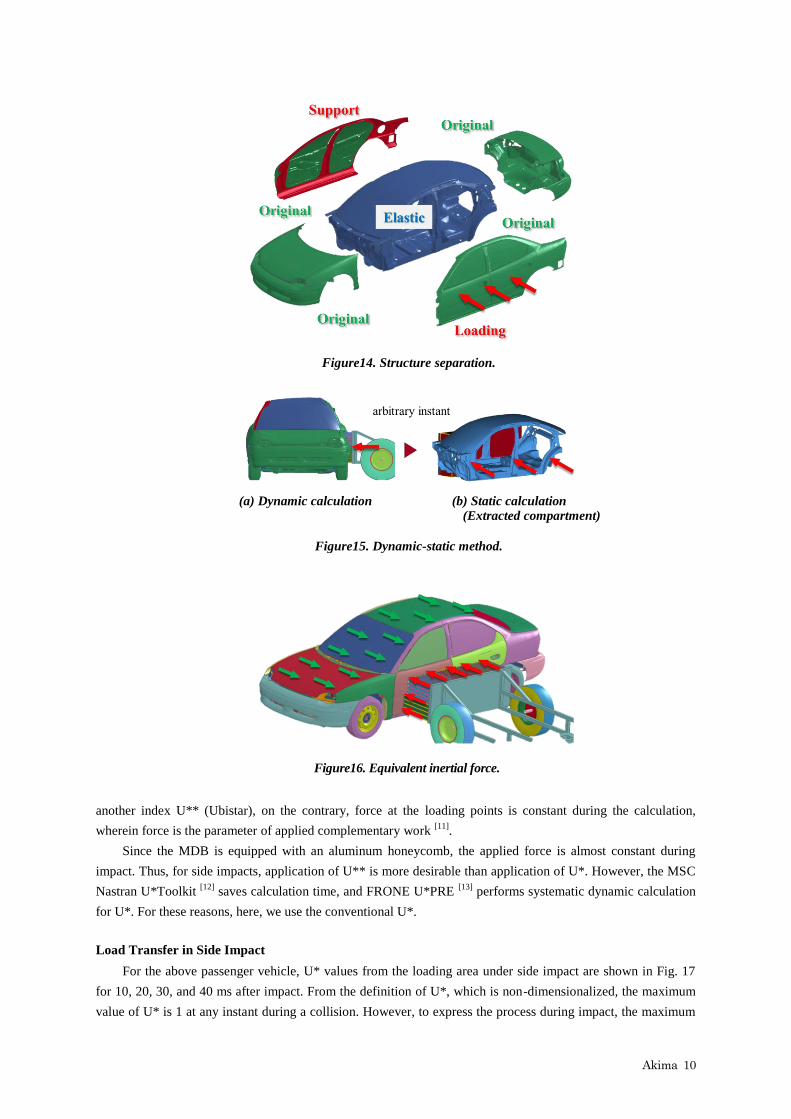
Akima 10
Figure14. Structure separation.
(a) Dynamic calculation (b) Static calculation
(Extracted compartment)
Figure15. Dynamic-static method.
Figure16. Equivalent inertial force.
another index U** (Ubistar), on the contrary, force at the loading points is constant during the calculation,
wherein force is the parameter of applied complementary work [11]
.
Since the MDB is equipped with an aluminum honeycomb, the applied force is almost constant during
impact. Thus, for side impacts, application of U** is more desirable than application of U*. However, the MSC
Nastran U*Toolkit [12]
saves calculation time, and FRONE U*PRE [13]
performs systematic dynamic calculation
for U*. For these reasons, here, we use the conventional U*.
Load Transfer in Side Impact
For the above passenger vehicle, U* values from the loading area under side impact are shown in Fig. 17
for 10, 20, 30, and 40 ms after impact. From the definition of U*, which is non-dimensionalized, the maximum
value of U* is 1 at any instant during a collision. However, to express the process during impact, the maximum
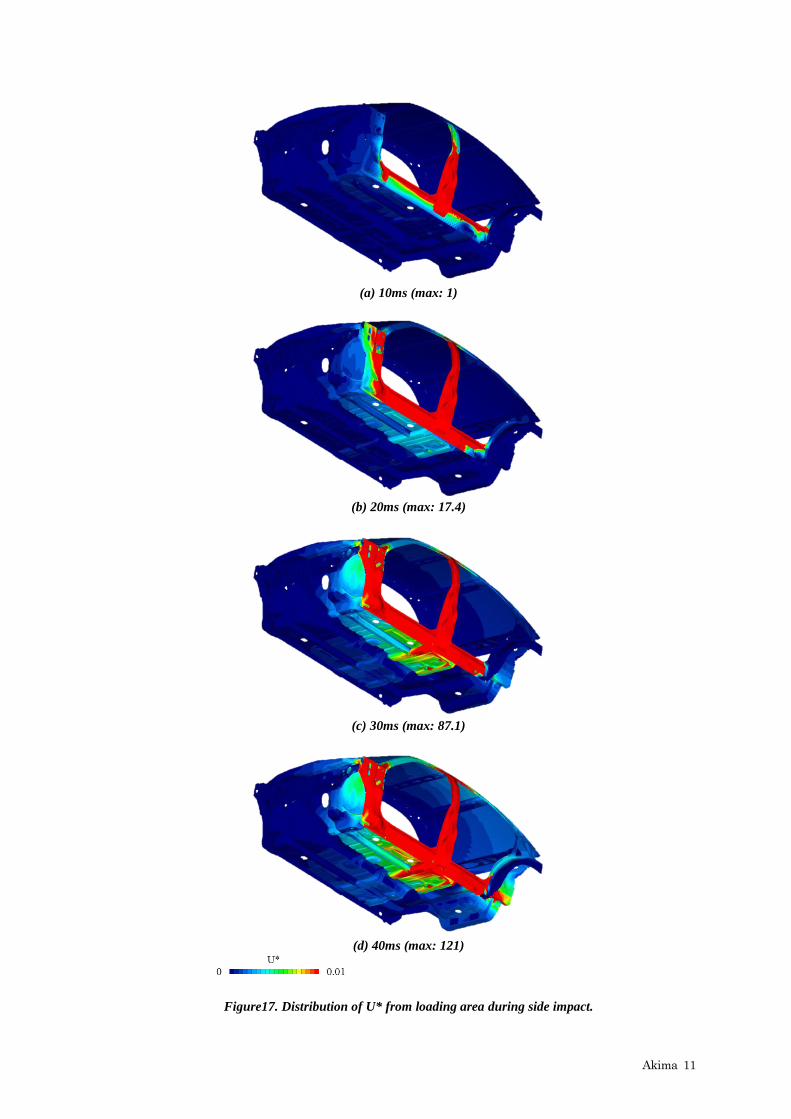
Akima 11
(a) 10ms (max: 1)
(b) 20ms (max: 17.4)
(c) 30ms (max: 87.1)
(d) 40ms (max: 121)
Figure17. Distribution of U* from loading area during side impact.
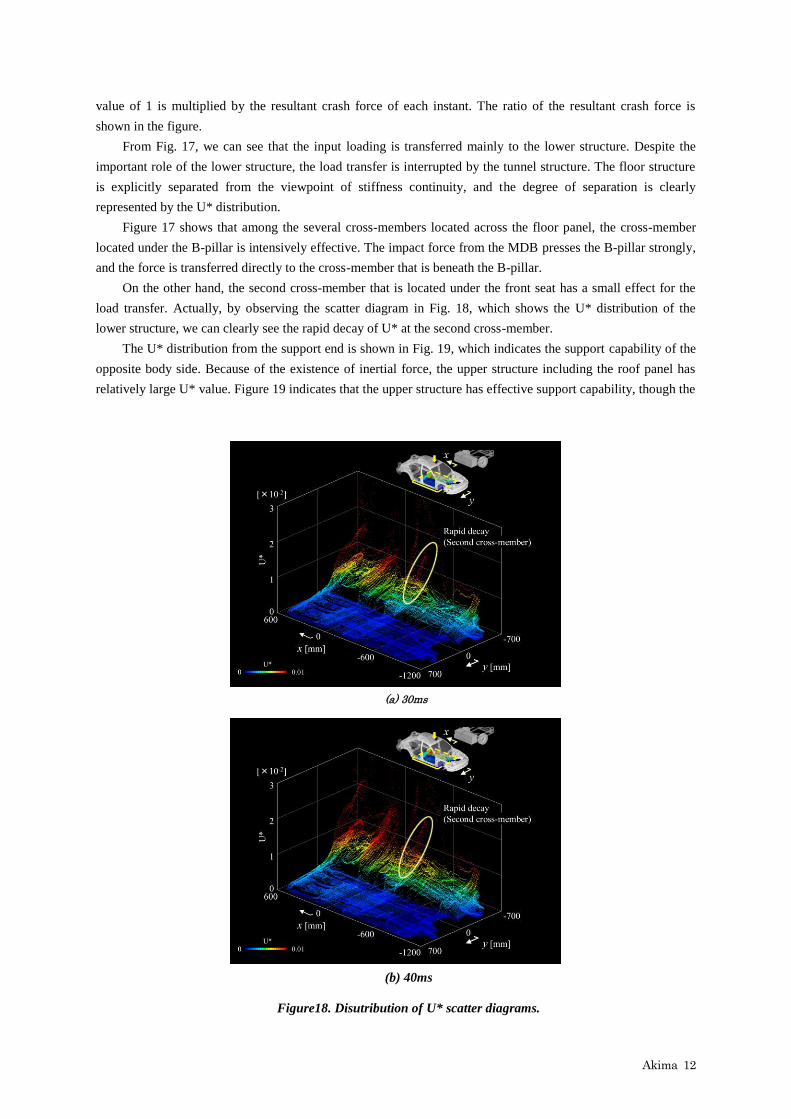
Akima 12
(a) 30ms
(b) 40ms
Figure18. Disutribution of U* scatter diagrams.
value of 1 is multiplied by the resultant crash force of each instant. The ratio of the resultant crash force is
shown in the figure.
From Fig. 17, we can see that the input loading is transferred mainly to the lower structure. Despite the
important role of the lower structure, the load transfer is interrupted by the tunnel structure. The floor structure
is explicitly separated from the viewpoint of stiffness continuity, and the degree of separation is clearly
represented by the U* distribution.
Figure 17 shows that among the several cross-members located across the floor panel, the cross-member
located under the B-pillar is intensively effective. The impact force from the MDB presses the B-pillar strongly,
and the force is transferred directly to the cross-member that is beneath the B-pillar.
On the other hand, the second cross-member that is located under the front seat has a small effect for the
load transfer. Actually, by observing the scatter diagram in Fig. 18, which shows the U* distribution of the
lower structure, we can clearly see the rapid decay of U* at the second cross-member.
The U* distribution from the support end is shown in Fig. 19, which indicates the support capability of the
opposite body side. Because of the existence of inertial force, the upper structure including the roof panel has
relatively large U* value. Figure 19 indicates that the upper structure has effective support capability, though the
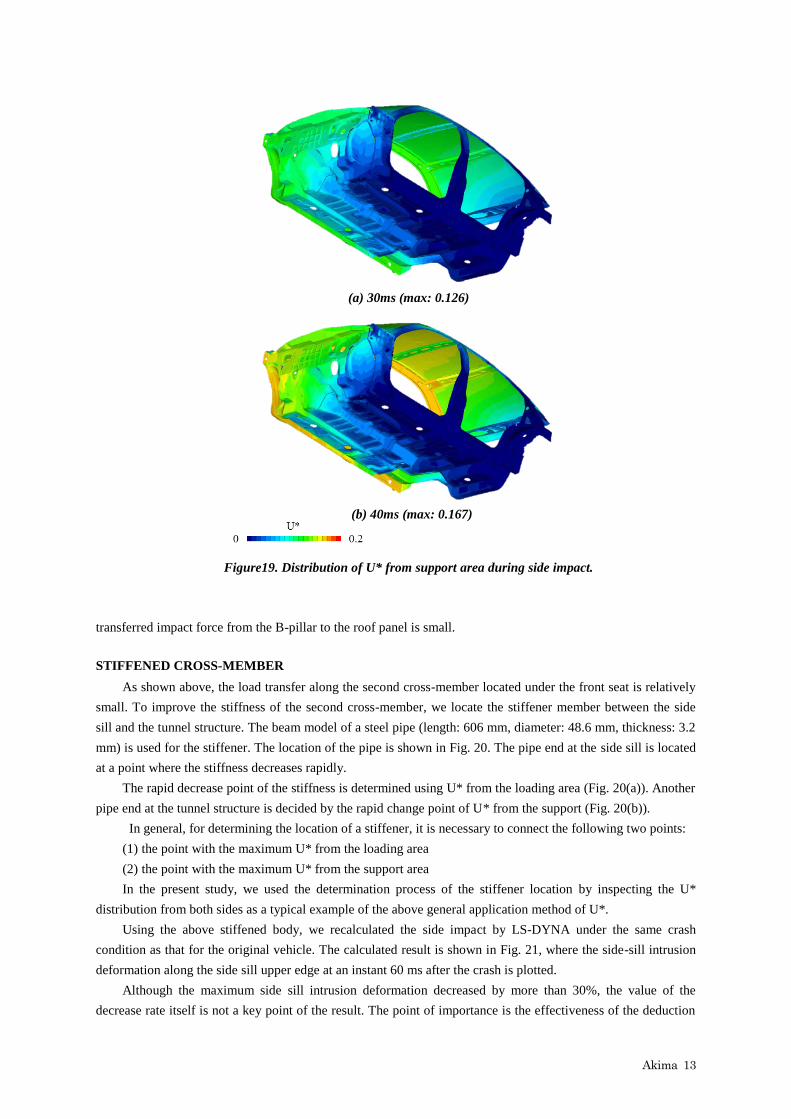
Akima 13
(a) 30ms (max: 0.126)
(b) 40ms (max: 0.167)
Figure19. Distribution of U* from support area during side impact.
transferred impact force from the B-pillar to the roof panel is small.
STIFFENED CROSS-MEMBER
As shown above, the load transfer along the second cross-member located under the front seat is relatively
small. To improve the stiffness of the second cross-member, we locate the stiffener member between the side
sill and the tunnel structure. The beam model of a steel pipe (length: 606 mm, diameter: 48.6 mm, thickness: 3.2
mm) is used for the stiffener. The location of the pipe is shown in Fig. 20. The pipe end at the side sill is located
at a point where the stiffness decreases rapidly.
The rapid decrease point of the stiffness is determined using U* from the loading area (Fig. 20(a)). Another
pipe end at the tunnel structure is decided by the rapid change point of U* from the support (Fig. 20(b)).
In general, for determining the location of a stiffener, it is necessary to connect the following two points:
(1) the point with the maximum U* from the loading area
(2) the point with the maximum U* from the support area
In the present study, we used the determination process of the stiffener location by inspecting the U*
distribution from both sides as a typical example of the above general application method of U*.
Using the above stiffened body, we recalculated the side impact by LS-DYNA under the same crash
condition as that for the original vehicle. The calculated result is shown in Fig. 21, where the side-sill intrusion
deformation along the side sill upper edge at an instant 60 ms after the crash is plotted.
Although the maximum side sill intrusion deformation decreased by more than 30%, the value of the
decrease rate itself is not a key point of the result. The point of importance is the effectiveness of the deduction
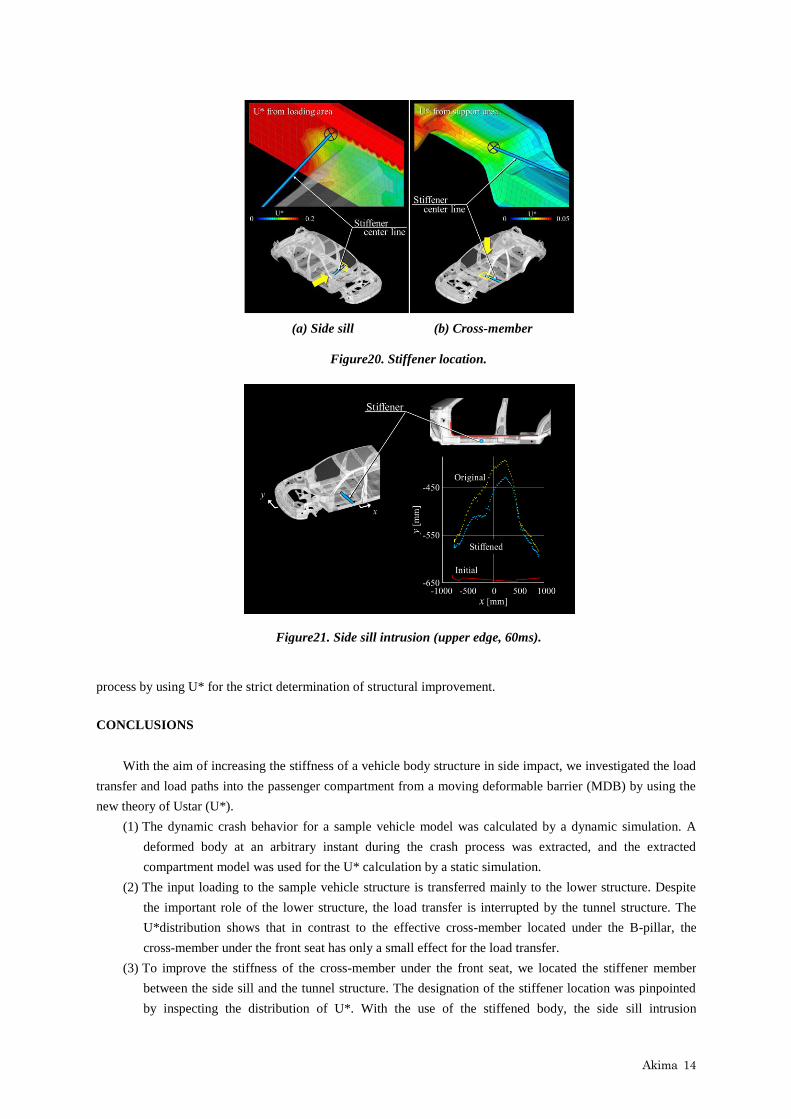
Akima 14
(a) Side sill (b) Cross-member
Figure20. Stiffener location.
Figure21. Side sill intrusion (upper edge, 60ms).
process by using U* for the strict determination of structural improvement.
CONCLUSIONS
With the aim of increasing the stiffness of a vehicle body structure in side impact, we investigated the load
transfer and load paths into the passenger compartment from a moving deformable barrier (MDB) by using the
new theory of Ustar (U*).
(1) The dynamic crash behavior for a sample vehicle model was calculated by a dynamic simulation. A
deformed body at an arbitrary instant during the crash process was extracted, and the extracted
compartment model was used for the U* calculation by a static simulation.
(2) The input loading to the sample vehicle structure is transferred mainly to the lower structure. Despite
the important role of the lower structure, the load transfer is interrupted by the tunnel structure. The
U*distribution shows that in contrast to the effective cross-member located under the B-pillar, the
cross-member under the front seat has only a small effect for the load transfer.
(3) To improve the stiffness of the cross-member under the front seat, we located the stiffener member
between the side sill and the tunnel structure. The designation of the stiffener location was pinpointed
by inspecting the distribution of U*. With the use of the stiffened body, the side sill intrusion
Akima 15
deformation improved by more than 30%.
ACKNOWLEDGEMENT
The authors would like to express their deepest gratitude to Prof. T. Maki, Prof. T. Sakurai, Mr. T. Iso, and
Mr. Y. Zaiki for their helpful collaboration.
REFFERENCES
[1] Mangala, M. J., “2-Door Vehicle Body Local Force Evaluation with the IIHS, EuroNCAP and LINCAP
Side Impact Barriers”, SAE Technical Papers, 2004-01-0333 (2004)
[2] Abe, A., Sunakawa, T., Fujii, S., Fukushima, M. and Ogawa, S., “Aggressivity-Reducing Structure of
Large Vehicle in Side Vehicle-to-Vehicle Crash”, SAE Technical Papers, 2005-01-1355 (2005)
[3] Marhadi, K. and Venkataraman, S., “Comparison of Quantitative and Qualitative Information Provided
by Different Structural Load Path Definitions” , Int. J. Simul. Multidisci. Des. Optim., Vol.3, p.384-400
(2009)
[4] Takahashi, K. and Sakurai, T., “Expression of Load Transfer Paths in Structures”, Trans. JSME Ser. A,
Vol.71, No.708, p.1097-1102 (2005) (in Japanese)
[5] Hoshino, H., Sakurai, T. and Takahashi, K., “Vibration reduction in the Cabins of Heavy-Duty Trucks
Using the Theory of Load Transfer Paths”, JSAE Review, Vol.24, p.165-171 (2003)
[6] Naito, T., Kobayashi, H., Urushiyama, Y. and Takahashi, K., “Introduction of New Concept of U*sum
for Evaluation of Weight-Efficient Structure”, SAE Int. J. Passeng. Cars – Electron. Electr. Syst., Vol.4,
Issue 1 (2011)
[7] Takahashi, K., Omiya, M., Iso, T., Zaiki, Y., Sakurai, T., Maki, T., Naito, T. and Urushiyama, Y.,
“Load Transfer Ustar (U*) Calculation in Structures under Dynamic Loading”, Trans. JSME Ser. A,
Vol.79, No.807, p.1657-1668 (2013) (in Japanese)
[8] Sakurai, T., Nonaka, D., Takahashi, K., Omiya, M., Naito, T., Urushiyama, Y. and Maki, T.,
“Application of Load Transfer Ustar Calculation to Cabin Structures under Frontal Collision” , Proceedings
of 2014 JSAE Annual Congress, No.78-14, p.3-6 (2014) (in Japanese)
[9] Sakurai, T., Takahashi, K., Kawakami, H. and Abe, M., “Reduction of Calculation Time for Load Path
U* Analysis of Structures”, Journal of Solid Mechanics and Materials Engineering, Vol.1, No.11,
p.1322-1330 (2007)
[10] Kamimura, M., Hatta, Y., Ito, S., Koga, Y., Sakurai, T. and Takahashi, K., “Structural Optimization
and Load Paths”, Trans. JSME Ser. A, Vol.74, No.737, p.6-12 (2008) (in Japanese)
[11] Wang, E., Yoshikuni, Y., Guo, Q., Nohara, T., Ishii, H., Hoshino, H. and Takahashi, K., “Load Path
U** Analysis of Truck Cab Structure under Frontal Collision”, Proceedings of 2009 JSAE Annual
Congress, No.21-09, p.5-8 (2009)
[12] MSC Nastran U*Toolkit, available from
(http://pages.mscsoftware.com/rs/mscsoftware/images/NastranUserMeeting-MSC-Ustar.pdf),
(accessed 2015-3-16)
[13] FRONE U*PRE, available from
(https://drive.google.com/folderview?id=0B23OQ8Pgk40VX3hubUpJaXNFaTA&usp=sharing ),
(accessed 2015-3-16)
Pal 1
DEVELOPMENT OF HIGH EFFFICIENCY LOAD PATH STRUCTURE TO ENHANCE SIDE IMPACT SAFETY PERFORMANCE Chinmoy Pal Tomosaburo Okabe Masato Sakurai Makita Masashi Nissan Motor Co., Ltd. Japan Kulothungan, Vimalathithan RNTBCI India Paper Number 15-0363 ABSTRACT In order to protect the occupants effectively in side impact crashes, the main tasks are (a) to minimize the intrusion of the deformed body structure after the impact in order to reduce direct contact force with the occupant and (b) to reduce the relative impact velocity of the intruding structure at the start of contact with the occupant. The existing concepts similar to SIPS (Side Impact Protection) system are basically based on good structural integrity with seat-mounted side air bags and roof-mounted curtain air bags for overall protection of the occupant in side impact crashes. However, for higher level of external input load at an inclined angle from high front-end SUVs acting on the side of an ordinary PV in case of SUV-to-PV side impact crashes, there is a room to have more efficient structural load-path system layout. A new inclined L-shaped High Efficiency Load Path System (HELPS) was developed and incorporated at the back of the existing seat back frame to bypass a part of the incoming load to the central console through the seatback frame. At first, a number of full vehicle FE-simulation studies were carried out to verify the performance in IIHS and SINCAP tests to assure the effectiveness of the concept. Finally, it is tuned to a feasible optimized structure in order to ensure other functional aspects, such as, seating comfort of the front passenger, leg-room of the rear occupants, etc. Its performance was calculated assuming various seating positions of the frontal occupant to examine the robustness of the concept in real world safety. Human Body Model (HBM) simulations were also carried out to compare two systems, one with HELPS and the other without HELPS concept. Similar to the results of the dummy response in IIHS and SINCAP tests, reductions in occupant injury level were observed in HBM simulations. INTRODUCTION
Side collisions remain a frequent cause of fatal and serious injury. From accident analysis, it is found that 60% of the fatal and serious injuries to front seat occupants in side collisions were to the struck side occupants, and 40% were to the non-struck side occupants [3], [4]. In lateral impact at the intersection of roads, the distance of occupant’s chest and the front end of the colliding car is only few hundred millimeters. The advanced safety cage of recent vehicles is designed with careful mix of different steel grades of various strength and thickness to provide carefully controlled lateral deformation of the whole body structure in order to minimize the injuries of the occupant inside the vehicle compartment. The side airbag and roof curtain airbag provide additional protection of the pelvis, abdomen, thorax and head for both the front seat occupants as well as to the rear passengers. Strong rigid steel tubes of Volvo’s SIPS concept across the seat frame help to transfer loads to the center console to maintain the seating space after the impact. It is very effective for a lateral input at a lower height when colliding with passenger vehicles. However, in case of collision with SUVs having higher front-end stiffness, it may not be that effective in an inclined lateral input load at a higher height from the ground. It is known that occupants in cars will encounter serious chest injuries when struck by vehicles with high front-end stiffness and high ground clearance such as sport utility vehicles (SUVs), multi-purpose vehicles (MPVs) and 1-box type of vehicles [3],[6],[7]. As these types of vehicles become increasingly more prevalent, consideration should be given to the vehicle structural design in light of the changing and mixed vehicle fleet [2], [5].
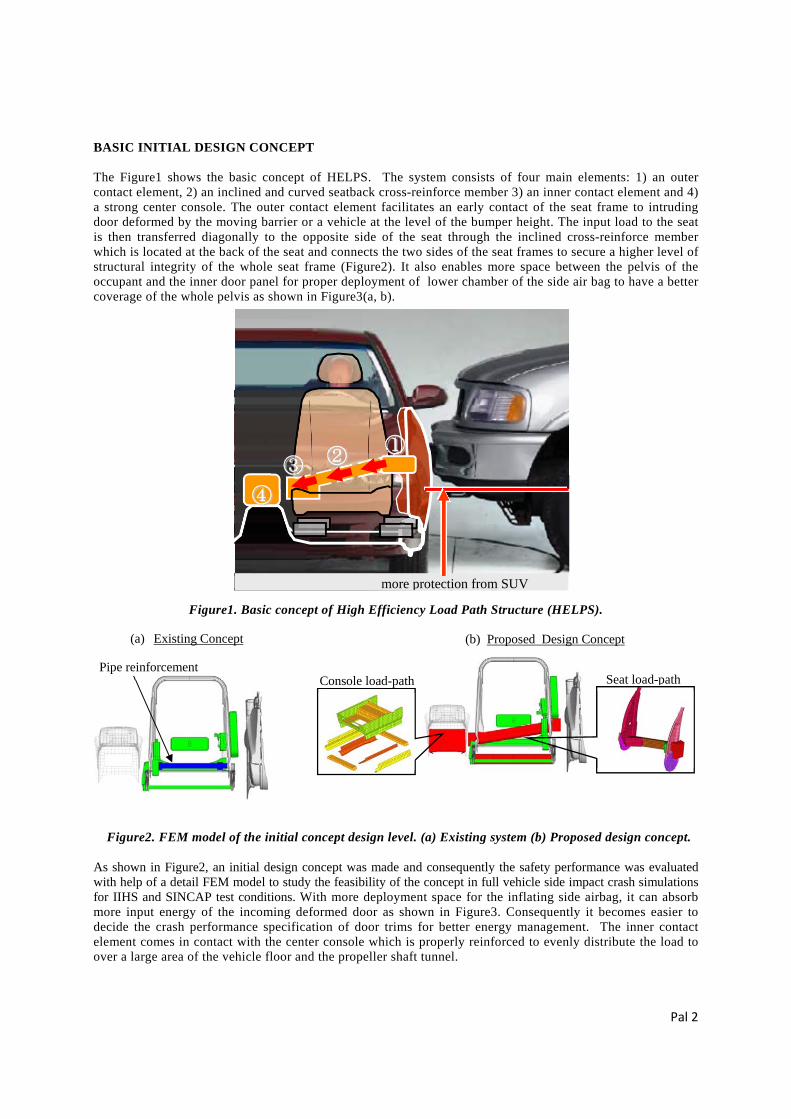
Pal 2
BASIC INITIAL DESIGN CONCEPT The Figure1 shows the basic concept of HELPS. The system consists of four main elements: 1) an outer contact element, 2) an inclined and curved seatback cross-reinforce member 3) an inner contact element and 4) a strong center console. The outer contact element facilitates an early contact of the seat frame to intruding door deformed by the moving barrier or a vehicle at the level of the bumper height. The input load to the seat is then transferred diagonally to the opposite side of the seat through the inclined cross-reinforce member which is located at the back of the seat and connects the two sides of the seat frames to secure a higher level of structural integrity of the whole seat frame (Figure2). It also enables more space between the pelvis of the occupant and the inner door panel for proper deployment of lower chamber of the side air bag to have a better coverage of the whole pelvis as shown in Figure3(a, b).
Figure1. Basic concept of High Efficiency Load Path Structure (HELPS).
Figure2. FEM model of the initial concept design level. (a) Existing system (b) Proposed design concept.
As shown in Figure2, an initial design concept was made and consequently the safety performance was evaluated with help of a detail FEM model to study the feasibility of the concept in full vehicle side impact crash simulations for IIHS and SINCAP test conditions. With more deployment space for the inflating side airbag, it can absorb more input energy of the incoming deformed door as shown in Figure3. Consequently it becomes easier to decide the crash performance specification of door trims for better energy management. The inner contact element comes in contact with the center console which is properly reinforced to evenly distribute the load to over a large area of the vehicle floor and the propeller shaft tunnel.
④
③ ②
①
better protection for SUV impactmore protection from SUV
Seat load-path
(a) Existing Concept
Pipe reinforcement Console load-path
(b) Proposed Design Concept
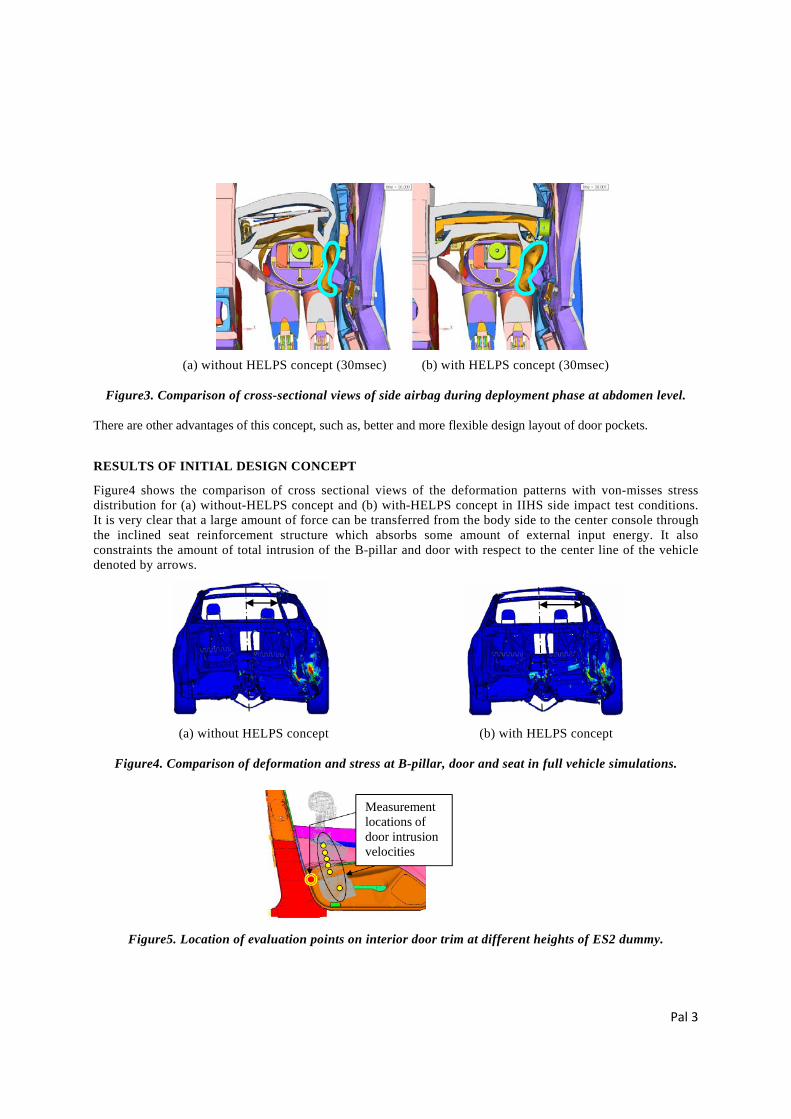
Pal 3
(a) without HELPS concept (30msec) (b) with HELPS concept (30msec)
Figure3. Comparison of cross-sectional views of side airbag during deployment phase at abdomen level.
There are other advantages of this concept, such as, better and more flexible design layout of door pockets.
RESULTS OF INITIAL DESIGN CONCEPT
Figure4 shows the comparison of cross sectional views of the deformation patterns with von-misses stress distribution for (a) without-HELPS concept and (b) with-HELPS concept in IIHS side impact test conditions. It is very clear that a large amount of force can be transferred from the body side to the center console through the inclined seat reinforcement structure which absorbs some amount of external input energy. It also constraints the amount of total intrusion of the B-pillar and door with respect to the center line of the vehicle denoted by arrows.
(a) without HELPS concept (b) with HELPS concept
Figure4. Comparison of deformation and stress at B-pillar, door and seat in full vehicle simulations.
Figure5. Location of evaluation points on interior door trim at different heights of ES2 dummy.
Measurement locations of door intrusion velocities
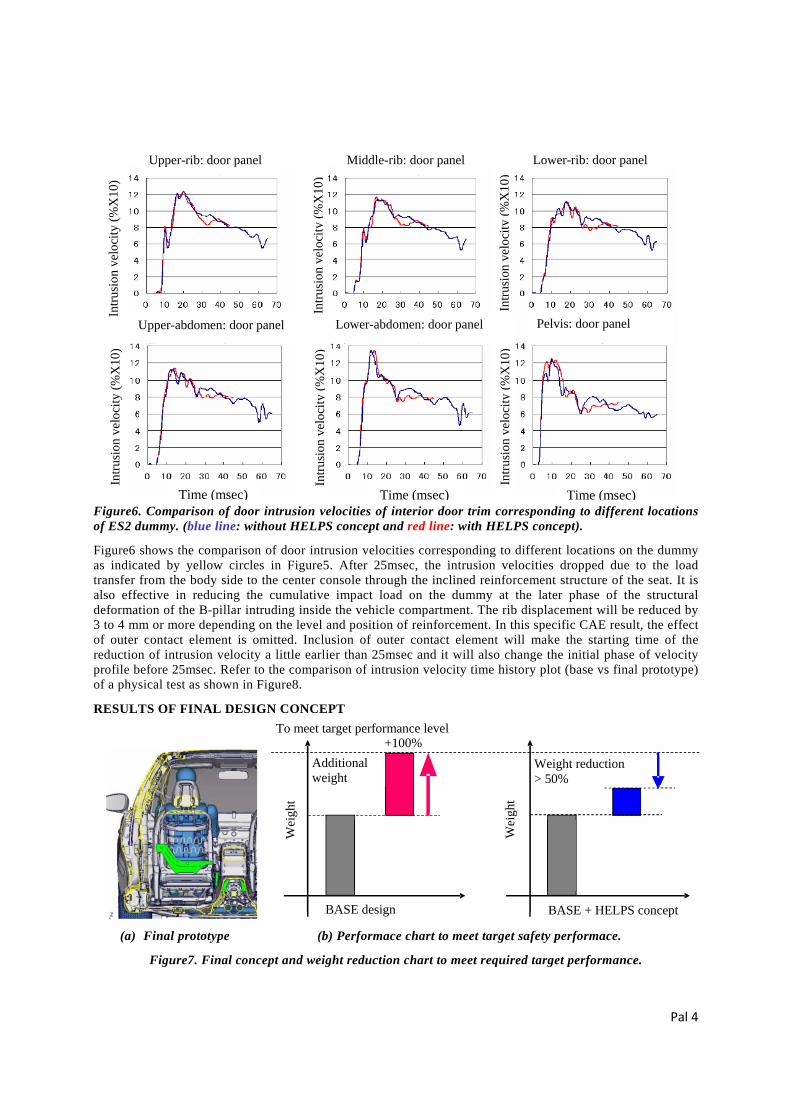
Pal 4
Figure6. Comparison of door intrusion velocities of interior door trim corresponding to different locations of ES2 dummy. (blue line: without HELPS concept and red line: with HELPS concept).
Figure6 shows the comparison of door intrusion velocities corresponding to different locations on the dummy as indicated by yellow circles in Figure5. After 25msec, the intrusion velocities dropped due to the load transfer from the body side to the center console through the inclined reinforcement structure of the seat. It is also effective in reducing the cumulative impact load on the dummy at the later phase of the structural deformation of the B-pillar intruding inside the vehicle compartment. The rib displacement will be reduced by 3 to 4 mm or more depending on the level and position of reinforcement. In this specific CAE result, the effect of outer contact element is omitted. Inclusion of outer contact element will make the starting time of the reduction of intrusion velocity a little earlier than 25msec and it will also change the initial phase of velocity profile before 25msec. Refer to the comparison of intrusion velocity time history plot (base vs final prototype) of a physical test as shown in Figure8.
RESULTS OF FINAL DESIGN CONCEPT
(a) Final prototype (b) Performace chart to meet target safety performace.
Figure7. Final concept and weight reduction chart to meet required target performance.
BASE design
+100%
BASE + HELPS concept
To meet target performance level
Wei
ght
Weight reduction > 50%
Wei
ght
Additional weight
Upper-rib: door panel Middle-rib: door panel Lower-rib: door panel
Time (msec) Time (msec) Time (msec)
Upper-abdomen: door panel Lower-abdomen: door panel Pelvis: door panel
Intr
usio
n ve
loci
ty (
%X
10)
Intr
usio
n ve
loci
ty (
%X
10)
Intr
usio
n ve
loci
ty (
%X
10)
Intr
usio
n ve
loci
ty (
%X
10)
Intr
usio
n ve
loci
ty (
%X
10)
Intr
usio
n ve
loci
ty (
%X
10)
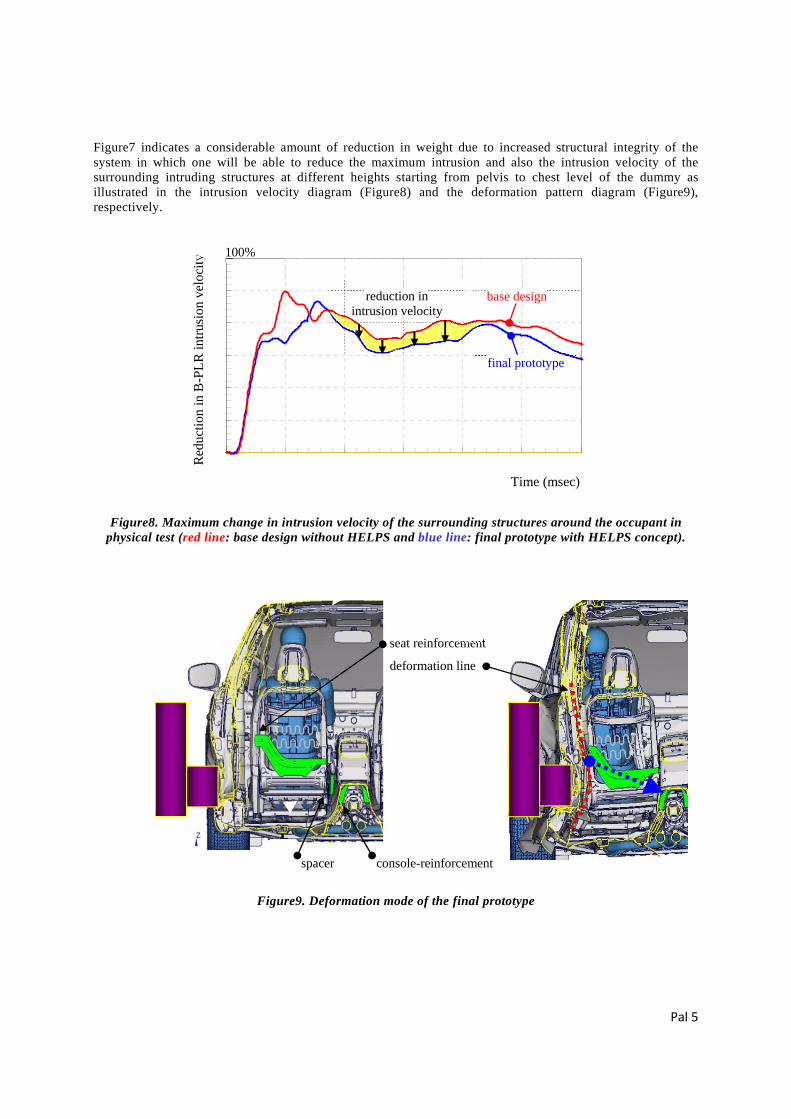
Pal 5
Figure7 indicates a considerable amount of reduction in weight due to increased structural integrity of the system in which one will be able to reduce the maximum intrusion and also the intrusion velocity of the surrounding intruding structures at different heights starting from pelvis to chest level of the dummy as illustrated in the intrusion velocity diagram (Figure8) and the deformation pattern diagram (Figure9), respectively.
Figure 8. Deformation mode after impact
Figure8. Maximum change in intrusion velocity of the surrounding structures around the occupant in physical test (red line: base design without HELPS and blue line: final prototype with HELPS concept).
Figure9. Deformation mode of the final prototype
0
2
4
6
8
10
12
0 10 20 30 40 50 60Time (msec)
Red
uctio
n in
B-P
LR
intr
usio
n ve
loci
ty
base design
final prototype
100%
reduction in intrusion velocity
seat reinforcement
deformation line
spacer console-reinforcement
MDB
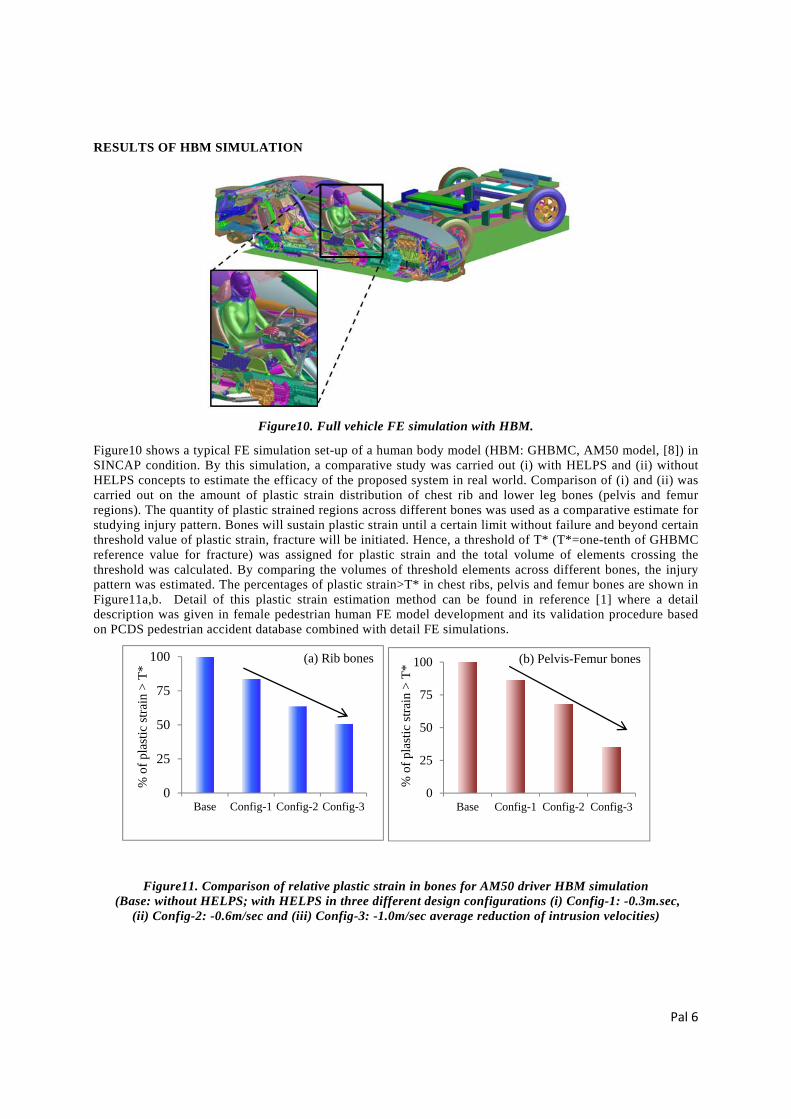
Pal 6
RESULTS OF HBM SIMULATION
Figure10. Full vehicle FE simulation with HBM.
Figure10 shows a typical FE simulation set-up of a human body model (HBM: GHBMC, AM50 model, [8]) in SINCAP condition. By this simulation, a comparative study was carried out (i) with HELPS and (ii) without HELPS concepts to estimate the efficacy of the proposed system in real world. Comparison of (i) and (ii) was carried out on the amount of plastic strain distribution of chest rib and lower leg bones (pelvis and femur regions). The quantity of plastic strained regions across different bones was used as a comparative estimate for studying injury pattern. Bones will sustain plastic strain until a certain limit without failure and beyond certain threshold value of plastic strain, fracture will be initiated. Hence, a threshold of T* (T*=one-tenth of GHBMC reference value for fracture) was assigned for plastic strain and the total volume of elements crossing the threshold was calculated. By comparing the volumes of threshold elements across different bones, the injury pattern was estimated. The percentages of plastic strain>T* in chest ribs, pelvis and femur bones are shown in Figure11a,b. Detail of this plastic strain estimation method can be found in reference [1] where a detail description was given in female pedestrian human FE model development and its validation procedure based on PCDS pedestrian accident database combined with detail FE simulations.
Figure11. Comparison of relative plastic strain in bones for AM50 driver HBM simulation (Base: without HELPS; with HELPS in three different design configurations (i) Config-1: -0.3m.sec,
(ii) Config-2: -0.6m/sec and (iii) Config-3: -1.0m/sec average reduction of intrusion velocities)
0
25
50
75
100
Base Config-1 Config-2 Config-3
% o
f pl
astic
str
ain
> T
*
(a) Rib bones
0
25
50
75
100
Base Config-1 Config-2 Config-3
% o
f pl
asti
c st
rain
> T
*
(b) Pelvis-Femur bones
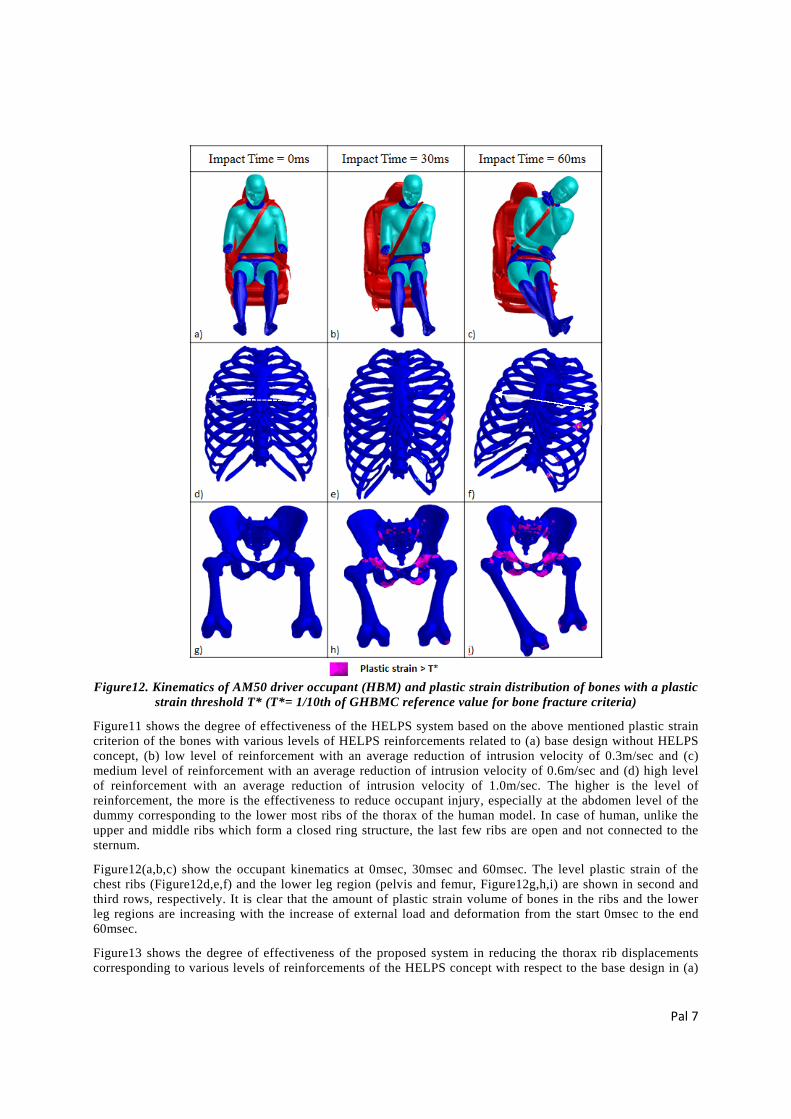
Pal 7
Figure12. Kinematics of AM50 driver occupant (HBM) and plastic strain distribution of bones with a plastic
strain threshold T* (T*= 1/10th of GHBMC reference value for bone fracture criteria)
Figure11 shows the degree of effectiveness of the HELPS system based on the above mentioned plastic strain criterion of the bones with various levels of HELPS reinforcements related to (a) base design without HELPS concept, (b) low level of reinforcement with an average reduction of intrusion velocity of 0.3m/sec and (c) medium level of reinforcement with an average reduction of intrusion velocity of 0.6m/sec and (d) high level of reinforcement with an average reduction of intrusion velocity of 1.0m/sec. The higher is the level of reinforcement, the more is the effectiveness to reduce occupant injury, especially at the abdomen level of the dummy corresponding to the lower most ribs of the thorax of the human model. In case of human, unlike the upper and middle ribs which form a closed ring structure, the last few ribs are open and not connected to the sternum.
Figure12(a,b,c) show the occupant kinematics at 0msec, 30msec and 60msec. The level plastic strain of the chest ribs (Figure12d,e,f) and the lower leg region (pelvis and femur, Figure12g,h,i) are shown in second and third rows, respectively. It is clear that the amount of plastic strain volume of bones in the ribs and the lower leg regions are increasing with the increase of external load and deformation from the start 0msec to the end 60msec.
Figure13 shows the degree of effectiveness of the proposed system in reducing the thorax rib displacements corresponding to various levels of reinforcements of the HELPS concept with respect to the base design in (a)
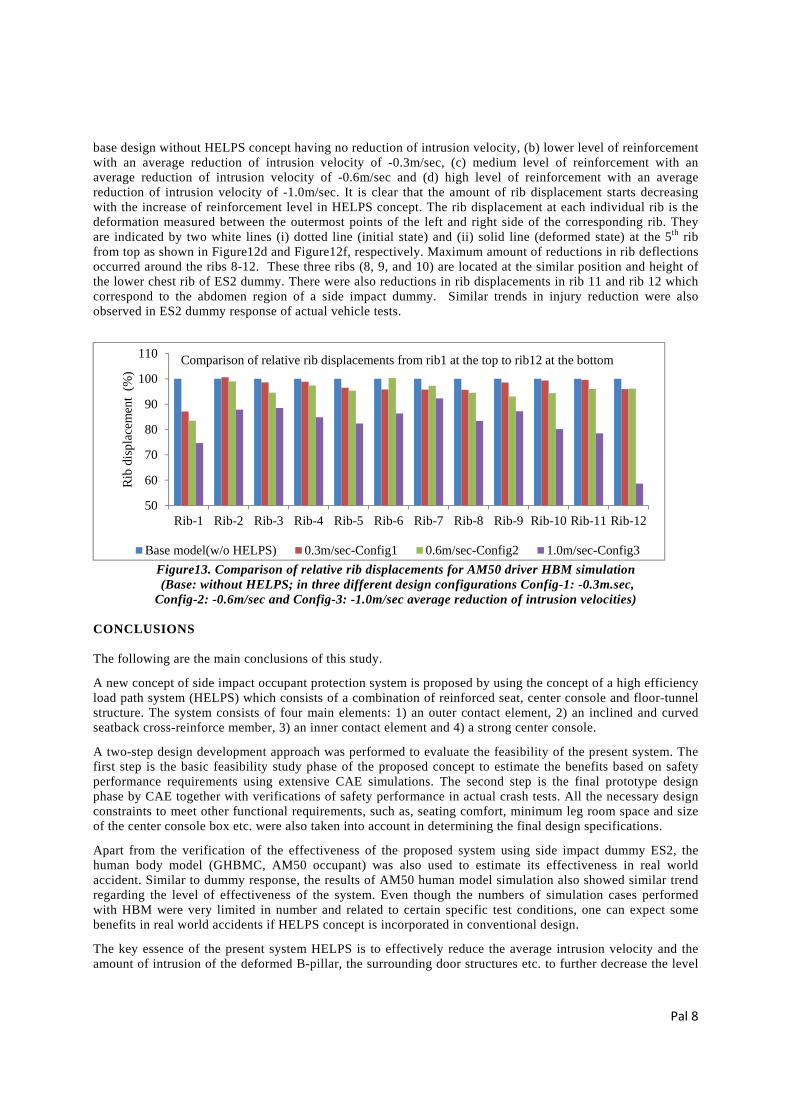
Pal 8
base design without HELPS concept having no reduction of intrusion velocity, (b) lower level of reinforcement with an average reduction of intrusion velocity of -0.3m/sec, (c) medium level of reinforcement with an average reduction of intrusion velocity of -0.6m/sec and (d) high level of reinforcement with an average reduction of intrusion velocity of -1.0m/sec. It is clear that the amount of rib displacement starts decreasing with the increase of reinforcement level in HELPS concept. The rib displacement at each individual rib is the deformation measured between the outermost points of the left and right side of the corresponding rib. They are indicated by two white lines (i) dotted line (initial state) and (ii) solid line (deformed state) at the 5th rib from top as shown in Figure12d and Figure12f, respectively. Maximum amount of reductions in rib deflections occurred around the ribs 8-12. These three ribs (8, 9, and 10) are located at the similar position and height of the lower chest rib of ES2 dummy. There were also reductions in rib displacements in rib 11 and rib 12 which correspond to the abdomen region of a side impact dummy. Similar trends in injury reduction were also observed in ES2 dummy response of actual vehicle tests.
Figure13. Comparison of relative rib displacements for AM50 driver HBM simulation (Base: without HELPS; in three different design configurations Config-1: -0.3m.sec, Config-2: -0.6m/sec and Config-3: -1.0m/sec average reduction of intrusion velocities)
CONCLUSIONS The following are the main conclusions of this study.
A new concept of side impact occupant protection system is proposed by using the concept of a high efficiency load path system (HELPS) which consists of a combination of reinforced seat, center console and floor-tunnel structure. The system consists of four main elements: 1) an outer contact element, 2) an inclined and curved seatback cross-reinforce member, 3) an inner contact element and 4) a strong center console.
A two-step design development approach was performed to evaluate the feasibility of the present system. The first step is the basic feasibility study phase of the proposed concept to estimate the benefits based on safety performance requirements using extensive CAE simulations. The second step is the final prototype design phase by CAE together with verifications of safety performance in actual crash tests. All the necessary design constraints to meet other functional requirements, such as, seating comfort, minimum leg room space and size of the center console box etc. were also taken into account in determining the final design specifications.
Apart from the verification of the effectiveness of the proposed system using side impact dummy ES2, the human body model (GHBMC, AM50 occupant) was also used to estimate its effectiveness in real world accident. Similar to dummy response, the results of AM50 human model simulation also showed similar trend regarding the level of effectiveness of the system. Even though the numbers of simulation cases performed with HBM were very limited in number and related to certain specific test conditions, one can expect some benefits in real world accidents if HELPS concept is incorporated in conventional design.
The key essence of the present system HELPS is to effectively reduce the average intrusion velocity and the amount of intrusion of the deformed B-pillar, the surrounding door structures etc. to further decrease the level
50
60
70
80
90
100
110
Rib-1 Rib-2 Rib-3 Rib-4 Rib-5 Rib-6 Rib-7 Rib-8 Rib-9 Rib-10 Rib-11 Rib-12
Rib
dis
plac
emen
t (%
)
Comparison of relative rib displacements from rib1 at the top to rib12 at the bottom
Base model(w/o HELPS) 0.3m/sec-Config1 0.6m/sec-Config2 1.0m/sec-Config3
Pal 9
of front seat occupant injuries in severe side impact crashes. However, the level of effective of this system will vary depending on the size, the category and the type of upper body structure of vehicles under consideration. Hence, to incorporate the proposed HELPS system in the existing vehicle design process, additional merits and demerits should be evaluated and judged carefully in order to get maximum benefits based on total vehicle system performance.
REFERENCES [1] C. Pal, et al, “Estimation of Pelvis Injuries and Head Impact Time using Different Pedestrian Human FE Models”, SAE international conference, Paper Number 2014-01-0522, DOI: 10.4271/2014-01-0522 (2014).
[2] Helena Stigson, et al, “Effect of Side Impact Protection in Reducing Injuries”, 22nd ESV, Paper No.11-0319. [3] Hideki Yonezawa, et al, “Investigation for New Side Impact Test Procedures in Japan”, 21st ESV, Paper Number 09-0369 (2009).
[4] Laberge-Nadeau, et al, “Occupant injury severity from lateral collisions: a literature review”, Journal of Safety Research, 40, 427-35, 2009. [5] Mark Scarboro et al, “Nearside Occupants in Low Delta-V Side Impact Crashes: Analysis of Injury and Vehicle Damage Patterns”, 20th ESV, Paper Number 07-0225 (2007). [6] Newland C., et al, "International Harmonized Research Activities Side Impact Working Group Status Report” 19th ESV, Paper Number 05-0460 (2005).
[7] Seyer K., et al, “International Harmonized Research Activities Side Impact Working Group Status report,” 18th ESV, Paper Number 579 (2003).
[8] Updated version of GHBMC human FE model, 2012 release.
GLOSSARY AM50: 50th percentile American male ES2: Side impact dummy; the next generation of the EuroSID1 dummy GHBMC: Global Human Body Model Consortium HBM: Human Body Model HELPS: High Efficiency Load Path System PCDS: Pedestrian Crash Data Study SINCAP: Side Impact New Car Assessment Program (US motor vehicle safety standard) IIHS: Insurance Institute for Highway Safety ACKNOWLEDGMENTS The authors would like to acknowledge the support group of ESI Japan for PAM-CRASH and the members of GHBMC for the development of the 50th-%ile adult FE HBM.
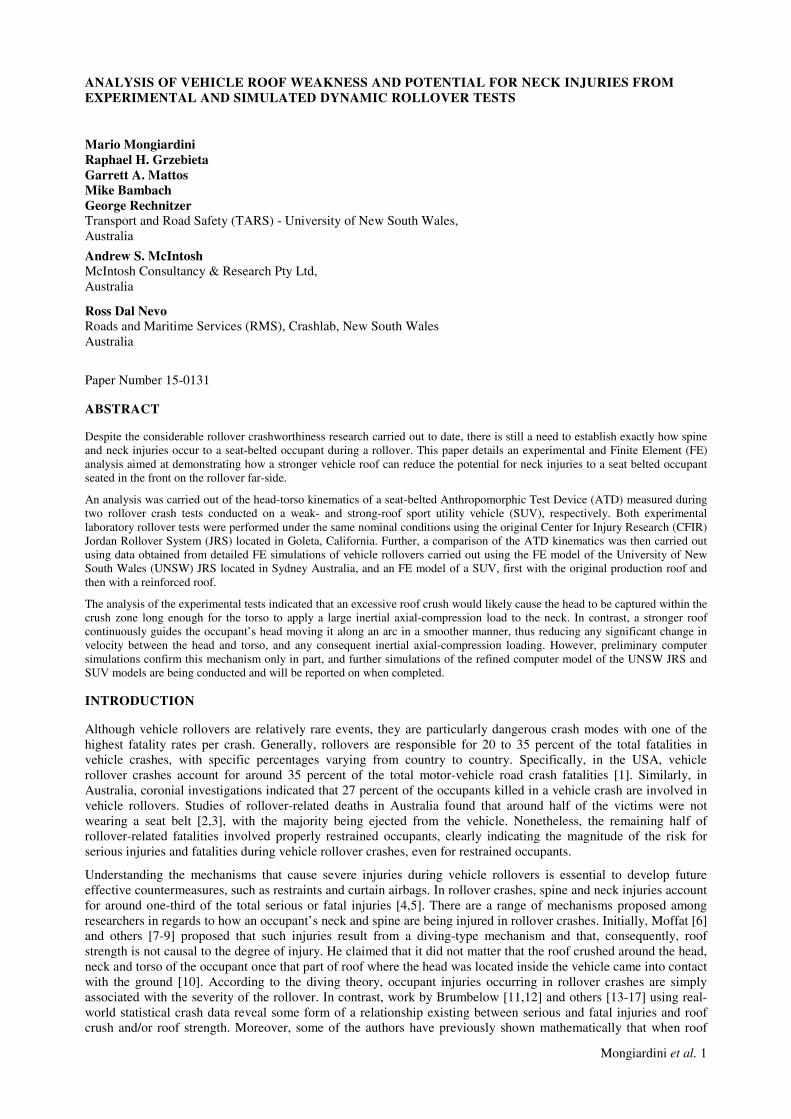
Mongiardini et al. 1
ANALYSIS OF VEHICLE ROOF WEAKNESS AND POTENTIAL FOR NECK INJURIES FROM EXPERIMENTAL AND SIMULATED DYNAMIC ROLLOVER TESTS
Mario Mongiardini Raphael H. Grzebieta Garrett A. Mattos Mike Bambach George Rechnitzer Transport and Road Safety (TARS) - University of New South Wales, Australia
Andrew S. McIntosh McIntosh Consultancy & Research Pty Ltd, Australia
Ross Dal Nevo Roads and Maritime Services (RMS), Crashlab, New South Wales Australia
Paper Number 15-0131
ABSTRACT
Despite the considerable rollover crashworthiness research carried out to date, there is still a need to establish exactly how spine and neck injuries occur to a seat-belted occupant during a rollover. This paper details an experimental and Finite Element (FE) analysis aimed at demonstrating how a stronger vehicle roof can reduce the potential for neck injuries to a seat belted occupant seated in the front on the rollover far-side.
An analysis was carried out of the head-torso kinematics of a seat-belted Anthropomorphic Test Device (ATD) measured during two rollover crash tests conducted on a weak- and strong-roof sport utility vehicle (SUV), respectively. Both experimental laboratory rollover tests were performed under the same nominal conditions using the original Center for Injury Research (CFIR) Jordan Rollover System (JRS) located in Goleta, California. Further, a comparison of the ATD kinematics was then carried out using data obtained from detailed FE simulations of vehicle rollovers carried out using the FE model of the University of New South Wales (UNSW) JRS located in Sydney Australia, and an FE model of a SUV, first with the original production roof and then with a reinforced roof.
The analysis of the experimental tests indicated that an excessive roof crush would likely cause the head to be captured within the crush zone long enough for the torso to apply a large inertial axial-compression load to the neck. In contrast, a stronger roof continuously guides the occupant’s head moving it along an arc in a smoother manner, thus reducing any significant change in velocity between the head and torso, and any consequent inertial axial-compression loading. However, preliminary computer simulations confirm this mechanism only in part, and further simulations of the refined computer model of the UNSW JRS and SUV models are being conducted and will be reported on when completed.
INTRODUCTION
Although vehicle rollovers are relatively rare events, they are particularly dangerous crash modes with one of the highest fatality rates per crash. Generally, rollovers are responsible for 20 to 35 percent of the total fatalities in vehicle crashes, with specific percentages varying from country to country. Specifically, in the USA, vehicle rollover crashes account for around 35 percent of the total motor-vehicle road crash fatalities [1]. Similarly, in Australia, coronial investigations indicated that 27 percent of the occupants killed in a vehicle crash are involved in vehicle rollovers. Studies of rollover-related deaths in Australia found that around half of the victims were not wearing a seat belt [2,3], with the majority being ejected from the vehicle. Nonetheless, the remaining half of rollover-related fatalities involved properly restrained occupants, clearly indicating the magnitude of the risk for serious injuries and fatalities during vehicle rollover crashes, even for restrained occupants.
Understanding the mechanisms that cause severe injuries during vehicle rollovers is essential to develop future effective countermeasures, such as restraints and curtain airbags. In rollover crashes, spine and neck injuries account for around one-third of the total serious or fatal injuries [4,5]. There are a range of mechanisms proposed among researchers in regards to how an occupant’s neck and spine are being injured in rollover crashes. Initially, Moffat [6] and others [7-9] proposed that such injuries result from a diving-type mechanism and that, consequently, roof strength is not causal to the degree of injury. He claimed that it did not matter that the roof crushed around the head, neck and torso of the occupant once that part of roof where the head was located inside the vehicle came into contact with the ground [10]. According to the diving theory, occupant injuries occurring in rollover crashes are simply associated with the severity of the rollover. In contrast, work by Brumbelow [11,12] and others [13-17] using real-world statistical crash data reveal some form of a relationship existing between serious and fatal injuries and roof crush and/or roof strength. Moreover, some of the authors have previously shown mathematically that when roof
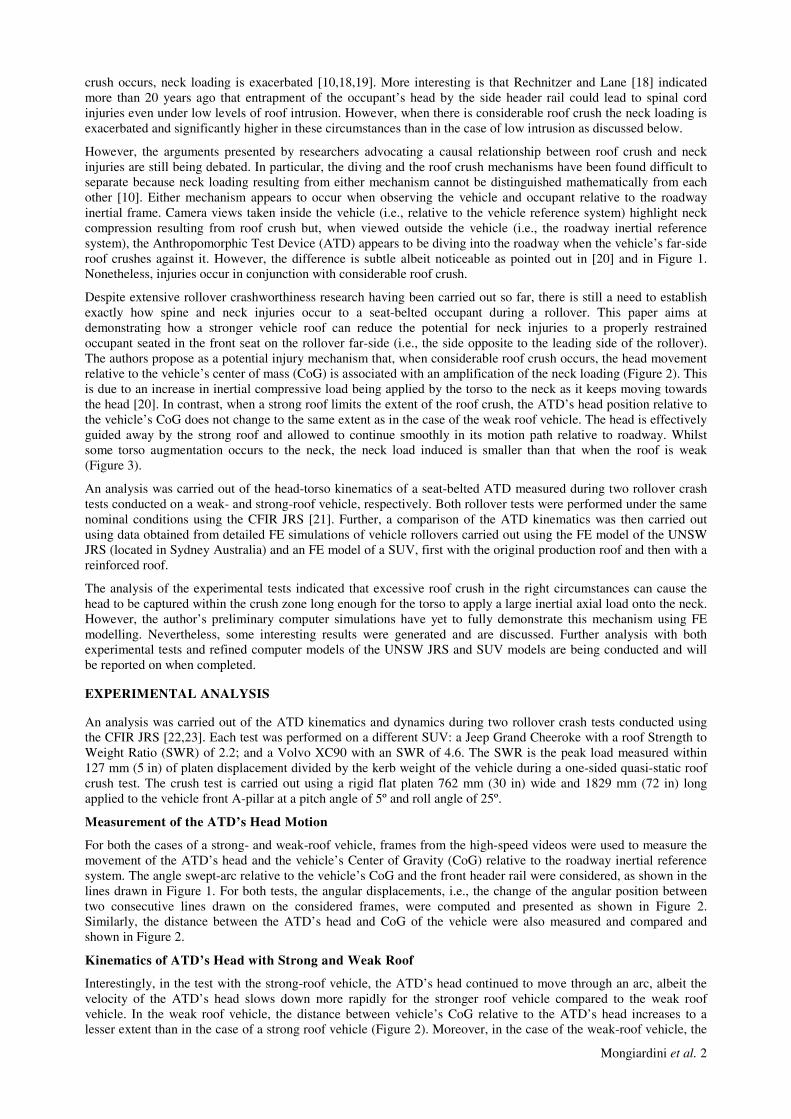
Mongiardini et al. 2
crush occurs, neck loading is exacerbated [10,18,19]. More interesting is that Rechnitzer and Lane [18] indicated more than 20 years ago that entrapment of the occupant’s head by the side header rail could lead to spinal cord injuries even under low levels of roof intrusion. However, when there is considerable roof crush the neck loading is exacerbated and significantly higher in these circumstances than in the case of low intrusion as discussed below.
However, the arguments presented by researchers advocating a causal relationship between roof crush and neck injuries are still being debated. In particular, the diving and the roof crush mechanisms have been found difficult to separate because neck loading resulting from either mechanism cannot be distinguished mathematically from each other [10]. Either mechanism appears to occur when observing the vehicle and occupant relative to the roadway inertial frame. Camera views taken inside the vehicle (i.e., relative to the vehicle reference system) highlight neck compression resulting from roof crush but, when viewed outside the vehicle (i.e., the roadway inertial reference system), the Anthropomorphic Test Device (ATD) appears to be diving into the roadway when the vehicle’s far-side roof crushes against it. However, the difference is subtle albeit noticeable as pointed out in [20] and in Figure 1. Nonetheless, injuries occur in conjunction with considerable roof crush.
Despite extensive rollover crashworthiness research having been carried out so far, there is still a need to establish exactly how spine and neck injuries occur to a seat-belted occupant during a rollover. This paper aims at demonstrating how a stronger vehicle roof can reduce the potential for neck injuries to a properly restrained occupant seated in the front seat on the rollover far-side (i.e., the side opposite to the leading side of the rollover). The authors propose as a potential injury mechanism that, when considerable roof crush occurs, the head movement relative to the vehicle’s center of mass (CoG) is associated with an amplification of the neck loading (Figure 2). This is due to an increase in inertial compressive load being applied by the torso to the neck as it keeps moving towards the head [20]. In contrast, when a strong roof limits the extent of the roof crush, the ATD’s head position relative to the vehicle’s CoG does not change to the same extent as in the case of the weak roof vehicle. The head is effectively guided away by the strong roof and allowed to continue smoothly in its motion path relative to roadway. Whilst some torso augmentation occurs to the neck, the neck load induced is smaller than that when the roof is weak (Figure 3).
An analysis was carried out of the head-torso kinematics of a seat-belted ATD measured during two rollover crash tests conducted on a weak- and strong-roof vehicle, respectively. Both rollover tests were performed under the same nominal conditions using the CFIR JRS [21]. Further, a comparison of the ATD kinematics was then carried out using data obtained from detailed FE simulations of vehicle rollovers carried out using the FE model of the UNSW JRS (located in Sydney Australia) and an FE model of a SUV, first with the original production roof and then with a reinforced roof.
The analysis of the experimental tests indicated that excessive roof crush in the right circumstances can cause the head to be captured within the crush zone long enough for the torso to apply a large inertial axial load onto the neck. However, the author’s preliminary computer simulations have yet to fully demonstrate this mechanism using FE modelling. Nevertheless, some interesting results were generated and are discussed. Further analysis with both experimental tests and refined computer models of the UNSW JRS and SUV models are being conducted and will be reported on when completed.
EXPERIMENTAL ANALYSIS
An analysis was carried out of the ATD kinematics and dynamics during two rollover crash tests conducted using the CFIR JRS [22,23]. Each test was performed on a different SUV: a Jeep Grand Cheeroke with a roof Strength to Weight Ratio (SWR) of 2.2; and a Volvo XC90 with an SWR of 4.6. The SWR is the peak load measured within 127 mm (5 in) of platen displacement divided by the kerb weight of the vehicle during a one-sided quasi-static roof crush test. The crush test is carried out using a rigid flat platen 762 mm (30 in) wide and 1829 mm (72 in) long applied to the vehicle front A-pillar at a pitch angle of 5º and roll angle of 25º.
Measurement of the ATD’s Head Motion
For both the cases of a strong- and weak-roof vehicle, frames from the high-speed videos were used to measure the movement of the ATD’s head and the vehicle’s Center of Gravity (CoG) relative to the roadway inertial reference system. The angle swept-arc relative to the vehicle’s CoG and the front header rail were considered, as shown in the lines drawn in Figure 1. For both tests, the angular displacements, i.e., the change of the angular position between two consecutive lines drawn on the considered frames, were computed and presented as shown in Figure 2. Similarly, the distance between the ATD’s head and CoG of the vehicle were also measured and compared and shown in Figure 2.
Kinematics of ATD’s Head with Strong and Weak Roof
Interestingly, in the test with the strong-roof vehicle, the ATD’s head continued to move through an arc, albeit the velocity of the ATD’s head slows down more rapidly for the stronger roof vehicle compared to the weak roof vehicle. In the weak roof vehicle, the distance between vehicle’s CoG relative to the ATD’s head increases to a lesser extent than in the case of a strong roof vehicle (Figure 2). Moreover, in the case of the weak-roof vehicle, the
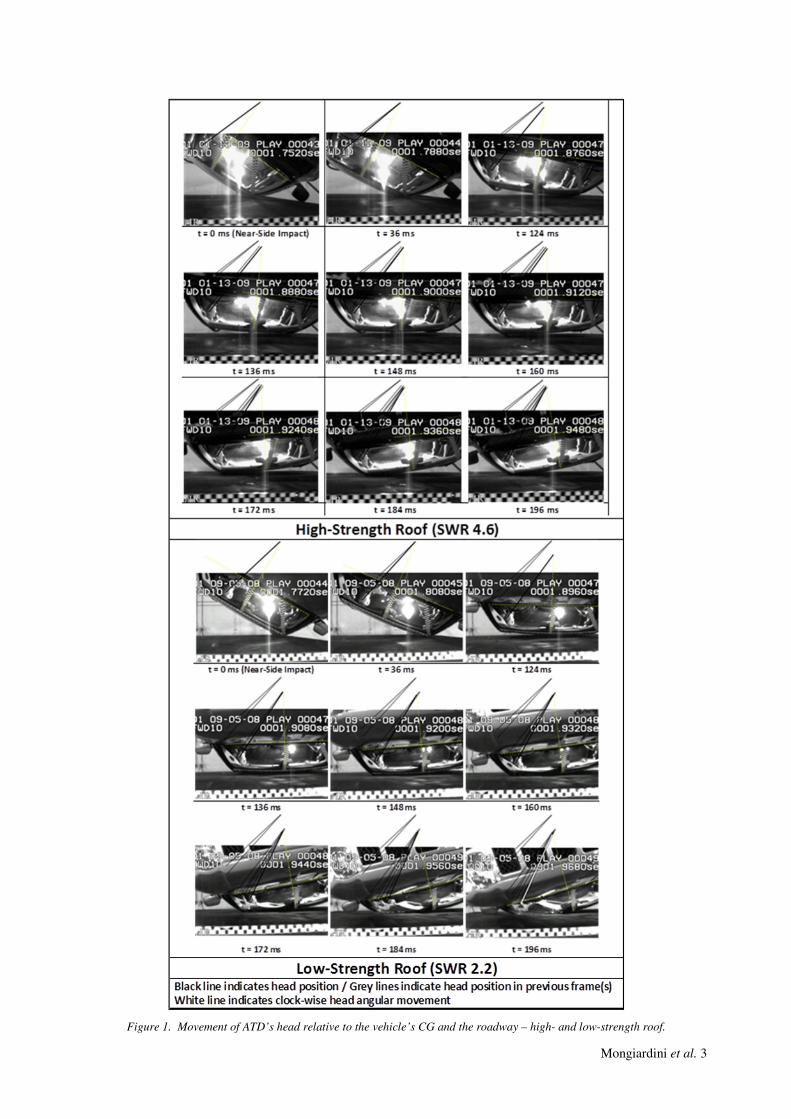
Mongiardini et al. 3
Figure 1. Movement of ATD’s head relative to the vehicle’s CG and the roadway – high- and low-strength roof.
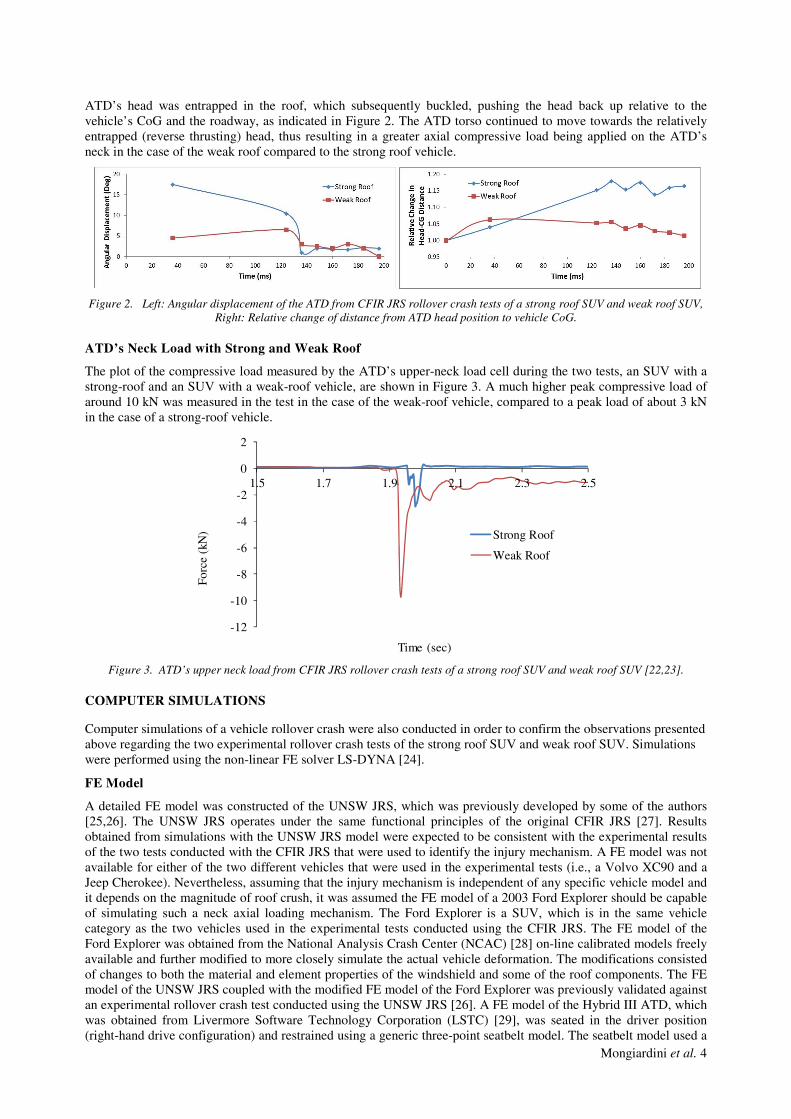
Mongiardini et al. 4
ATD’s head was entrapped in the roof, which subsequently buckled, pushing the head back up relative to the vehicle’s CoG and the roadway, as indicated in Figure 2. The ATD torso continued to move towards the relatively entrapped (reverse thrusting) head, thus resulting in a greater axial compressive load being applied on the ATD’s neck in the case of the weak roof compared to the strong roof vehicle.
Figure 2. Left: Angular displacement of the ATD from CFIR JRS rollover crash tests of a strong roof SUV and weak roof SUV, Right: Relative change of distance from ATD head position to vehicle CoG.
ATD’s Neck Load with Strong and Weak Roof
The plot of the compressive load measured by the ATD’s upper-neck load cell during the two tests, an SUV with a strong-roof and an SUV with a weak-roof vehicle, are shown in Figure 3. A much higher peak compressive load of around 10 kN was measured in the test in the case of the weak-roof vehicle, compared to a peak load of about 3 kN in the case of a strong-roof vehicle.
Figure 3. ATD’s upper neck load from CFIR JRS rollover crash tests of a strong roof SUV and weak roof SUV [22,23].
COMPUTER SIMULATIONS
Computer simulations of a vehicle rollover crash were also conducted in order to confirm the observations presented above regarding the two experimental rollover crash tests of the strong roof SUV and weak roof SUV. Simulations were performed using the non-linear FE solver LS-DYNA [24].
FE Model
A detailed FE model was constructed of the UNSW JRS, which was previously developed by some of the authors [25,26]. The UNSW JRS operates under the same functional principles of the original CFIR JRS [27]. Results obtained from simulations with the UNSW JRS model were expected to be consistent with the experimental results of the two tests conducted with the CFIR JRS that were used to identify the injury mechanism. A FE model was not available for either of the two different vehicles that were used in the experimental tests (i.e., a Volvo XC90 and a Jeep Cherokee). Nevertheless, assuming that the injury mechanism is independent of any specific vehicle model and it depends on the magnitude of roof crush, it was assumed the FE model of a 2003 Ford Explorer should be capable of simulating such a neck axial loading mechanism. The Ford Explorer is a SUV, which is in the same vehicle category as the two vehicles used in the experimental tests conducted using the CFIR JRS. The FE model of the Ford Explorer was obtained from the National Analysis Crash Center (NCAC) [28] on-line calibrated models freely available and further modified to more closely simulate the actual vehicle deformation. The modifications consisted of changes to both the material and element properties of the windshield and some of the roof components. The FE model of the UNSW JRS coupled with the modified FE model of the Ford Explorer was previously validated against an experimental rollover crash test conducted using the UNSW JRS [26]. A FE model of the Hybrid III ATD, which was obtained from Livermore Software Technology Corporation (LSTC) [29], was seated in the driver position (right-hand drive configuration) and restrained using a generic three-point seatbelt model. The seatbelt model used a
-12
-10
-8
-6
-4
-2
0
2
1.5 1.7 1.9 2.1 2.3 2.5
Forc
e (k
N)
Time (sec)
Strong Roof
Weak Roof
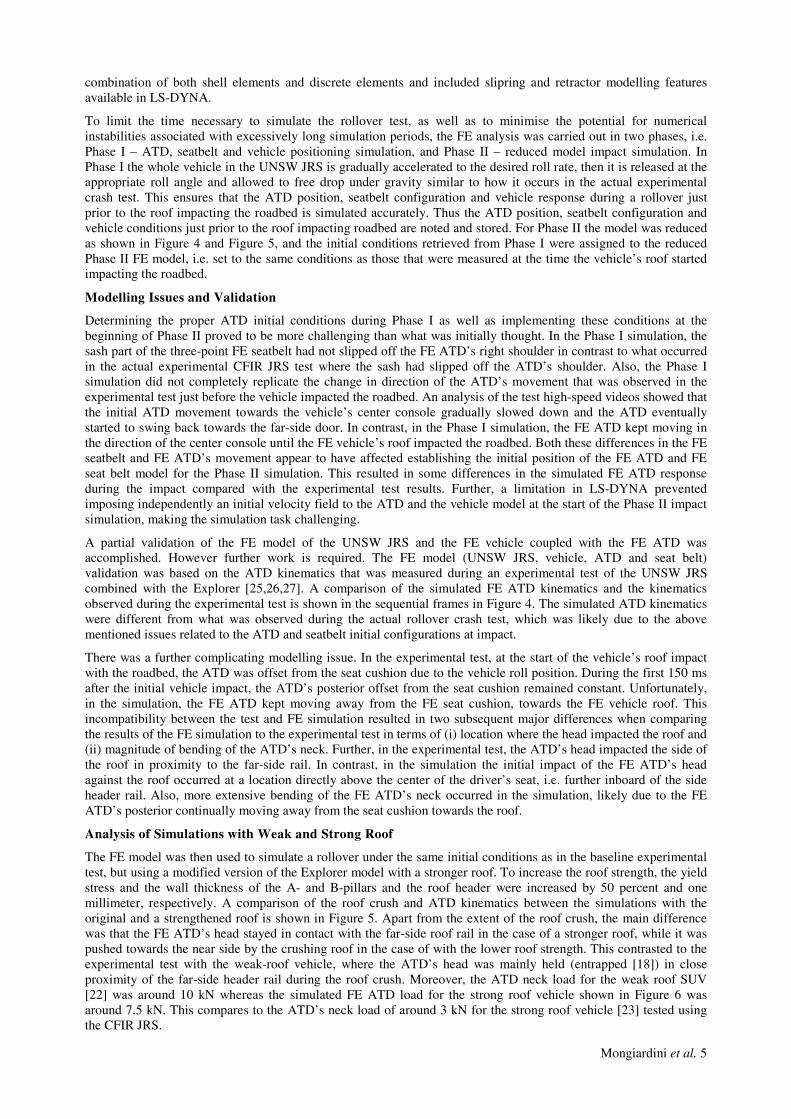
Mongiardini et al. 5
combination of both shell elements and discrete elements and included slipring and retractor modelling features available in LS-DYNA.
To limit the time necessary to simulate the rollover test, as well as to minimise the potential for numerical instabilities associated with excessively long simulation periods, the FE analysis was carried out in two phases, i.e. Phase I – ATD, seatbelt and vehicle positioning simulation, and Phase II – reduced model impact simulation. In Phase I the whole vehicle in the UNSW JRS is gradually accelerated to the desired roll rate, then it is released at the appropriate roll angle and allowed to free drop under gravity similar to how it occurs in the actual experimental crash test. This ensures that the ATD position, seatbelt configuration and vehicle response during a rollover just prior to the roof impacting the roadbed is simulated accurately. Thus the ATD position, seatbelt configuration and vehicle conditions just prior to the roof impacting roadbed are noted and stored. For Phase II the model was reduced as shown in Figure 4 and Figure 5, and the initial conditions retrieved from Phase I were assigned to the reduced Phase II FE model, i.e. set to the same conditions as those that were measured at the time the vehicle’s roof started impacting the roadbed.
Modelling Issues and Validation
Determining the proper ATD initial conditions during Phase I as well as implementing these conditions at the beginning of Phase II proved to be more challenging than what was initially thought. In the Phase I simulation, the sash part of the three-point FE seatbelt had not slipped off the FE ATD’s right shoulder in contrast to what occurred in the actual experimental CFIR JRS test where the sash had slipped off the ATD’s shoulder. Also, the Phase I simulation did not completely replicate the change in direction of the ATD’s movement that was observed in the experimental test just before the vehicle impacted the roadbed. An analysis of the test high-speed videos showed that the initial ATD movement towards the vehicle’s center console gradually slowed down and the ATD eventually started to swing back towards the far-side door. In contrast, in the Phase I simulation, the FE ATD kept moving in the direction of the center console until the FE vehicle’s roof impacted the roadbed. Both these differences in the FE seatbelt and FE ATD’s movement appear to have affected establishing the initial position of the FE ATD and FE seat belt model for the Phase II simulation. This resulted in some differences in the simulated FE ATD response during the impact compared with the experimental test results. Further, a limitation in LS-DYNA prevented imposing independently an initial velocity field to the ATD and the vehicle model at the start of the Phase II impact simulation, making the simulation task challenging.
A partial validation of the FE model of the UNSW JRS and the FE vehicle coupled with the FE ATD was accomplished. However further work is required. The FE model (UNSW JRS, vehicle, ATD and seat belt) validation was based on the ATD kinematics that was measured during an experimental test of the UNSW JRS combined with the Explorer [25,26,27]. A comparison of the simulated FE ATD kinematics and the kinematics observed during the experimental test is shown in the sequential frames in Figure 4. The simulated ATD kinematics were different from what was observed during the actual rollover crash test, which was likely due to the above mentioned issues related to the ATD and seatbelt initial configurations at impact.
There was a further complicating modelling issue. In the experimental test, at the start of the vehicle’s roof impact with the roadbed, the ATD was offset from the seat cushion due to the vehicle roll position. During the first 150 ms after the initial vehicle impact, the ATD’s posterior offset from the seat cushion remained constant. Unfortunately, in the simulation, the FE ATD kept moving away from the FE seat cushion, towards the FE vehicle roof. This incompatibility between the test and FE simulation resulted in two subsequent major differences when comparing the results of the FE simulation to the experimental test in terms of (i) location where the head impacted the roof and (ii) magnitude of bending of the ATD’s neck. Further, in the experimental test, the ATD’s head impacted the side of the roof in proximity to the far-side rail. In contrast, in the simulation the initial impact of the FE ATD’s head against the roof occurred at a location directly above the center of the driver’s seat, i.e. further inboard of the side header rail. Also, more extensive bending of the FE ATD’s neck occurred in the simulation, likely due to the FE ATD’s posterior continually moving away from the seat cushion towards the roof.
Analysis of Simulations with Weak and Strong Roof
The FE model was then used to simulate a rollover under the same initial conditions as in the baseline experimental test, but using a modified version of the Explorer model with a stronger roof. To increase the roof strength, the yield stress and the wall thickness of the A- and B-pillars and the roof header were increased by 50 percent and one millimeter, respectively. A comparison of the roof crush and ATD kinematics between the simulations with the original and a strengthened roof is shown in Figure 5. Apart from the extent of the roof crush, the main difference was that the FE ATD’s head stayed in contact with the far-side roof rail in the case of a stronger roof, while it was pushed towards the near side by the crushing roof in the case of with the lower roof strength. This contrasted to the experimental test with the weak-roof vehicle, where the ATD’s head was mainly held (entrapped [18]) in close proximity of the far-side header rail during the roof crush. Moreover, the ATD neck load for the weak roof SUV [22] was around 10 kN whereas the simulated FE ATD load for the strong roof vehicle shown in Figure 6 was around 7.5 kN. This compares to the ATD’s neck load of around 3 kN for the strong roof vehicle [23] tested using the CFIR JRS.
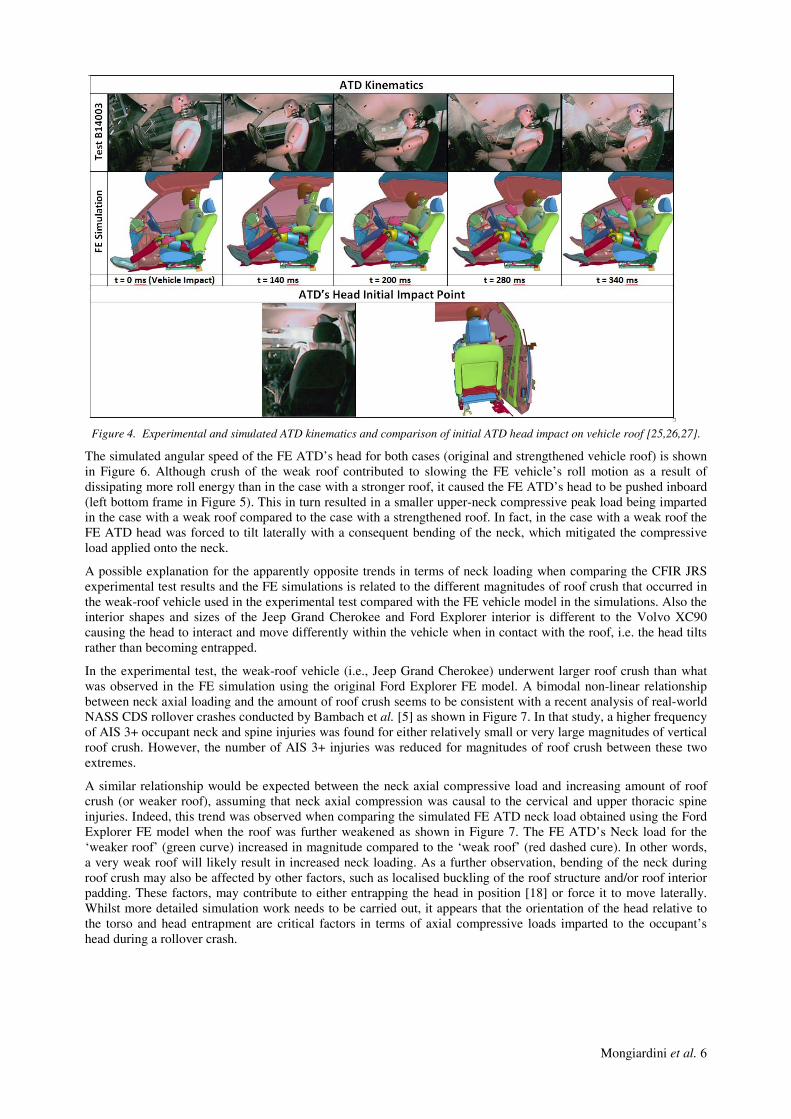
Mongiardini et al. 6
Figure 4. Experimental and simulated ATD kinematics and comparison of initial ATD head impact on vehicle roof [25,26,27].
The simulated angular speed of the FE ATD’s head for both cases (original and strengthened vehicle roof) is shown in Figure 6. Although crush of the weak roof contributed to slowing the FE vehicle’s roll motion as a result of dissipating more roll energy than in the case with a stronger roof, it caused the FE ATD’s head to be pushed inboard (left bottom frame in Figure 5). This in turn resulted in a smaller upper-neck compressive peak load being imparted in the case with a weak roof compared to the case with a strengthened roof. In fact, in the case with a weak roof the FE ATD head was forced to tilt laterally with a consequent bending of the neck, which mitigated the compressive load applied onto the neck.
A possible explanation for the apparently opposite trends in terms of neck loading when comparing the CFIR JRS experimental test results and the FE simulations is related to the different magnitudes of roof crush that occurred in the weak-roof vehicle used in the experimental test compared with the FE vehicle model in the simulations. Also the interior shapes and sizes of the Jeep Grand Cherokee and Ford Explorer interior is different to the Volvo XC90 causing the head to interact and move differently within the vehicle when in contact with the roof, i.e. the head tilts rather than becoming entrapped.
In the experimental test, the weak-roof vehicle (i.e., Jeep Grand Cherokee) underwent larger roof crush than what was observed in the FE simulation using the original Ford Explorer FE model. A bimodal non-linear relationship between neck axial loading and the amount of roof crush seems to be consistent with a recent analysis of real-world NASS CDS rollover crashes conducted by Bambach et al. [5] as shown in Figure 7. In that study, a higher frequency of AIS 3+ occupant neck and spine injuries was found for either relatively small or very large magnitudes of vertical roof crush. However, the number of AIS 3+ injuries was reduced for magnitudes of roof crush between these two extremes.
A similar relationship would be expected between the neck axial compressive load and increasing amount of roof crush (or weaker roof), assuming that neck axial compression was causal to the cervical and upper thoracic spine injuries. Indeed, this trend was observed when comparing the simulated FE ATD neck load obtained using the Ford Explorer FE model when the roof was further weakened as shown in Figure 7. The FE ATD’s Neck load for the ‘weaker roof’ (green curve) increased in magnitude compared to the ‘weak roof’ (red dashed cure). In other words, a very weak roof will likely result in increased neck loading. As a further observation, bending of the neck during roof crush may also be affected by other factors, such as localised buckling of the roof structure and/or roof interior padding. These factors, may contribute to either entrapping the head in position [18] or force it to move laterally. Whilst more detailed simulation work needs to be carried out, it appears that the orientation of the head relative to the torso and head entrapment are critical factors in terms of axial compressive loads imparted to the occupant’s head during a rollover crash.
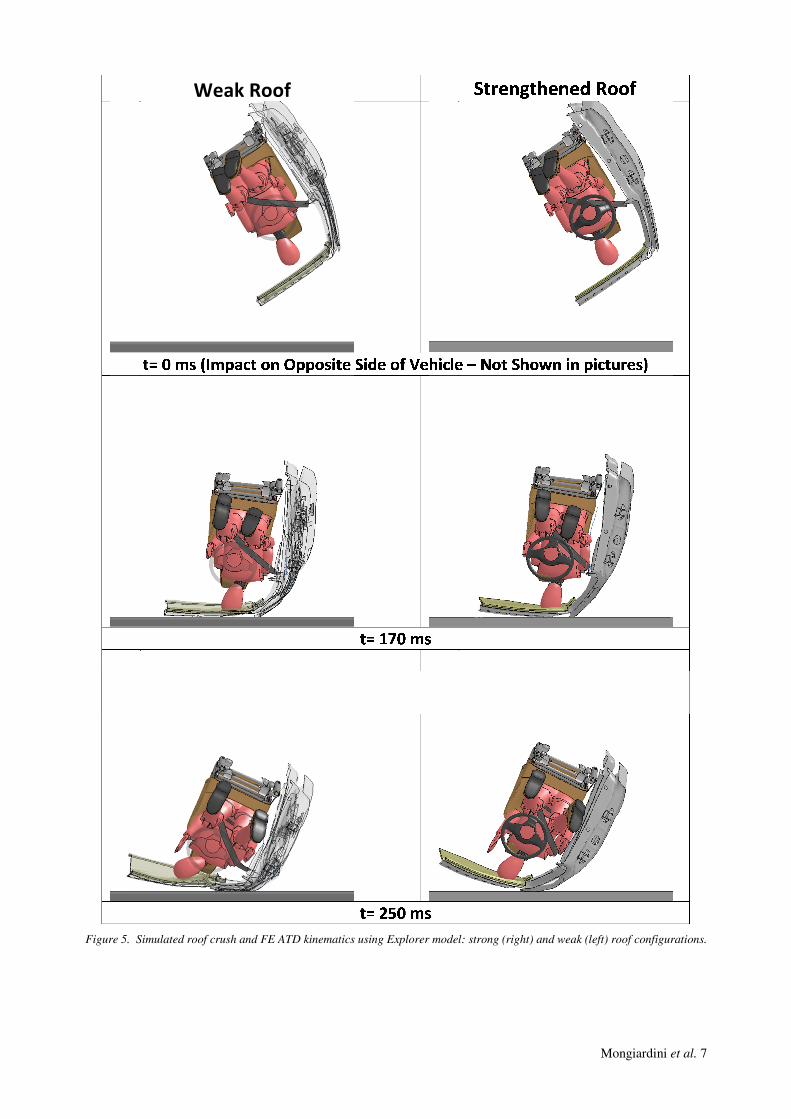
Mongiardini et al. 7
Figure 5. Simulated roof crush and FE ATD kinematics using Explorer model: strong (right) and weak (left) roof configurations.
Weak Roof
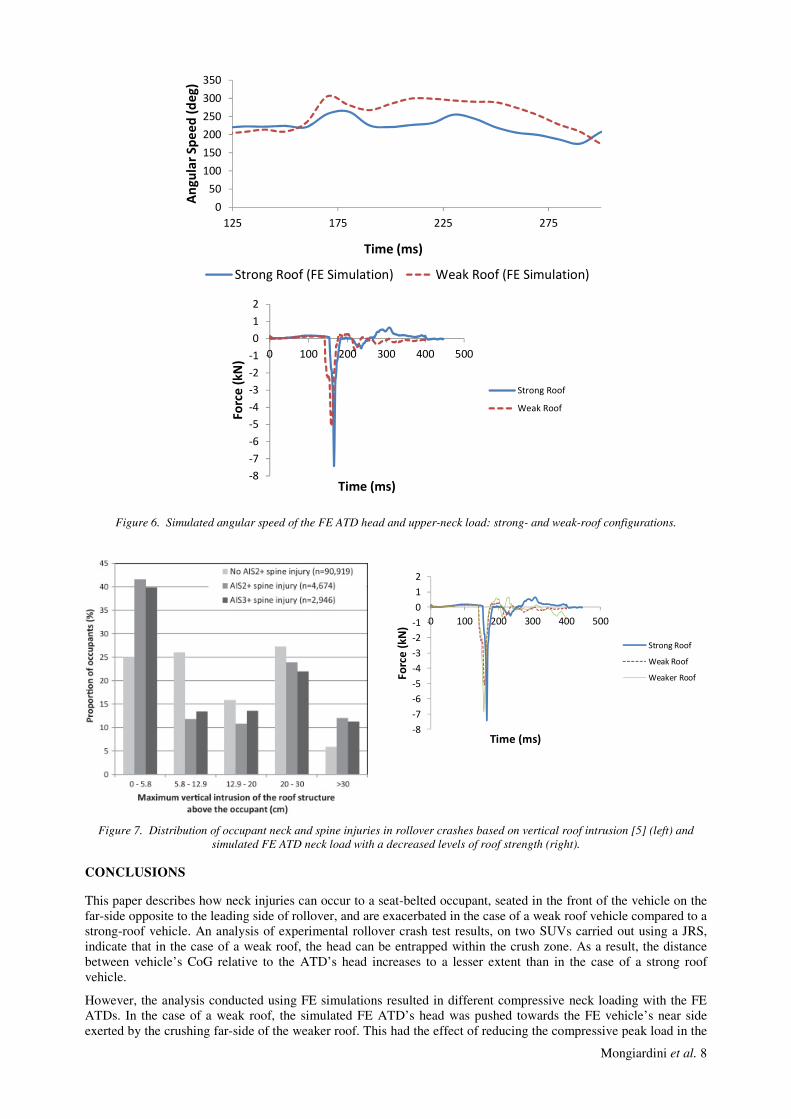
Mongiardini et al. 8
Figure 6. Simulated angular speed of the FE ATD head and upper-neck load: strong- and weak-roof configurations.
Figure 7. Distribution of occupant neck and spine injuries in rollover crashes based on vertical roof intrusion [5] (left) and simulated FE ATD neck load with a decreased levels of roof strength (right).
CONCLUSIONS
This paper describes how neck injuries can occur to a seat-belted occupant, seated in the front of the vehicle on the far-side opposite to the leading side of rollover, and are exacerbated in the case of a weak roof vehicle compared to a strong-roof vehicle. An analysis of experimental rollover crash test results, on two SUVs carried out using a JRS, indicate that in the case of a weak roof, the head can be entrapped within the crush zone. As a result, the distance between vehicle’s CoG relative to the ATD’s head increases to a lesser extent than in the case of a strong roof vehicle.
However, the analysis conducted using FE simulations resulted in different compressive neck loading with the FE ATDs. In the case of a weak roof, the simulated FE ATD’s head was pushed towards the FE vehicle’s near side exerted by the crushing far-side of the weaker roof. This had the effect of reducing the compressive peak load in the
050
100150200250300350
125 175 225 275
Angu
lar S
peed
(deg
)
Time (ms)
Strong Roof (FE Simulation) Weak Roof (FE Simulation)
-8-7-6-5-4-3-2-1012
0 100 200 300 400 500
Forc
e (k
N)
Time (ms)
Strong Roof
Weak Roof
-8-7-6-5-4-3-2-1012
0 100 200 300 400 500
Forc
e (k
N)
Time (ms)
Strong Roof
Weak Roof
Weaker Roof
Mongiardini et al. 9
FE ATD’s neck. In contrast, in the strong roof FE Vehicle the FE ATD’s head remained aligned with the torso and hence was subjected to a higher torso augmentation load (7.5 kN), albeit the load was less than that observed in the CFIR JRS tested weak roof vehicle (10 kN). This in turn indicates that inducing an offset to the head, e.g. side header rail air bag, that tilts the head inboard may alleviate the neck load in rollover crashes. This needs further investigation.
Whilst this analysis focused on the magnitude of the axial compressive force on the neck, which is indeed an important contributor to neck injury, future analysis should also consider neck flexion moments and shear forces. Although the Hybrid III is widely used for many crash applications, including rollover crash tests, the neck of the ATD has been observed to have limited biofidelity [30]. In particular, the neck response of the Hybrid III has been shown to be stiffer than the actual human neck [31]. Further investigations should be conducted using simulations with a detailed and validated human body FE model, such as the Total Human Model for Safety (THUMS) or Global Human Body Model Consortium (GHBMC). Ultimately, experimental tests with post-mortem human specimens should be considered as well.
ACKNOWLEDGEMENTS
The work described in this paper was part of the TARS UNSW Dynamic Rollover Protection (DROP) Project [27,32]. The authors would like to thank the Australian federal government’s Australian Research Council for providing funds to carry out this research through the Linkage Projects grants scheme (No. LP110100069). The authors would also thank the industry partners for providing industry funding as Partner Organisation to the ARC Linkage project, namely, the New South Wales state government’s Centre for Road Safety at Transport for New South Wales, the Victorian state government’s third-party insurer Transport Accident Commission (TAC), the West Australian (WA) state government’s Office of Road Safety at Main Roads WA, the mining company BHP Billiton Ltd., and the U.S. Center for Injury Research (CFIR). The rollover crash test results [22,23] using the CFIR JRS was provided by the Center for Injury Research (CfIR). The authors would also like to acknowledge the staff at the Road and Maritime Services (RMS) Crashlab for the setup and carrying out of the rollover crash tests using the UNSW JRS and the Explorer vehicle for FE model calibration purposes [25,27].
REFERENCES
1 National Highway Traffic Safety Administration (NHTSA), Traffic Safety Facts 2012, A Compilation of Motor Vehicle Crash Data from the Fatality Analysis Reporting System and the General Estimates System, National Center for Statistics and Analysis, U.S. Department of Transportation, DOT HS 812 032, 2012.
2 Fréchède, B., McIntosh A.S., Grzebieta R.H., and Bambach M.R., (2010). “Characteristics of Single-Vehicle Rollover Fatalities in Three Australian States (2000-2007).” Accident Analysis and Prevention, Vol. 43, Issue 3, pp. 804-12.
3 Young, D., Grzebieta R.H., Rechnitzer G., Bambach M., and Richardson S., (2006). “Rollover Crash safety: Characteristics and Issues.” 5th International Crashworthiness Conference (ICRASH 2006), Athens, Greece.
4 Grzebieta, R.H., Bambach M., McIntosh A.S., Digges K., Mattos G., Simons K., and Rechnitzer G., (2013). “Replicating Real-World Rollover Crash Injuries.” 23rd International Technical Conference on the Enhanced Safety of Vehicles (ESV), Seoul, Korea.
5 Bambach, M., Grzebieta R.H., McIntosh A.S., and Mattos G., (2013). “Cervical and Thoracic Spine Injury from Interactions with Vehicle Roofs in Pure Rollover Crashes.” Accident Analysis and Prevention, Vol. 50, pp. 34-43.
6 Moffatt E.A., (1975). “Occupant Motion in Rollover Collisions.” 19th Conference of the American Association of Automotive Medicine. San Diego, California, USA.
7 Bahling, G. S., Bundorf R.T., Kaspzyk G.S., Moffatt E.A., Orlowski K.F., and Stocke J.E., (1990). Rollover and Drop Tests: The influence of Roof Strength on Injury Mechanics using Belted Dummies. SAE Paper 902314, Society of Automotive Engineers, Warrendale, PA, USA.
8 Piziali, R., Hopper R., Girvan D., and Merala R., (1998). Injury Causation in Rollover Accidents and the Biofidelity of Hybrid III Data in Rollover Tests. SAE Paper 980362, Society of Automotive Engineers, Warrendale, PA, USA.
9 James, M. B., Nordhagen R.P., Schneider D.C., and Koh S.W., (2007). “Occupant Injury in Rollover Crashes: A Reexamination of Malibu II.” SAE Paper 2007-01-0369, Society of Automotive Engineers, Warrendale, PA, USA.
10 Grzebieta R.H., Young D., Bambach M., McIntosh A., (2007). Rollover Crashes: Diving Versus Roof Crush, Proc. 20th International Technical Conference on the Enhanced Safety of Vehicles, Lyon, France.
Mongiardini et al. 10
11 Brumbelow, M.L., Teoh E.R., Zuby D.S., and McCartt A.T., (2008). Roof Strength and Injury Risk in Rollover Crashes. Proceedings of the 2008 IRCOBI Conference, Bern, Switzerland.
12 Brumbelow, M. L. and Teoh E.R., (2009). Roof strength and injury risk in rollover crashes of passenger cars and SUVs. 21st International Technical Conference on the Enhanced of Safety of Vehicles (ESV), Stuttgart, Germany.
13 Friedman D. and Grzebieta.R.H., (2009). “A Proposed Rollover and Comprehensive Rating System.” 21st International Technical Conference on the Enhanced Safety of Vehicles (ESV), Stuttgart, Germany.
14 Mandell S.P., Kaufman R., Mack C.D., and Bulger W.M., (2010). Mortality and Injury Patterns Associated with Roof Crush in Rollover Crashes. Accident Analysis and Prevention, Vol. 42, pp. 1326–1331.
15 Conroy, C., Hoyt D.B., Eastman A.B., Erwin S., Pacyna S., Holbrook T.L., Vaughan T., Sise M., Kennedy F., and Velky T., (2006). Rollover Crashes: Predicting Serious Injury Based on Occupant, Vehicle, and Crash Characteristics. Accident Analysis and Prevention, Vol. 38, pp.835-842.
16 Kahane, K.J. (1989). An Evaluation of Door Locks and Roof Crush Resistance of Passenger Cars – Federal Motor Vehicle Safety Standards 206 and 216, DOT HS 807 489, NHTSA Technical Report.
17 Strashny A. (2007). The Role of Vertical Roof Intrusion and Post-Crash Headroom in Predicting Roof Contact Injuries to the Head, Neck or Face During FMVSS No.216 Rollovers; An Updated Analysis. DOT HS 810 847.
18 Rechnitzer G. & Lane J., (1994) Rollover Crash Study - Vehicle design and occupant injuries. Monash University Accident Research Centre (MUARC) Report No. 65, Monash University, Melbourne, Australia.
19 Young, D.P., Grzebieta R.H., McIntosh A.S., Bambach M., and Fréchède B., (2007). Diving Versus Roof Intrusion: A Review of Rollover Injury Causation. International Journal of Crashworthiness, Vol. 12, Issue 6, pp. 609-628.
20 Grzebieta, R.H., McIntosh A.S., and Bambach M., (2010). How Stronger Roofs Prevent Diving Injuries In Rollover Crashes. In Proceeding of the 7th International Crashworthiness Conference (ICRASH), Washington D.C, USA.
21 Jordan, A. and Bish J., (2005). Repeatability Testing of a Dynamic Rollover Test Fixture. In Proceedings of the International Technical Conference on the Enhanced Safety of Vehicles (ESV), Paper Number 05-0362, Washington D.C., USA.
22 Center for Injury Research (CfIR), (2008). JRS Dynamic Rollover Test of a 2007 Jeep Grand Cherokee.” Test Report submitted to Santos Family Foundation.
23 Center for Injury Research (CfIR), (2009). JRS Dynamic Rollover Test of a 2005 Volvo XC90. Test Report submitted to Santos Family Foundation.
24 Hallquist, J.O. (2014). LS-DYNA - Keyword User's Manual LS-DYNA R 7.1 (revision: 5471). Livermore Software Technology Corporation (LSTC), Livermore, CA.
25 Mongiardini, M., Mattos G., and Grzebieta R., (2014). Computer Modelling of a Test Device for Investigating Injury Causes in Vehicle Rollovers. Journal of the Australasian College of Road Safety, Vol. 25, No. 2, pp. 16-23.
26 Mongiardini, M., Grzebieta R., and Mattos G., (2015). Computer Modelling of Vehicle Rollover Crash Testing with the UNSW JRS. (In Preparation).
27 Grzebieta, R., McIntosh A., Mattos G., Simmons K., Rechnitzer G., Mongiardini M., Dal Nevo R., and Jackson C., (2013). Implementation of the UNSW Jordan Rollover System at Sydney’s Crashlab Test Facility. In Proceeding of the International Technical Conference on the Enhanced Safety of Vehicles (ESV), Paper Number 13-0120, Seoul, Republic of Korea.
28 National Crash Analysis Center (NCAC), (2014). Finite Element Model Archive. http://www.ncac.gwu.edu/vml/models.html (Last accessed: Sep. 19, 2014).
29 Livermore Software Technology Corporation (LSTC), (2015). Dummy and Barrier Models for LS-DYNA:. http://lstc.com/download/dummy_and_barrier_models (Last accessed: Jan. 19, 2015).
30 Fréchède BO, McIntosh AS, Grzebieta RH & Bambach M, (2009) Hybrid III ATD in inverted impacts: influence of impact angle on neck injury risk assessment, Annals of Biomedical Engineering; 37: 1403-1414.
31 McIntosh A.S., Frechede B., Grzebieta R.H. and Bambach M.R., (2010). Biomechanical considerations for a dynamic rollover crash test, Proc. 7th Int. Crashworthiness Conf. ICRASH 2010, ed. Chirwa E.C. and S. Kan, Washington DC.
32 Grzebieta R.H., Bambach M., McIntosh A.S., Digges K., Mattos G., Simons K., Rechnitzer G., (2013). Replicating Real World Rollover Crash Injuries, Proc. 23rd International Technical Conference on the Enhanced Safety of Vehicles, Seoul, Korea, Paper Number 13-0098-O.
Tan 1
ASSOCIATION BETWEEN VEHICLE PANEL DAMAGE AND THORACIC INJURY IN ROLLOVER CRASHES Tana Tan Raphael Grzebieta Mike Bambach Transport and Road Safety, The University of New South Wales Australia Jake Olivier School of Mathematics and Statistics, The University of New South Wales Australia Andrew McIntosh Monash Injury Research Institute, Monash University Australia Paper Number 15-0145 ABSTRACT Rollover crashes are infrequent and account for approximately 2% to 3% of all vehicle crashes in the US annually. However, when they do occur they are more likely to result in a serious injury or fatality than some other types of crashes. In rollovers, the thorax has been identified as one of the three most frequently seriously injured body regions. As such, research has been carried out over the last few decades to understand better environmental, vehicle and occupant variables in a rollover crash which contribute to an occupant sustaining a serious, i.e. of severity greater than or equal to three on the Abbreviated Injury Scale (AIS 3+), thoracic injury. The findings from the research described in this paper will provide information for the development of a dynamic rollover crash test protocol which includes assessment of thoracic injuries. The aim of this study is to determine if there is an association between vehicle panel damage and AIS3+ thoracic injuries. NASS CDS data from 2001 to 2012 was examined for single vehicle rollover crashes with occupants receiving serious thoracic injuries (cases) and those without thoracic injuries (controls). Vehicle panel damage for both cases and controls were coded and logistic regression performed to determine if there is an association between serious thoracic injury and vehicle panel damage.
The result of this study indicates that there is an association between thoracic injury and damage to the top-half of the left front door, top-half of the right front door and left side of the vehicle rearwards of the B-pillar.
INTRODUCTION
In 2012, rollovers constituted 2.4% of all vehicle crashes in the United States of America (USA) but they contributed to 34.6% of all motor vehicle crash fatalities equating to approximately 7,500 deaths (NHTSA, 2012b) . To date a widely accepted dynamic rollover crashworthiness crash test protocol has not been developed. In order to establish a valid protocol, the environmental, vehicle and occupant variables that are associated with serious injuries in a rollover need to be identified and a method of replicating these variables in a simulated rollover crash needs to be developed.
In a rollover crash, the head, spine and thorax are the three most commonly injured body regions for contained and restrained occupants (Mattos, Grzebieta, Bambach, & McIntosh, 2014; Parenteau, Gopal, & Viano, 2001) with the thorax being the second most commonly injured region (Bedewi, Godrick, Digges, & Bahouth, 2003; Moore, Vijayakumar, Steffey, Ramachandran, & Corrigan, 2005). Vital organs such as the heart and lungs are located within the thorax. Thus, protecting this region in a rollover crash is important and often under-researched in comparison to the head and spine. One of the more recent studies conducted to understand thoracic injuries in vehicle rollover crashes sustained by restrained and contained occupants was carried out by Bambach et al. (2013). Their study found that lung contusions are the most frequently reported thoracic injury followed by rib fractures. The main sources of these injuries were the door interior, seatbelt and seatback. The mechanisms of these injuries in rollover crashes is still being investigated through crash data, crash reconstruction, physical modelling and numerical modelling.
Tan 2
It was initially hypothesized that occupant injuries in rollovers are the result of intrusion into the occupant space (Conroy et al., 2006; Sharma & Singh, 2009). However, recent examination of NASS CDS rollover crash data by Bambach et al. (2013) found that only 7.4% of thoracic injuries are directly associated with any intrusion. As such, they proposed that thoracic injuries are likely to occur due to the occupant traversing laterally towards and impacting internal components of a vehicle. This finding shifts the focus to developing an understanding as to how vehicle roll kinematics results in an occupant traversing laterally into the vehicle’s interior thus causing thoracic injury. Bambach et al. (2013) also noted that there was not an obvious correlation between vehicle damage and thoracic injury citing, “…typically the side of the vehicle displayed some damage, indicating ground contact. However, a wide variety of vehicle damage occurred, varying from no damage (indicating no ground contact) to significant damage (indicating significant ground contact).” Digges et al. (2013) examined this in more and sought to find an association between vehicle crash damage patterns and thoracic injury but their study was only based on eight rollover crashes. That is, there was insufficient data to establish a comprehensive relationship between vehicle crash damage patterns and thoracic injury.
This study extends the work carried out by Digges et al. (2013) and Bambach et al. (2013) by determining if there is an association between vehicle crash damage patterns and thoracic injuries quantitatively.
METHOD
Data
The US National Automotive Sampling System (NASS) Crashworthiness Data System (CDS) collects data from approximately 5,000 police reported passenger car, light truck, van and utility vehicle crashes each year. In order to be selected in the sample, a crash must involve personal or property damage; be reported to the police; and the vehicle towed away. The CDS is a probability sample and each case is provided with a weighting factor to represent police reported crashes occurring in the US during that year thus allowing population estimates to be calculated (NHTSA, 2012a).
NASS CDS from 2001 to 2012, inclusive, was queried in SAS Enterprise Guide 5.1 (SAS Institute) with the following filters: single-vehicle tripped rollover crash with at least one quarter rollover where the front seat occupants were 16 years or older; were restrained and contained in the vehicle; the vehicle did not contact another object prior to, during or after rolling over; and no airbags were deployed. The vehicles included in this study were sedans, utilities, vans and light trucks with the steering wheel located on the left side. Multiple vehicle crashes with a vehicle undergoing a rollover prior to or subsequent to the impact with another vehicle produces different injury patterns thus were excluded (Digges, Eigen, & Dahdah, 2005). Additionally, it has been noted that 80% of all rollovers in the US are single vehicle rollovers (Eigen, 2003). From the filtered cases, two groups were created. Cases consisted of occupants with thoracic injuries of severity equal to or greater than three on the Abbreviated Injury Scale (AIS3+) (Champion, 2012) while controls consisted of occupants without thoracic injuries.
The query returned 43 cases and 761 controls. The weighting factor, nweighted, was 4,573 and 325,067 for cases and controls respectively. From the 761 controls, 200 were randomly selected for vehicle panel damage coding. This was reduced to 181 (nweighted = 55,905) controls, thus achieving a ratio of cases to controls of 1:4 to 1:5, after filtering out vehicles deemed unsuitable for inclusion in this study. These included vehicles where vehicle panel damage was obscured by plastic sheets used to prevent ingress of water into the vehicle; vehicles which were cut open and it was unclear if the panels were bent by rescue workers or damaged during the crash; or when vehicles were undergoing repairs when the photos were taken.
Coding of Vehicle Panel Damage
The panels forming the exterior of each vehicle was divided into eleven segments for each vehicle class (sedans, utilities, vans and light trucks). The segments consisted of the front fender, front door upper half, front door lower half, vehicle side rearwards of the B-pillar for either side and the front hood, glasshouse roof and boot lid for the top. These segments were titled as Left/Right 1, Left/Right 2, Left/Right 3, Left/Right 4, Top 1, Top 2 and Top 3 respectively for entry into SAS (See Figure 1).
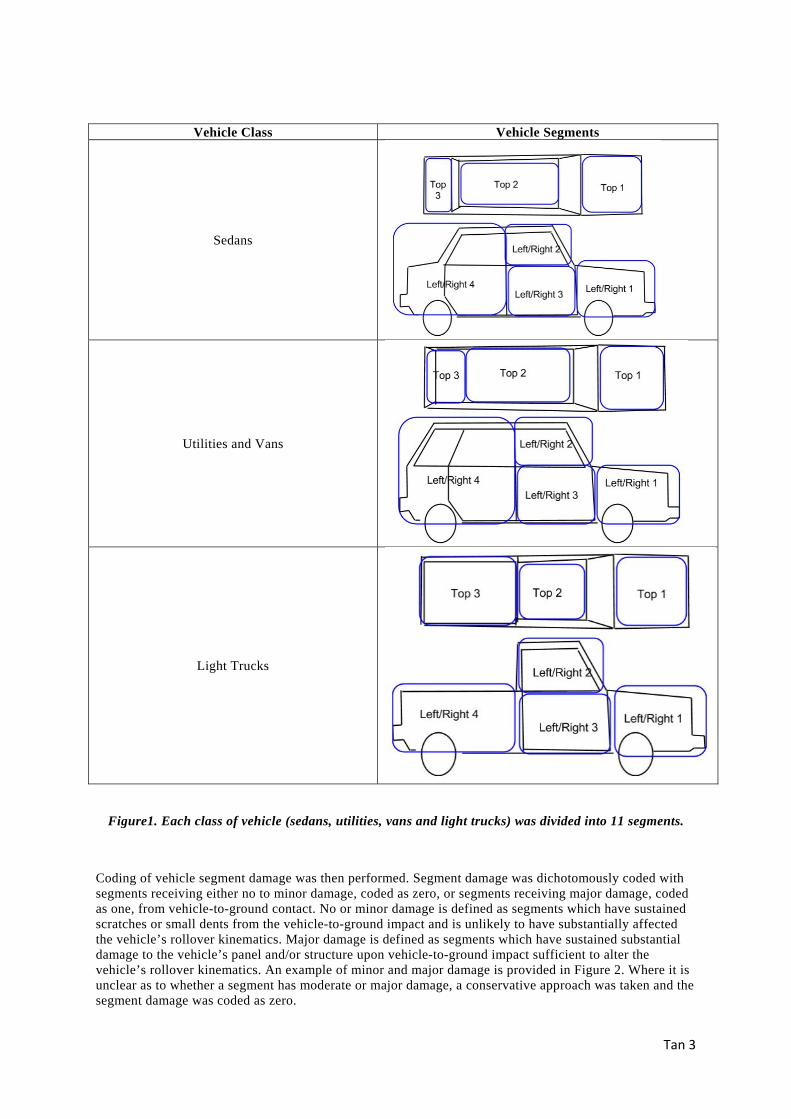
Tan 3
Vehicle Class Vehicle Segments
Sedans
Utilities and Vans
Light Trucks
Figure1. Each class of vehicle (sedans, utilities, vans and light trucks) was divided into 11 segments.
Coding of vehicle segment damage was then performed. Segment damage was dichotomously coded with segments receiving either no to minor damage, coded as zero, or segments receiving major damage, coded as one, from vehicle-to-ground contact. No or minor damage is defined as segments which have sustained scratches or small dents from the vehicle-to-ground impact and is unlikely to have substantially affected the vehicle’s rollover kinematics. Major damage is defined as segments which have sustained substantial damage to the vehicle’s panel and/or structure upon vehicle-to-ground impact sufficient to alter the vehicle’s rollover kinematics. An example of minor and major damage is provided in Figure 2. Where it is unclear as to whether a segment has moderate or major damage, a conservative approach was taken and the segment damage was coded as zero.
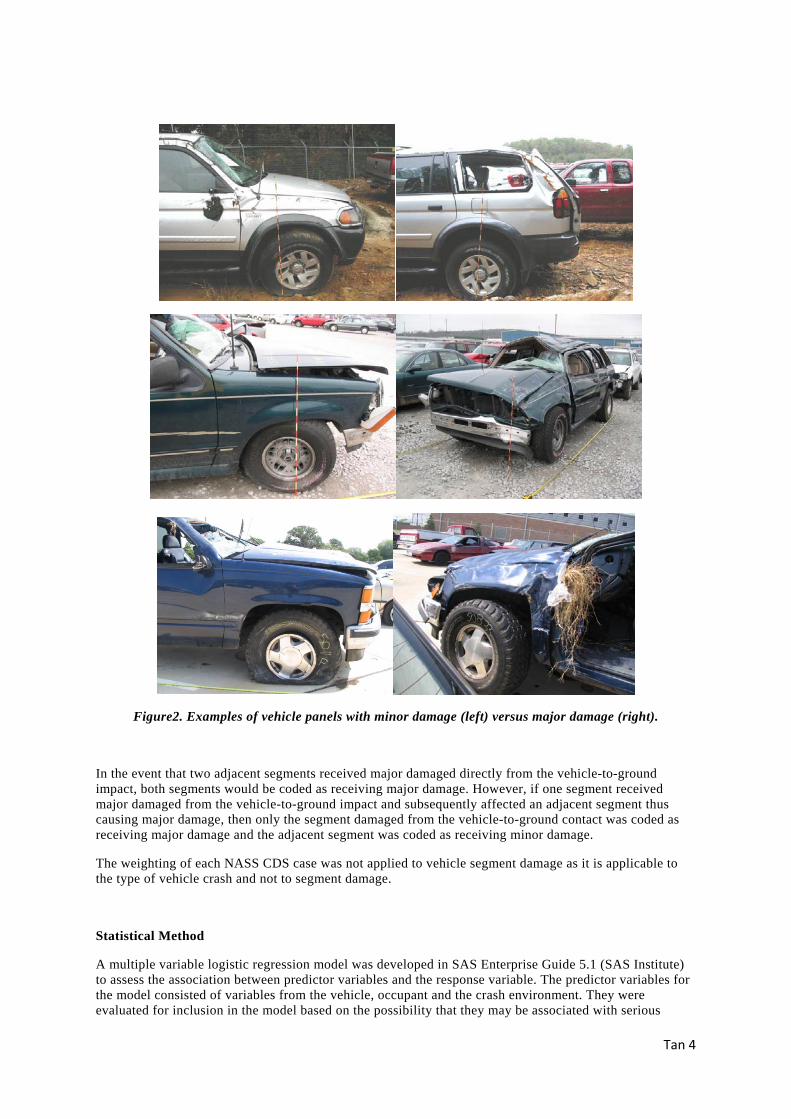
Tan 4
Figure2. Examples of vehicle panels with minor damage (left) versus major damage (right).
In the event that two adjacent segments received major damaged directly from the vehicle-to-ground impact, both segments would be coded as receiving major damage. However, if one segment received major damaged from the vehicle-to-ground impact and subsequently affected an adjacent segment thus causing major damage, then only the segment damaged from the vehicle-to-ground contact was coded as receiving major damage and the adjacent segment was coded as receiving minor damage.
The weighting of each NASS CDS case was not applied to vehicle segment damage as it is applicable to the type of vehicle crash and not to segment damage.
Statistical Method
A multiple variable logistic regression model was developed in SAS Enterprise Guide 5.1 (SAS Institute) to assess the association between predictor variables and the response variable. The predictor variables for the model consisted of variables from the vehicle, occupant and the crash environment. They were evaluated for inclusion in the model based on the possibility that they may be associated with serious
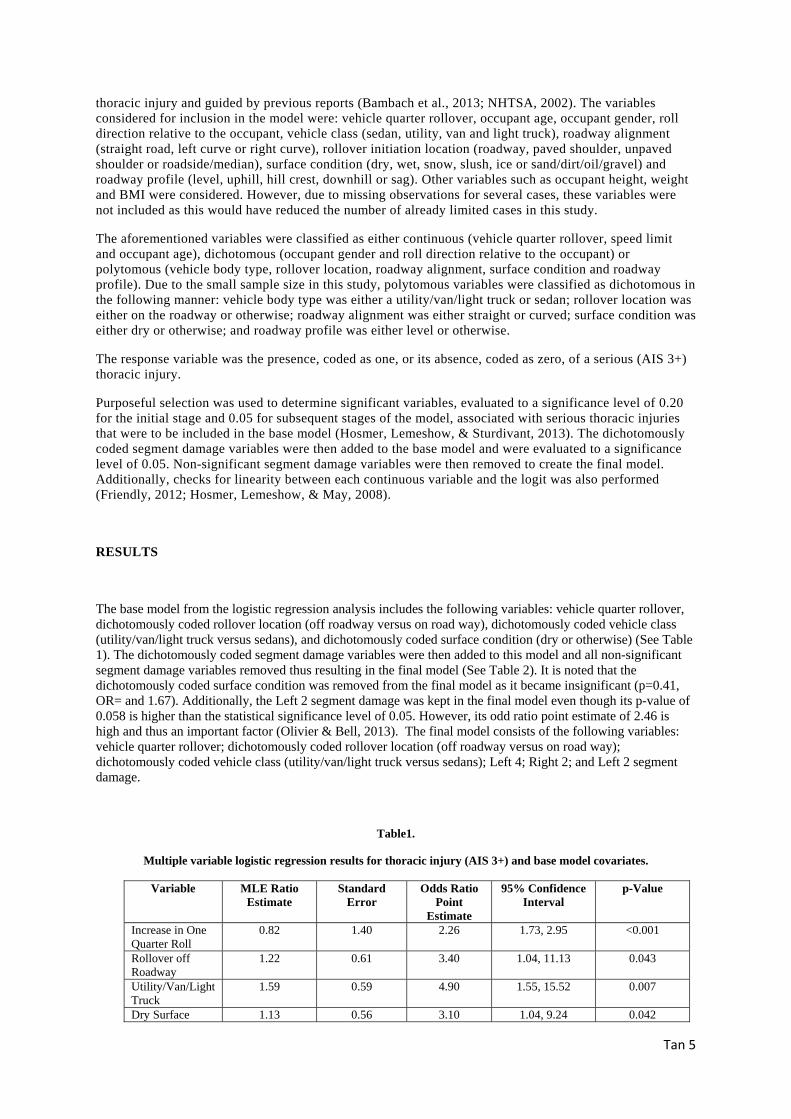
Tan 5
thoracic injury and guided by previous reports (Bambach et al., 2013; NHTSA, 2002). The variables considered for inclusion in the model were: vehicle quarter rollover, occupant age, occupant gender, roll direction relative to the occupant, vehicle class (sedan, utility, van and light truck), roadway alignment (straight road, left curve or right curve), rollover initiation location (roadway, paved shoulder, unpaved shoulder or roadside/median), surface condition (dry, wet, snow, slush, ice or sand/dirt/oil/gravel) and roadway profile (level, uphill, hill crest, downhill or sag). Other variables such as occupant height, weight and BMI were considered. However, due to missing observations for several cases, these variables were not included as this would have reduced the number of already limited cases in this study.
The aforementioned variables were classified as either continuous (vehicle quarter rollover, speed limit and occupant age), dichotomous (occupant gender and roll direction relative to the occupant) or polytomous (vehicle body type, rollover location, roadway alignment, surface condition and roadway profile). Due to the small sample size in this study, polytomous variables were classified as dichotomous in the following manner: vehicle body type was either a utility/van/light truck or sedan; rollover location was either on the roadway or otherwise; roadway alignment was either straight or curved; surface condition was either dry or otherwise; and roadway profile was either level or otherwise.
The response variable was the presence, coded as one, or its absence, coded as zero, of a serious (AIS 3+) thoracic injury.
Purposeful selection was used to determine significant variables, evaluated to a significance level of 0.20 for the initial stage and 0.05 for subsequent stages of the model, associated with serious thoracic injuries that were to be included in the base model (Hosmer, Lemeshow, & Sturdivant, 2013). The dichotomously coded segment damage variables were then added to the base model and were evaluated to a significance level of 0.05. Non-significant segment damage variables were then removed to create the final model. Additionally, checks for linearity between each continuous variable and the logit was also performed (Friendly, 2012; Hosmer, Lemeshow, & May, 2008).
RESULTS
The base model from the logistic regression analysis includes the following variables: vehicle quarter rollover, dichotomously coded rollover location (off roadway versus on road way), dichotomously coded vehicle class (utility/van/light truck versus sedans), and dichotomously coded surface condition (dry or otherwise) (See Table 1). The dichotomously coded segment damage variables were then added to this model and all non-significant segment damage variables removed thus resulting in the final model (See Table 2). It is noted that the dichotomously coded surface condition was removed from the final model as it became insignificant (p=0.41, OR= and 1.67). Additionally, the Left 2 segment damage was kept in the final model even though its p-value of 0.058 is higher than the statistical significance level of 0.05. However, its odd ratio point estimate of 2.46 is high and thus an important factor (Olivier & Bell, 2013). The final model consists of the following variables: vehicle quarter rollover; dichotomously coded rollover location (off roadway versus on road way); dichotomously coded vehicle class (utility/van/light truck versus sedans); Left 4; Right 2; and Left 2 segment damage.
Table1.
Multiple variable logistic regression results for thoracic injury (AIS 3+) and base model covariates.
Variable MLE Ratio Estimate
Standard Error
Odds Ratio Point
Estimate
95% Confidence Interval
p-Value
Increase in One Quarter Roll
0.82 1.40 2.26 1.73, 2.95 <0.001
Rollover off Roadway
1.22 0.61 3.40 1.04, 11.13 0.043
Utility/Van/Light Truck
1.59 0.59 4.90 1.55, 15.52 0.007
Dry Surface 1.13 0.56 3.10 1.04, 9.24 0.042
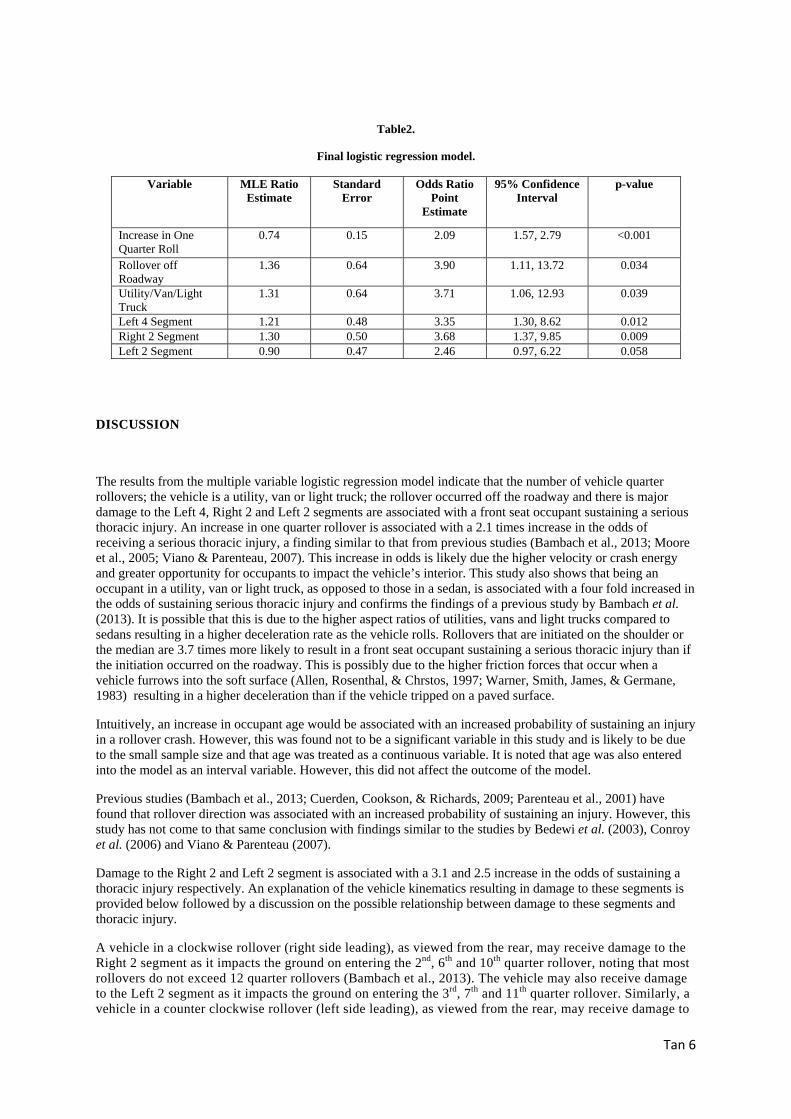
Tan 6
Table2.
Final logistic regression model.
DISCUSSION
The results from the multiple variable logistic regression model indicate that the number of vehicle quarter rollovers; the vehicle is a utility, van or light truck; the rollover occurred off the roadway and there is major damage to the Left 4, Right 2 and Left 2 segments are associated with a front seat occupant sustaining a serious thoracic injury. An increase in one quarter rollover is associated with a 2.1 times increase in the odds of receiving a serious thoracic injury, a finding similar to that from previous studies (Bambach et al., 2013; Moore et al., 2005; Viano & Parenteau, 2007). This increase in odds is likely due the higher velocity or crash energy and greater opportunity for occupants to impact the vehicle’s interior. This study also shows that being an occupant in a utility, van or light truck, as opposed to those in a sedan, is associated with a four fold increased in the odds of sustaining serious thoracic injury and confirms the findings of a previous study by Bambach et al. (2013). It is possible that this is due to the higher aspect ratios of utilities, vans and light trucks compared to sedans resulting in a higher deceleration rate as the vehicle rolls. Rollovers that are initiated on the shoulder or the median are 3.7 times more likely to result in a front seat occupant sustaining a serious thoracic injury than if the initiation occurred on the roadway. This is possibly due to the higher friction forces that occur when a vehicle furrows into the soft surface (Allen, Rosenthal, & Chrstos, 1997; Warner, Smith, James, & Germane, 1983) resulting in a higher deceleration than if the vehicle tripped on a paved surface.
Intuitively, an increase in occupant age would be associated with an increased probability of sustaining an injury in a rollover crash. However, this was found not to be a significant variable in this study and is likely to be due to the small sample size and that age was treated as a continuous variable. It is noted that age was also entered into the model as an interval variable. However, this did not affect the outcome of the model.
Previous studies (Bambach et al., 2013; Cuerden, Cookson, & Richards, 2009; Parenteau et al., 2001) have found that rollover direction was associated with an increased probability of sustaining an injury. However, this study has not come to that same conclusion with findings similar to the studies by Bedewi et al. (2003), Conroy et al. (2006) and Viano & Parenteau (2007).
Damage to the Right 2 and Left 2 segment is associated with a 3.1 and 2.5 increase in the odds of sustaining a thoracic injury respectively. An explanation of the vehicle kinematics resulting in damage to these segments is provided below followed by a discussion on the possible relationship between damage to these segments and thoracic injury.
A vehicle in a clockwise rollover (right side leading), as viewed from the rear, may receive damage to the Right 2 segment as it impacts the ground on entering the 2nd, 6th and 10th quarter rollover, noting that most rollovers do not exceed 12 quarter rollovers (Bambach et al., 2013). The vehicle may also receive damage to the Left 2 segment as it impacts the ground on entering the 3rd, 7th and 11th quarter rollover. Similarly, a vehicle in a counter clockwise rollover (left side leading), as viewed from the rear, may receive damage to
Variable MLE Ratio Estimate
Standard Error
Odds Ratio Point
Estimate
95% Confidence Interval
p-value
Increase in One Quarter Roll
0.74 0.15 2.09 1.57, 2.79 <0.001
Rollover off Roadway
1.36 0.64 3.90 1.11, 13.72 0.034
Utility/Van/Light Truck
1.31 0.64 3.71 1.06, 12.93 0.039
Left 4 Segment 1.21 0.48 3.35 1.30, 8.62 0.012 Right 2 Segment 1.30 0.50 3.68 1.37, 9.85 0.009 Left 2 Segment 0.90 0.47 2.46 0.97, 6.22 0.058
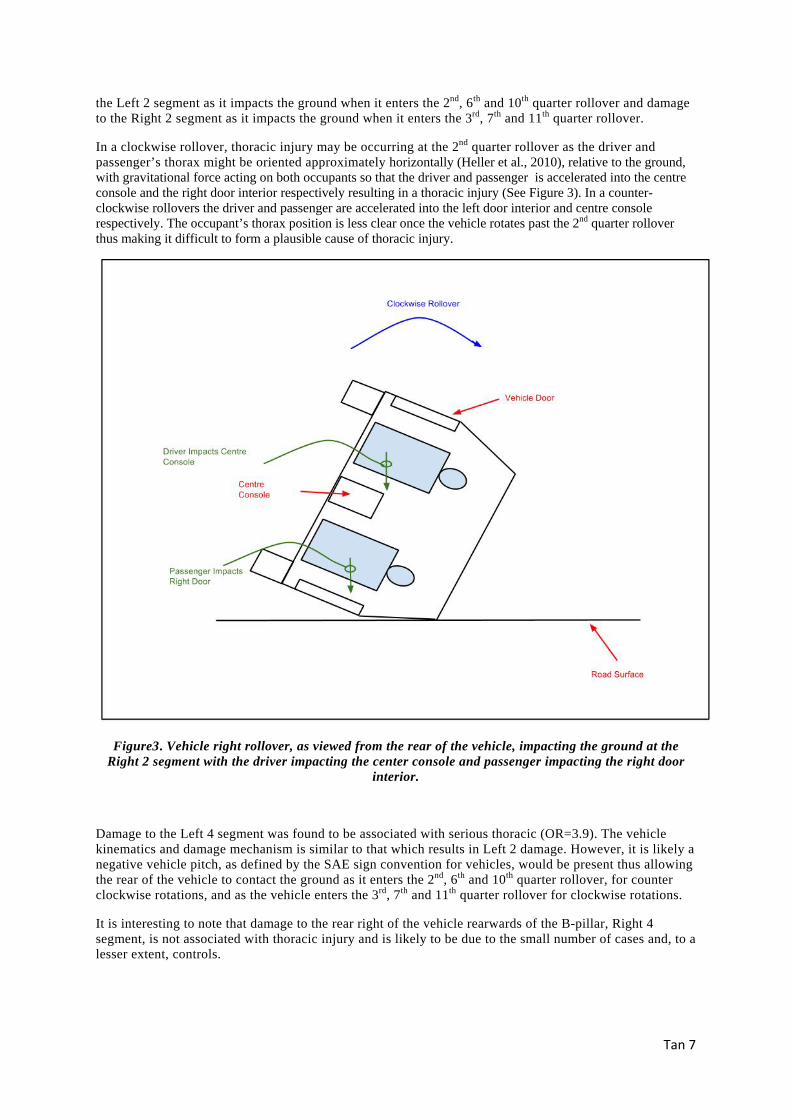
Tan 7
the Left 2 segment as it impacts the ground when it enters the 2nd, 6th and 10th quarter rollover and damage to the Right 2 segment as it impacts the ground when it enters the 3rd, 7th and 11th quarter rollover.
In a clockwise rollover, thoracic injury may be occurring at the 2nd quarter rollover as the driver and passenger’s thorax might be oriented approximately horizontally (Heller et al., 2010), relative to the ground, with gravitational force acting on both occupants so that the driver and passenger is accelerated into the centre console and the right door interior respectively resulting in a thoracic injury (See Figure 3). In a counter-clockwise rollovers the driver and passenger are accelerated into the left door interior and centre console respectively. The occupant’s thorax position is less clear once the vehicle rotates past the 2nd quarter rollover thus making it difficult to form a plausible cause of thoracic injury.
Figure3. Vehicle right rollover, as viewed from the rear of the vehicle, impacting the ground at the Right 2 segment with the driver impacting the center console and passenger impacting the right door
interior.
Damage to the Left 4 segment was found to be associated with serious thoracic (OR=3.9). The vehicle kinematics and damage mechanism is similar to that which results in Left 2 damage. However, it is likely a negative vehicle pitch, as defined by the SAE sign convention for vehicles, would be present thus allowing the rear of the vehicle to contact the ground as it enters the 2nd, 6th and 10th quarter rollover, for counter clockwise rotations, and as the vehicle enters the 3rd, 7th and 11th quarter rollover for clockwise rotations.
It is interesting to note that damage to the rear right of the vehicle rearwards of the B-pillar, Right 4 segment, is not associated with thoracic injury and is likely to be due to the small number of cases and, to a lesser extent, controls.
Tan 8
Limitations
The limitations of this study should be noted. The NASS CDS data is a probability sample rather than a census and the data is dependent on the investigation and data entry accuracy of the NASS investigator. Logistic regression models can be biased towards a particular sample. Occupant height and weight were not included as variables in the analysis. The coding of vehicle panel damage is subjective and is based on residual deformation only. Sheet metal strength varies from vehicle model to model thus two different vehicle models subjected to the same impact force will deform to different extents. Certain parts of a vehicle, such as the A-pillar, are significantly stronger than the panels forming the exterior of the vehicle thus if the vehicle in a rollover impacted the ground with a structural component first, this may result in the panels receiving minor damage. The regression model establishes associations between the predictor variables and response variable but it does not imply causality.
CONCLUSION
In this study, coding of vehicle panel damage was carried out for a total of 224 vehicles involved in pure rollover crashes. The association between vehicle panel damage; vehicle class; occupant variables; and the crash environment variables and serious, AIS 3+, thoracic injury was assessed. Vehicle quarter rollover, rollovers involving Utilities/Van/Light trucks, rollovers occurring off the roadway, damage to the vehicle rearwards of the left B-pillar (Left 4 segment), damage to the top-half of the right front door (Right 2 segment) and damage to the top-half of the left front door (Left 2 segment) were associated with serious thoracic injury in rollover crashes.
Although this study has identified damage to the left rear of the vehicle rearwards of the B-pillar and top-half of the right and left front door are associated with serous thoracic injury and may need to be taken into account in rollover reconstructions, future studies are still needed to verify this finding and to develop a better understanding as to how damage to these areas of the vehicle is associated with thoracic injuries. Future studies could also include vehicle roof strength to weight ratio and roof shape as variables in the logistic regression model as well as increasing the number of cases and controls.
Tan 9
REFERENCES Allen, R. W., Rosenthal, T. J., & Chrstos, J. P. (1997). A Vehicle Dynamics Tire Model for Both Pavement and Off-
Road Conditions (Paper No. 970559): SAE Technical Paper. Bambach, M. R., Grzebieta, R. H., & McIntosh, A. S. (2013). Thoracic Injuries to Contained and Restrained
Occupants in Single-Vehicle Pure Rollover Crashes. Accident Analysis and Prevention(50), 115-121. Bedewi, P. G., Godrick, D. A., Digges, K., & Bahouth, G. T. (2003). An Investigation of Occupant Injury in
Rollovers: NASS-CDS Analysis of Injury Severity and Source by Rollover Attributes. Paper presented at the Proceedings of the 18th International Technical Conference on the Enhanced Safety of Vehicles, USA.
Champion, H. R. (2012). Abbreviated Injury Scale. In J.-L. Vincent & J. Hall (Eds.), Encyclopedia of Intensive Care Medicine (pp. 1-5): Springer Berlin Heidelberg.
Conroy, C., Hoyt, D. B., Eastman, B. A., Erwin, S., Pacyna, S., Holbrook, T. L., . . . Velky, T. (2006). Rollover Crashes: Predicting Serious Injury Based on Occupant, Vehicle and Crash Characteristics. Accident Analysis and Prevention(38), 835-842.
Cuerden, R., Cookson, R., & Richards, D. (2009). Car Rollover Mechanisms and Injury Outcome. Paper presented at the Proceedings of the 21st Conference on the Enhanced Safety of Vehicles, Stuttgart, Germany.
Digges, K., Eigen, A. M., & Dahdah, S. (2005). Injury Patterns in Rollovers by Crash Severity. Paper presented at the Proceedings of the 19th International Technical Conference on the Enhanced Safety of Vehicles, USA.
Digges, K., Tahan, F., Grzebieta, R. H., Bambach, M. R., Mattos, G. A., & McIntosh, A. S. (2013). Crash Damage Patterns Associated with Chest Injuries in Far-Side Rollovers.
Eigen, A. M. (2003). Examination of Rollover Crash Mechanisms and Occupant Outcomes. (DOT HS 809 692). Washington DC.
Friendly, M. (2012). Visualizing Categorical Data with SAS and R. York University. Heller, M. F., Newberry, W. N., Smedley, J. E., Eswaran, S. K., Croteau, J. J., & Carhart, M. R. (2010). Occupant
Kinematics and Injury Mechanisms During Rollover in a High Strength-to-Weight Ratio Vehicle. SAE International Journal of Passenger Cars-Mechanical Systems, 3(1), 450-466.
Hosmer, D. W., Lemeshow, S., & May, S. (2008). Model Development Applied Survival Analysis (pp. 132-168): John Wiley & Sons, Inc.
Hosmer, D. W., Lemeshow, S., & Sturdivant, R. (2013). Applied Logistic Regression Wiley Series in Probability and Statistics, (pp. 528).
Mattos, G., Grzebieta, R., Bambach, M., & McIntosh, A. S. (2014). Roof Damage Patterns and Serious Head Injuries in Pure Rollover Crashes. Paper presented at the Transport Research Board Annual Meeting, Washington D.C.
Moore, T., Vijayakumar, V., Steffey, D. L., Ramachandran, K., & Corrigan, C. F. (2005). Biomechanical Factors and Injury Risk in High-Severity Rollovers. Association for the Advancement of Automotive Medicine, 49.
NHTSA. (2002). Characteristics of Fatal Rollover Crashes. (DOT HS 809 438). NHTSA. (2012a). NASS Analytical Users Manual. NHTSA. (2012b). Traffic Safety Facts 2012. Olivier, J., & Bell, M. (2013). Effect Sizes of a 2x2 Contingency Table. PLoS One, 8(3). Parenteau, C., Gopal, M., & Viano, D. (2001). Near- and Far-Side Adult Front Passenger Kinematics in a Vehicle
Rollover. Paper presented at the Proceedings of the 45th Stapp Car Crash Conference. SAS Institute. SAS Enterprise Guide (Version 5.1). Sharma, D., & Singh, S. (2009). A Classification Model for Prediction of Rollover Crash Severity. Paper presented
at the Proceedings of the 21st Internatioal Technical Conference on the Enhanced Safety of Vehicles, Stuttgart, Germany.
Viano, D. C., & Parenteau, C. S. (2007). Rollover Injury: Effects of Near- and Far-Seating Position, Belt Use, and Number of Quarter Rolls. Traffic Injury Prevention(8), 382-392.
Warner, C. Y., Smith, G. C., James, M. B., & Germane, G. J. (1983). Friction Applications in Accident Reconstruction: SAE Technical Paper.
Toczyski 1
DYNAMIC VALIDATION OF ROLLOVER BUCK ROOF STRUCTURE Jacek Toczyski Qi Zhang Patrick Foltz Brian Overby Jim Bolton Joey White John Moors Jack Cochran Carolyn Roberts Jeff Crandall Jason Kerrigan Center for Applied Biomechanics, University of Virginia United States Paper Number 15-0336 ABSTRACT Effective passive countermeasure design for rollover injury prevention requires thorough understanding of the occupant response in rollover impact. Thus, the dummy biofidelity in rollover crashes is important. To evaluate the dummy biofidelity a test buck was developed for a variety of surrogate biofidelity analyses. The buck was designed to mimic the geometry and inertial properties of a modern strong-roof vehicle. It consisted of two major parts: a deformable, replaceable greenhouse and a rigid base. The goal of this study was to show that the greenhouse structure proposed in this paper, when loaded in a static roof crush test (similar to FMVSS 216) reaches the strength-to-weight ratio level of real vehicles and when loaded in a dynamic rollover test, the roof deformation matches deformation magnitude and shapes observed in the vehicles from the current United States (US) fleet. To achieve this goal a multi-step design approach was used, including a quasi-static roof crush test and a rollover test on fabricated prototypes of the buck roof structure. Based on the gathered data, modifications were introduced to the roof design to improve the greenhouse mechanical response, both dynamically and quasi-statically. Once the design was fixed, one additional static and twelve dynamic rollover tests were performed and roof structure deformation was compared to the measurements made on two late-model US-market vehicles (an SUV and a mini-van), tested in similar conditions. The roof exhibited a desired response under the quasi-static loading with the peak value (61.1 kN) within first 127 mm of platen motion, which resulted in the strength-to-weight ratio of 3.76. During the twelve rollover tests the magnitude and shape of the buck roof deformation were consistent with those measured on the two test vehicles. In the twelve tests the maximum resultant displacements of the trailing side A- and B-pillar (after excluding three outlier tests due to welding defects) were as follows: 189-223 mm and 183-222 mm, respectively. The component displacements of the B-pillar were: between 165-198 mm in SAE Y and between 84-106 mm in SAE Z. The results of this study showed that the designed roof structure can match the deformation magnitude and shapes, including the prevalence of greater lateral than vertical displacement, seen in the current US fleet vehicles. The roof developed in this study has a quasi-static response similar to that of real vehicles loaded in a FMVSS 216-like test. It mimics the stiffness of real vehicle roofs under static and dynamic roof crush loading, and thus it can be used with the test buck to simulate real vehicle rollover crashes to perform parametric analyses and evaluate dummy biofidelity.
INTRODUCTION
Rollover crashes present a challenge to improve occupant safety. Effective passive countermeasure design for rollover injury prevention requires thorough understanding of the occupant response in rollover impact. NHTSA showed in one of its research notes that higher roof strength results in lower roof deformation during a rollover crash (NHTSA 2010). The lower roof deformation was previously correlated to reduction in injury risk to the head, neck, or face (Austin et al. 2005).
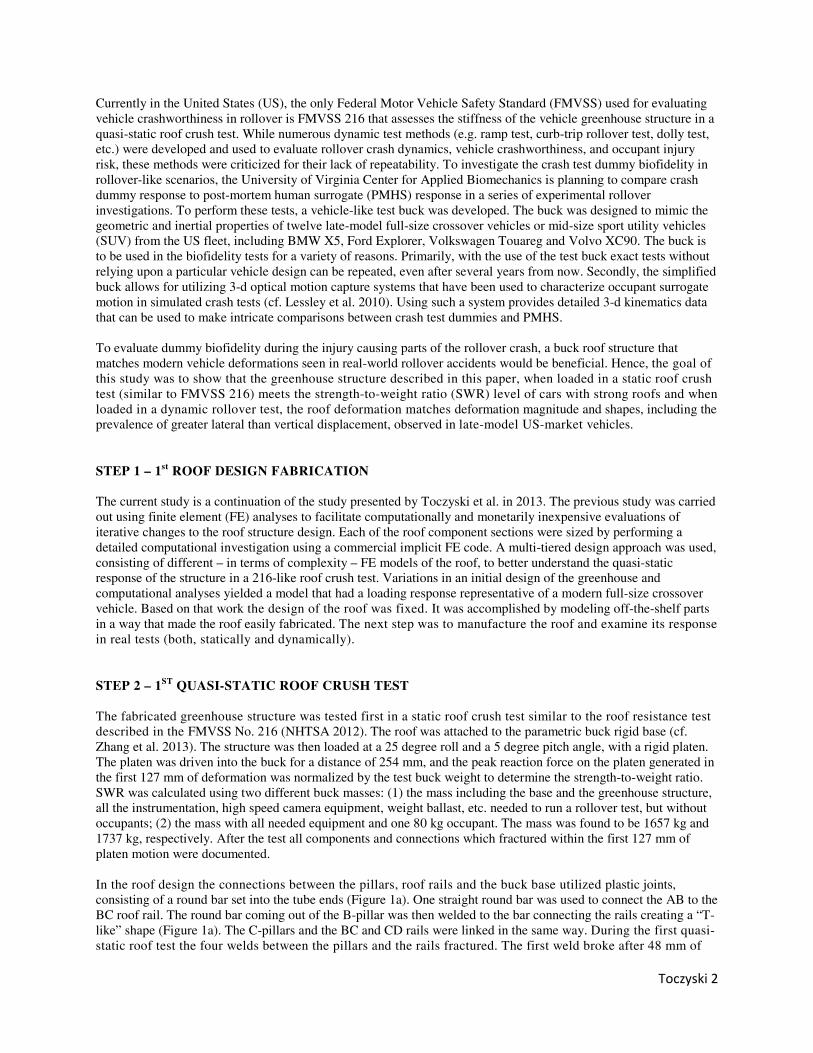
Toczyski 2
Currently in the United States (US), the only Federal Motor Vehicle Safety Standard (FMVSS) used for evaluating vehicle crashworthiness in rollover is FMVSS 216 that assesses the stiffness of the vehicle greenhouse structure in a quasi-static roof crush test. While numerous dynamic test methods (e.g. ramp test, curb-trip rollover test, dolly test, etc.) were developed and used to evaluate rollover crash dynamics, vehicle crashworthiness, and occupant injury risk, these methods were criticized for their lack of repeatability. To investigate the crash test dummy biofidelity in rollover-like scenarios, the University of Virginia Center for Applied Biomechanics is planning to compare crash dummy response to post-mortem human surrogate (PMHS) response in a series of experimental rollover investigations. To perform these tests, a vehicle-like test buck was developed. The buck was designed to mimic the geometric and inertial properties of twelve late-model full-size crossover vehicles or mid-size sport utility vehicles (SUV) from the US fleet, including BMW X5, Ford Explorer, Volkswagen Touareg and Volvo XC90. The buck is to be used in the biofidelity tests for a variety of reasons. Primarily, with the use of the test buck exact tests without relying upon a particular vehicle design can be repeated, even after several years from now. Secondly, the simplified buck allows for utilizing 3-d optical motion capture systems that have been used to characterize occupant surrogate motion in simulated crash tests (cf. Lessley et al. 2010). Using such a system provides detailed 3-d kinematics data that can be used to make intricate comparisons between crash test dummies and PMHS. To evaluate dummy biofidelity during the injury causing parts of the rollover crash, a buck roof structure that matches modern vehicle deformations seen in real-world rollover accidents would be beneficial. Hence, the goal of this study was to show that the greenhouse structure described in this paper, when loaded in a static roof crush test (similar to FMVSS 216) meets the strength-to-weight ratio (SWR) level of cars with strong roofs and when loaded in a dynamic rollover test, the roof deformation matches deformation magnitude and shapes, including the prevalence of greater lateral than vertical displacement, observed in late-model US-market vehicles.
STEP 1 – 1st ROOF DESIGN FABRICATION
The current study is a continuation of the study presented by Toczyski et al. in 2013. The previous study was carried out using finite element (FE) analyses to facilitate computationally and monetarily inexpensive evaluations of iterative changes to the roof structure design. Each of the roof component sections were sized by performing a detailed computational investigation using a commercial implicit FE code. A multi-tiered design approach was used, consisting of different – in terms of complexity – FE models of the roof, to better understand the quasi-static response of the structure in a 216-like roof crush test. Variations in an initial design of the greenhouse and computational analyses yielded a model that had a loading response representative of a modern full-size crossover vehicle. Based on that work the design of the roof was fixed. It was accomplished by modeling off-the-shelf parts in a way that made the roof easily fabricated. The next step was to manufacture the roof and examine its response in real tests (both, statically and dynamically).
STEP 2 – 1ST QUASI-STATIC ROOF CRUSH TEST
The fabricated greenhouse structure was tested first in a static roof crush test similar to the roof resistance test described in the FMVSS No. 216 (NHTSA 2012). The roof was attached to the parametric buck rigid base (cf. Zhang et al. 2013). The structure was then loaded at a 25 degree roll and a 5 degree pitch angle, with a rigid platen. The platen was driven into the buck for a distance of 254 mm, and the peak reaction force on the platen generated in the first 127 mm of deformation was normalized by the test buck weight to determine the strength-to-weight ratio. SWR was calculated using two different buck masses: (1) the mass including the base and the greenhouse structure, all the instrumentation, high speed camera equipment, weight ballast, etc. needed to run a rollover test, but without occupants; (2) the mass with all needed equipment and one 80 kg occupant. The mass was found to be 1657 kg and 1737 kg, respectively. After the test all components and connections which fractured within the first 127 mm of platen motion were documented. In the roof design the connections between the pillars, roof rails and the buck base utilized plastic joints, consisting of a round bar set into the tube ends (Figure 1a). One straight round bar was used to connect the AB to the BC roof rail. The round bar coming out of the B-pillar was then welded to the bar connecting the rails creating a “T-like” shape (Figure 1a). The C-pillars and the BC and CD rails were linked in the same way. During the first quasi-static roof test the four welds between the pillars and the rails fractured. The first weld broke after 48 mm of
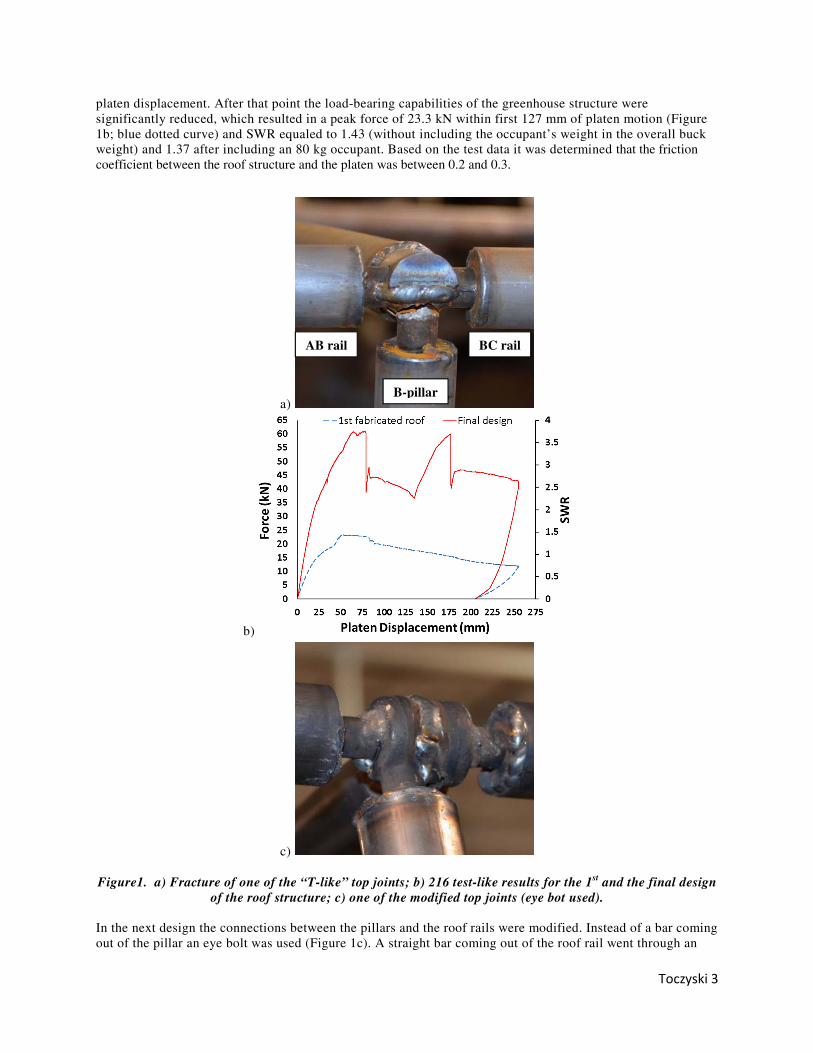
Toczyski 3
platen displacement. After that point the load-bearing capabilities of the greenhouse structure were significantly reduced, which resulted in a peak force of 23.3 kN within first 127 mm of platen motion (Figure 1b; blue dotted curve) and SWR equaled to 1.43 (without including the occupant’s weight in the overall buck weight) and 1.37 after including an 80 kg occupant. Based on the test data it was determined that the friction coefficient between the roof structure and the platen was between 0.2 and 0.3.
a)
b)
c)
Figure1. a) Fracture of one of the “T-like” top joints; b) 216 test-like results for the 1st and the final design of the roof structure; c) one of the modified top joints (eye bot used).
In the next design the connections between the pillars and the roof rails were modified. Instead of a bar coming out of the pillar an eye bolt was used (Figure 1c). A straight bar coming out of the roof rail went through an
AB rail BC rail
B-pillar
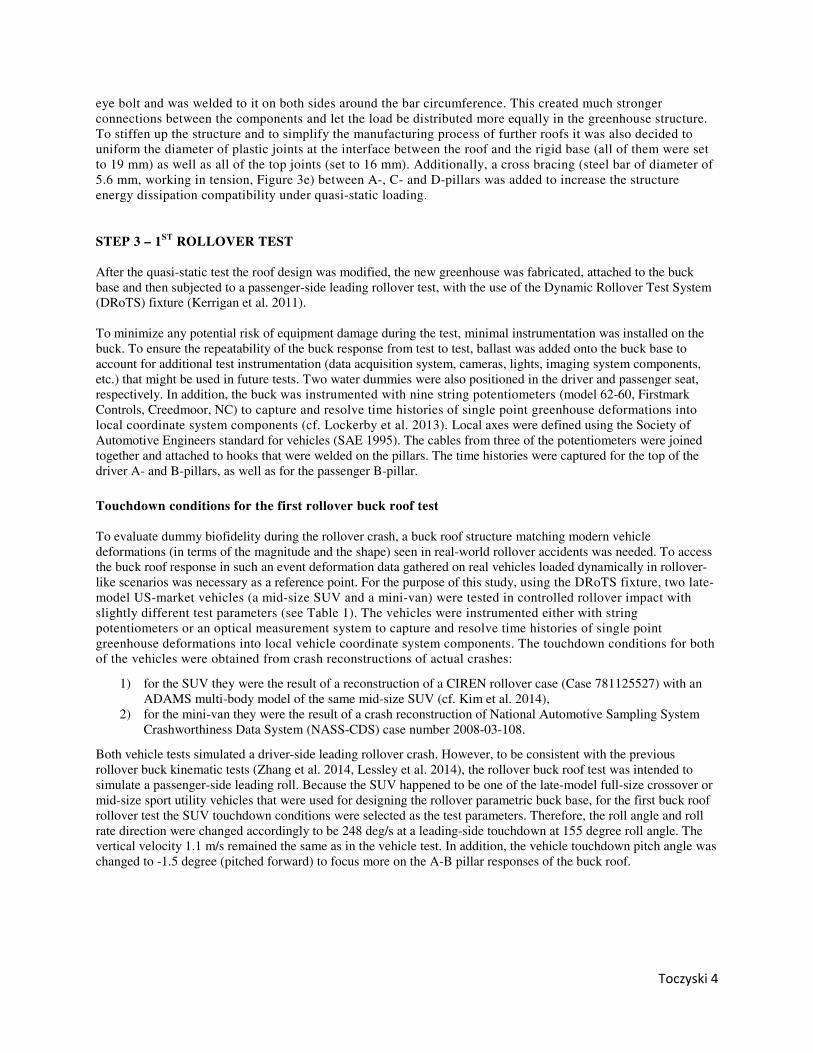
Toczyski 4
eye bolt and was welded to it on both sides around the bar circumference. This created much stronger connections between the components and let the load be distributed more equally in the greenhouse structure. To stiffen up the structure and to simplify the manufacturing process of further roofs it was also decided to uniform the diameter of plastic joints at the interface between the roof and the rigid base (all of them were set to 19 mm) as well as all of the top joints (set to 16 mm). Additionally, a cross bracing (steel bar of diameter of 5.6 mm, working in tension, Figure 3e) between A-, C- and D-pillars was added to increase the structure energy dissipation compatibility under quasi-static loading.
STEP 3 – 1ST ROLLOVER TEST
After the quasi-static test the roof design was modified, the new greenhouse was fabricated, attached to the buck base and then subjected to a passenger-side leading rollover test, with the use of the Dynamic Rollover Test System (DRoTS) fixture (Kerrigan et al. 2011). To minimize any potential risk of equipment damage during the test, minimal instrumentation was installed on the buck. To ensure the repeatability of the buck response from test to test, ballast was added onto the buck base to account for additional test instrumentation (data acquisition system, cameras, lights, imaging system components, etc.) that might be used in future tests. Two water dummies were also positioned in the driver and passenger seat, respectively. In addition, the buck was instrumented with nine string potentiometers (model 62-60, Firstmark Controls, Creedmoor, NC) to capture and resolve time histories of single point greenhouse deformations into local coordinate system components (cf. Lockerby et al. 2013). Local axes were defined using the Society of Automotive Engineers standard for vehicles (SAE 1995). The cables from three of the potentiometers were joined together and attached to hooks that were welded on the pillars. The time histories were captured for the top of the driver A- and B-pillars, as well as for the passenger B-pillar.
Touchdown conditions for the first rollover buck roof test
To evaluate dummy biofidelity during the rollover crash, a buck roof structure matching modern vehicle deformations (in terms of the magnitude and the shape) seen in real-world rollover accidents was needed. To access the buck roof response in such an event deformation data gathered on real vehicles loaded dynamically in rollover-like scenarios was necessary as a reference point. For the purpose of this study, using the DRoTS fixture, two late-model US-market vehicles (a mid-size SUV and a mini-van) were tested in controlled rollover impact with slightly different test parameters (see Table 1). The vehicles were instrumented either with string potentiometers or an optical measurement system to capture and resolve time histories of single point greenhouse deformations into local vehicle coordinate system components. The touchdown conditions for both of the vehicles were obtained from crash reconstructions of actual crashes:
1) for the SUV they were the result of a reconstruction of a CIREN rollover case (Case 781125527) with an ADAMS multi-body model of the same mid-size SUV (cf. Kim et al. 2014),
2) for the mini-van they were the result of a crash reconstruction of National Automotive Sampling System Crashworthiness Data System (NASS-CDS) case number 2008-03-108.
Both vehicle tests simulated a driver-side leading rollover crash. However, to be consistent with the previous rollover buck kinematic tests (Zhang et al. 2014, Lessley et al. 2014), the rollover buck roof test was intended to simulate a passenger-side leading roll. Because the SUV happened to be one of the late-model full-size crossover or mid-size sport utility vehicles that were used for designing the rollover parametric buck base, for the first buck roof rollover test the SUV touchdown conditions were selected as the test parameters. Therefore, the roll angle and roll rate direction were changed accordingly to be 248 deg/s at a leading-side touchdown at 155 degree roll angle. The vertical velocity 1.1 m/s remained the same as in the vehicle test. In addition, the vehicle touchdown pitch angle was changed to -1.5 degree (pitched forward) to focus more on the A-B pillar responses of the buck roof.
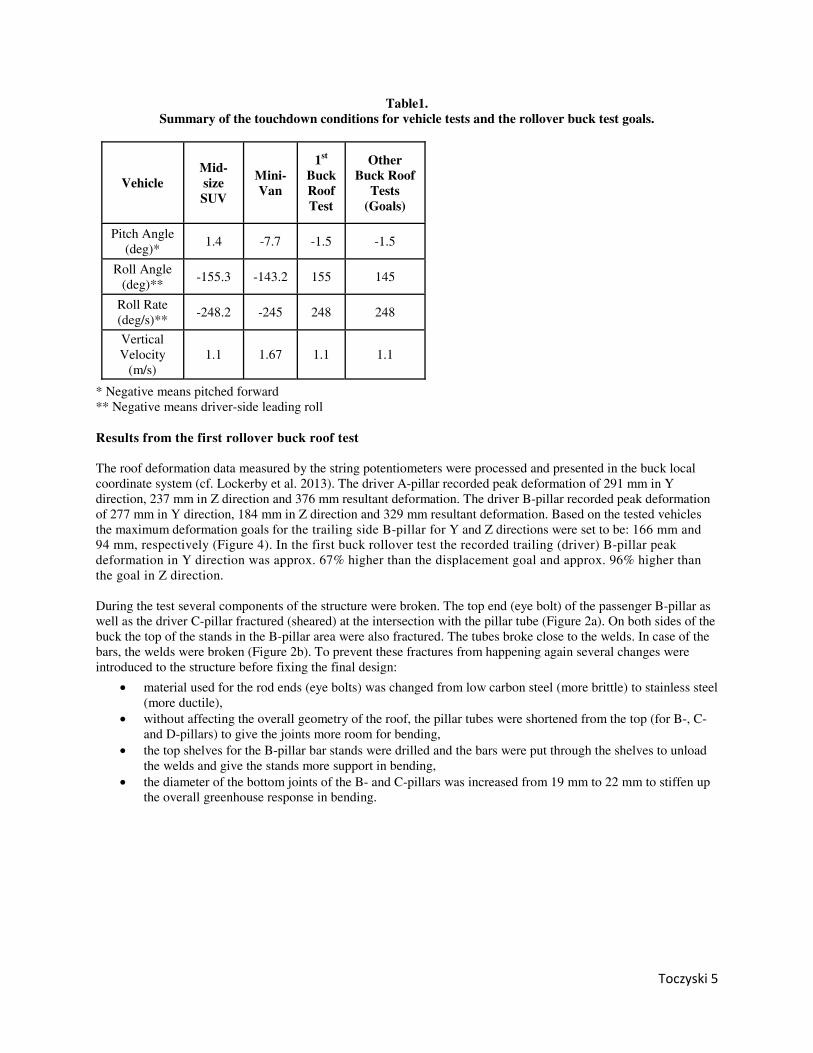
Toczyski 5
Table1. Summary of the touchdown conditions for vehicle tests and the rollover buck test goals.
Vehicle Mid-size SUV
Mini-Van
1st Buck Roof Test
Other Buck Roof
Tests (Goals)
Pitch Angle (deg)*
1.4 -7.7 -1.5 -1.5
Roll Angle (deg)**
-155.3 -143.2 155 145
Roll Rate (deg/s)**
-248.2 -245 248 248
Vertical Velocity
(m/s) 1.1 1.67 1.1 1.1
* Negative means pitched forward ** Negative means driver-side leading roll Results from the first rollover buck roof test
The roof deformation data measured by the string potentiometers were processed and presented in the buck local coordinate system (cf. Lockerby et al. 2013). The driver A-pillar recorded peak deformation of 291 mm in Y direction, 237 mm in Z direction and 376 mm resultant deformation. The driver B-pillar recorded peak deformation of 277 mm in Y direction, 184 mm in Z direction and 329 mm resultant deformation. Based on the tested vehicles the maximum deformation goals for the trailing side B-pillar for Y and Z directions were set to be: 166 mm and 94 mm, respectively (Figure 4). In the first buck rollover test the recorded trailing (driver) B-pillar peak deformation in Y direction was approx. 67% higher than the displacement goal and approx. 96% higher than the goal in Z direction. During the test several components of the structure were broken. The top end (eye bolt) of the passenger B-pillar as well as the driver C-pillar fractured (sheared) at the intersection with the pillar tube (Figure 2a). On both sides of the buck the top of the stands in the B-pillar area were also fractured. The tubes broke close to the welds. In case of the bars, the welds were broken (Figure 2b). To prevent these fractures from happening again several changes were introduced to the structure before fixing the final design:
• material used for the rod ends (eye bolts) was changed from low carbon steel (more brittle) to stainless steel (more ductile),
• without affecting the overall geometry of the roof, the pillar tubes were shortened from the top (for B-, C- and D-pillars) to give the joints more room for bending,
• the top shelves for the B-pillar bar stands were drilled and the bars were put through the shelves to unload the welds and give the stands more support in bending,
• the diameter of the bottom joints of the B- and C-pillars was increased from 19 mm to 22 mm to stiffen up the overall greenhouse response in bending.
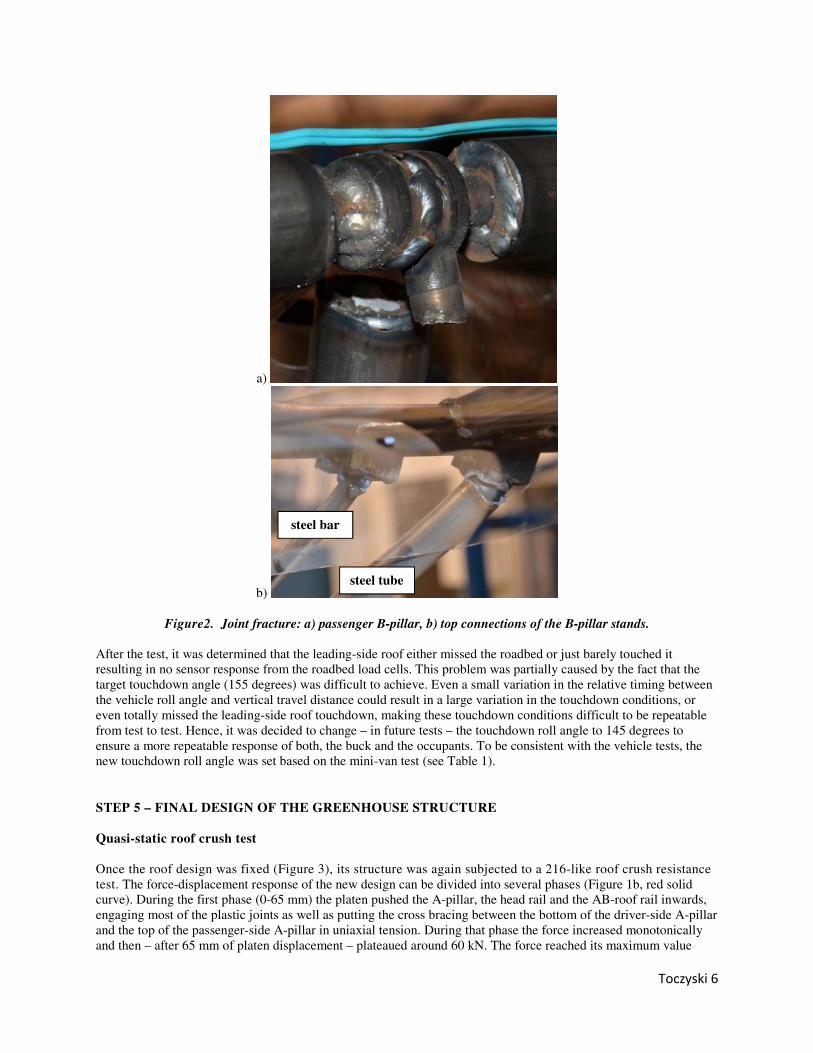
Toczyski 6
a)
b)
Figure2. Joint fracture: a) passenger B-pillar, b) top connections of the B-pillar stands. After the test, it was determined that the leading-side roof either missed the roadbed or just barely touched it resulting in no sensor response from the roadbed load cells. This problem was partially caused by the fact that the target touchdown angle (155 degrees) was difficult to achieve. Even a small variation in the relative timing between the vehicle roll angle and vertical travel distance could result in a large variation in the touchdown conditions, or even totally missed the leading-side roof touchdown, making these touchdown conditions difficult to be repeatable from test to test. Hence, it was decided to change – in future tests – the touchdown roll angle to 145 degrees to ensure a more repeatable response of both, the buck and the occupants. To be consistent with the vehicle tests, the new touchdown roll angle was set based on the mini-van test (see Table 1).
STEP 5 – FINAL DESIGN OF THE GREENHOUSE STRUCTURE
Quasi-static roof crush test
Once the roof design was fixed (Figure 3), its structure was again subjected to a 216-like roof crush resistance test. The force-displacement response of the new design can be divided into several phases (Figure 1b, red solid curve). During the first phase (0-65 mm) the platen pushed the A-pillar, the head rail and the AB-roof rail inwards, engaging most of the plastic joints as well as putting the cross bracing between the bottom of the driver-side A-pillar and the top of the passenger-side A-pillar in uniaxial tension. During that phase the force increased monotonically and then – after 65 mm of platen displacement – plateaued around 60 kN. The force reached its maximum value
steel tube
steel bar
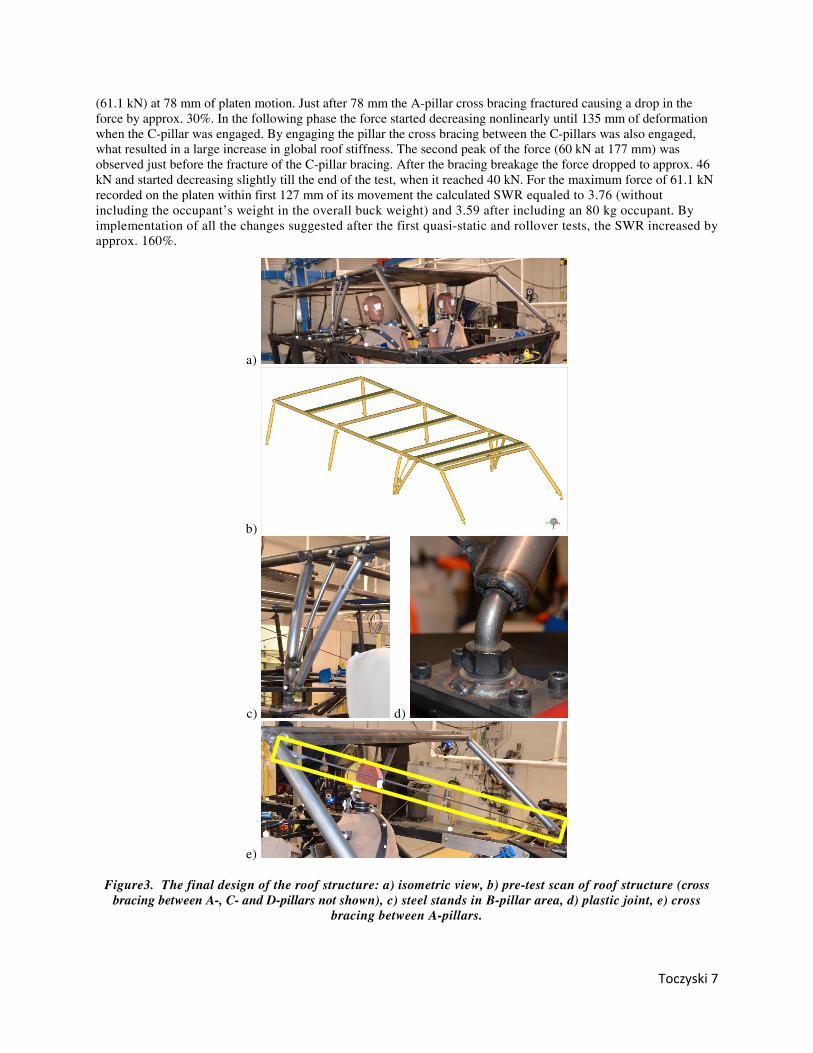
Toczyski 7
(61.1 kN) at 78 mm of platen motion. Just after 78 mm the A-pillar cross bracing fractured causing a drop in the force by approx. 30%. In the following phase the force started decreasing nonlinearly until 135 mm of deformation when the C-pillar was engaged. By engaging the pillar the cross bracing between the C-pillars was also engaged, what resulted in a large increase in global roof stiffness. The second peak of the force (60 kN at 177 mm) was observed just before the fracture of the C-pillar bracing. After the bracing breakage the force dropped to approx. 46 kN and started decreasing slightly till the end of the test, when it reached 40 kN. For the maximum force of 61.1 kN recorded on the platen within first 127 mm of its movement the calculated SWR equaled to 3.76 (without including the occupant’s weight in the overall buck weight) and 3.59 after including an 80 kg occupant. By implementation of all the changes suggested after the first quasi-static and rollover tests, the SWR increased by approx. 160%.
a)
b)
c) d)
e)
Figure3. The final design of the roof structure: a) isometric view, b) pre-test scan of roof structure (cross bracing between A-, C- and D-pillars not shown), c) steel stands in B-pillar area, d) plastic joint, e) cross
bracing between A-pillars.
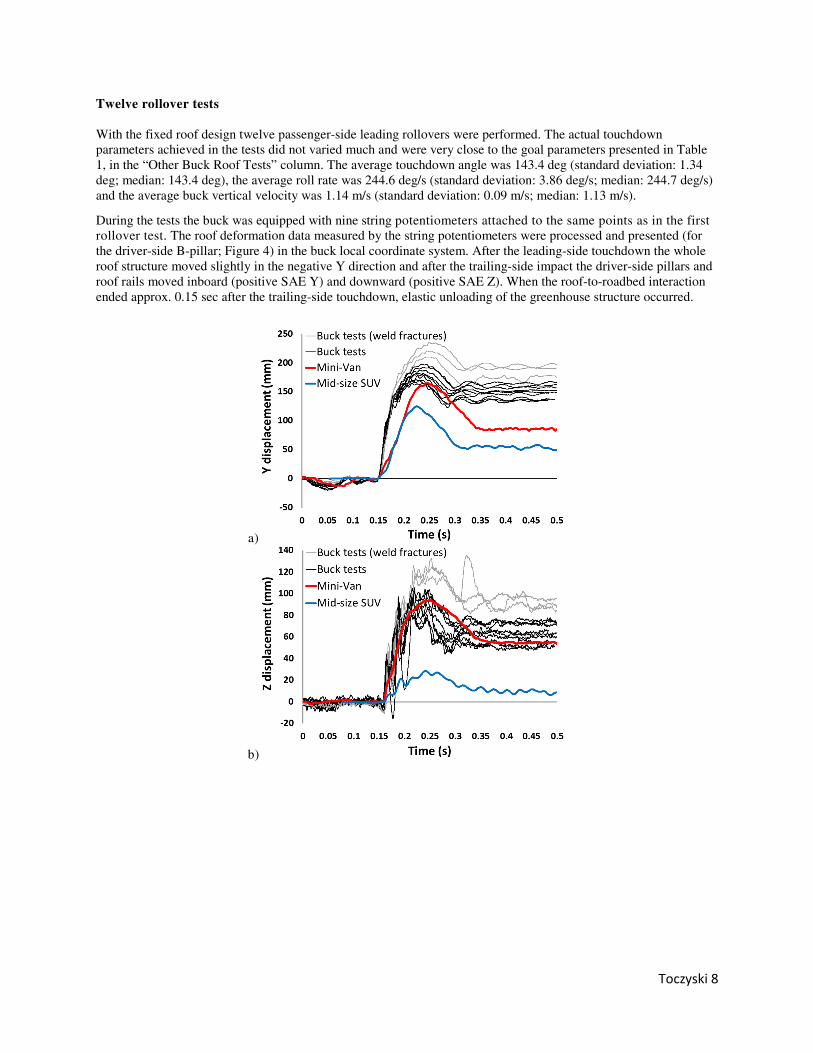
Toczyski 8
Twelve rollover tests
With the fixed roof design twelve passenger-side leading rollovers were performed. The actual touchdown parameters achieved in the tests did not varied much and were very close to the goal parameters presented in Table 1, in the “Other Buck Roof Tests” column. The average touchdown angle was 143.4 deg (standard deviation: 1.34 deg; median: 143.4 deg), the average roll rate was 244.6 deg/s (standard deviation: 3.86 deg/s; median: 244.7 deg/s) and the average buck vertical velocity was 1.14 m/s (standard deviation: 0.09 m/s; median: 1.13 m/s).
During the tests the buck was equipped with nine string potentiometers attached to the same points as in the first rollover test. The roof deformation data measured by the string potentiometers were processed and presented (for the driver-side B-pillar; Figure 4) in the buck local coordinate system. After the leading-side touchdown the whole roof structure moved slightly in the negative Y direction and after the trailing-side impact the driver-side pillars and roof rails moved inboard (positive SAE Y) and downward (positive SAE Z). When the roof-to-roadbed interaction ended approx. 0.15 sec after the trailing-side touchdown, elastic unloading of the greenhouse structure occurred.
a)
b)
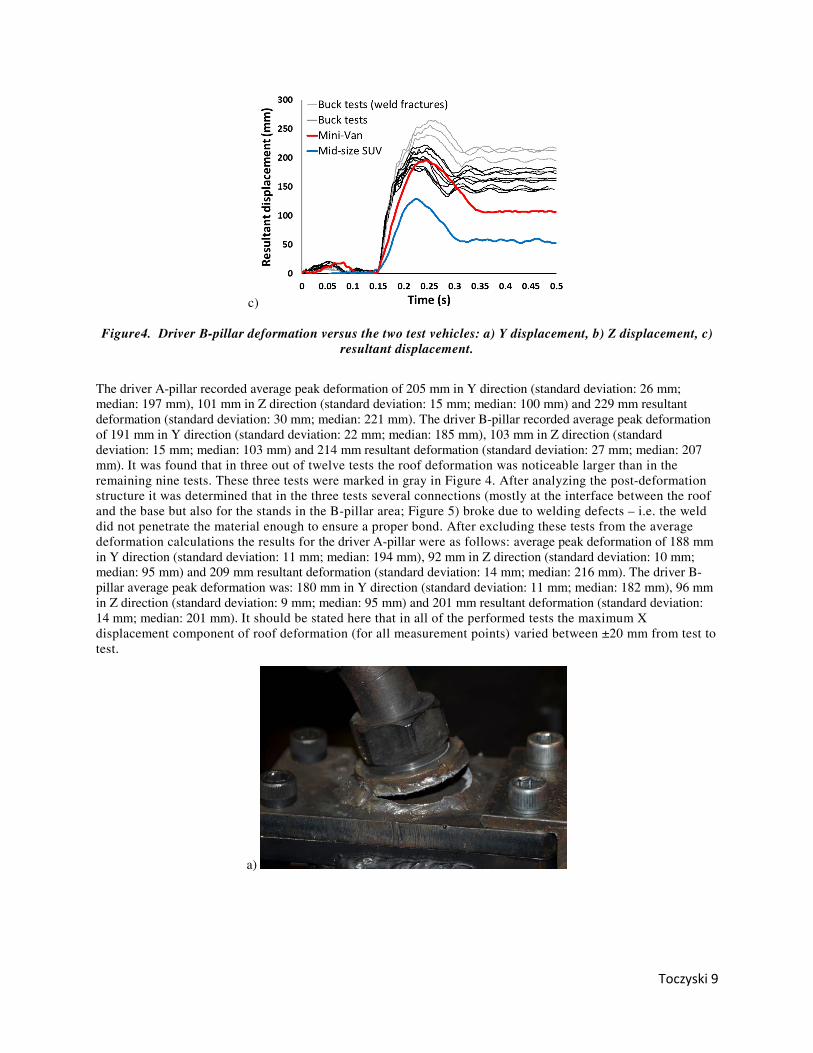
Toczyski 9
c)
Figure4. Driver B-pillar deformation versus the two test vehicles: a) Y displacement, b) Z displacement, c) resultant displacement.
The driver A-pillar recorded average peak deformation of 205 mm in Y direction (standard deviation: 26 mm; median: 197 mm), 101 mm in Z direction (standard deviation: 15 mm; median: 100 mm) and 229 mm resultant deformation (standard deviation: 30 mm; median: 221 mm). The driver B-pillar recorded average peak deformation of 191 mm in Y direction (standard deviation: 22 mm; median: 185 mm), 103 mm in Z direction (standard deviation: 15 mm; median: 103 mm) and 214 mm resultant deformation (standard deviation: 27 mm; median: 207 mm). It was found that in three out of twelve tests the roof deformation was noticeable larger than in the remaining nine tests. These three tests were marked in gray in Figure 4. After analyzing the post-deformation structure it was determined that in the three tests several connections (mostly at the interface between the roof and the base but also for the stands in the B-pillar area; Figure 5) broke due to welding defects – i.e. the weld did not penetrate the material enough to ensure a proper bond. After excluding these tests from the average deformation calculations the results for the driver A-pillar were as follows: average peak deformation of 188 mm in Y direction (standard deviation: 11 mm; median: 194 mm), 92 mm in Z direction (standard deviation: 10 mm; median: 95 mm) and 209 mm resultant deformation (standard deviation: 14 mm; median: 216 mm). The driver B-pillar average peak deformation was: 180 mm in Y direction (standard deviation: 11 mm; median: 182 mm), 96 mm in Z direction (standard deviation: 9 mm; median: 95 mm) and 201 mm resultant deformation (standard deviation: 14 mm; median: 201 mm). It should be stated here that in all of the performed tests the maximum X displacement component of roof deformation (for all measurement points) varied between ±20 mm from test to test.
a)
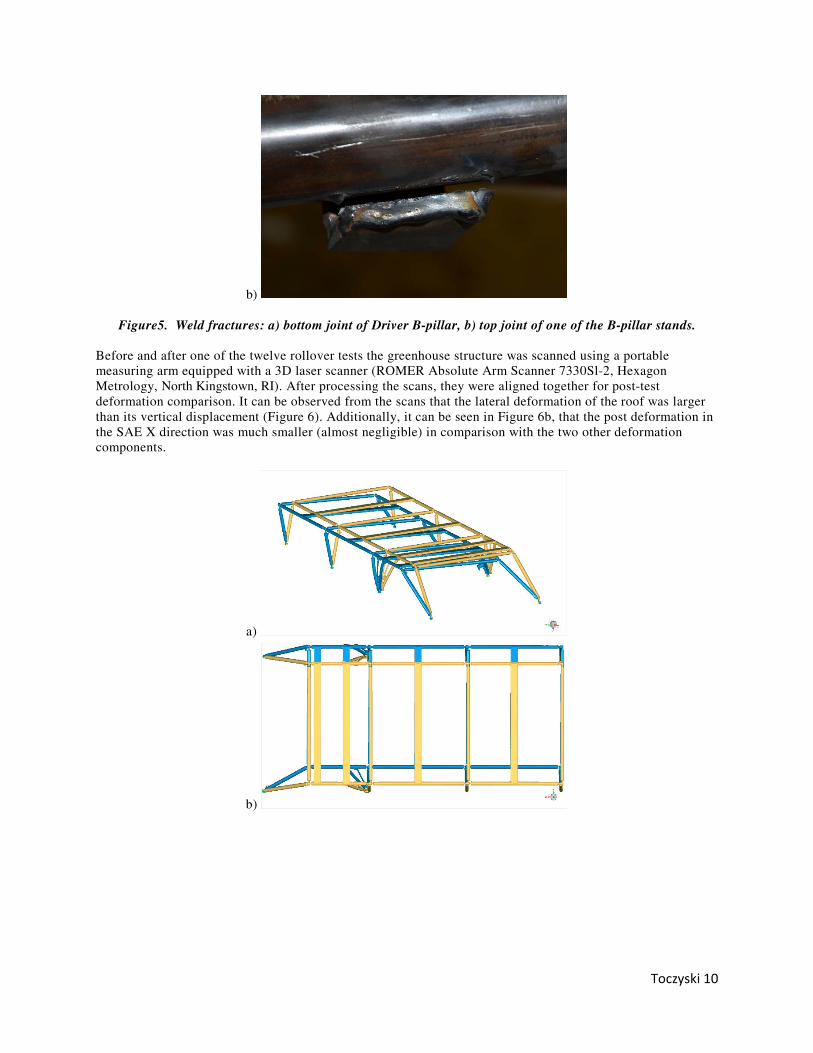
Toczyski 10
b)
Figure5. Weld fractures: a) bottom joint of Driver B-pillar, b) top joint of one of the B-pillar stands. Before and after one of the twelve rollover tests the greenhouse structure was scanned using a portable measuring arm equipped with a 3D laser scanner (ROMER Absolute Arm Scanner 7330Sl-2, Hexagon Metrology, North Kingstown, RI). After processing the scans, they were aligned together for post-test deformation comparison. It can be observed from the scans that the lateral deformation of the roof was larger than its vertical displacement (Figure 6). Additionally, it can be seen in Figure 6b, that the post deformation in the SAE X direction was much smaller (almost negligible) in comparison with the two other deformation components.
a)
b)
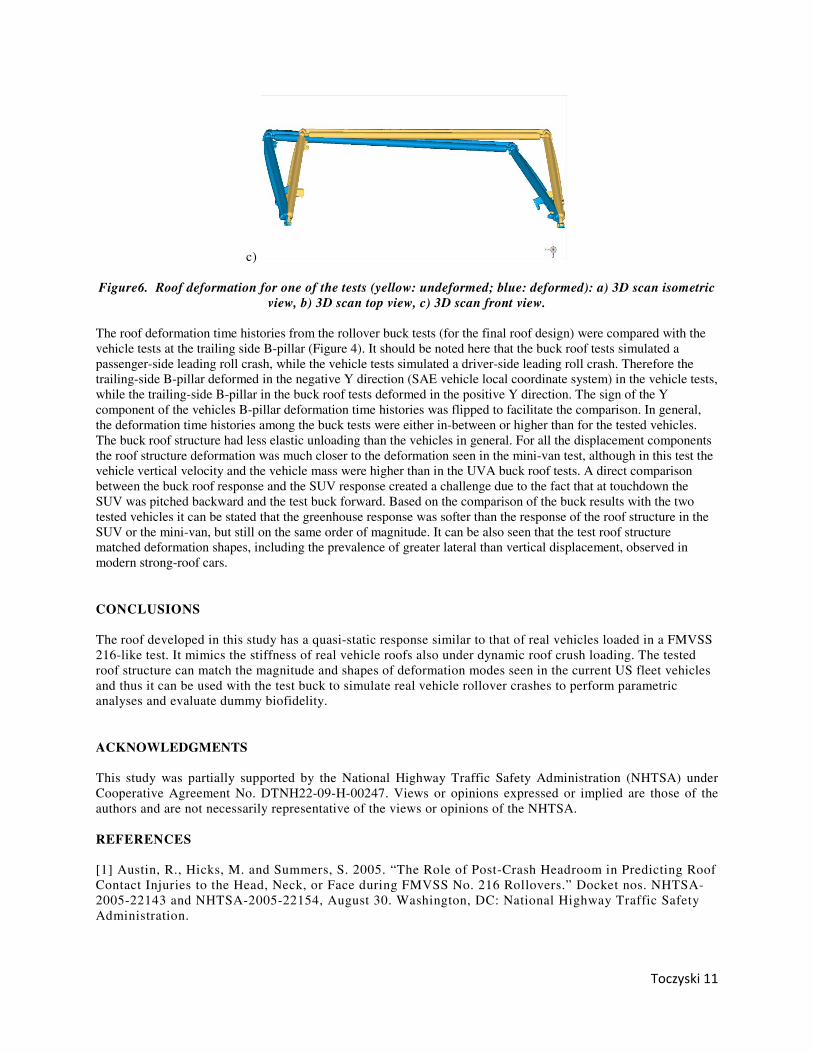
Toczyski 11
c)
Figure6. Roof deformation for one of the tests (yellow: undeformed; blue: deformed): a) 3D scan isometric view, b) 3D scan top view, c) 3D scan front view.
The roof deformation time histories from the rollover buck tests (for the final roof design) were compared with the vehicle tests at the trailing side B-pillar (Figure 4). It should be noted here that the buck roof tests simulated a passenger-side leading roll crash, while the vehicle tests simulated a driver-side leading roll crash. Therefore the trailing-side B-pillar deformed in the negative Y direction (SAE vehicle local coordinate system) in the vehicle tests, while the trailing-side B-pillar in the buck roof tests deformed in the positive Y direction. The sign of the Y component of the vehicles B-pillar deformation time histories was flipped to facilitate the comparison. In general, the deformation time histories among the buck tests were either in-between or higher than for the tested vehicles. The buck roof structure had less elastic unloading than the vehicles in general. For all the displacement components the roof structure deformation was much closer to the deformation seen in the mini-van test, although in this test the vehicle vertical velocity and the vehicle mass were higher than in the UVA buck roof tests. A direct comparison between the buck roof response and the SUV response created a challenge due to the fact that at touchdown the SUV was pitched backward and the test buck forward. Based on the comparison of the buck results with the two tested vehicles it can be stated that the greenhouse response was softer than the response of the roof structure in the SUV or the mini-van, but still on the same order of magnitude. It can be also seen that the test roof structure matched deformation shapes, including the prevalence of greater lateral than vertical displacement, observed in modern strong-roof cars.
CONCLUSIONS
The roof developed in this study has a quasi-static response similar to that of real vehicles loaded in a FMVSS 216-like test. It mimics the stiffness of real vehicle roofs also under dynamic roof crush loading. The tested roof structure can match the magnitude and shapes of deformation modes seen in the current US fleet vehicles and thus it can be used with the test buck to simulate real vehicle rollover crashes to perform parametric analyses and evaluate dummy biofidelity.
ACKNOWLEDGMENTS
This study was partially supported by the National Highway Traffic Safety Administration (NHTSA) under Cooperative Agreement No. DTNH22-09-H-00247. Views or opinions expressed or implied are those of the authors and are not necessarily representative of the views or opinions of the NHTSA. REFERENCES [1] Austin, R., Hicks, M. and Summers, S. 2005. “The Role of Post-Crash Headroom in Predicting Roof Contact Injuries to the Head, Neck, or Face during FMVSS No. 216 Rollovers.” Docket nos. NHTSA-2005-22143 and NHTSA-2005-22154, August 30. Washington, DC: National Highway Traffic Safety Administration.
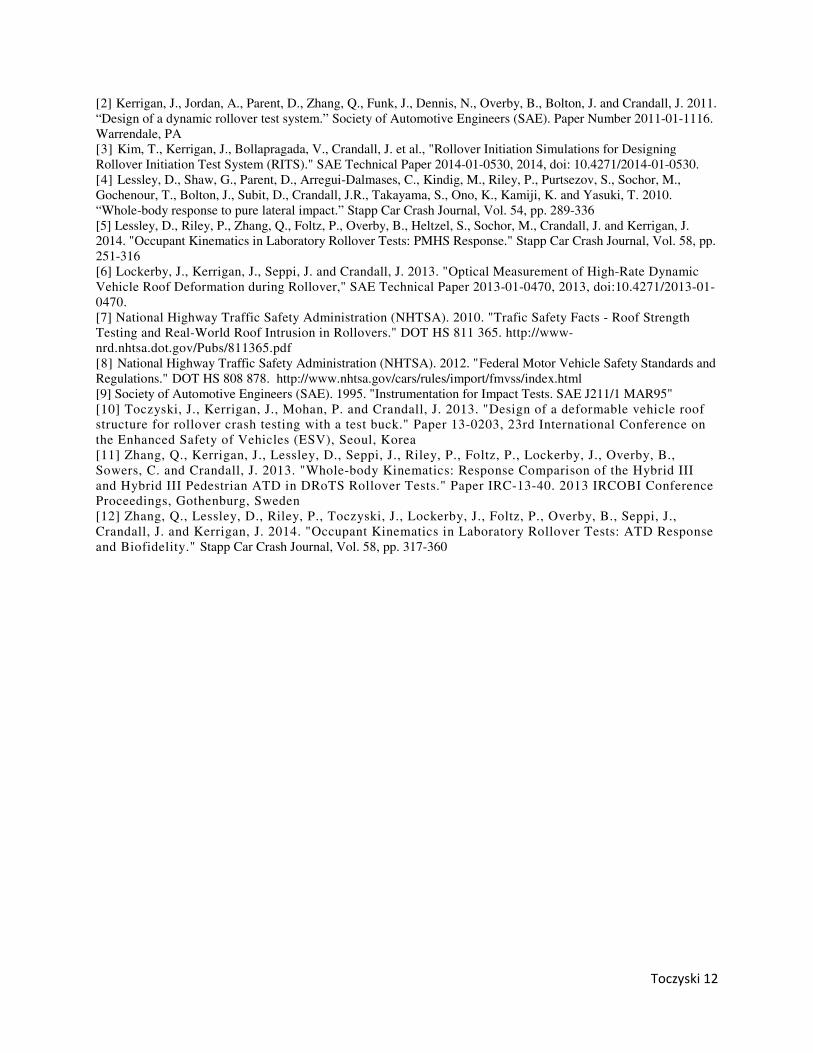
Toczyski 12
[2] Kerrigan, J., Jordan, A., Parent, D., Zhang, Q., Funk, J., Dennis, N., Overby, B., Bolton, J. and Crandall, J. 2011. “Design of a dynamic rollover test system.” Society of Automotive Engineers (SAE). Paper Number 2011-01-1116. Warrendale, PA [3] Kim, T., Kerrigan, J., Bollapragada, V., Crandall, J. et al., "Rollover Initiation Simulations for Designing Rollover Initiation Test System (RITS)." SAE Technical Paper 2014-01-0530, 2014, doi: 10.4271/2014-01-0530. [4] Lessley, D., Shaw, G., Parent, D., Arregui-Dalmases, C., Kindig, M., Riley, P., Purtsezov, S., Sochor, M., Gochenour, T., Bolton, J., Subit, D., Crandall, J.R., Takayama, S., Ono, K., Kamiji, K. and Yasuki, T. 2010. “Whole-body response to pure lateral impact.” Stapp Car Crash Journal, Vol. 54, pp. 289-336 [5] Lessley, D., Riley, P., Zhang, Q., Foltz, P., Overby, B., Heltzel, S., Sochor, M., Crandall, J. and Kerrigan, J. 2014. "Occupant Kinematics in Laboratory Rollover Tests: PMHS Response." Stapp Car Crash Journal, Vol. 58, pp. 251-316 [6] Lockerby, J., Kerrigan, J., Seppi, J. and Crandall, J. 2013. "Optical Measurement of High-Rate Dynamic Vehicle Roof Deformation during Rollover," SAE Technical Paper 2013-01-0470, 2013, doi:10.4271/2013-01-0470. [7] National Highway Traffic Safety Administration (NHTSA). 2010. "Trafic Safety Facts - Roof Strength Testing and Real-World Roof Intrusion in Rollovers." DOT HS 811 365. http://www-nrd.nhtsa.dot.gov/Pubs/811365.pdf [8] National Highway Traffic Safety Administration (NHTSA). 2012. "Federal Motor Vehicle Safety Standards and Regulations." DOT HS 808 878. http://www.nhtsa.gov/cars/rules/import/fmvss/index.html [9] Society of Automotive Engineers (SAE). 1995. "Instrumentation for Impact Tests. SAE J211/1 MAR95" [10] Toczyski, J., Kerrigan, J., Mohan, P. and Crandall, J. 2013. "Design of a deformable vehicle roof structure for rollover crash testing with a test buck." Paper 13-0203, 23rd International Conference on the Enhanced Safety of Vehicles (ESV), Seoul, Korea [11] Zhang, Q., Kerrigan, J., Lessley, D., Seppi, J., Riley, P., Foltz, P., Lockerby, J., Overby, B., Sowers, C. and Crandall, J. 2013. "Whole-body Kinematics: Response Comparison of the Hybrid III and Hybrid III Pedestrian ATD in DRoTS Rollover Tests." Paper IRC-13-40. 2013 IRCOBI Conference Proceedings, Gothenburg, Sweden [12] Zhang, Q., Lessley, D., Riley, P., Toczyski, J., Lockerby, J., Foltz, P., Overby, B., Seppi, J., Crandall, J. and Kerrigan, J. 2014. "Occupant Kinematics in Laboratory Rollover Tests: ATD Response and Biofidelity." Stapp Car Crash Journal, Vol. 58, pp. 317-360
1
THE EFFECTS OF ROAD CONTACT ANGLES AND PITCH/YAW ANGLES ON THE INJURIES OF DRIVERS IN CRIS TEST Byoungkee, Han Youkeun, Oh Department of Mechanical Engineering, Hongik University Republic of Korea Eundok, Lee Jaewan, Lee Gyuhyun, Kim Korea Automobile Testing & Research Institute Republic of Korea Paper Number 15-0350 ABSTRACT This paper shows the effect of the roof contact angle with ground and pitch/yaw angle on head and neck injuries in CRIS tests. In this study the effect of these conditions on injury in a rollover is simulated and analyzed by using a commercial multi-body software (ADAMS). The vehicle model consists of a rigid lower body and deformable upper body. Each member of the upper body is characterized to get the similar behavior to the results obtained from an equivalent finite element model. To evaluate the severity of driver’s injuries in a CRIS test, a computer simulation to replicate the dynamic CRIS test is developed. The angular velocity of vehicle is set to a constant value of 270 degree/sec and the lateral velocity is varied to be 28.8kph or 35kph so that it can roll 2 or 3 turns. The roof contact angle with ground is selected to be 135, 145 and 155 degrees. The pitch and yaw angles of the vehicle is also varied to be 2 or 5 degrees and 0, 10, or 20 degrees, respectively. In addition to the peak acceleration of the dummy head, the maximum shear force, compressive force, and bending moment acting on the dummy neck are calculated to evaluate the rollover safety for various conditions. The simulation results are then compared to the KNCAP evaluation criteria. Considering the fact that the rollover accidents with less than 2 full turns account for about 90% of the entire rollover accidents, this study suggests that the 2-turn condition would be appropriate for a protocol of the dynamic rollover test.
INTRODUCTION
Rollover accident mortality, which represents the number of deaths per 100 automobile accidents, is high compared to other types of car accidents. In Fig 1. the occurrence rate and mortality rate for each type of vehicle accidents in Korea compared to the European data are shown. The two regions show the significant difference in the occurrence rate and mortality rate. In particular, the vehicle-only-accidents in Korea are significantly smaller than the corresponding data in Europe. This difference might be considered to be due to the road condition, behavioral characteristics of drivers and pedestrians, and composition of vehicles. (Korea National Police Agency 2011; European Commission, 2008; UNECE, 2007; NHTSA, 2007) Although the occurrence rate of the rollover accidents is relatively smaller than other types of accidents, the mortality rate related to the rollover accidents is significantly high. According to the Korean data set, the rollover accidents appear to be rare with the rate of 0.5%. But, as shown in Fig. 1, when considering the vehicle-only-accidents, which also include the accidents that can secondarily cause the rollover such as falls and veering due to breakaway, the mortality rate becomes significantly high with a 13.8 person compared to other types of accidents. (Korea National Police Agency 2011) This observation is also supported by the data set in U.S. In contrast to the fact that the incident rate of the rollover in U.S. is approximately 3% out of the entire vehicle accidents, the 35% of automobile fatalities occur due to the rollover. Similarly, this trend can be found in the Australian data set. (NHSTA Traffic Safety Facts 2009)
2
There have been various efforts to reduce the fatality due to rollover by improving the vehicle stability performance with the equipped ESC (Electrical Stability Controller), securing the passenger compartment or occupant survival space with the enhanced roof crush resistance, and mitigating the passenger’s ejection during a rollover. To encourage these efforts, the NHTSA has implemented the FMVSS 126 (i.e., mandatory installation of ESC) since 2011 and phased in the enhanced FMVSS 216a (i.e., roof crush resistance) and FMVSS 226 (i.e., ejection mitigation) since 2012 and 2014, respectively. In addition, the IIHS has also implemented the new roof strength rating system. The rollover tests are developed in an effort to replicate what happens in real world collisions: Dolly test (FMVSS 208), CRIS (Controlled Rollover Impact System), and JRS (Jordan Rollover System). The Dolly test is not used as a mandatory requirement because it cannot test various conditions such as the pitch and yaw angle and lacks the repeatability. For the other two testing methods, researchers in the U.S. and Australia have actively worked on the test protocol to ensure the practicality of safety related regulations. In real-world rollovers, the driver’s injury is affected by not only the strength of vehicle’s body structure (or chassis strength?), but also the posture of drivers. (Ridella et al. 2009; Cooper et al. 2001; Moffatt et al. 2003; Friedman et al. 2003) Seat belts prevent a driver to be ejected, thereby contributing to reducing fatal injuries. In the analyses of the CFIR data set, Huelke et al. have reported that seat belts reduce the severe injuries and fatalities by 91% under the roof crush of less than 6 inches (152mm). Evans et al. have reported that according to the FARS data, lap/shoulder belts can be effective to reduce fatalities by 82% and thus significantly contribute to the ejection prevention. (Huelke et al. 1973; Huelke et al. 1977; Evans, L. 1988) Therefore, this study replicates the CRIS test using a dummy seated with a seat belt in order to prevent it from being ejected. As measured in the KNCAP (Korean New Car Assessment Programme) crash-test, the HIC15 induced to the dummy head and shear force, compressive force, and bending moment acting on the dummy neck are calculated and used to evaluate the safety under a rollover scenario.
Fig. 1 Vehicle Crash Occurrence and Fatalities in South Korea and EU (Source: Korea National Police Agency 2011 and UNECE 2007)
Fig. 2 Fatality of vehicle only accidents in Korea (Source: Korea National Police Agency 2011)
CRIS TEST
It is required to maintain the ceiling strength at a certain level in order to ensure the survival space for passengers during a rollover. However, according to SNPRM (Supplemental Notice of Proposed Rulemaking), most of vehicle produced prior to the year 2008 have failed to satisfy the regulation of SWR ≥ 3.0 and resulted in serious casualties. Hence, the NHTSA has enhanced the regulations related to the ceiling strength.
It is, however, questionable if the static test would be appropriate for evaluating the ceiling strength. Currently, many researchers investigate how to better simulate a dynamic rollover accident, rather than replicating the Dolly rollover test (FMVSS 208). (Friedman, D., et al. 2009; Chirwa, E.C., et al., 2010; B. K. Han, et al. 2013)
3
Although the CRIS test is problematic in terms of the repeatability, it allows one to investigate the effect of the pitch and yaw angle for various road conditions and the behavior of the dummy as the roll progresses. (Linstromberf et al. 2005) The JRS test is actively used by the researchers in the CFIR(Center for Injury Research), University of Virginia, and University of New South Wales because it shows a high level of repeatability. (Grzebieta, R., et al. 2007; Kerrigan, J.R., et al. 2011; Mattos G.A., et al. 2013) This study constructs a simulation model to replicate the CRIS test and thus investigates the effect of the initial contact angle with ground, pitch/yaw angle on the safety during a rollover.
Table 1. Estimated Fleet Failure Rates Based on GVWR reported (SNPRM in January 2008).
Two-Sided Testing GVWR : 2.5 SWR 3.0 SWR 3.5 SWR
<2,722 kg 67.2% 78.6% 85.0% >2,722 kg 100.0% 100.0% 100.0%
Total 75.1% 83.7% 88.6% Single-Sided Testing
GVWR : 2.5 SWR 3.0 SWR 3.5 SWR <2,722 kg 44.5% 76.9% 80.9% >2,722 kg 98.9% 100.0% 100.0%
Total 57.6% 82.5% 85.5%
METHODS
Protocol and Analysis Conditions for Simulated CRIS Test
As shown in Fig.5, in CRIS test device a vehicle is fixed to a trailer with the selected pitch and yaw angles. While the trailer moves forward at a constant speed, the vehicle falls apart from the trailer when the vehicle rotates at a desired angular velocity. As shown in Fig.6, the initial contact angles between the vehicle and the ground are varied to be 135, 135, and 155 degrees. The pitch and yaw angles are set to be 2 or 5 degrees and 0, 10, or 20 degrees, respectively.
Fig.5 Layout of CRIS test protocol Fig.6 Seat belted Hybrid 3 dummy model
The analysis conditions for the simulated CRIS test are selected as in Table 2 so that the 2 turns and 3 turns of the rollover can be simulated. The drop height of the vehicle was set to be 0.3 m.
To assess the severity of injury for driver, a 50th percentile Hybrid III anthropomorphic test dummy (ATD) is seated in the driver’s seat. The ATD is modeled to calculate the 3-dimensional forces and moments induced to its neck during the impact.
Table 2 Analysis Conditions for the Simulated CRIS Test
2-turn condition 3-turn condition
Roll rate (deg./sec) 270 270
4
Velocity (kph) 28(8 m/s) 35(9.7 m/s) Pitch angle (deg.) 2, 5 2, 5 Yaw angle (deg.) 0, 10, 20 0, 10, 20
Multibody Model for Base Vehicle
A medium-sized passenger vehicle is used for the base vehicle of this study as shown in Fig. 6. The specifications for the base vehicle used are as follows: 2,000cc for the total engine displacement, 2,700 mm for the wheelbase, 4,400 mm for the overall length, 1,861 mm for the tread distance, 1,901 mm for the overall width, 1,610 mm for the overall height, 2,000 kg for the curb weight. The roof strength of the vehicle is modeled to have a strength-to-vehicle weight ratio (SWR) of 4.5, which exceeds the IIHS requirement for the static roof strength test (i.e., a SWR of 4.0).
The multibody vehicle model consists of the rigid lower body and the deformable upper body as shown in Fig. 5. The lower body is modeled to be rigid. The pillars, side rails, and roof bow members of the upper body are divided in 3~5 mass elements each. And the two adjacent elements are connected using the torsional and the bending spring. The characteristics of these springs are obtained using a finite element analysis (FEA), thereby mimicking the deformation of the upper body. (B. K. Han, et al. 2015)
RESULTS
Using the analysis conditions described in the Table 2, the model simulations are performed. In Fig. 7 to Fig. 12, the results for the 2-turn and 3-turn conditions are plotted. The p2 and p5 represent the pitch angles of 2 and 5 degrees and the y0, y10, and y20 represent the yaw angles of 0, 10, and 20 degrees, respectively. The effect of the initial contact angle (β) between the vehicle and ground is compared for the 2-turn and 3-turn conditions.
Fig.6 Full Car model for multi-dynamics analysis
Fig.7 Maximum displacement of left A-pillar top-end; Left side for the 2 turns condition and right side
5
Displacement of Far-Side A-Pillar
In Fig. 5, the maximum displacement of the left A-pillar for each roll is shown. Overall, as the pitch angle increases, the displacement of the left A-pillar increases, while it is not significantly affected by the changes in the yaw angle. In addition, as the initial contact angle (β) between the vehicle and ground increased, the maximum displacement of the left A-pillar increases.
As expected, the displacement for the 3-turn condition is greater than the one for the 2-turn condition. Under the 3-turn condition, the displacement for the second turn is dramatically decreased because the collision between the ground and the side of the vehicle, not the roof of the vehicle, is made. Instead, the large displacement consequently occurs in the third turn.
The maximum displacement of the left A-pillar of the vehicle indicates how much the roof penetrated the cabin, which is closely related to the passengers’ survival. In other words, when the value gets large, a driver’s head can get injured due to the contact with the roof. The overall resultant maximum displacement is smaller than 5 inches (127mm). This is because the roof strength of the vehicle has a SWR of 4.5.
Variation in Head Acceleration
The driver’s head acceleration when the far-side of the vehicle collides with the ground is greater than the corresponding value when the far-side of the vehicle collides with the ground. When the roof is collapsed and thus the head contacted with the roof or front side rail, the acceleration reaches its maximum. In Fig. 8, the head accelerations are shown for the 2-turn and 3-turn conditions. The maximum head acceleration occurs during the first turn and it tends to decrease as the yaw angle increases. As the initial contact angle (β) increases, the peak head acceleration for each turn increases. Under the 3-turn condition, the peak head acceleration are greater than the one under the 2-turn condition. In addition, as the yaw angle increases, the peak head acceleration decreases. The peak head acceleration is not significantly affected by the pitch angle.
In Fig. 9 the values for HIC36 and HIC15, which are calculated from the line diagram of the head acceleration, are plotted. When the initial contact angle (β) between the vehicle and ground is 135 degrees, the values for HIC36 and HIC15 are significantly small. However, when either the contact angle (β) or the number of turns increase, the values significantly increase. The difference between the HIC15 and HIC 36 decreases as the yaw angle increases. The results suggest that it would be appropriate to use the HIC15 for a rollover evaluation criterion because the duration when the peak acceleration is maintained is short during a rollover in contrast to a frontal impact. Considering that the head acceleration is significantly high compared to the value of HIC15, it is recommended that the head acceleration would be included in the evaluation criteria for the vehicle’s safety performance. Currently, the KNCAP adopts only the HIC36 to assess the risk for head injury during the frontal impact testing. For example, according to KNCAP, the HIC36 value exceeding 1000 indicates a higher probability of the head injury, while the HIC36 value below 650 represents less likelihood of the head injury.
Shear/normal force of neck
Compared to frontal impact tests, a rollover test induces greater values for the frontal shear force (i.e., Fx) and lateral shear force (i.e., Fy) in the dummy neck. The values for the frontal shear force are calculated to be less than or equal to 800 N under the loading conditions used in this study, except for when the initial contact angle (β) is equal to 135° and the yaw
for the 3 turns condition. And β is the first contact angle of vehicle with ground.
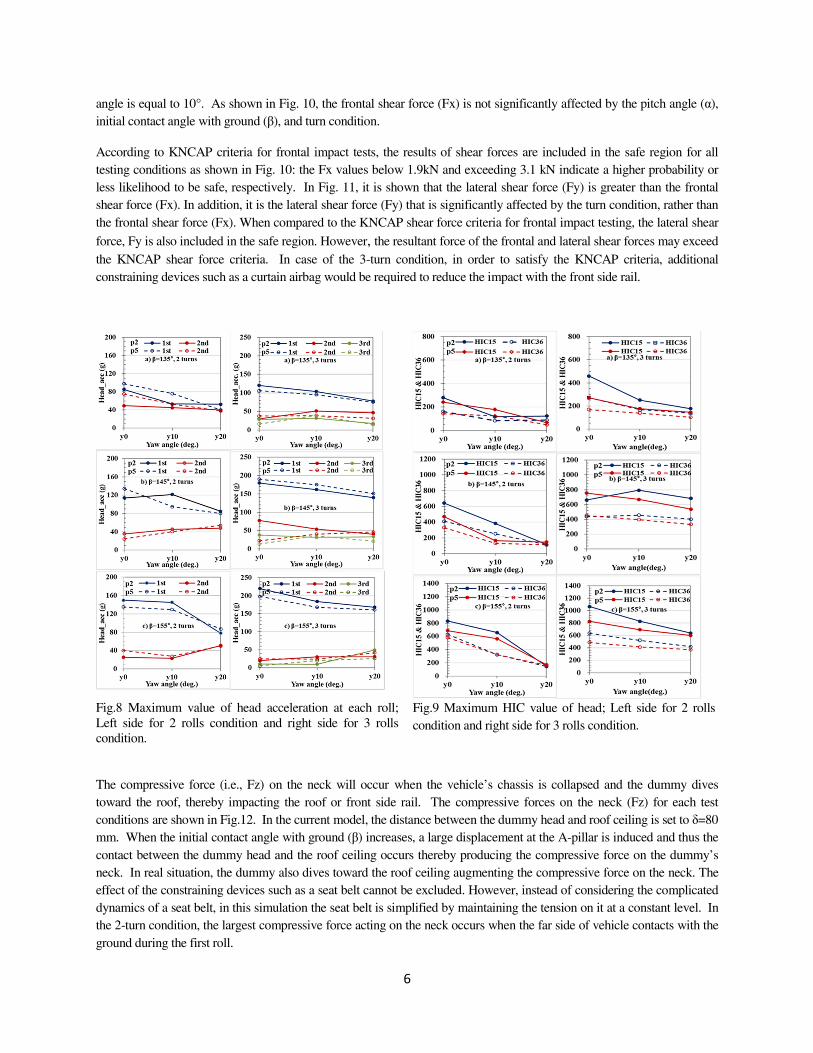
6
angle is equal to 10°. As shown in Fig. 10, the frontal shear force (Fx) is not significantly affected by the pitch angle (α), initial contact angle with ground (β), and turn condition.
According to KNCAP criteria for frontal impact tests, the results of shear forces are included in the safe region for all testing conditions as shown in Fig. 10: the Fx values below 1.9kN and exceeding 3.1 kN indicate a higher probability or less likelihood to be safe, respectively. In Fig. 11, it is shown that the lateral shear force (Fy) is greater than the frontal shear force (Fx). In addition, it is the lateral shear force (Fy) that is significantly affected by the turn condition, rather than the frontal shear force (Fx). When compared to the KNCAP shear force criteria for frontal impact testing, the lateral shear
force, Fy is also included in the safe region. However, the resultant force of the frontal and lateral shear forces may exceed the KNCAP shear force criteria. In case of the 3-turn condition, in order to satisfy the KNCAP criteria, additional constraining devices such as a curtain airbag would be required to reduce the impact with the front side rail.
Fig.8 Maximum value of head acceleration at each roll; Left side for 2 rolls condition and right side for 3 rolls condition.
Fig.9 Maximum HIC value of head; Left side for 2 rolls condition and right side for 3 rolls condition.
The compressive force (i.e., Fz) on the neck will occur when the vehicle’s chassis is collapsed and the dummy dives toward the roof, thereby impacting the roof or front side rail. The compressive forces on the neck (Fz) for each test conditions are shown in Fig.12. In the current model, the distance between the dummy head and roof ceiling is set to δ=80 mm. When the initial contact angle with ground (β) increases, a large displacement at the A-pillar is induced and thus the contact between the dummy head and the roof ceiling occurs thereby producing the compressive force on the dummy’s neck. In real situation, the dummy also dives toward the roof ceiling augmenting the compressive force on the neck. The effect of the constraining devices such as a seat belt cannot be excluded. However, instead of considering the complicated dynamics of a seat belt, in this simulation the seat belt is simplified by maintaining the tension on it at a constant level. In the 2-turn condition, the largest compressive force acting on the neck occurs when the far side of vehicle contacts with the ground during the first roll.
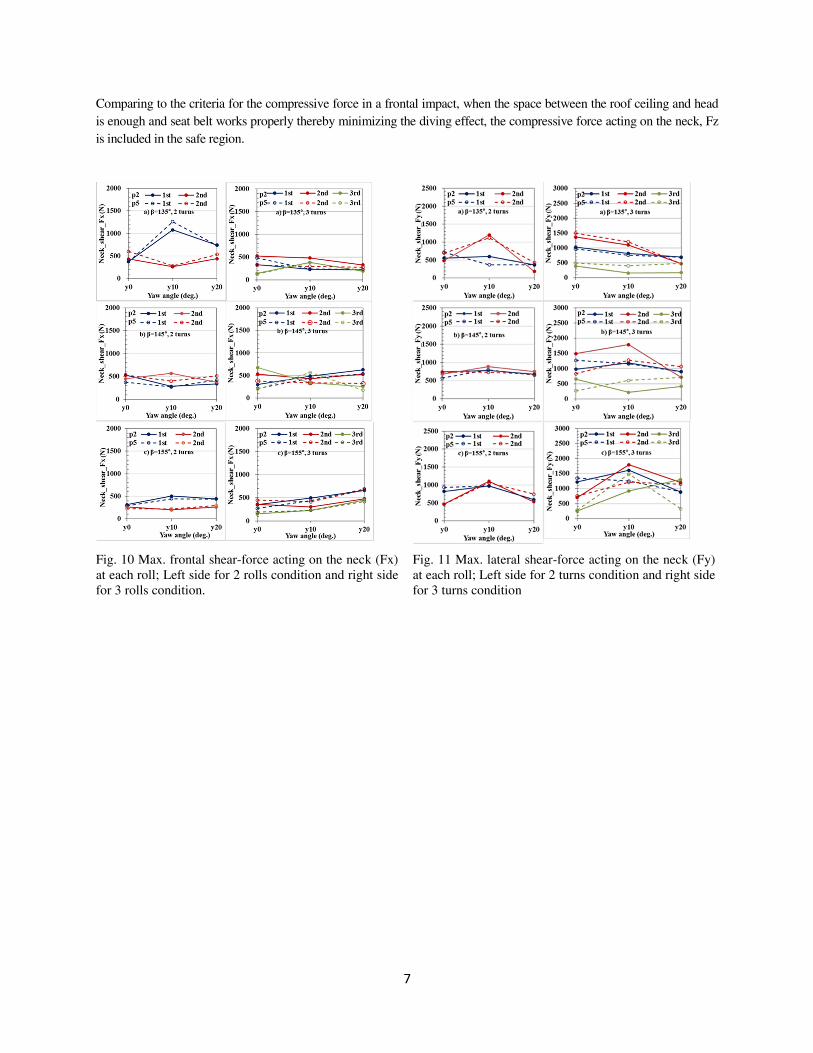
7
Comparing to the criteria for the compressive force in a frontal impact, when the space between the roof ceiling and head is enough and seat belt works properly thereby minimizing the diving effect, the compressive force acting on the neck, Fz is included in the safe region.
Fig. 10 Max. frontal shear-force acting on the neck (Fx) at each roll; Left side for 2 rolls condition and right side for 3 rolls condition.
Fig. 11 Max. lateral shear-force acting on the neck (Fy) at each roll; Left side for 2 turns condition and right side for 3 turns condition
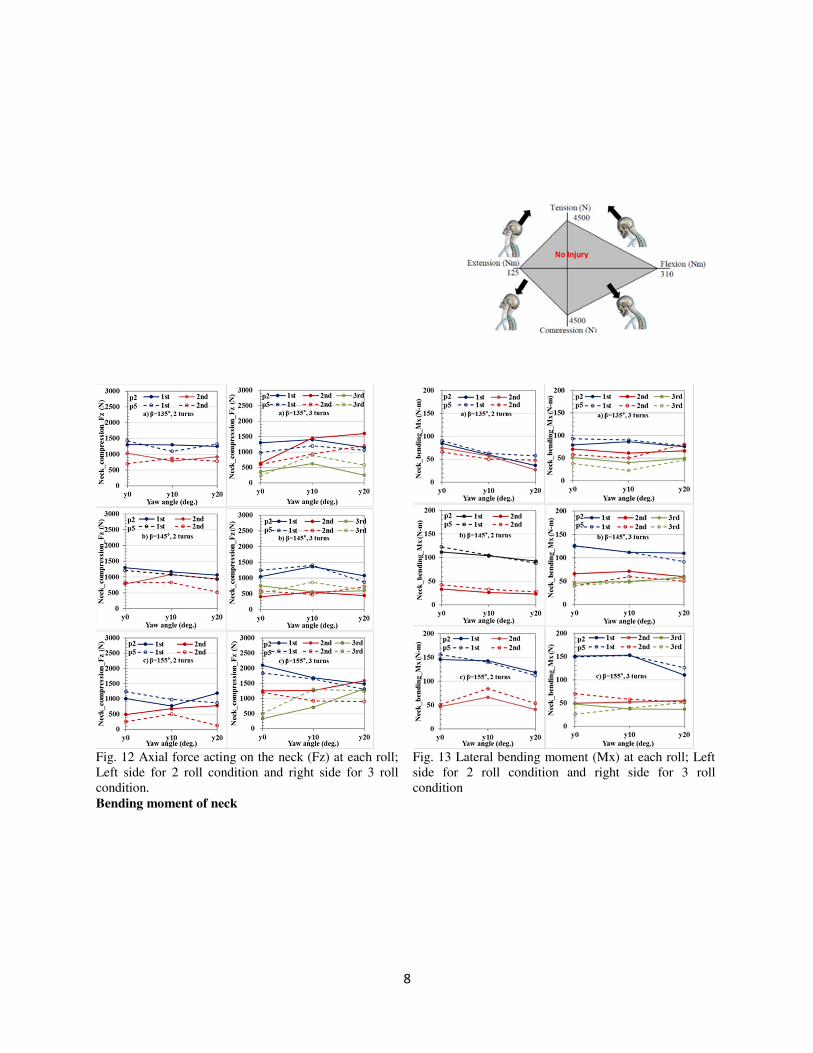
8
Fig. 12 Axial force acting on the neck (Fz) at each roll; Left side for 2 roll condition and right side for 3 roll condition.
Fig. 13 Lateral bending moment (Mx) at each roll; Left side for 2 roll condition and right side for 3 roll condition
Bending moment of neck
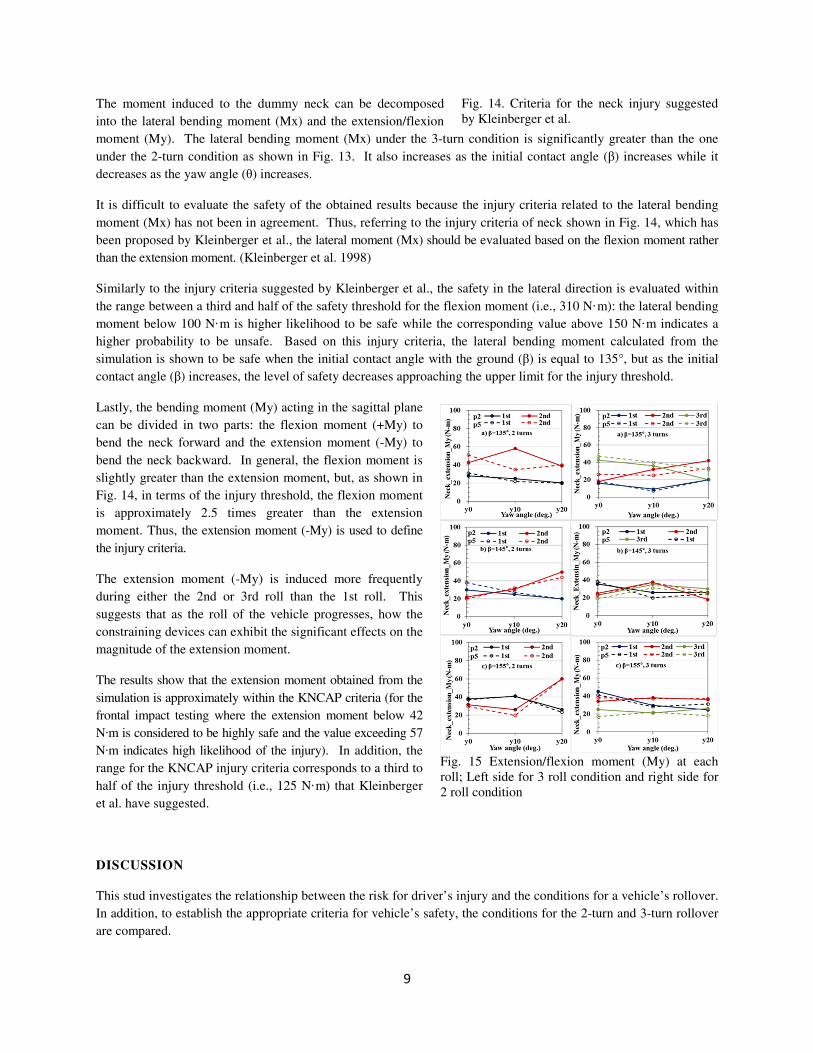
9
The moment induced to the dummy neck can be decomposed into the lateral bending moment (Mx) and the extension/flexion moment (My). The lateral bending moment (Mx) under the 3-turn condition is significantly greater than the one under the 2-turn condition as shown in Fig. 13. It also increases as the initial contact angle (β) increases while it decreases as the yaw angle (θ) increases.
It is difficult to evaluate the safety of the obtained results because the injury criteria related to the lateral bending moment (Mx) has not been in agreement. Thus, referring to the injury criteria of neck shown in Fig. 14, which has been proposed by Kleinberger et al., the lateral moment (Mx) should be evaluated based on the flexion moment rather than the extension moment. (Kleinberger et al. 1998)
Similarly to the injury criteria suggested by Kleinberger et al., the safety in the lateral direction is evaluated within the range between a third and half of the safety threshold for the flexion moment (i.e., 310 N·m): the lateral bending moment below 100 N·m is higher likelihood to be safe while the corresponding value above 150 N·m indicates a higher probability to be unsafe. Based on this injury criteria, the lateral bending moment calculated from the simulation is shown to be safe when the initial contact angle with the ground (β) is equal to 135°, but as the initial contact angle (β) increases, the level of safety decreases approaching the upper limit for the injury threshold.
Lastly, the bending moment (My) acting in the sagittal plane can be divided in two parts: the flexion moment (+My) to bend the neck forward and the extension moment (-My) to bend the neck backward. In general, the flexion moment is slightly greater than the extension moment, but, as shown in Fig. 14, in terms of the injury threshold, the flexion moment is approximately 2.5 times greater than the extension moment. Thus, the extension moment (-My) is used to define the injury criteria.
The extension moment (-My) is induced more frequently during either the 2nd or 3rd roll than the 1st roll. This suggests that as the roll of the vehicle progresses, how the constraining devices can exhibit the significant effects on the magnitude of the extension moment.
The results show that the extension moment obtained from the simulation is approximately within the KNCAP criteria (for the frontal impact testing where the extension moment below 42 N·m is considered to be highly safe and the value exceeding 57 N·m indicates high likelihood of the injury). In addition, the range for the KNCAP injury criteria corresponds to a third to half of the injury threshold (i.e., 125 N·m) that Kleinberger et al. have suggested.
DISCUSSION This stud investigates the relationship between the risk for driver’s injury and the conditions for a vehicle’s rollover. In addition, to establish the appropriate criteria for vehicle’s safety, the conditions for the 2-turn and 3-turn rollover are compared.
Fig. 14. Criteria for the neck injury suggested by Kleinberger et al.
Fig. 15 Extension/flexion moment (My) at each roll; Left side for 3 roll condition and right side for 2 roll condition
10
The contact angle with ground, not the pitch and yaw angle, is the dominant factor that causes the increase in the magnitude of the A-pillar displacement. In addition, the head acceleration of the dummy seating on the driver’s seat and the HIC value increase as the initial contact angle with the ground and the number of the turn increase. On the other hand, the corresponding values decrease as the yaw angle increases.
Considering the shear force induced on the neck, the shear force component in the lateral direction (Fy) is greater than the longitudinal shear force, Fx. Each shear force component independently satisfy the KNCAP criteria. However, the vector sum of the shear force components in both directions (can fail, may fail, or fails) to satisfy the KNCAP criteria. The results estimate that the compressive force (Fz) is significantly affected by not only the initial contact angle with the ground and the turn condition, but also the stiffness of roof interior and the constraining device, which is related to the diving effect.
The lateral bending moment induced on the neck (Mx) increases as the initial contact angle with the ground or the number of the turn increase. As the yaw angle increases, the corresponding value decreases. In contrast, the extension bending moment (My) is more affected by the yaw angle than either the initial contact angle with the ground or the number of turn.
Combining with the analysis that the rollovers with less than 2 turns account for 90% of the entire rollover accidents (Digges K and Eigen A. 2003), this study suggests that the 2-turn condition with the initial contact angle with the ground of either 145° or 155° would be appropriate for the evaluation criteria to assess the vehicle’s safety performance.
CONCLUSIONS This study investigates the relationship between the risk for driver’s injury and the conditions for a vehicle’s rollover. For this purpose, the multi-body model for the vehicle’s chassis is constructed using ADAMS multi-body dynamics software. The injury severity for the 2-turn and 3-turn conditions is investigated in order to propose pertinent criteria for assessing the vehicle’s safety performance. To systematically simulate the various vehicle conditions, a three-level L27 orthogonal array for the 5 members of the upper body, which significantly affect the deformation at the top portion of the A-pillar, is used. Through the DOE analysis, the following conclusions are obtained.
1) In a rollover accident, it would be appropriate to use the HIC15 for the evaluation criterion of head injury, rather than the HIC36.
2) In contrast to a frontal impact testing where only Fx component acting on the neck is considered, when assessing a rollover safety, both Fx and Fy components should be considered. In general, the Fy component is greater than Fx component in a rollover.
3) In terms of the moment acting on the neck, the extension moment (-My) should be considered as an evaluation criterion in conjunction with the lateral bending moment.
4) The compressive force (Fz) is significantly affected by the chassis strength and the effect of constraining devices. Therefore, pertinent regulations related to the ceiling strength (SWR), which represents the chassis strength, would be warranted. To minimize the diving effect during a rollover, the constraining devices should be improved.
The contact angle with ground, not the pitch and yaw angle, is the dominant factor for the increase in the A-pillar displacement. ACKNOWLEDMENTS
11
This research was supported by the Korea Ministry of Land, Infrastructure, and Transport. It was also supported by the Korea Agency for Infrastructure Technology Advancement (Project No.: 14PTSI-C054118-06).
REFERENCES [1] B. K. Han, E. D. Lee, J. S Shim, J. H. Jung (2013), Evaluation of the Dynamic Rollover Characteristics of Trip-over Vehicles through Multi-Body Dynamics Simulation, 23th Int. Tech. Conference on the ESV, Paper No. 13-0243-O. [2] B. K. Han, E. D. Lee, J. H. Jung, S. M. Jang (2015), A Relationship of the Roof Strength Resistance with the Displacement of Top-end of A-pillar in CRIS Test, will be published in IJAT. [3] Chirwa, E.C., et al. (2010), Review of the Jordan Rollover System (JRS) vis-a-vis other dynamic crash test devices. International Journal of Crashworthiness, 15(5): p. 553-569. [4] Cooper ER, Moffatt EA, Curzon AM, Smyth BJ, Orlowski KF. (2001), Repeatable dynamic rollover test procedure with controlled roof impact. Society of Automotive Engineers, Warrendale, PA. [5] Digges K and Eigen A. (2003), Crash Attributes that Influence the Severity of Rollover Crashes. Proceedings of the 18th International Technical Conference on the Enhanced Safety of Vehicles, Nagoya, Japan, May 2003. Paper 231 [6] Evans, L. (1988), "Restraint Effectiveness, Occupant Ejection from Cars, and Fatality Reductions." General Motors Research Laboratories, GMR-6398, September 1. [7] Friedman D, Nash CE. (2003), Measuring rollover roof strength for occupant protection. IJCrash. 8, 97–105. [8] Friedman, D. and R. Grzebieta (2009), A Proposed Rollover and Comprehensive Rating System, in 21st Int. Tech. Conference on the ESV. [9] Grzebieta, R., et al. (2007), “Rollover Crashes: Diving Versus Roof Crush”, in 20th Int. Tech. Conference on the ESV, Lyon, France. [10] Huelke. D. F., Marsh, J. C., Dimento, L J., Sherman, H. W., and Ballard, W. J. (1973), "Injury Causation in Rollover Accidents." Proceedings of the 17th Conference of the American Association for Automotive Medicine. [11] Huelke, D. F., Lawson, T. E, Marsh, J. C. (1977), "Injuries, Restraints and Vehicle Factors in Rollover Car Crashes." Accid. Anal. & Prev., Vol. 9, pp. 93-107. [12] Kerrigan, J.R., et al. (2011), “Design of a Dynamic Rollover Test System”, SAE International Journal of Passenger Cars - Mechanical Systems, 4(1): p. 870-903. [13] Linstromberf, G. Scholpp, O. Scherf (2005), Test and Simulation Tools in Rollover Protection Development Process, 19th Int. Tech. Conference on the ESV, Paper No.05-0122-O. [14] Mattos G.A., Grzebieta R.H., Bambach M.R., and McIntosh A.S. (2013), Validation of a Dynamic Rollover Test Device, 23th Int. Tech. Conference on the ESV. [15] Moffat EA, Cooper ER, Croteau JJ. (2003), Matched-pair rollover impacts of rollcaged and production roof cars using the controlled rollover impact system (CRIS). Society of Automotive Engineers World Congress. [16] Ridella SA, Eigen AM, Kerrigan JR, Crandall JR. (2009), An analysis of injury type and distribution of belted, non-ejected occupants involved in rollover crashes. Annals of Advances in Automotive Medicine, 53. [17] European Commission (2008). “European Road Statistics” [18] Korea National Police Agency (2011). “Statistics of Road Traffic Accidents 2011” [19] NHTSA (2009). “NHTSA Traffic Safety Facts” [20] SNPRM (2008). “Estimated Fleet Failure Rates Based on GVWR” [21] UNECE (2007). "Statistics of Road Traffic Accidents"
Related Documents