Simulation and model validation of sheet and tube type photovoltaic thermal solar system and conventional solar collecting system in transient states Sujala Bhattarai a , Jae-Heun Oh b , Seung-Hee Euh a , Gopi Krishna Kafle a , Dae Hyun Kim a,n a Department of Biosystems Engineering, Kangwon National University, Hyoja 2 Dong, 192-1 Chuncheon, Republic of Korea b Forest Practice Research Center, Korea Forest Research Institute, Jikdong-Ri 51, Soheul-Eup, Pocheon-Si, Gyeonggi-Do 487-821, Republic of Korea article info Article history: Received 5 December 2011 Received in revised form 17 March 2012 Accepted 11 April 2012 Available online 22 May 2012 Keywords: PV/T system Conventional solar collector Simulation and model validation Performance evaluation abstract This study presents a one-dimensional mathematical model for simulating the transient processes of sheet and tube type photovoltaic/thermal (PV/T) system and conventional type solar collectors. The models are based on the energy conservation for the glass cover, PV plate, absorber plate, tube, water in the tube and storage tank for the PV/T and the same layers excluding PV plate in conventional solar collector. The models were all first order ordinary differential equations which could be easily solved in the Matlab computer program using ode solvers. For the purpose of validating the proposed methods, performance tests were done on the both systems. Satisfactory convergences were found between the measured data and calculated results. The statistical analysis was performed for the scientific validation of the results. The current model is suitable for the single cover tube type PV/T systems. & 2012 Elsevier B.V. All rights reserved. 1. Introduction Rising oil prices and greenhouse gas emissions have stimulated motivation for the exploration of renewable forms of energy. Solar energy in the form of solar radiation has been identified as one of the most promising sources of energy relieve dependency fossil fuels [1]. Integrated photovoltaic combined thermal systems (PV/ T) are one possibility for harnessing the available solar energy resources effectively. The PV/T systems are especially attractive because the absorbed solar radiation is converted into electricity and heat that can be utilized simultaneously [2]. The efficiency of a solar cell can be improved when it is used simultaneously with a heat generator [2,3]. Goetzberger et al. [4] reported that the excess heat of a PV concentrator cell can be used to drive a thermal power engine, which can also work as a cooling device for the solar cell. Previous study [5–7] showed that two PV/T collectors together can produce more energy per unit surface area than one PV panel and one thermal collector next to each other. This has high importance where surface area availability is limited. The main disadvantage of the PV cell, besides high cost, is the low efficiency comes with a rise in temperature of the PV plate [8]. By cooling the PV module with a fluid stream like air or water, the electricity yield can be improved. PV/T can be used in private houses, blocks of flats, tourist areas, hospitals, schools, and for heating water to make it sanitary. Zondag et al. [9,10] developed 1-D, 2-D, and 3-D models to generate detailed performance data for design improvements of PV/T systems. They found that the channel-below PV configura- tion was best from an efficiency perspective, and sheet and tube type designs were found promising for domestic hot water production. Chow [11] introduced an explicit dynamic model for analyzing the performance of a single-glazed sheet and tube PV/T system and found performance was improved when there was good thermal contact between the encapsulated solar cells and the absorber plate, as well as between the absorber plate and the water tubing. Chow et al. [12] reported that the glazed design is always suitable if either the thermal or overall energy output is to be maximized. De Vries [13] estimated annual average thermal efficiency of 33% for the combi-panel and 54% for the thermal collector. Vokas et al. [14] performed theoretical analysis of PV/T water heating systems and found that the thermal efficiency of the PV/T system was 9% lower than a conventional solar thermal collector. Sandnes and Rekstad [15] reported that the presence of solar cells reduces the heat absorption by about 10% of the incident radiation and the glass cover reduces the optical effi- ciency by around 5%. From the former research, it is known that the PV/T systems can utilize solar energy more effectively and have a higher total efficiency than common solar collecting systems, but the extent is unknown. Accordingly, Cadafalch [16] noticed that the heat transfer through flat plate solar collectors is essentially one dimensional. The model was an extension of the Duffie and Beckman [17] lumped model. For the validation of this model, the numerical and experimental steady-state efficiency of a single-glazed Contents lists available at SciVerse ScienceDirect journal homepage: www.elsevier.com/locate/solmat Solar Energy Materials & Solar Cells 0927-0248/$ - see front matter & 2012 Elsevier B.V. All rights reserved. http://dx.doi.org/10.1016/j.solmat.2012.04.017 n Corresponding author. Tel.: þ82 33 250 6496; fax: þ82 33 255 6406. E-mail addresses: [email protected] (S. Bhattarai), [email protected] (D. Hyun Kim). Solar Energy Materials & Solar Cells 103 (2012) 184–193

Welcome message from author
This document is posted to help you gain knowledge. Please leave a comment to let me know what you think about it! Share it to your friends and learn new things together.
Transcript
Solar Energy Materials & Solar Cells 103 (2012) 184–193
Contents lists available at SciVerse ScienceDirect
Solar Energy Materials & Solar Cells
0927-02
http://d
n Corr
E-m
daekim
journal homepage: www.elsevier.com/locate/solmat
Simulation and model validation of sheet and tube type photovoltaic thermalsolar system and conventional solar collecting system in transient states
Sujala Bhattarai a, Jae-Heun Oh b, Seung-Hee Euh a, Gopi Krishna Kafle a, Dae Hyun Kim a,n
a Department of Biosystems Engineering, Kangwon National University, Hyoja 2 Dong, 192-1 Chuncheon, Republic of Koreab Forest Practice Research Center, Korea Forest Research Institute, Jikdong-Ri 51, Soheul-Eup, Pocheon-Si, Gyeonggi-Do 487-821, Republic of Korea
a r t i c l e i n f o
Article history:
Received 5 December 2011
Received in revised form
17 March 2012
Accepted 11 April 2012Available online 22 May 2012
Keywords:
PV/T system
Conventional solar collector
Simulation and model validation
Performance evaluation
48/$ - see front matter & 2012 Elsevier B.V. A
x.doi.org/10.1016/j.solmat.2012.04.017
esponding author. Tel.: þ82 33 250 6496; fax
ail addresses: [email protected] (S.
@kangwon.ac.kr (D. Hyun Kim).
a b s t r a c t
This study presents a one-dimensional mathematical model for simulating the transient processes of
sheet and tube type photovoltaic/thermal (PV/T) system and conventional type solar collectors. The
models are based on the energy conservation for the glass cover, PV plate, absorber plate, tube, water in
the tube and storage tank for the PV/T and the same layers excluding PV plate in conventional solar
collector. The models were all first order ordinary differential equations which could be easily solved in
the Matlab computer program using ode solvers. For the purpose of validating the proposed methods,
performance tests were done on the both systems. Satisfactory convergences were found between the
measured data and calculated results. The statistical analysis was performed for the scientific validation
of the results. The current model is suitable for the single cover tube type PV/T systems.
& 2012 Elsevier B.V. All rights reserved.
1. Introduction
Rising oil prices and greenhouse gas emissions have stimulatedmotivation for the exploration of renewable forms of energy. Solarenergy in the form of solar radiation has been identified as one ofthe most promising sources of energy relieve dependency fossilfuels [1]. Integrated photovoltaic combined thermal systems (PV/T) are one possibility for harnessing the available solar energyresources effectively. The PV/T systems are especially attractivebecause the absorbed solar radiation is converted into electricityand heat that can be utilized simultaneously [2]. The efficiency ofa solar cell can be improved when it is used simultaneously with aheat generator [2,3]. Goetzberger et al. [4] reported that the excessheat of a PV concentrator cell can be used to drive a thermal powerengine, which can also work as a cooling device for the solar cell.Previous study [5–7] showed that two PV/T collectors together canproduce more energy per unit surface area than one PV panel andone thermal collector next to each other. This has high importancewhere surface area availability is limited. The main disadvantageof the PV cell, besides high cost, is the low efficiency comes with arise in temperature of the PV plate [8]. By cooling the PV modulewith a fluid stream like air or water, the electricity yield can beimproved. PV/T can be used in private houses, blocks of flats,tourist areas, hospitals, schools, and for heating water to make itsanitary.
ll rights reserved.
: þ82 33 255 6406.
Bhattarai),
Zondag et al. [9,10] developed 1-D, 2-D, and 3-D models togenerate detailed performance data for design improvements ofPV/T systems. They found that the channel-below PV configura-tion was best from an efficiency perspective, and sheet and tubetype designs were found promising for domestic hot waterproduction. Chow [11] introduced an explicit dynamic model foranalyzing the performance of a single-glazed sheet and tube PV/Tsystem and found performance was improved when there wasgood thermal contact between the encapsulated solar cells andthe absorber plate, as well as between the absorber plate and thewater tubing. Chow et al. [12] reported that the glazed design isalways suitable if either the thermal or overall energy output is tobe maximized. De Vries [13] estimated annual average thermalefficiency of 33% for the combi-panel and 54% for the thermalcollector. Vokas et al. [14] performed theoretical analysis of PV/Twater heating systems and found that the thermal efficiency ofthe PV/T system was 9% lower than a conventional solar thermalcollector. Sandnes and Rekstad [15] reported that the presence ofsolar cells reduces the heat absorption by about 10% of theincident radiation and the glass cover reduces the optical effi-ciency by around 5%. From the former research, it is known thatthe PV/T systems can utilize solar energy more effectively andhave a higher total efficiency than common solar collectingsystems, but the extent is unknown.
Accordingly, Cadafalch [16] noticed that the heat transferthrough flat plate solar collectors is essentially one dimensional.The model was an extension of the Duffie and Beckman [17]lumped model. For the validation of this model, the numericaland experimental steady-state efficiency of a single-glazed
Nomenclature
A surface area (m2)C specific heat capacity (J/kg K)c1,c2 heat loss termsd difference between measured and predicted valueD tube diameter (m)E electrical power output (W/m2)G solar radiation flux (W/m2)g gravitational constant 9.81 (m/s2)h heat transfer coefficient (W/m2 K)k thermal conductivity (W/m K)L Length (m)_mw mass flow rate (kg/s)
m no of data pointsM mass (kg)n number of tubesNu Nusselt numberP packing factor, dimensionlessR thermal resistance (k/W), refractive indexRa Rayleigh numberRe Reynolds numberRMSE root mean square errorT temperature (1C)Tm mean temperature (1C)t time (s)u velocity (m/s)W tube spacing (m)x distance (m)X predicted valueY measured value
Greek
L extinction coefficients Stefan Bolzmans constant, 5.67�10�8(W/m2 K4)yi incident angle
ta transmittance of glass coverb solar cell temperature coefficient (l/K)k thermal diffusivity (m2/s)n kinematic viscosity (m2/s)Y temperature (K)r density (kg/m3)a absorptanceA emissivityd thickness (m)Z efficiency
Superscript
þ critical
Subscripts
a ambient airad adhesive layerc collector, convectivecell solar celld,th daily thermale electricalg glazingi insulationin inlet, initialj jth valuesm meano outlet, final, totalp PV plater radiation, referencet tubetk tankth thermalw waterwind wind induced
S. Bhattarai et al. / Solar Energy Materials & Solar Cells 103 (2012) 184–193 185
flat-plate collector was presented. Villar et al. [18] introducedtransient models for the flat plate collector. However, the experi-mental verification was applicable only to steady-state conditions.Only the efficiency of the collector was determined. Fan et al. [19]presented a numerical and experimental investigation of the flowand temperature distribution in solar collector panels. Though themodel was simple and coded in Fluent 6.1, the model worked wellonly with high mass flow rates.
Analysis of the literature illustrates that the transient modelsfor PV/T systems and conventional solar heating systems havebeen developed and analyzed separately by different researchers,but no attempt has been made to calculate the comparativetransient history of a solar collector and PV/T system. Thecomparative data between PV/T systems and traditional solarsystems is limited. He [20] performed the experiments on PV/Tsystems under natural air circulation. In their research, the dailythermal efficiency of the PV/T system was found to be 75% of ofthe efficiency of a conventional solar thermosyphon collectorsystem, and the electrical efficiency was found to be about 10%,which was lower than the traditional monocrystalline silicon PVplate in the same conditions. The primary energy saving efficiencywas found to be about 60–75%, which was much higher than theefficiency of conventional system.
In the present work, a dynamic model for a sheet and tubetype PV/T system and conventional solar collecting system was
developed and verified through the experiments. The experimentwas performed at Kangwon National University, Chuncheon,South Korea. The aperture area of the PV/T was the same as thearea of a conventional solar collecting system. The effectiveness ofthe sheet and tube type PV/T system has been clarified bycomparison with the effectiveness of conventional flat platecollectors.
2. Composition of the PV/T system and experiment rig design
2.1. Outline of the PV/T collector
The major components of the PV/T system are PV module andthe solar collector. PV module consists of polycrystalline siliconcell of ideal conversion efficiency 17.8%. The performance speci-fication of the PV module is summarized in Table 1. Sheet andtube type PV/T systems have the advantages of smaller require-ments for water capacity, higher pressure bearing capacity, andflexibility in construction. The sheet and tube PV/T system used inthe present study consists of a thermal absorber, glazing, workingfluid, tube, and insulation. Fig. 1(a) and (b) show the front viewand the cross section of the system. The top glazing was separatedfrom the PV plate by an air gap. Ten copper tubes were attachedto the bottom side of the cupper absorber plate below the
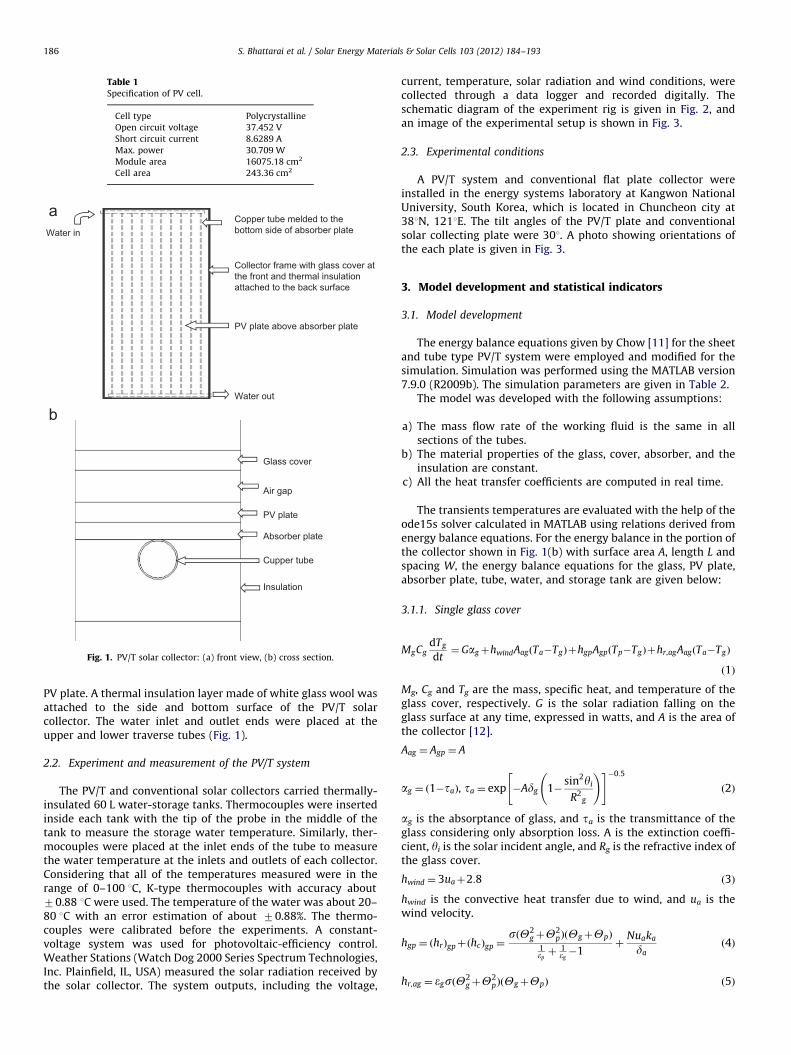
Table 1Specification of PV cell.
Cell type Polycrystalline
Open circuit voltage 37.452 V
Short circuit current 8.6289 A
Max. power 30.709 W
Module area 16075.18 cm2
Cell area 243.36 cm2
Water in
Water out
Collector frame with glass cover atthe front and thermal insulationattached to the back surface
PV plate above absorber plate
Copper tube melded to thebottom side of absorber plate
Glass cover
Air gap
PV plate
Absorber plate
Cupper tube
Insulation
Fig. 1. PV/T solar collector: (a) front view, (b) cross section.
S. Bhattarai et al. / Solar Energy Materials & Solar Cells 103 (2012) 184–193186
PV plate. A thermal insulation layer made of white glass wool wasattached to the side and bottom surface of the PV/T solarcollector. The water inlet and outlet ends were placed at theupper and lower traverse tubes (Fig. 1).
2.2. Experiment and measurement of the PV/T system
The PV/T and conventional solar collectors carried thermally-insulated 60 L water-storage tanks. Thermocouples were insertedinside each tank with the tip of the probe in the middle of thetank to measure the storage water temperature. Similarly, ther-mocouples were placed at the inlet ends of the tube to measurethe water temperature at the inlets and outlets of each collector.Considering that all of the temperatures measured were in therange of 0–100 1C, K-type thermocouples with accuracy about70.88 1C were used. The temperature of the water was about 20–80 1C with an error estimation of about 70.88%. The thermo-couples were calibrated before the experiments. A constant-voltage system was used for photovoltaic-efficiency control.Weather Stations (Watch Dog 2000 Series Spectrum Technologies,Inc. Plainfield, IL, USA) measured the solar radiation received bythe solar collector. The system outputs, including the voltage,
current, temperature, solar radiation and wind conditions, werecollected through a data logger and recorded digitally. Theschematic diagram of the experiment rig is given in Fig. 2, andan image of the experimental setup is shown in Fig. 3.
2.3. Experimental conditions
A PV/T system and conventional flat plate collector wereinstalled in the energy systems laboratory at Kangwon NationalUniversity, South Korea, which is located in Chuncheon city at381N, 1211E. The tilt angles of the PV/T plate and conventionalsolar collecting plate were 301. A photo showing orientations ofthe each plate is given in Fig. 3.
3. Model development and statistical indicators
3.1. Model development
The energy balance equations given by Chow [11] for the sheetand tube type PV/T system were employed and modified for thesimulation. Simulation was performed using the MATLAB version7.9.0 (R2009b). The simulation parameters are given in Table 2.
The model was developed with the following assumptions:
a)
The mass flow rate of the working fluid is the same in allsections of the tubes.b)
The material properties of the glass, cover, absorber, and theinsulation are constant.c)
All the heat transfer coefficients are computed in real time.The transients temperatures are evaluated with the help of theode15s solver calculated in MATLAB using relations derived fromenergy balance equations. For the energy balance in the portion ofthe collector shown in Fig. 1(b) with surface area A, length L andspacing W, the energy balance equations for the glass, PV plate,absorber plate, tube, water, and storage tank are given below:
3.1.1. Single glass cover
MgCgdTg
dt¼GagþhwindAagðTa�TgÞþhgpAgpðTp�TgÞþhr,agAagðTa�TgÞ
ð1Þ
Mg, Cg and Tg are the mass, specific heat, and temperature of theglass cover, respectively. G is the solar radiation falling on theglass surface at any time, expressed in watts, and A is the area ofthe collector [12].
Aag ¼ Agp ¼ A
ag ¼ ð1�taÞ, ta ¼ exp �Adg 1�sin2yi
R2g
!" #�0:5
ð2Þ
ag is the absorptance of glass, and ta is the transmittance of theglass considering only absorption loss. A is the extinction coeffi-cient, yi is the solar incident angle, and Rg is the refractive index ofthe glass cover.
hwind ¼ 3uaþ2:8 ð3Þ
hwind is the convective heat transfer due to wind, and ua is thewind velocity.
hgp ¼ ðhrÞgpþðhcÞgp ¼sðY2
gþY2pÞðYgþYpÞ
1epþ 1
eg�1
þNuaka
dað4Þ
hr,ag ¼ egsðY2gþY
2pÞðYgþYpÞ ð5Þ
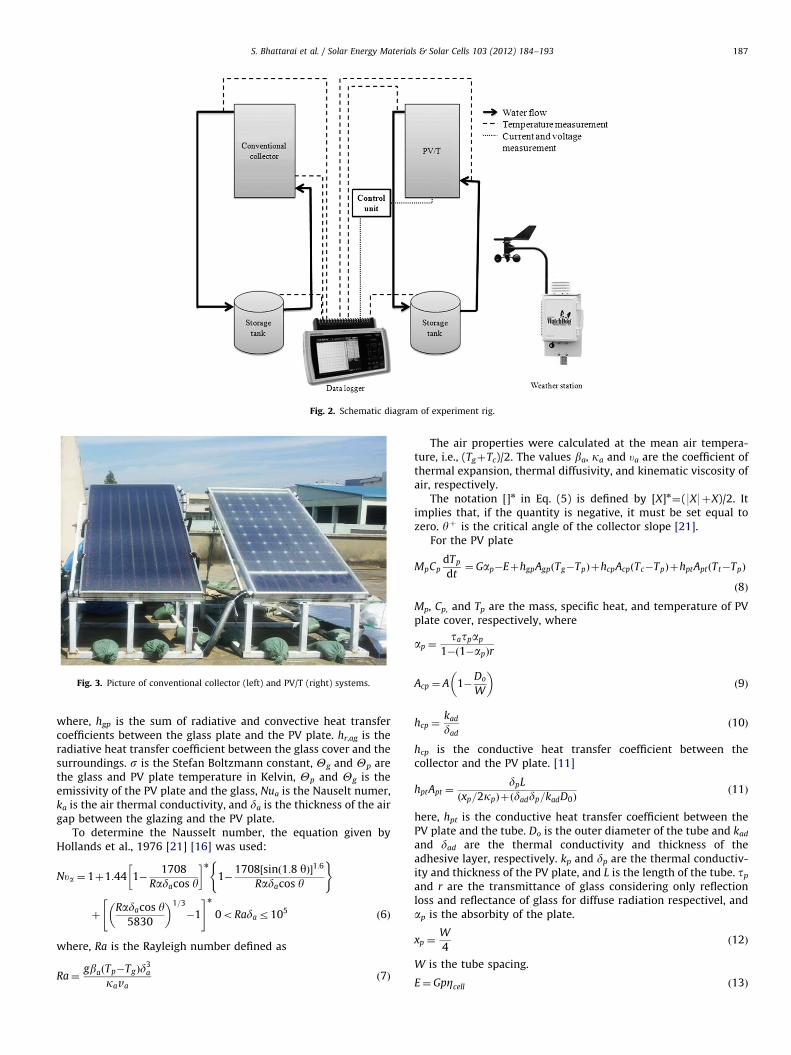
Fig. 2. Schematic diagram of experiment rig.
Fig. 3. Picture of conventional collector (left) and PV/T (right) systems.
S. Bhattarai et al. / Solar Energy Materials & Solar Cells 103 (2012) 184–193 187
where, hgp is the sum of radiative and convective heat transfercoefficients between the glass plate and the PV plate. hr,ag is theradiative heat transfer coefficient between the glass cover and thesurroundings. s is the Stefan Boltzmann constant, Yg and Yp arethe glass and PV plate temperature in Kelvin, Yp and Yg is theemissivity of the PV plate and the glass, Nua is the Nauselt numer,ka is the air thermal conductivity, and da is the thickness of the airgap between the glazing and the PV plate.
To determine the Nausselt number, the equation given byHollands et al., 1976 [21] [16] was used:
Nua ¼ 1þ1:44 1�1708
Radacos y
� �n1�
1708½sinð1:8 yÞ�1:6
Radacos y
( )
þRadacos y
5830
� �1=3
�1
" #n0oRadar105
ð6Þ
where, Ra is the Rayleigh number defined as
Ra¼gbaðTp�TgÞd
3a
kavað7Þ
The air properties were calculated at the mean air tempera-ture, i.e., (TgþTc)/2. The values ba, ka and ua are the coefficient ofthermal expansion, thermal diffusivity, and kinematic viscosity ofair, respectively.
The notation []n in Eq. (5) is defined by [X]n¼(9X9þX)/2. Itimplies that, if the quantity is negative, it must be set equal tozero. yþ is the critical angle of the collector slope [21].
For the PV plate
MpCpdTp
dt¼ Gap�EþhgpAgpðTg�TpÞþhcpAcpðTc�TpÞþhptAptðTt�TpÞ
ð8Þ
Mp, Cp, and Tp are the mass, specific heat, and temperature of PVplate cover, respectively, where
ap ¼tatpap
1�ð1�apÞr
Acp ¼ A 1�Do
W
� �ð9Þ
hcp ¼kad
dadð10Þ
hcp is the conductive heat transfer coefficient between thecollector and the PV plate. [11]
hptApt ¼dpL
ðxp=2kpÞþðdaddp=kadD0Þð11Þ
here, hpt is the conductive heat transfer coefficient between thePV plate and the tube. Do is the outer diameter of the tube and kad
and dad are the thermal conductivity and thickness of theadhesive layer, respectively. kp and dp are the thermal conductiv-ity and thickness of the PV plate, and L is the length of the tube. tp
and r are the transmittance of glass considering only reflectionloss and reflectance of glass for diffuse radiation respectivel, andap is the absorbity of the plate.
xp ¼W
4ð12Þ
W is the tube spacing.
E¼ GpZcell ð13Þ
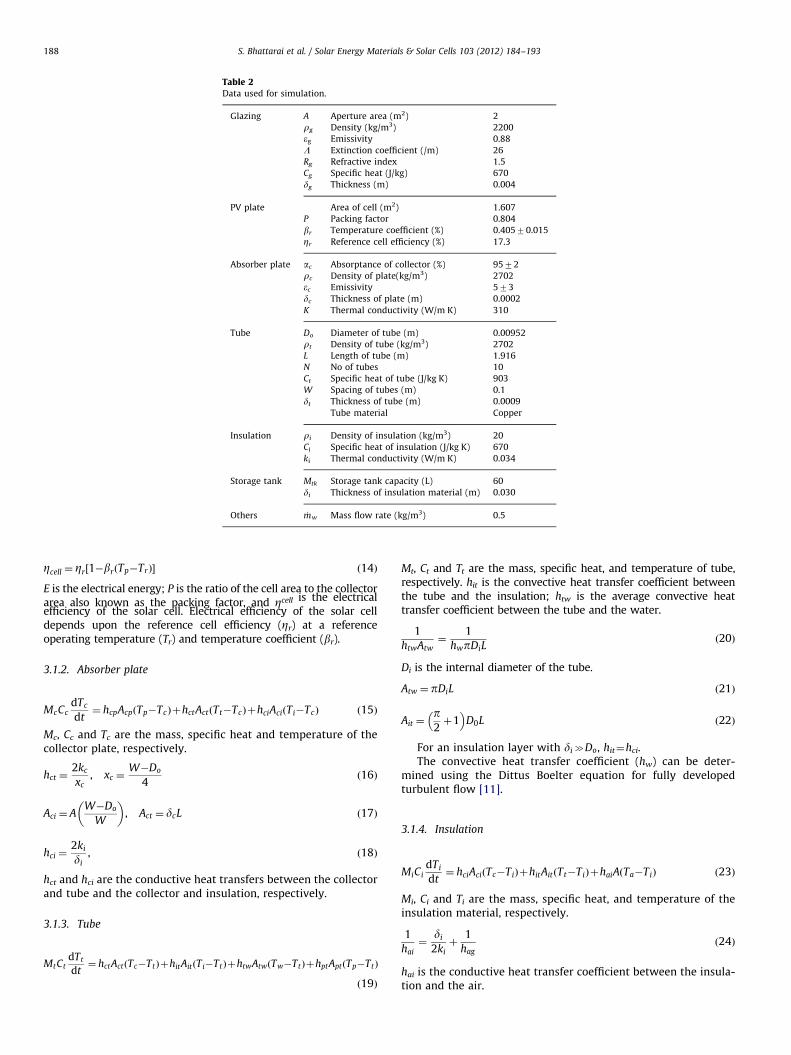
Table 2Data used for simulation.
Glazing A Aperture area (m2) 2
rg Density (kg/m3) 2200
eg Emissivity 0.88
L Extinction coefficient (/m) 26
Rg Refractive index 1.5
Cg Specific heat (J/kg) 670
dg Thickness (m) 0.004
PV plate Area of cell (m2) 1.607
P Packing factor 0.804
br Temperature coefficient (%) 0.40570.015
Zr Reference cell efficiency (%) 17.3
Absorber plate ac Absorptance of collector (%) 9572
rc Density of plate(kg/m3) 2702
ec Emissivity 573
dc Thickness of plate (m) 0.0002
K Thermal conductivity (W/m K) 310
Tube Do Diameter of tube (m) 0.00952
rt Density of tube (kg/m3) 2702
L Length of tube (m) 1.916
N No of tubes 10
Ct Specific heat of tube (J/kg K) 903
W Spacing of tubes (m) 0.1
dt Thickness of tube (m) 0.0009
Tube material Copper
Insulation ri Density of insulation (kg/m3) 20
Ci Specific heat of insulation (J/kg K) 670
ki Thermal conductivity (W/m K) 0.034
Storage tank Mtk Storage tank capacity (L) 60
di Thickness of insulation material (m) 0.030
Others _mw Mass flow rate (kg/m3) 0.5
S. Bhattarai et al. / Solar Energy Materials & Solar Cells 103 (2012) 184–193188
Zcell ¼ Zr½1�brðTp�TrÞ� ð14Þ
E is the electrical energy; P is the ratio of the cell area to the collectorarea also known as the packing factor, and Zcell is the electricalefficiency of the solar cell. Electrical efficiency of the solar celldepends upon the reference cell efficiency (Zr) at a referenceoperating temperature (Tr) and temperature coefficient (br).
3.1.2. Absorber plate
McCcdTc
dt¼ hcpAcpðTp�TcÞþhctActðTt�TcÞþhciAciðTi�TcÞ ð15Þ
Mc, Cc and Tc are the mass, specific heat and temperature of thecollector plate, respectively.
hct ¼2kc
xc, xc ¼
W�Do
4ð16Þ
Aci ¼ AW�Do
W
� �, Act ¼ dcL ð17Þ
hci ¼2ki
di, ð18Þ
hct and hci are the conductive heat transfers between the collectorand tube and the collector and insulation, respectively.
3.1.3. Tube
MtCtdTt
dt¼ hctActðTc�TtÞþhitAitðTi�TtÞþhtwAtwðTw�TtÞþhptAptðTp�TtÞ
ð19Þ
Mt, Ct and Tt are the mass, specific heat, and temperature of tube,respectively. hit is the convective heat transfer coefficient betweenthe tube and the insulation; htw is the average convective heattransfer coefficient between the tube and the water.
1
htwAtw¼
1
hwpDiLð20Þ
Di is the internal diameter of the tube.
Atw ¼ pDiL ð21Þ
Ait ¼p2þ1
� �D0L ð22Þ
For an insulation layer with dicDo, hit¼hci.The convective heat transfer coefficient (hw) can be deter-
mined using the Dittus Boelter equation for fully developedturbulent flow [11].
3.1.4. Insulation
MiCidTi
dt¼ hciAciðTc�TiÞþhitAitðTt�TiÞþhaiAðTa�TiÞ ð23Þ
Mi, Ci and Ti are the mass, specific heat, and temperature of theinsulation material, respectively.
1
hai¼
di
2kiþ
1
hagð24Þ
hai is the conductive heat transfer coefficient between the insula-tion and the air.
S. Bhattarai et al. / Solar Energy Materials & Solar Cells 103 (2012) 184–193 189
3.1.5. The water in the tube
MwCwdTw1
dt¼ htwAtwðTt�Tw1Þþ _mwCwðTwo�Tw2Þ ð25Þ
Mw, Cw and Tw are the mass, specific heat, and temperature ofwater in the tube, respectively.
Tw1 ¼TwoþTw2
2ð26Þ
_mw was the mass flow rate of water in the tube. The temperatureof the water in the tube was considered as the average of the inletand outlet water temperature in the tube.
3.1.6. Storage tank
MtkCtkdTtk
dt¼ _mwnCwðTtk,i�Ttk,oÞþhtkAtkðTa�TtkÞ ð27Þ
Mtk, Ctk and Atk are the weight, specific heat capacity, and surfacearea of water in the storage tank; n is the total number of tubes;Ttk,i and Ttk,o are the tank inlet and outlet temperatures; htk is theoverall heat transfer coefficient of the storage tank.
The following energy balance equations were employed for themodeling of the conventional collector. The simulation wasperformed using the Matlab 7. 9. 0. (R2009b). The simulationparameters are given in Table 2.
a)
Single glass coverMgCgdTg
dt¼ GagþhwindAagðTa�TgÞþhgcAgcðTc�TgÞþhr,agAagðTa�TgÞ
ð28Þ
where,
hgc ¼ ðhrÞgcþðhcÞgc ¼sðY2
gþY2cÞðYgþYcÞ
ð1=ecÞþð1=egÞ�1þ
Nuaka
dað29Þ
b)
For the absorber plateMcCcdTc
dt¼ GacþhgcAgcðTp�TcÞþhctActðTt�TcÞþhciAciðTi�TcÞ
ð30Þ
c)
For the tubeMtCtdTt
dt¼ hctActðTc�TtÞþhitAitðTi�TtÞþhtwAtwðTw�TtÞ ð31Þ
d)
InsulationMiCidTi
dt¼ hciAciðTc�TiÞþhitAitðTt�TiÞþhaiAðTa�TiÞ ð32Þ
e)
Water in tubeMwCwdTw1
dt¼ htwAtwðTt�Tw1Þþ _mwCwðTwo�Tw2Þ ð33Þ
f)
Storage tankMtkCtkdTtk
dt¼ _mwnCwðTtk,i�Ttk,oÞþhtkAtkðTa�TtkÞ ð34Þ
3.2. Statistical indicators
A number of statistical indicators have been proposed and usedto evaluate the models. Stone [22] discussed several indicators
including the root mean square error (RMSE). It follows the dimen-sion of the predicted quantities:
RMSE1 ¼1
m
Xm
j ¼ 1
d2j
0@
1A1=2
ð35Þ
dj is the deviation between the jth measured and the predictedvalues, and m is the number of data points. The results are betterwith lower values of RMSE1. Its disadvantage is that a few largeerrors in the sum can produce a significant increase of RMSE1. Tocope with the problem, [22,23] employed a relative root meansquare normalized deviation:
RMSE2 ¼1
m
Xm
j ¼ 1
dj
Yj
� �20@
1A
1=2
ð36Þ
where, Yj is the jth measured value.Accordingly, the third indicator, R-squared, is a statistical
measure of how well a predicted line approximates measureddata:
R-squared¼
mPm
j ¼ 1
XjYj
!�
Pmj ¼ 1
Xj
! Pmj ¼ 1
Yj
!ffiffiffiffiffiffiffiffiffiffiffiffiffiffiffiffiffiffiffiffiffiffiffiffiffiffiffiffiffiffiffiffiffiffiffiffiffiffiffiffiffiffiffiffiffiffiffiffiffiffiffiffiffiffiffiffiffiffiffiffiffiffiffiffiffiffiffiffiffiffiffiffiffiffiffiffiffiffiffiffiffiffiffiffiffiffiffiffiffiffiffiffiffiffiffiffiffiffiffiffiffiffi
mPm
j ¼ 1
X2j �
Pmj ¼ 1
Xj
!224
35 m
Pmj ¼ 1
Y2j �
Pmj ¼ 1
Yj
!224
35
vuuut
2666666664
3777777775
2
ð37Þ
where, Xj is the jth predicted value. An R-squared value equalto 1 implies that the model provides perfect prediction, and0 implies that there is no relationship between the measuredand predicted value.
4. Performance assessment
4.1. EN 12975 standard steady state efficiency measurement
The EN 12975 standard for steady state testing was used forthe simulation. The basic equation for the steady-state model fornear normal incidence angle operation can be written as:
Zth ¼ Zo�c1ðTm�TaÞ
G�c2ðTm�TaÞ
Gð38Þ
where the thermal efficiency of the collector can be calculatedusing the relation:
Zth ¼_mwCpðTo�TinÞ
GAð39Þ
here, Zo is the zero loss efficiency for global radiation at normalincidence, and Tm is the mean temperature of the heat transfer fluid,which is the average of the inlet (Tin) and outlet temperatures (To). Ta
is the air temperature, G is the global radiation in W/m2, and c1 andc2 terms that describe the temperature-dependent heat losses. Thetest runs have been performed in agreement with the guidelines ofthe EN 12975-2 standard, apart from the measurement of the windspeed. The test was done for 5 sunny days. The following measure-ments have been acquired: global irradiance on the collector plane,inlet and outlet fluid temperature in the collectors, surrounding airtemperature, and fluid flow rate. The surrounding air speed wasmeasured on the side of the test rig; the values were consistent,between 0 m/s and 1.3 m/s. In the present data, the effect of thewind speed is reduced as compared to the test requirements givenby EN 12975-2 and therefore comparable to the condition ofnegligible surrounding air speed [24]. The working fluid flow rate
S. Bhattarai et al. / Solar Energy Materials & Solar Cells 103 (2012) 184–193190
was set at 0.022 kg/s m2. Each experimental point was obtained bysetting a constant fluid temperature at the inlet of the collectors.
4.2. Daily performance evaluation
The daily average efficiency is one of the effective test methodsto describe the thermal performance of the PV/T system and theconventional solar water collector. The thermal performance ofthe solar collectors is affected by weather conditions such as solarradiation, ambient temperature, and wind conditions. The dailythermal efficiency of the PV/T system can be calculated asfollows:
Zd,th ¼MwCwðTo�TinÞ
AcP
GðtÞ � 3600ð40Þ
where, Mw is the water storage capacity which was measured as30 kg/m2. Cw is the specific heat capacity of water; To and Tin arethe outlet and inlet water temperatures, respectively; Ac is thecollector area; and G(t) is the solar radiation at time t.
The PV/T performance can be evaluated by using the term totalefficiency (Zo) [25–27],
Zo ¼ Zd,thþPZe ð41Þ
where, Zd,th and Ze are the daily thermal and electrical efficiencyof the PV/T system. P is the packing factor, which is defined as theratio of the cell area to the collector area. Similarly, primaryenergy saving efficiency Zf is used as the performance metric forthe PV/T system [25–27]:
Zf ¼ Zd,thþPZe
Zpower
ð42Þ
where; an Zpower value of 38% is the electrical power generationefficiency of a conventional thermal power plant.
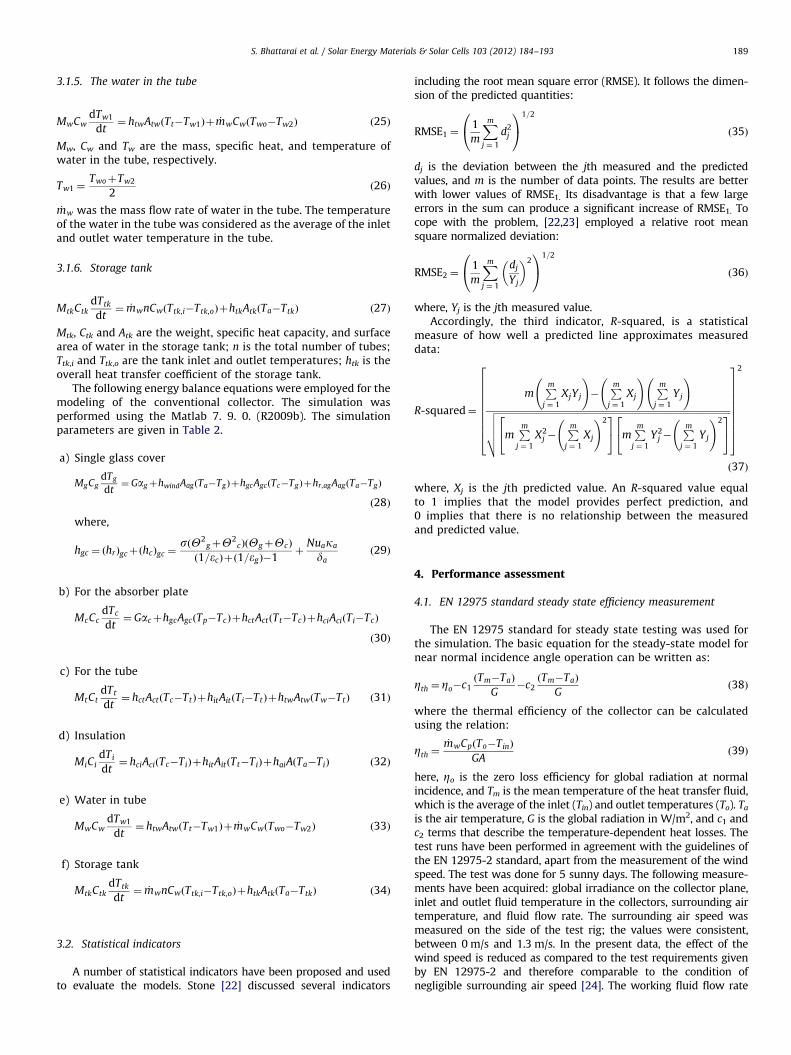
Fig. 5. Comparison of calculated and measured temperature of water in the
storage tanks of PV/T and conventional solar collecting system (08/31/2011).
5. Results and discussion
5.1. Model validation
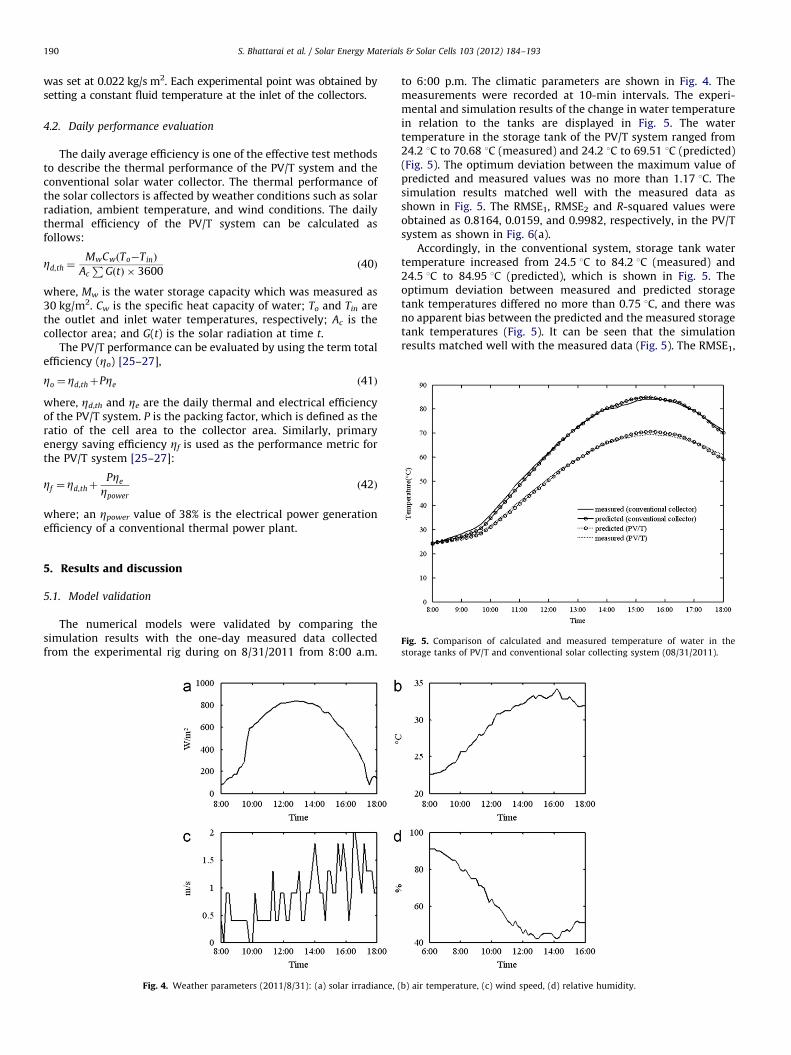
The numerical models were validated by comparing thesimulation results with the one-day measured data collectedfrom the experimental rig during on 8/31/2011 from 8:00 a.m.
Fig. 4. Weather parameters (2011/8/31): (a) solar irradiance, (
to 6:00 p.m. The climatic parameters are shown in Fig. 4. Themeasurements were recorded at 10-min intervals. The experi-mental and simulation results of the change in water temperaturein relation to the tanks are displayed in Fig. 5. The watertemperature in the storage tank of the PV/T system ranged from24.2 1C to 70.68 1C (measured) and 24.2 1C to 69.51 1C (predicted)(Fig. 5). The optimum deviation between the maximum value ofpredicted and measured values was no more than 1.17 1C. Thesimulation results matched well with the measured data asshown in Fig. 5. The RMSE1, RMSE2 and R-squared values wereobtained as 0.8164, 0.0159, and 0.9982, respectively, in the PV/Tsystem as shown in Fig. 6(a).
Accordingly, in the conventional system, storage tank watertemperature increased from 24.5 1C to 84.2 1C (measured) and24.5 1C to 84.95 1C (predicted), which is shown in Fig. 5. Theoptimum deviation between measured and predicted storagetank temperatures differed no more than 0.75 1C, and there wasno apparent bias between the predicted and the measured storagetank temperatures (Fig. 5). It can be seen that the simulationresults matched well with the measured data (Fig. 5). The RMSE1,
b) air temperature, (c) wind speed, (d) relative humidity.
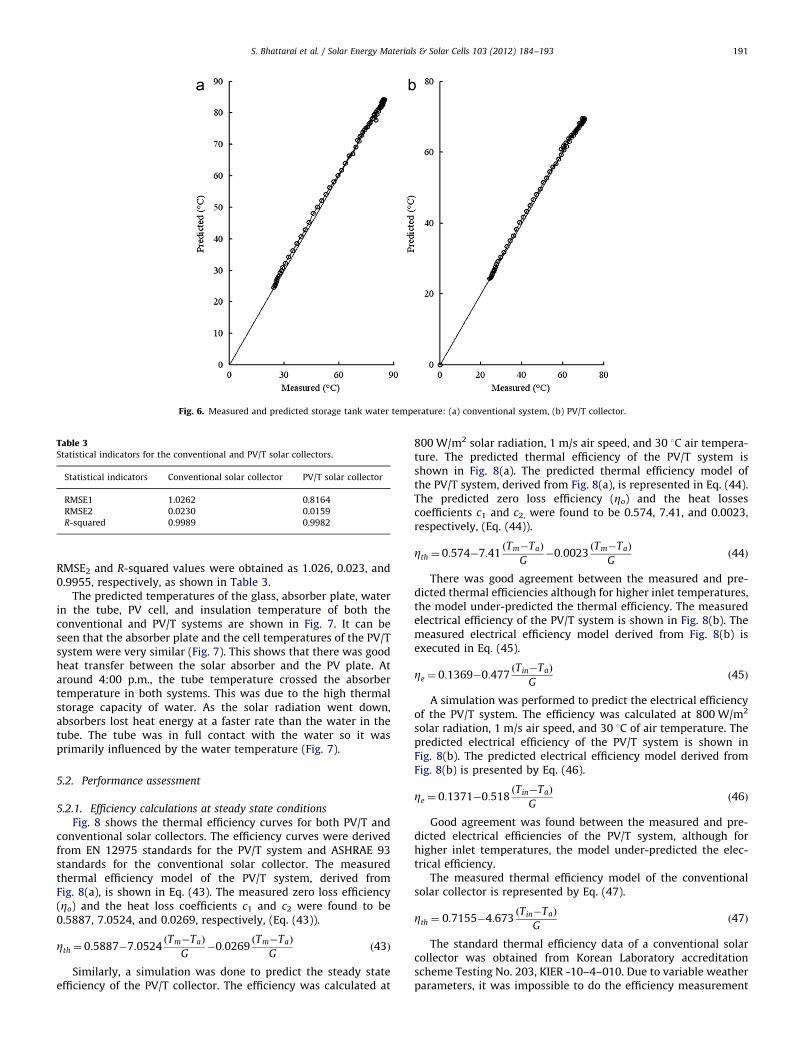
Fig. 6. Measured and predicted storage tank water temperature: (a) conventional system, (b) PV/T collector.
Table 3Statistical indicators for the conventional and PV/T solar collectors.
Statistical indicators Conventional solar collector PV/T solar collector
RMSE1 1.0262 0.8164
RMSE2 0.0230 0.0159
R-squared 0.9989 0.9982
S. Bhattarai et al. / Solar Energy Materials & Solar Cells 103 (2012) 184–193 191
RMSE2 and R-squared values were obtained as 1.026, 0.023, and0.9955, respectively, as shown in Table 3.
The predicted temperatures of the glass, absorber plate, waterin the tube, PV cell, and insulation temperature of both theconventional and PV/T systems are shown in Fig. 7. It can beseen that the absorber plate and the cell temperatures of the PV/Tsystem were very similar (Fig. 7). This shows that there was goodheat transfer between the solar absorber and the PV plate. Ataround 4:00 p.m., the tube temperature crossed the absorbertemperature in both systems. This was due to the high thermalstorage capacity of water. As the solar radiation went down,absorbers lost heat energy at a faster rate than the water in thetube. The tube was in full contact with the water so it wasprimarily influenced by the water temperature (Fig. 7).
5.2. Performance assessment
5.2.1. Efficiency calculations at steady state conditions
Fig. 8 shows the thermal efficiency curves for both PV/T andconventional solar collectors. The efficiency curves were derivedfrom EN 12975 standards for the PV/T system and ASHRAE 93standards for the conventional solar collector. The measuredthermal efficiency model of the PV/T system, derived fromFig. 8(a), is shown in Eq. (43). The measured zero loss efficiency(Zo) and the heat loss coefficients c1 and c2 were found to be0.5887, 7.0524, and 0.0269, respectively, (Eq. (43)).
Zth ¼ 0:5887�7:0524ðTm�TaÞ
G�0:0269
ðTm�TaÞ
Gð43Þ
Similarly, a simulation was done to predict the steady stateefficiency of the PV/T collector. The efficiency was calculated at
800 W/m2 solar radiation, 1 m/s air speed, and 30 1C air tempera-ture. The predicted thermal efficiency of the PV/T system isshown in Fig. 8(a). The predicted thermal efficiency model ofthe PV/T system, derived from Fig. 8(a), is represented in Eq. (44).The predicted zero loss efficiency (Zo) and the heat lossescoefficients c1 and c2, were found to be 0.574, 7.41, and 0.0023,respectively, (Eq. (44)).
Zth ¼ 0:574�7:41ðTm�TaÞ
G�0:0023
ðTm�TaÞ
Gð44Þ
There was good agreement between the measured and pre-dicted thermal efficiencies although for higher inlet temperatures,the model under-predicted the thermal efficiency. The measuredelectrical efficiency of the PV/T system is shown in Fig. 8(b). Themeasured electrical efficiency model derived from Fig. 8(b) isexecuted in Eq. (45).
Ze ¼ 0:1369�0:477ðTin�TaÞ
Gð45Þ
A simulation was performed to predict the electrical efficiencyof the PV/T system. The efficiency was calculated at 800 W/m2
solar radiation, 1 m/s air speed, and 30 1C of air temperature. Thepredicted electrical efficiency of the PV/T system is shown inFig. 8(b). The predicted electrical efficiency model derived fromFig. 8(b) is presented by Eq. (46).
Ze ¼ 0:1371�0:518ðTin�TaÞ
Gð46Þ
Good agreement was found between the measured and pre-dicted electrical efficiencies of the PV/T system, although forhigher inlet temperatures, the model under-predicted the elec-trical efficiency.
The measured thermal efficiency model of the conventionalsolar collector is represented by Eq. (47).
Zth ¼ 0:7155�4:673ðTin�TaÞ
Gð47Þ
The standard thermal efficiency data of a conventional solarcollector was obtained from Korean Laboratory accreditationscheme Testing No. 203, KIER -10–4–010. Due to variable weatherparameters, it was impossible to do the efficiency measurement
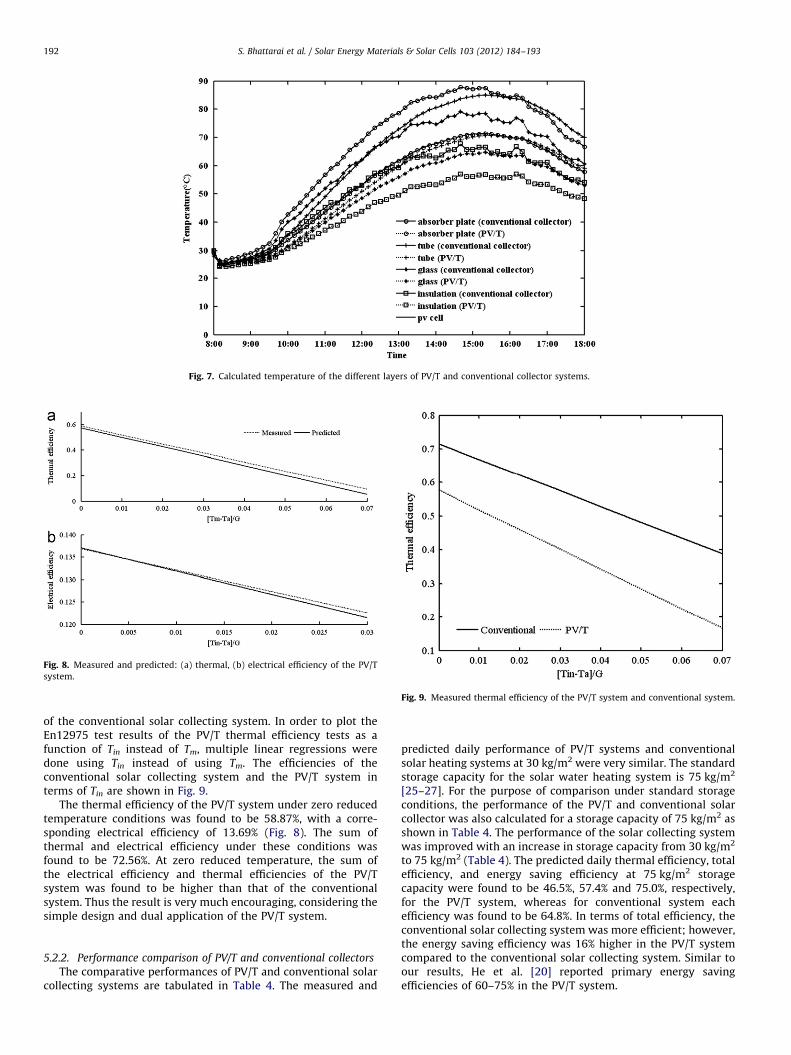
Fig. 8. Measured and predicted: (a) thermal, (b) electrical efficiency of the PV/T
system.
Fig. 9. Measured thermal efficiency of the PV/T system and conventional system.
Fig. 7. Calculated temperature of the different layers of PV/T and conventional collector systems.
S. Bhattarai et al. / Solar Energy Materials & Solar Cells 103 (2012) 184–193192
of the conventional solar collecting system. In order to plot theEn12975 test results of the PV/T thermal efficiency tests as afunction of Tin instead of Tm, multiple linear regressions weredone using Tin instead of using Tm. The efficiencies of theconventional solar collecting system and the PV/T system interms of Tin are shown in Fig. 9.
The thermal efficiency of the PV/T system under zero reducedtemperature conditions was found to be 58.87%, with a corre-sponding electrical efficiency of 13.69% (Fig. 8). The sum ofthermal and electrical efficiency under these conditions wasfound to be 72.56%. At zero reduced temperature, the sum ofthe electrical efficiency and thermal efficiencies of the PV/Tsystem was found to be higher than that of the conventionalsystem. Thus the result is very much encouraging, considering thesimple design and dual application of the PV/T system.
5.2.2. Performance comparison of PV/T and conventional collectors
The comparative performances of PV/T and conventional solarcollecting systems are tabulated in Table 4. The measured and
predicted daily performance of PV/T systems and conventionalsolar heating systems at 30 kg/m2 were very similar. The standardstorage capacity for the solar water heating system is 75 kg/m2
[25–27]. For the purpose of comparison under standard storageconditions, the performance of the PV/T and conventional solarcollector was also calculated for a storage capacity of 75 kg/m2 asshown in Table 4. The performance of the solar collecting systemwas improved with an increase in storage capacity from 30 kg/m2
to 75 kg/m2 (Table 4). The predicted daily thermal efficiency, totalefficiency, and energy saving efficiency at 75 kg/m2 storagecapacity were found to be 46.5%, 57.4% and 75.0%, respectively,for the PV/T system, whereas for conventional system eachefficiency was found to be 64.8%. In terms of total efficiency, theconventional solar collecting system was more efficient; however,the energy saving efficiency was 16% higher in the PV/T systemcompared to the conventional solar collecting system. Similar toour results, He et al. [20] reported primary energy savingefficiencies of 60–75% in the PV/T system.
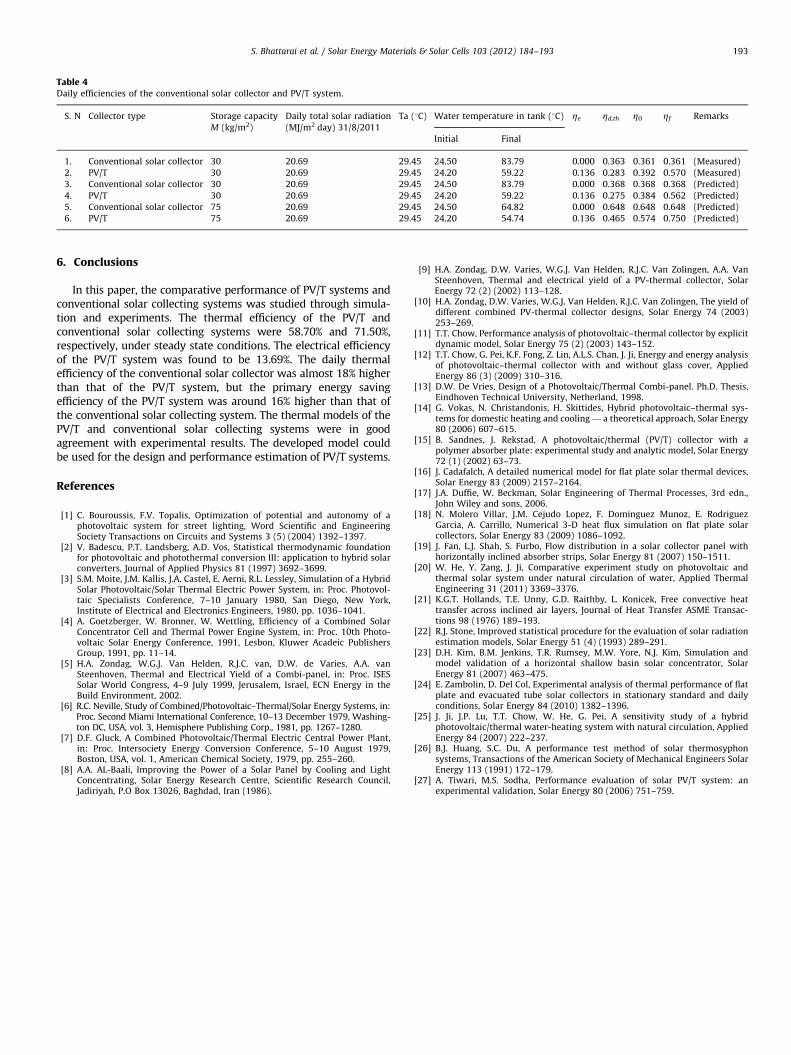
Table 4Daily efficiencies of the conventional solar collector and PV/T system.
S. N Collector type Storage capacity
M (kg/m2)
Daily total solar radiation
(MJ/m2 day) 31/8/2011
Ta (1C) Water temperature in tank (1C) Ze Zd,th Z0 Zf Remarks
Initial Final
1. Conventional solar collector 30 20.69 29.45 24.50 83.79 0.000 0.363 0.361 0.361 (Measured)
2. PV/T 30 20.69 29.45 24.20 59.22 0.136 0.283 0.392 0.570 (Measured)
3. Conventional solar collector 30 20.69 29.45 24.50 83.79 0.000 0.368 0.368 0.368 (Predicted)
4. PV/T 30 20.69 29.45 24.20 59.22 0.136 0.275 0.384 0.562 (Predicted)
5. Conventional solar collector 75 20.69 29.45 24.50 64.82 0.000 0.648 0.648 0.648 (Predicted)
6. PV/T 75 20.69 29.45 24.20 54.74 0.136 0.465 0.574 0.750 (Predicted)
S. Bhattarai et al. / Solar Energy Materials & Solar Cells 103 (2012) 184–193 193
6. Conclusions
In this paper, the comparative performance of PV/T systems andconventional solar collecting systems was studied through simula-tion and experiments. The thermal efficiency of the PV/T andconventional solar collecting systems were 58.70% and 71.50%,respectively, under steady state conditions. The electrical efficiencyof the PV/T system was found to be 13.69%. The daily thermalefficiency of the conventional solar collector was almost 18% higherthan that of the PV/T system, but the primary energy savingefficiency of the PV/T system was around 16% higher than that ofthe conventional solar collecting system. The thermal models of thePV/T and conventional solar collecting systems were in goodagreement with experimental results. The developed model couldbe used for the design and performance estimation of PV/T systems.
References
[1] C. Bouroussis, F.V. Topalis, Optimization of potential and autonomy of aphotovoltaic system for street lighting, Word Scientific and EngineeringSociety Transactions on Circuits and Systems 3 (5) (2004) 1392–1397.
[2] V. Badescu, P.T. Landsberg, A.D. Vos, Statistical thermodynamic foundationfor photovoltaic and photothermal conversion III: application to hybrid solarconverters, Journal of Applied Physics 81 (1997) 3692–3699.
[3] S.M. Moite, J.M. Kallis, J.A. Castel, E. Aerni, R.L. Lessley, Simulation of a HybridSolar Photovoltaic/Solar Thermal Electric Power System, in: Proc. Photovol-taic Specialists Conference, 7–10 January 1980, San Diego, New York,Institute of Electrical and Electronics Engineers, 1980, pp. 1036–1041.
[4] A. Goetzberger, W. Bronner, W. Wettling, Efficiency of a Combined SolarConcentrator Cell and Thermal Power Engine System, in: Proc. 10th Photo-voltaic Solar Energy Conference, 1991, Lesbon, Kluwer Acadeic PublishersGroup, 1991, pp. 11–14.
[5] H.A. Zondag, W.G.J. Van Helden, R.J.C. van, D.W. de Varies, A.A. vanSteenhoven, Thermal and Electrical Yield of a Combi-panel, in: Proc. ISESSolar World Congress, 4–9 July 1999, Jerusalem, Israel, ECN Energy in theBuild Environment, 2002.
[6] R.C. Neville, Study of Combined/Photovoltaic–Thermal/Solar Energy Systems, in:Proc. Second Miami International Conference, 10–13 December 1979, Washing-ton DC, USA, vol. 3, Hemisphere Publishing Corp., 1981, pp. 1267–1280.
[7] D.F. Gluck, A Combined Photovoltaic/Thermal Electric Central Power Plant,in: Proc. Intersociety Energy Conversion Conference, 5–10 August 1979,Boston, USA, vol. 1, American Chemical Society, 1979, pp. 255–260.
[8] A.A. AL-Baali, Improving the Power of a Solar Panel by Cooling and LightConcentrating, Solar Energy Research Centre, Scientific Research Council,Jadiriyah, P.O Box 13026, Baghdad, Iran (1986).
[9] H.A. Zondag, D.W. Varies, W.G.J. Van Helden, R.J.C. Van Zolingen, A.A. VanSteenhoven, Thermal and electrical yield of a PV-thermal collector, SolarEnergy 72 (2) (2002) 113–128.
[10] H.A. Zondag, D.W. Varies, W.G.J. Van Helden, R.J.C. Van Zolingen, The yield ofdifferent combined PV-thermal collector designs, Solar Energy 74 (2003)253–269.
[11] T.T. Chow, Performance analysis of photovoltaic–thermal collector by explicitdynamic model, Solar Energy 75 (2) (2003) 143–152.
[12] T.T. Chow, G. Pei, K.F. Fong, Z. Lin, A.L.S. Chan, J. Ji, Energy and energy analysisof photovoltaic–thermal collector with and without glass cover, AppliedEnergy 86 (3) (2009) 310–316.
[13] D.W. De Vries, Design of a Photovoltaic/Thermal Combi-panel. Ph.D. Thesis,Eindhoven Technical University, Netherland, 1998.
[14] G. Vokas, N. Christandonis, H. Skittides, Hybrid photovoltaic–thermal sys-tems for domestic heating and cooling — a theoretical approach, Solar Energy80 (2006) 607–615.
[15] B. Sandnes, J. Rekstad, A photovoltaic/thermal (PV/T) collector with apolymer absorber plate: experimental study and analytic model, Solar Energy72 (1) (2002) 63–73.
[16] J. Cadafalch, A detailed numerical model for flat plate solar thermal devices,Solar Energy 83 (2009) 2157–2164.
[17] J.A. Duffie, W. Beckman, Solar Engineering of Thermal Processes, 3rd edn.,John Wiley and sons, 2006.
[18] N. Molero Villar, J.M. Cejudo Lopez, F. Dominguez Munoz, E. RodriguezGarcia, A. Carrillo, Numerical 3-D heat flux simulation on flat plate solarcollectors, Solar Energy 83 (2009) 1086–1092.
[19] J. Fan, L.J. Shah, S. Furbo, Flow distribution in a solar collector panel withhorizontally inclined absorber strips, Solar Energy 81 (2007) 150–1511.
[20] W. He, Y. Zang, J. Ji, Comparative experiment study on photovoltaic andthermal solar system under natural circulation of water, Applied ThermalEngineering 31 (2011) 3369–3376.
[21] K.G.T. Hollands, T.E. Unny, G.D. Raithby, L. Konicek, Free convective heattransfer across inclined air layers, Journal of Heat Transfer ASME Transac-tions 98 (1976) 189–193.
[22] R.J. Stone, Improved statistical procedure for the evaluation of solar radiationestimation models, Solar Energy 51 (4) (1993) 289–291.
[23] D.H. Kim, B.M. Jenkins, T.R. Rumsey, M.W. Yore, N.J. Kim, Simulation andmodel validation of a horizontal shallow basin solar concentrator, SolarEnergy 81 (2007) 463–475.
[24] E. Zambolin, D. Del Col, Experimental analysis of thermal performance of flatplate and evacuated tube solar collectors in stationary standard and dailyconditions, Solar Energy 84 (2010) 1382–1396.
[25] J. Ji, J.P. Lu, T.T. Chow, W. He, G. Pei, A sensitivity study of a hybridphotovoltaic/thermal water-heating system with natural circulation, AppliedEnergy 84 (2007) 222–237.
[26] B.J. Huang, S.C. Du, A performance test method of solar thermosyphonsystems, Transactions of the American Society of Mechanical Engineers SolarEnergy 113 (1991) 172–179.
[27] A. Tiwari, M.S. Sodha, Performance evaluation of solar PV/T system: anexperimental validation, Solar Energy 80 (2006) 751–759.
Related Documents