Ecological Modelling 170 (2003) 29–43 Simulating biophysical and human factors that affect detection probability of cattle-fever ticks (Boophilus spp.) in semi-arid thornshrublands of South Texas P.D. Teel a,∗ , M.S. Corson b , W.E. Grant c , M.T. Longnecker d a Department of Entomology, Texas A&M University, College Station, TX 77843-2475, USA b USDA Agricultural Research Service, Pasture Systems and Watershed Management Research Unit, Building 3702, Curtin Road, University Park, PA 16802-3702, USA c Department of Wildlife & Fisheries Sciences, Texas A&M University, College Station, TX 77843-2258, USA d Department of Statistics, Texas A&M University, College Station, TX 77843-3143, USA Received 8 February 2002; received in revised form 7 May 2003; accepted 28 May 2003 Abstract We modified an existing simulation model to evaluate detection of cattle-fever ticks (Boophilus annulatus and Boophilus microplus) infesting rangeland in the semi-arid thornshrublands of south Texas. This model contained submodels represent- ing (1) tick development in a pasture and (2) tick development on one cow; we added a third submodel that calculated the probability of tick detection on a herd of cattle by human inspectors. This detection submodel randomly distributed ticks to each cow in the herd from a normal distribution with a mean equal to the number of ticks of detectable size predicted by the submodel of tick development on one cow. We controlled biophysical factors such as habitat type, starting season, number of ticks initially infesting the system, number of cows examined, and a human factor, ability of inspectors to detect ticks on individual cows. We simulated all combinations of factors to estimate their combined effect on the probability of detection over a 2-year period under continuous grazing. Results showed the predominant influence of biophysical factors: season of initiation had the largest influence on tick populations (and hence, subsequent detection probabilities), followed by habitat type and level of initial tick infestation. Detectable populations of ticks occurred in fall-initiated simulations in grass only at infestations beginning with ≥250 larvae per animal, while in mesquite detectable populations occurred with initial infestations ≥50 larvae per animal. In contrast, detectable populations occurred in spring-initiated simulations initiated with as few as 10 larvae per animal in both grass- and mesquite-dominated pastures. Mean percentage of potential detection days in which sim- ulated inspectors successfully detected ticks ranged from 0 to 99.9% depending on the number of animals inspected and level of detection probability evaluated. The distribution of days in which ticks remained detectable varied with the dynamics of each combination of factors and illustrated that opportunities for detection are not evenly distributed in time. Variation of the human factor, the curve used to estimate ability of inspectors to detect ticks on individual cows, suggest that human detec- tion abilities usually have a relatively minor influence on detection probabilities. Human detection ability, however, becomes more important when on-host tick populations reach low levels or when few cattle are inspected. At these times, increased detection abilities yield windows of detection that otherwise would not exist. These simulations provide the first analysis of tick ∗ Corresponding author. Tel.: +1-979-845-3253; fax: +1-979-845-6305. E-mail address: [email protected] (P.D. Teel). 0304-3800/$ – see front matter © 2003 Elsevier B.V. All rights reserved. doi:10.1016/j.ecolmodel.2003.05.002

Welcome message from author
This document is posted to help you gain knowledge. Please leave a comment to let me know what you think about it! Share it to your friends and learn new things together.
Transcript
Ecological Modelling 170 (2003) 29–43
Simulating biophysical and human factors that affect detectionprobability of cattle-fever ticks (Boophilus spp.) in
semi-arid thornshrublands of South Texas
P.D. Teela,∗, M.S. Corsonb, W.E. Grantc, M.T. Longneckerda Department of Entomology, Texas A&M University, College Station, TX 77843-2475, USA
b USDA Agricultural Research Service, Pasture Systems and Watershed Management Research Unit,Building 3702, Curtin Road, University Park, PA 16802-3702, USA
c Department of Wildlife & Fisheries Sciences, Texas A&M University, College Station, TX 77843-2258, USAd Department of Statistics, Texas A&M University, College Station, TX 77843-3143, USA
Received 8 February 2002; received in revised form 7 May 2003; accepted 28 May 2003
Abstract
We modified an existing simulation model to evaluate detection of cattle-fever ticks (Boophilus annulatus andBoophilusmicroplus) infesting rangeland in the semi-arid thornshrublands of south Texas. This model contained submodels represent-ing (1) tick development in a pasture and (2) tick development on one cow; we added a third submodel that calculated theprobability of tick detection on a herd of cattle by human inspectors. This detection submodel randomly distributed ticks toeach cow in the herd from a normal distribution with a mean equal to the number of ticks of detectable size predicted by thesubmodel of tick development on one cow. We controlled biophysical factors such as habitat type, starting season, numberof ticks initially infesting the system, number of cows examined, and a human factor, ability of inspectors to detect ticks onindividual cows. We simulated all combinations of factors to estimate their combined effect on the probability of detectionover a 2-year period under continuous grazing. Results showed the predominant influence of biophysical factors: season ofinitiation had the largest influence on tick populations (and hence, subsequent detection probabilities), followed by habitattype and level of initial tick infestation. Detectable populations of ticks occurred in fall-initiated simulations in grass only atinfestations beginning with≥250 larvae per animal, while in mesquite detectable populations occurred with initial infestations≥50 larvae per animal. In contrast, detectable populations occurred in spring-initiated simulations initiated with as few as 10larvae per animal in both grass- and mesquite-dominated pastures. Mean percentage of potential detection days in which sim-ulated inspectors successfully detected ticks ranged from 0 to 99.9% depending on the number of animals inspected and levelof detection probability evaluated. The distribution of days in which ticks remained detectable varied with the dynamics ofeach combination of factors and illustrated that opportunities for detection are not evenly distributed in time. Variation of thehuman factor, the curve used to estimate ability of inspectors to detect ticks on individual cows, suggest that human detec-tion abilities usually have a relatively minor influence on detection probabilities. Human detection ability, however, becomesmore important when on-host tick populations reach low levels or when few cattle are inspected. At these times, increaseddetection abilities yield windows of detection that otherwise would not exist. These simulations provide the first analysis of tick
∗ Corresponding author. Tel.:+1-979-845-3253; fax:+1-979-845-6305.E-mail address: [email protected] (P.D. Teel).
0304-3800/$ – see front matter © 2003 Elsevier B.V. All rights reserved.doi:10.1016/j.ecolmodel.2003.05.002
30 P.D. Teel et al. / Ecological Modelling 170 (2003) 29–43
detection in scenarios under U.S. conditions, and results confirm the concerns regulatory agencies express regarding earlydetection of cattle-fever ticks.© 2003 Elsevier B.V. All rights reserved.
Keywords: Boophilus microplus; Boophilus annulatus; Cattle-fever ticks; Cattle inspection; Detection probability; Simulation modeling
1. Introduction
Today, researchers use increasingly detailed eco-logical models to address a variety of questions inecology, natural resource management, and environ-mental health (see reviews inJørgensen et al., 1995;Jørgensen, 1997) and often give much attention todealing with uncertainty in estimation of biophysi-cal parameters (e.g.Spear et al., 1994; Spear, 1997).Scientists strive to integrate human factors explicitlywithin ecological models, as a recent special issue ofEcological Modelling (vol. 140, issues 1/2) revealed;however, the level of uncertainty regarding quanti-tative representation of human factors remains rela-tively high. While the merit of attempting to representhuman decision-making processes explicitly withinecological models perhaps remains controversial, dif-ferences in the level of uncertainty associated withsocial versus biophysical processes raises interestingquestions regarding the role of detailed biophysicalmodels within management contexts. For example,a valid criticism of our own work on simulationof host–parasite–landscape interactions (Teel et al.,1996, 1997, 1998), undertaken to aid in the controlof tick infestations on cattle, states that our modeldoes not consider explicitly the uncertainty associatedwith human detection of ticks on cows. Obviously,if inherent variability in the probability of detectionremains too high, our model has little practical use,regardless of the confidence with which we can simu-late the important ecological processes. Consequently,we have focused recent work on the evaluation ofdetection probabilities of tick infestations influencednot only by temporal dynamics of tick abundance,but by explicit variation in the ability of inspectorsto detect ticks on individual cows. In this paper, weadapt a simulation model developed to study thepopulation dynamics of cattle-fever ticks (Teel et al.,1996, 1997, 1998) to provide an appropriate referencefrom which to determine how different ecologicaland grazing-management strategies affect probabil-
ities of detecting cattle-fever ticks in the semi-aridthornshrublands of south Texas. More specifically,we (1) describe addition of a new submodel repre-senting the probability of detecting ticks; (2) evaluatethe sensitivity of model predictions to changes inthe representation of an important biophysical factor(host-tick encounter rate) and an important humanfactor (ability of inspectors to detect ticks), and (3)simulate the probability of detecting a tick infestationunder various combinations of habitat type, seasonand size of initial infestation, number of cows ex-amined, and relative human abilities under differentworking conditions.
2. Background of the problem
Cattle-fever ticks (Boophilus annulatus andBoophilus microplus) and bovine babesiosis remainendemic in Mexico and constitute a continuous threatof reintroductions of ticks and disease to cattle andrangelands in the United States (Teclaw et al., 1985).The South-Texas Northeastern-Mexico region com-prises the semi-arid thornshrublands of the Tamauli-pan biotic province. The state-federal program thathelped eliminateBoophilus ticks from the U.S. re-mains vigil in monitoring animal movement and con-ducting animal inspections (Graham and Hourrigan,1977). Periodically, authorities implement quarantineand eradication procedures to eliminate infestationsthat appear on Texas cattle and rangeland. Devel-opment of acaricide resistance inBoophilus ticks inMexico has heightened U.S. concerns about potentialintroductions of resistant ticks (Miller et al., 1999).
Inspection of individual animals for cattle-feverticks by regulatory inspectors serves as the princi-pal means of determining the infestation status ofcattle and rangeland (Graham and Hourrigan, 1977).Inspectors are trained to know the preferred tick at-tachment sites, how these sites may change with thedensity of infestation, and how to safely inspect ani-
P.D. Teel et al. / Ecological Modelling 170 (2003) 29–43 31
mals. Inspectors may inspect cattle in a squeeze chute,alleyway, or other confinement situation, which al-lows inspection of different body areas. Detection ofa singleBoophilus tick gives enough cause to declarea premise infested. No reliable methods for samplingcattle-fever ticks on the ground or vegetation exist,in part because only the larvae of this one-host tickseek hosts and because size, topography, and otherfeatures of pastures make such approaches impracti-cal. The importance of detecting cattle-fever ticks liesnot only in initial discovery of an infestation but alsoin monitoring the progress of eradication procedures(i.e. systematic dipping or pasture vacation). Manyphysical, biological, ecological, and managerial fac-tors may affect the efficiency and accuracy of animalinspections for ticks.
The probability of detecting cattle ticks by individ-ual animal inspection depends primarily on the sizeand distribution of the population in one or more pas-tures, the subsequent number of ticks (population sub-set) picked up on the animals, the distribution of theticks among the animals, the mortality of ticks on theanimals, the size of ticks at the time of inspection, andthe number of animals randomly inspected from theherd (Palmer et al., 1976). Ecological factors affectwhether a tick population will become established, aswell as the subsequent dynamics of that population(Teel et al., 1996). These include factors such as dateof tick introduction, seasonal dynamics of temperatureand rainfall, vegetation type(s) present, type of graz-ing system, cattle breed, and host density.
3. Model description
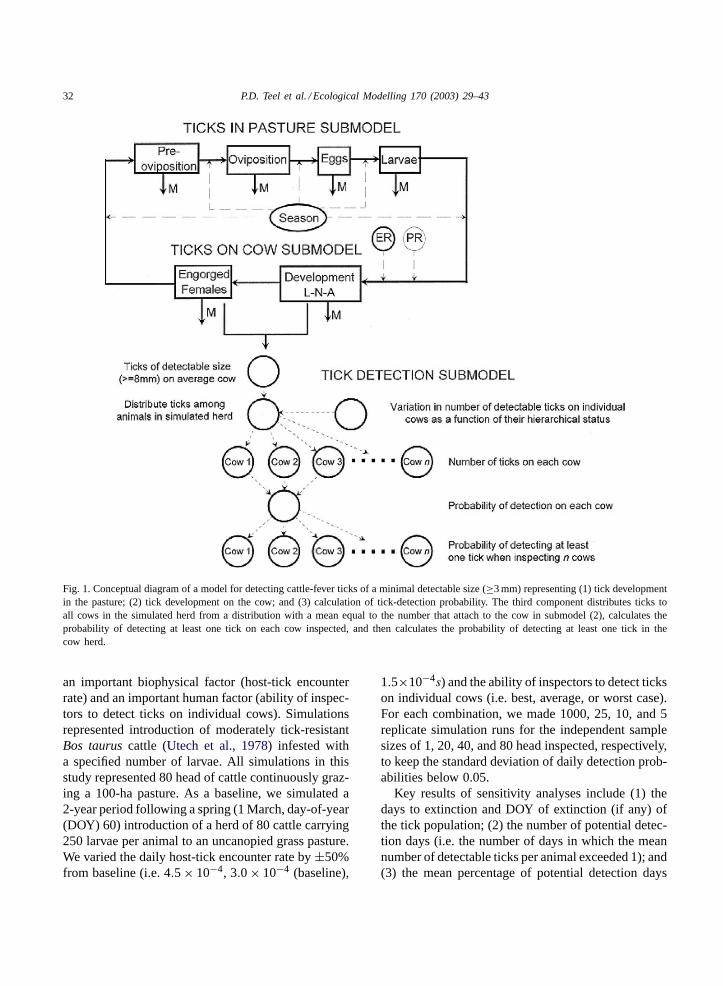
We adapted the model ofTeel et al. (1996), whichruns on a daily time-step and includes submodels rep-resenting (1) tick development in a pasture and (2) tickdevelopment on a cow, by adding a third submodelcalculating the probability of detecting ticks (Fig. 1).Tick mortality during the off-host phase of the lifecycle (i.e. engorged females, eggs, larvae) variesmonthly to reflect the seasonal impact of weather(Teel et al., 1996). In multi-year simulations the modelrepeats these monthly mortality rates each year.
The detection submodel distributes ticks thatreach the 16th day of development on cattle; theseticks measure approximately 3 mm (Roberts, 1968).
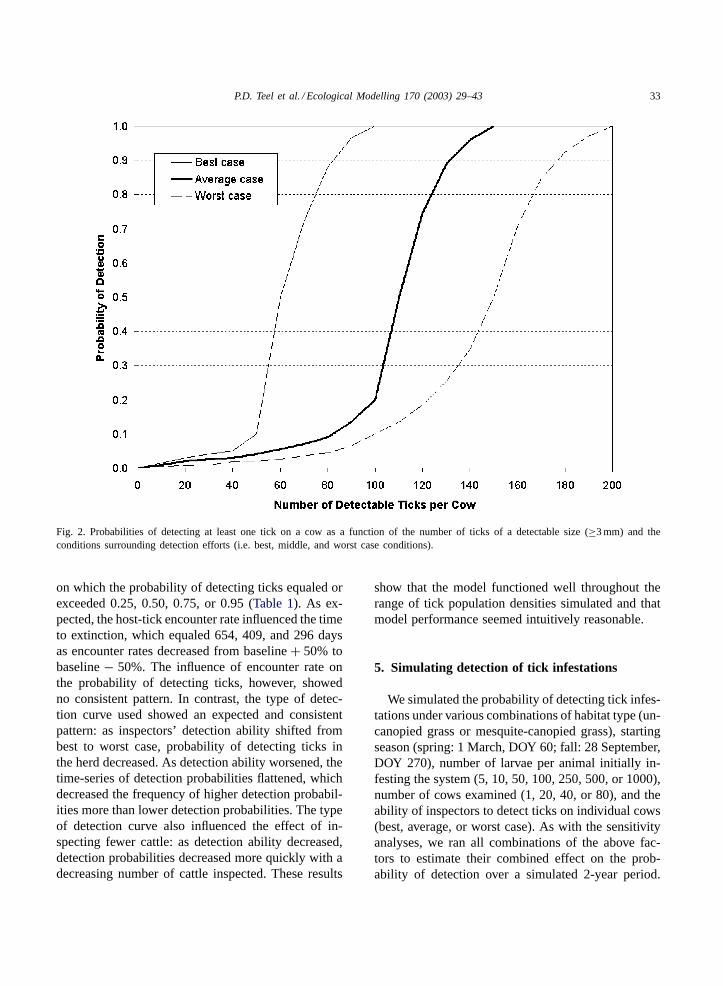
Trained human inspectors physically examining theskin of cattle for ticks can detect ticks reaching thissize (Wharton and Utech, 1970; Palmer et al., 1976).More than 90% of ticks in this age class have moltedto adults; female ticks subsequently begin droppingfrom hosts by day 19 (Hitchcock, 1955). The detec-tion submodel randomly assigns a number of ticks toeach cow in the herd-based on a normal distributionwith a mean equal to the number of ticks of detectablesize on the “average” cow in submodel (1). We cal-culated the standard error (0.396) using data of thenumber ofB. microplus found on cows in the middleof herd hierarchy (Aguilar and Solis, 1984). A hypo-thetical sigmoidal detection curve (Fig. 2) estimatesthe probability of detecting ticks on each cow in 5 to10 s physical and visual inspection by two inspectors(Palmer et al., 1976) as the number of ticks of a de-tectable size increases. The detection curve is basedupon “expert opinion” (P.D. Teel) and, as illustrated,can change shape depending on factors such as typeof facilities for handling cattle, weather conditions,cow behavior, and experience and attentiveness ofinspectors (Palmer et al., 1976).
The model calculates the probability of detectionticks on theith cow on thejth day as follows:
Pi(detection|number of ticks) = Pi(nij),
wherenij is the number of ticks for theith cow, jthday.
The detection submodel then calculates the proba-bility of detecting at least one tick on at least one oftheN cows examined on thejth day:
P(at least one ofN cows has ticks detected)
= 1 − P(none ofN cows has ticks detected)
= 1 −N∏
i=1
(1 − P(nij)),
whereN is the number of cows examined.We constructed the model using STELLA® and
QuickBASIC® 4.5 software on a personal computer.
4. Model sensitivity to changes in representationof biophysical and human factors
We conducted sensitivity analyses to evaluate therelative influence on model predictions of changes in
32 P.D. Teel et al. / Ecological Modelling 170 (2003) 29–43
Fig. 1. Conceptual diagram of a model for detecting cattle-fever ticks of a minimal detectable size (≥3 mm) representing (1) tick developmentin the pasture; (2) tick development on the cow; and (3) calculation of tick-detection probability. The third component distributes ticks toall cows in the simulated herd from a distribution with a mean equal to the number that attach to the cow in submodel (2), calculates theprobability of detecting at least one tick on each cow inspected, and then calculates the probability of detecting at least one tick in thecow herd.
an important biophysical factor (host-tick encounterrate) and an important human factor (ability of inspec-tors to detect ticks on individual cows). Simulationsrepresented introduction of moderately tick-resistantBos taurus cattle (Utech et al., 1978) infested witha specified number of larvae. All simulations in thisstudy represented 80 head of cattle continuously graz-ing a 100-ha pasture. As a baseline, we simulated a2-year period following a spring (1 March, day-of-year(DOY) 60) introduction of a herd of 80 cattle carrying250 larvae per animal to an uncanopied grass pasture.We varied the daily host-tick encounter rate by±50%from baseline (i.e. 4.5× 10⁻⁴, 3.0× 10⁻⁴ (baseline),
1.5×10⁻⁴s) and the ability of inspectors to detect tickson individual cows (i.e. best, average, or worst case).For each combination, we made 1000, 25, 10, and 5replicate simulation runs for the independent samplesizes of 1, 20, 40, and 80 head inspected, respectively,to keep the standard deviation of daily detection prob-abilities below 0.05.
Key results of sensitivity analyses include (1) thedays to extinction and DOY of extinction (if any) ofthe tick population; (2) the number of potential detec-tion days (i.e. the number of days in which the meannumber of detectable ticks per animal exceeded 1); and(3) the mean percentage of potential detection days
P.D. Teel et al. / Ecological Modelling 170 (2003) 29–43 33
Fig. 2. Probabilities of detecting at least one tick on a cow as a function of the number of ticks of a detectable size (≥3 mm) and theconditions surrounding detection efforts (i.e. best, middle, and worst case conditions).
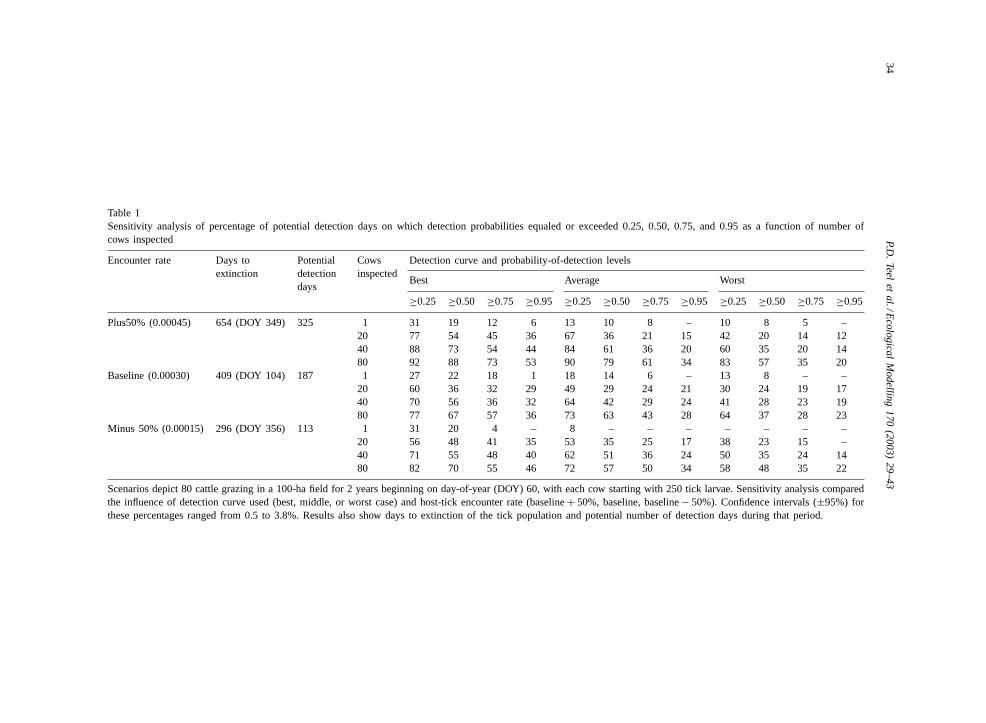
on which the probability of detecting ticks equaled orexceeded 0.25, 0.50, 0.75, or 0.95 (Table 1). As ex-pected, the host-tick encounter rate influenced the timeto extinction, which equaled 654, 409, and 296 daysas encounter rates decreased from baseline+ 50% tobaseline− 50%. The influence of encounter rate onthe probability of detecting ticks, however, showedno consistent pattern. In contrast, the type of detec-tion curve used showed an expected and consistentpattern: as inspectors’ detection ability shifted frombest to worst case, probability of detecting ticks inthe herd decreased. As detection ability worsened, thetime-series of detection probabilities flattened, whichdecreased the frequency of higher detection probabil-ities more than lower detection probabilities. The typeof detection curve also influenced the effect of in-specting fewer cattle: as detection ability decreased,detection probabilities decreased more quickly with adecreasing number of cattle inspected. These results
show that the model functioned well throughout therange of tick population densities simulated and thatmodel performance seemed intuitively reasonable.
5. Simulating detection of tick infestations
We simulated the probability of detecting tick infes-tations under various combinations of habitat type (un-canopied grass or mesquite-canopied grass), startingseason (spring: 1 March, DOY 60; fall: 28 September,DOY 270), number of larvae per animal initially in-festing the system (5, 10, 50, 100, 250, 500, or 1000),number of cows examined (1, 20, 40, or 80), and theability of inspectors to detect ticks on individual cows(best, average, or worst case). As with the sensitivityanalyses, we ran all combinations of the above fac-tors to estimate their combined effect on the prob-ability of detection over a simulated 2-year period.
34P.D
.Teel
etal./E
cologicalM
odelling170
(2003)29–43
Table 1Sensitivity analysis of percentage of potential detection days on which detection probabilities equaled or exceeded 0.25, 0.50, 0.75, and 0.95 as a function of number ofcows inspected
Encounter rate Days toextinction
Potentialdetectiondays
Cowsinspected
Detection curve and probability-of-detection levels
Best Average Worst
≥0.25 ≥0.50 ≥0.75 ≥0.95 ≥0.25 ≥0.50 ≥0.75 ≥0.95 ≥0.25 ≥0.50 ≥0.75 ≥0.95
Plus50% (0.00045) 654 (DOY 349) 325 1 31 19 12 6 13 10 8 – 10 8 5 –20 77 54 45 36 67 36 21 15 42 20 14 1240 88 73 54 44 84 61 36 20 60 35 20 1480 92 88 73 53 90 79 61 34 83 57 35 20
Baseline (0.00030) 409 (DOY 104) 187 1 27 22 18 1 18 14 6 – 13 8 – –20 60 36 32 29 49 29 24 21 30 24 19 1740 70 56 36 32 64 42 29 24 41 28 23 1980 77 67 57 36 73 63 43 28 64 37 28 23
Minus 50% (0.00015) 296 (DOY 356) 113 1 31 20 4 – 8 – – – – – – –20 56 48 41 35 53 35 25 17 38 23 15 –40 71 55 48 40 62 51 36 24 50 35 24 1480 82 70 55 46 72 57 50 34 58 48 35 22
Scenarios depict 80 cattle grazing in a 100-ha field for 2 years beginning on day-of-year (DOY) 60, with each cow starting with 250 tick larvae. Sensitivity analysis comparedthe influence of detection curve used (best, middle, or worst case) and host-tick encounter rate (baseline+ 50%, baseline, baseline− 50%). Confidence intervals (±95%) forthese percentages ranged from 0.5 to 3.8%. Results also show days to extinction of the tick population and potential number of detection days during that period.
P.D. Teel et al. / Ecological Modelling 170 (2003) 29–43 35
We held host-tick encounter and tick pickup rates con-stant.
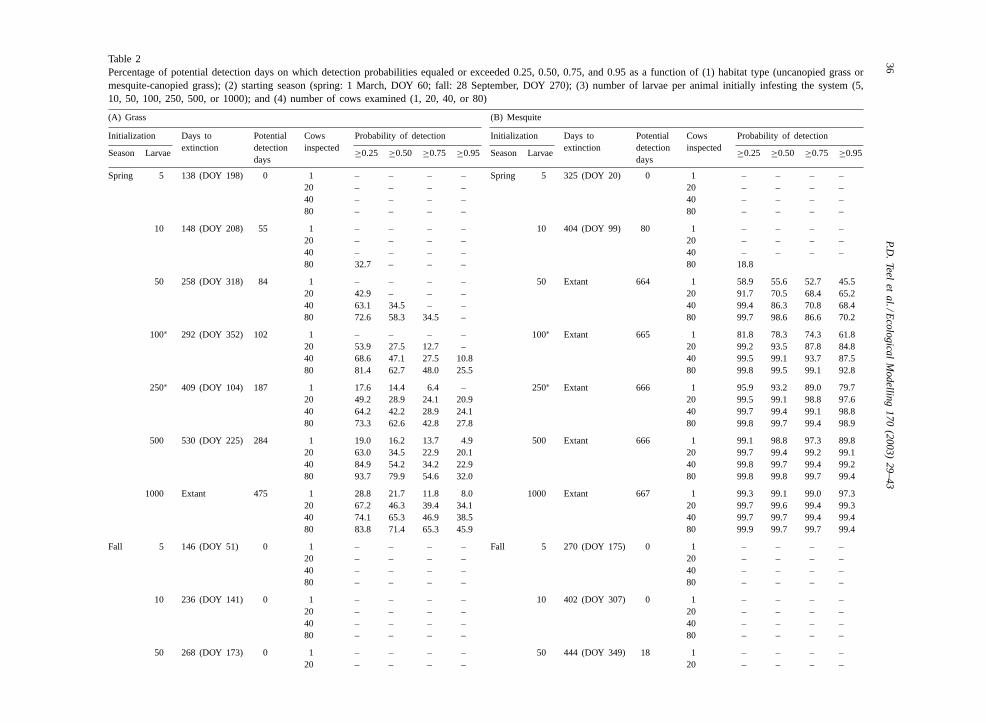
As for the sensitivity analysis, key results of modeluse include (1) the days to extinction and DOY ofextinction (if any) of the tick population; (2) thenumber of potential detection days; and (3) the meanpercentage of potential detection days on which theprobability of detecting ticks equaled or exceeded0.25, 0.50, 0.75, or 0.95 (Table 2, which shows re-sults only for the average-case detection curve). Forpastures dominated by uncanopied grass (Table 2A)or by mesquite-canopied grass (Table 2B), resultsshow that habitat, season of initiation, and level ofinitial tick infestation influenced both the mean per-centages of potential detection days and extinctiondates. Season of initiation had the largest influenceon tick populations (and hence, subsequent detec-tion probabilities), followed by habitat type and levelof initial tick infestation. Confidence intervals (notshown) for the percentage of potential detection daysranged from 0.8 to 6.0%.
Infestations initiated in the fall (DOY 270) in un-canopied grass habitats (Table 2A) survived progres-sively longer as the initial number of larvae on cattleincreased. While all of these infestations becameextinct, the three longest-lived infestations survived≥275 days; nonetheless, the number of potential de-tection days for these infestations did not exceed 30days. Simulated inspectors detected only the tick pop-ulation initiated with 1000 ticks per animal but onlywith a probability of 0.25 for 7 days.
Infestations initiated in spring (DOY 60) in un-canopied grass habitats (Table 2A) with ≥10 larvaeper animal resulted in populations that subsequentlycould be detected. Infestations initiated with morelarvae per animal yielded larger and longer-lived tickpopulations, thus increasing the number of potentialdetection days and tending to increase the percentageof potential detection days an infestation could be de-tected at each level of probability. Only the populationinitiated with 1000 larvae per animal remained extant,but the number of potential detection days did notexceed 475. Duration of tick detection at a given prob-ability decreased as the number of cows inspected de-creased. For example, at an initial infestation level of1000 larvae per animal, detection probabilities= 0.50decreased from 71.4 to 21.7% of potential detectiondays as number of cows inspected decreased from 80
to 1, respectively. Duration of detection for a givennumber of cattle inspected also decreased as desiredlevel of detection probability increased. For example,at an initial infestation level of 500 larvae per animalwith inspection of all 80 cows, detection probabili-ties ≥0.50 occurred on 79.9% of potential detectiondays, while detection probabilities≥0.95 occurred on32.0% of potential detection days. The rate of decreasein detection duration, however, showed no consistentpattern as the number of cows inspected decreased orthe desired level of detection probability increased.
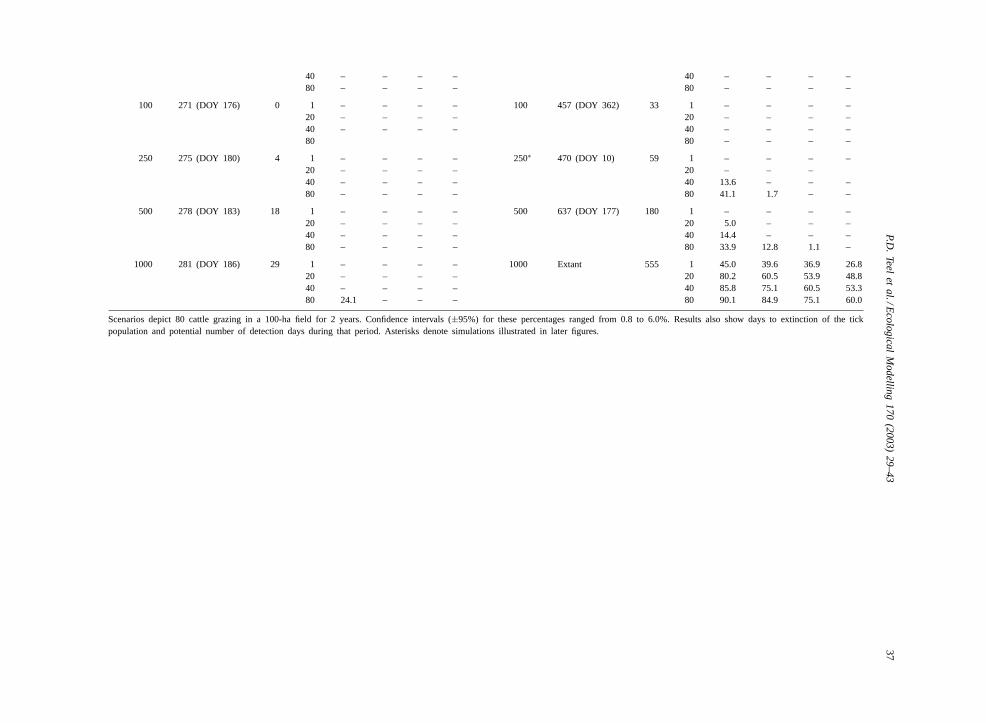
In contrast to spring-initiated infestations, fall-initiated infestations (DOY 270) in mesquite-canopiedgrass (Table 2B) produced populations of ticks thatsurvived at least 1.5 times as long as those initiated inuncanopied grass. Infestations initiated with 5 and 10larvae per animal survived 270 and 402 days, respec-tively, without having any potential detection days(i.e. >1 detectable larvae per average cow). Infesta-tions initiated with 50 and 100 larvae per animal sur-vived 444 and 457 days, respectively, but had only 18and 30 potential detection days, respectively; their de-tection probabilities never equaled or exceeded 0.25.Only those populations initiated with 250 larvae peranimal yielded detection probabilities≥0.25. Infes-tations initiated with 500 larvae per animal survived637 days but yielded detection probabilities≥0.75only when inspecting all 80 cows and only for 7 days.
Populations of ticks resulting from spring-initiatedinfestations (DOY 60) in mesquite-canopied grasssurvived more than twice as long as their counterpartsin uncanopied grass. Tick populations became po-tentially detectable in simulations initiated in springwith as few as 10 larvae per animal. Infestationsinitialized with 50 or more larvae per animal inmesquite-canopied grass (Table 2B) remained extantand remained potentially detectable for substantiallymore days than any other combination of initializationparameters. These infestations produced such largepopulations that detection probabilities≥0.95 wheninspecting only one cow occurred on 45.5–97.3% ofpotential detection days as number of initial larvaeper animal increased from 50 to 1000, respectively.
Periods in which tick detection was possible variedacross the simulations with the level of infestation,habitat type, season of initialization, and detectionability. Temporal dynamics associated with the prob-ability of detecting ticks on cattle and with larval
36P.D
.Teel
etal./E
cologicalM
odelling170
(2003)29–43
Table 2Percentage of potential detection days on which detection probabilities equaled or exceeded 0.25, 0.50, 0.75, and 0.95 as a function of (1) habitat type (uncanopied grass ormesquite-canopied grass); (2) starting season (spring: 1 March, DOY 60; fall: 28 September, DOY 270); (3) number of larvae per animal initially infesting the system (5,10, 50, 100, 250, 500, or 1000); and (4) number of cows examined (1, 20, 40, or 80)
(A) Grass (B) Mesquite
Initialization Days toextinction
Potentialdetectiondays
Cowsinspected
Probability of detection Initialization Days toextinction
Potentialdetectiondays
Cowsinspected
Probability of detection
Season Larvae ≥0.25 ≥0.50 ≥0.75 ≥0.95 Season Larvae ≥0.25 ≥0.50 ≥0.75 ≥0.95
Spring 5 138 (DOY 198) 0 1 – – – – Spring 5 325 (DOY 20) 0 1 – – – –20 – – – – 20 – – – –40 – – – – 40 – – – –80 – – – – 80 – – – –
10 148 (DOY 208) 55 1 – – – – 10 404 (DOY 99) 80 1 – – – –20 – – – – 20 – – – –40 – – – – 40 – – – –80 32.7 – – – 80 18.8
50 258 (DOY 318) 84 1 – – – – 50 Extant 664 1 58.9 55.6 52.7 45.520 42.9 – – – 20 91.7 70.5 68.4 65.240 63.1 34.5 – – 40 99.4 86.3 70.8 68.480 72.6 58.3 34.5 – 80 99.7 98.6 86.6 70.2
100∗ 292 (DOY 352) 102 1 – – – – 100∗ Extant 665 1 81.8 78.3 74.3 61.820 53.9 27.5 12.7 – 20 99.2 93.5 87.8 84.840 68.6 47.1 27.5 10.8 40 99.5 99.1 93.7 87.580 81.4 62.7 48.0 25.5 80 99.8 99.5 99.1 92.8
250∗ 409 (DOY 104) 187 1 17.6 14.4 6.4 – 250∗ Extant 666 1 95.9 93.2 89.0 79.720 49.2 28.9 24.1 20.9 20 99.5 99.1 98.8 97.640 64.2 42.2 28.9 24.1 40 99.7 99.4 99.1 98.880 73.3 62.6 42.8 27.8 80 99.8 99.7 99.4 98.9
500 530 (DOY 225) 284 1 19.0 16.2 13.7 4.9 500 Extant 666 1 99.1 98.8 97.3 89.820 63.0 34.5 22.9 20.1 20 99.7 99.4 99.2 99.140 84.9 54.2 34.2 22.9 40 99.8 99.7 99.4 99.280 93.7 79.9 54.6 32.0 80 99.8 99.8 99.7 99.4
1000 Extant 475 1 28.8 21.7 11.8 8.0 1000 Extant 667 1 99.3 99.1 99.0 97.320 67.2 46.3 39.4 34.1 20 99.7 99.6 99.4 99.340 74.1 65.3 46.9 38.5 40 99.7 99.7 99.4 99.480 83.8 71.4 65.3 45.9 80 99.9 99.7 99.7 99.4
Fall 5 146 (DOY 51) 0 1 – – – – Fall 5 270 (DOY 175) 0 1 – – – –20 – – – – 20 – – – –40 – – – – 40 – – – –80 – – – – 80 – – – –
10 236 (DOY 141) 0 1 – – – – 10 402 (DOY 307) 0 1 – – – –20 – – – – 20 – – – –40 – – – – 40 – – – –80 – – – – 80 – – – –
50 268 (DOY 173) 0 1 – – – – 50 444 (DOY 349) 18 1 – – – –20 – – – – 20 – – – –
P.D.
Teelet
al./Ecological
Modelling
170(2003)
29–4337
40 – – – – 40 – – – –80 – – – – 80 – – – –
100 271 (DOY 176) 0 1 – – – – 100 457 (DOY 362) 33 1 – – – –20 – – – – 20 – – – –40 – – – – 40 – – – –80 80 – – – –
250 275 (DOY 180) 4 1 – – – – 250∗ 470 (DOY 10) 59 1 – – – –20 – – – – 20 – – –40 – – – – 40 13.6 – – –80 – – – – 80 41.1 1.7 – –
500 278 (DOY 183) 18 1 – – – – 500 637 (DOY 177) 180 1 – – – –20 – – – – 20 5.0 – – –40 – – – – 40 14.4 – – –80 – – – – 80 33.9 12.8 1.1 –
1000 281 (DOY 186) 29 1 – – – – 1000 Extant 555 1 45.0 39.6 36.9 26.820 – – – – 20 80.2 60.5 53.9 48.840 – – – – 40 85.8 75.1 60.5 53.380 24.1 – – – 80 90.1 84.9 75.1 60.0
Scenarios depict 80 cattle grazing in a 100-ha field for 2 years. Confidence intervals (±95%) for these percentages ranged from 0.8 to 6.0%. Results also show days to extinction of the tickpopulation and potential number of detection days during that period. Asterisks denote simulations illustrated in later figures.
38 P.D. Teel et al. / Ecological Modelling 170 (2003) 29–43
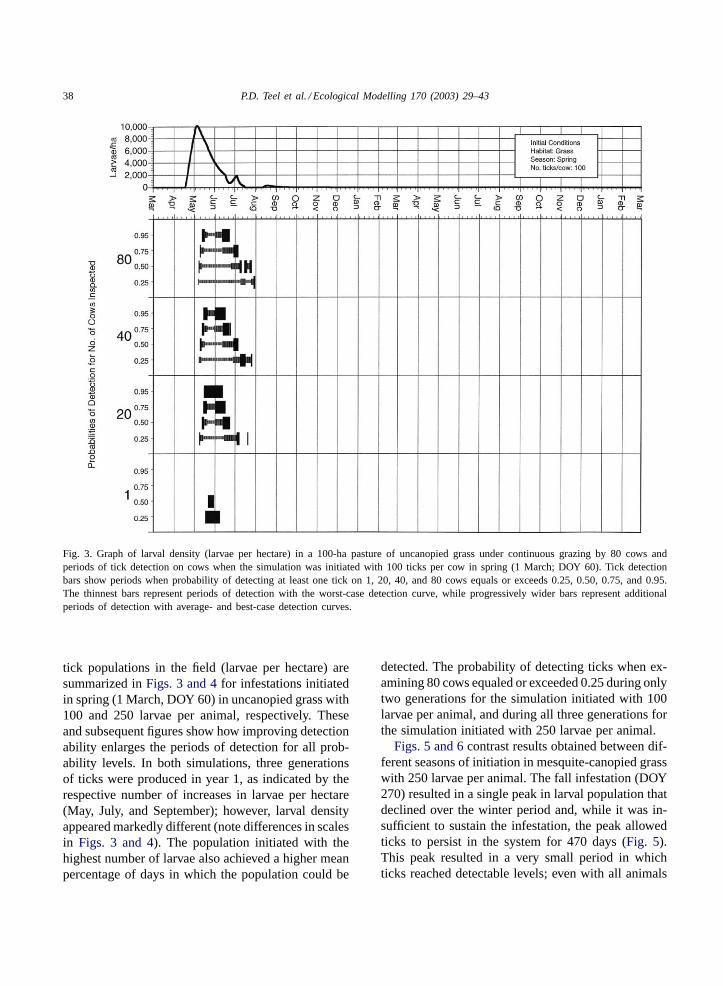
Fig. 3. Graph of larval density (larvae per hectare) in a 100-ha pasture of uncanopied grass under continuous grazing by 80 cows andperiods of tick detection on cows when the simulation was initiated with 100 ticks per cow in spring (1 March; DOY 60). Tick detectionbars show periods when probability of detecting at least one tick on 1, 20, 40, and 80 cows equals or exceeds 0.25, 0.50, 0.75, and 0.95.The thinnest bars represent periods of detection with the worst-case detection curve, while progressively wider bars represent additionalperiods of detection with average- and best-case detection curves.
tick populations in the field (larvae per hectare) aresummarized inFigs. 3 and 4for infestations initiatedin spring (1 March, DOY 60) in uncanopied grass with100 and 250 larvae per animal, respectively. Theseand subsequent figures show how improving detectionability enlarges the periods of detection for all prob-ability levels. In both simulations, three generationsof ticks were produced in year 1, as indicated by therespective number of increases in larvae per hectare(May, July, and September); however, larval densityappeared markedly different (note differences in scalesin Figs. 3 and 4). The population initiated with thehighest number of larvae also achieved a higher meanpercentage of days in which the population could be
detected. The probability of detecting ticks when ex-amining 80 cows equaled or exceeded 0.25 during onlytwo generations for the simulation initiated with 100larvae per animal, and during all three generations forthe simulation initiated with 250 larvae per animal.
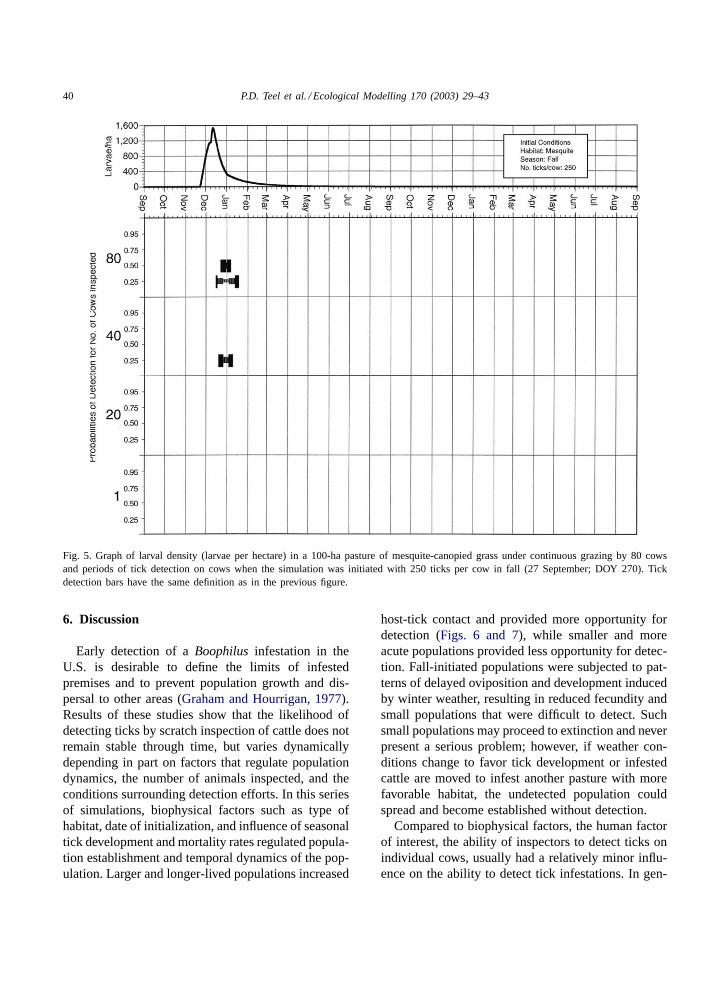
Figs. 5 and 6contrast results obtained between dif-ferent seasons of initiation in mesquite-canopied grasswith 250 larvae per animal. The fall infestation (DOY270) resulted in a single peak in larval population thatdeclined over the winter period and, while it was in-sufficient to sustain the infestation, the peak allowedticks to persist in the system for 470 days (Fig. 5).This peak resulted in a very small period in whichticks reached detectable levels; even with all animals
P.D. Teel et al. / Ecological Modelling 170 (2003) 29–43 39
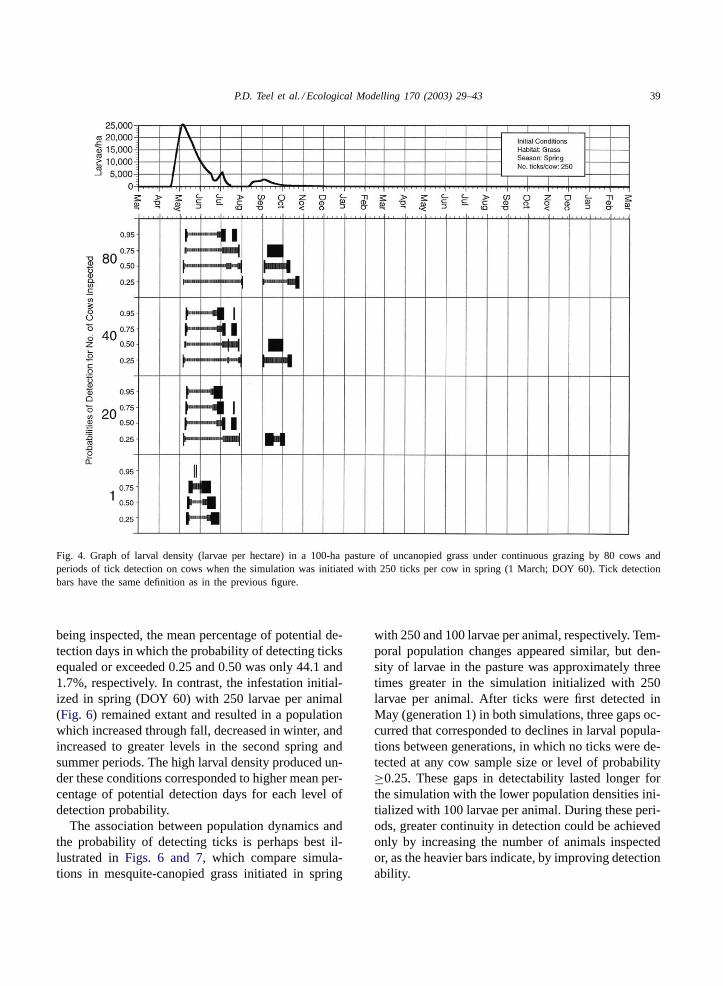
Fig. 4. Graph of larval density (larvae per hectare) in a 100-ha pasture of uncanopied grass under continuous grazing by 80 cows andperiods of tick detection on cows when the simulation was initiated with 250 ticks per cow in spring (1 March; DOY 60). Tick detectionbars have the same definition as in the previous figure.
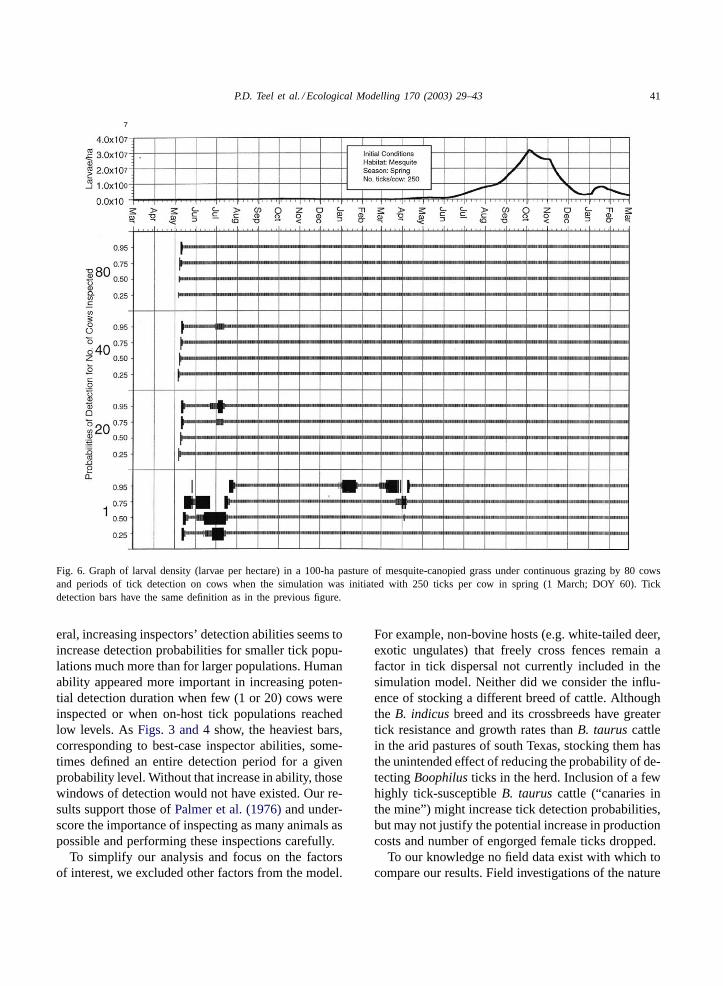
being inspected, the mean percentage of potential de-tection days in which the probability of detecting ticksequaled or exceeded 0.25 and 0.50 was only 44.1 and1.7%, respectively. In contrast, the infestation initial-ized in spring (DOY 60) with 250 larvae per animal(Fig. 6) remained extant and resulted in a populationwhich increased through fall, decreased in winter, andincreased to greater levels in the second spring andsummer periods. The high larval density produced un-der these conditions corresponded to higher mean per-centage of potential detection days for each level ofdetection probability.
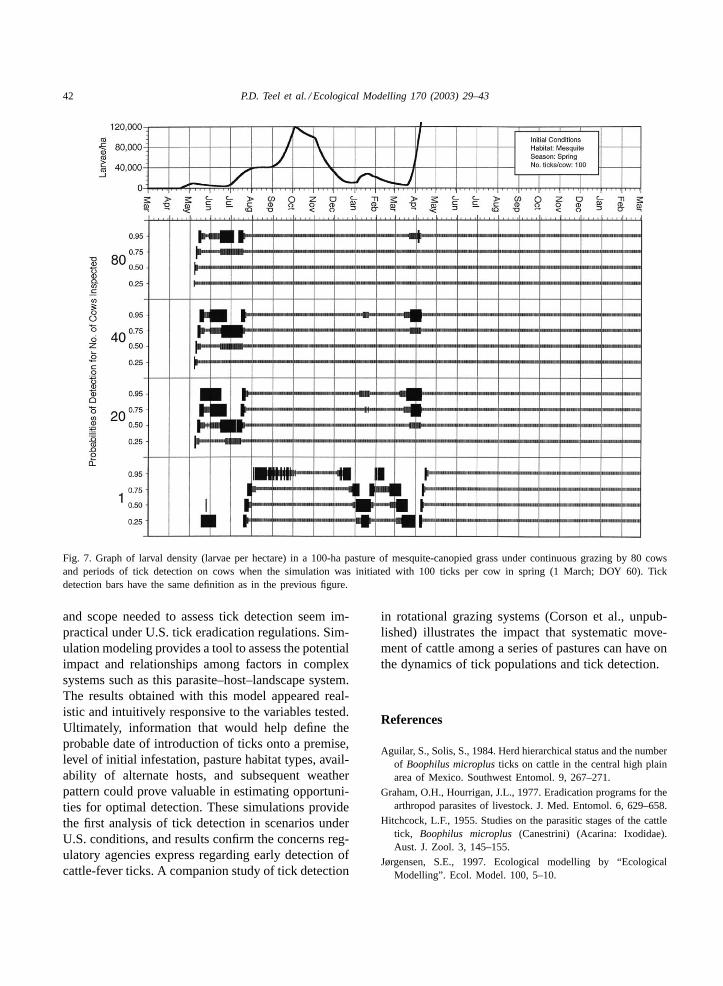
The association between population dynamics andthe probability of detecting ticks is perhaps best il-lustrated inFigs. 6 and 7, which compare simula-tions in mesquite-canopied grass initiated in spring
with 250 and 100 larvae per animal, respectively. Tem-poral population changes appeared similar, but den-sity of larvae in the pasture was approximately threetimes greater in the simulation initialized with 250larvae per animal. After ticks were first detected inMay (generation 1) in both simulations, three gaps oc-curred that corresponded to declines in larval popula-tions between generations, in which no ticks were de-tected at any cow sample size or level of probability≥0.25. These gaps in detectability lasted longer forthe simulation with the lower population densities ini-tialized with 100 larvae per animal. During these peri-ods, greater continuity in detection could be achievedonly by increasing the number of animals inspectedor, as the heavier bars indicate, by improving detectionability.
40 P.D. Teel et al. / Ecological Modelling 170 (2003) 29–43
Fig. 5. Graph of larval density (larvae per hectare) in a 100-ha pasture of mesquite-canopied grass under continuous grazing by 80 cowsand periods of tick detection on cows when the simulation was initiated with 250 ticks per cow in fall (27 September; DOY 270). Tickdetection bars have the same definition as in the previous figure.
6. Discussion
Early detection of aBoophilus infestation in theU.S. is desirable to define the limits of infestedpremises and to prevent population growth and dis-persal to other areas (Graham and Hourrigan, 1977).Results of these studies show that the likelihood ofdetecting ticks by scratch inspection of cattle does notremain stable through time, but varies dynamicallydepending in part on factors that regulate populationdynamics, the number of animals inspected, and theconditions surrounding detection efforts. In this seriesof simulations, biophysical factors such as type ofhabitat, date of initialization, and influence of seasonaltick development and mortality rates regulated popula-tion establishment and temporal dynamics of the pop-ulation. Larger and longer-lived populations increased
host-tick contact and provided more opportunity fordetection (Figs. 6 and 7), while smaller and moreacute populations provided less opportunity for detec-tion. Fall-initiated populations were subjected to pat-terns of delayed oviposition and development inducedby winter weather, resulting in reduced fecundity andsmall populations that were difficult to detect. Suchsmall populations may proceed to extinction and neverpresent a serious problem; however, if weather con-ditions change to favor tick development or infestedcattle are moved to infest another pasture with morefavorable habitat, the undetected population couldspread and become established without detection.
Compared to biophysical factors, the human factorof interest, the ability of inspectors to detect ticks onindividual cows, usually had a relatively minor influ-ence on the ability to detect tick infestations. In gen-
P.D. Teel et al. / Ecological Modelling 170 (2003) 29–43 41
Fig. 6. Graph of larval density (larvae per hectare) in a 100-ha pasture of mesquite-canopied grass under continuous grazing by 80 cowsand periods of tick detection on cows when the simulation was initiated with 250 ticks per cow in spring (1 March; DOY 60). Tickdetection bars have the same definition as in the previous figure.
eral, increasing inspectors’ detection abilities seems toincrease detection probabilities for smaller tick popu-lations much more than for larger populations. Humanability appeared more important in increasing poten-tial detection duration when few (1 or 20) cows wereinspected or when on-host tick populations reachedlow levels. AsFigs. 3 and 4show, the heaviest bars,corresponding to best-case inspector abilities, some-times defined an entire detection period for a givenprobability level. Without that increase in ability, thosewindows of detection would not have existed. Our re-sults support those ofPalmer et al. (1976)and under-score the importance of inspecting as many animals aspossible and performing these inspections carefully.
To simplify our analysis and focus on the factorsof interest, we excluded other factors from the model.
For example, non-bovine hosts (e.g. white-tailed deer,exotic ungulates) that freely cross fences remain afactor in tick dispersal not currently included in thesimulation model. Neither did we consider the influ-ence of stocking a different breed of cattle. Althoughthe B. indicus breed and its crossbreeds have greatertick resistance and growth rates thanB. taurus cattlein the arid pastures of south Texas, stocking them hasthe unintended effect of reducing the probability of de-tectingBoophilus ticks in the herd. Inclusion of a fewhighly tick-susceptibleB. taurus cattle (“canaries inthe mine”) might increase tick detection probabilities,but may not justify the potential increase in productioncosts and number of engorged female ticks dropped.
To our knowledge no field data exist with which tocompare our results. Field investigations of the nature
42 P.D. Teel et al. / Ecological Modelling 170 (2003) 29–43
Fig. 7. Graph of larval density (larvae per hectare) in a 100-ha pasture of mesquite-canopied grass under continuous grazing by 80 cowsand periods of tick detection on cows when the simulation was initiated with 100 ticks per cow in spring (1 March; DOY 60). Tickdetection bars have the same definition as in the previous figure.
and scope needed to assess tick detection seem im-practical under U.S. tick eradication regulations. Sim-ulation modeling provides a tool to assess the potentialimpact and relationships among factors in complexsystems such as this parasite–host–landscape system.The results obtained with this model appeared real-istic and intuitively responsive to the variables tested.Ultimately, information that would help define theprobable date of introduction of ticks onto a premise,level of initial infestation, pasture habitat types, avail-ability of alternate hosts, and subsequent weatherpattern could prove valuable in estimating opportuni-ties for optimal detection. These simulations providethe first analysis of tick detection in scenarios underU.S. conditions, and results confirm the concerns reg-ulatory agencies express regarding early detection ofcattle-fever ticks. A companion study of tick detection
in rotational grazing systems (Corson et al., unpub-lished) illustrates the impact that systematic move-ment of cattle among a series of pastures can have onthe dynamics of tick populations and tick detection.
References
Aguilar, S., Solis, S., 1984. Herd hierarchical status and the numberof Boophilus microplus ticks on cattle in the central high plainarea of Mexico. Southwest Entomol. 9, 267–271.
Graham, O.H., Hourrigan, J.L., 1977. Eradication programs for thearthropod parasites of livestock. J. Med. Entomol. 6, 629–658.
Hitchcock, L.F., 1955. Studies on the parasitic stages of the cattletick, Boophilus microplus (Canestrini) (Acarina: Ixodidae).Aust. J. Zool. 3, 145–155.
Jørgensen, S.E., 1997. Ecological modelling by “EcologicalModelling”. Ecol. Model. 100, 5–10.
P.D. Teel et al. / Ecological Modelling 170 (2003) 29–43 43
Jørgensen, S.E., Halling-Sørensen, B., Nielsen, S.N. (Eds.), 1995.Environmental and Ecological Modeling, CRC Press, NewYork, 672 pp.
Miller, R.J., Davey, R.B., George, J.E., 1999. Characterizationof pyrethroid resistance and susceptibility to coumaphos inMexican Boophilus microplus (Acari: Ixodidae). J. Med.Entomol. 36, 533–538.
Palmer, W.A., Treverrow, N.L., O’Neill, G.H., 1976. Factorsaffecting the detection of infestations ofBoophilus microplusin tick control programs. Aust. Vet. J. 52, 321–324.
Roberts, J.A., 1968. Resistance of cattle to the tickBoophilusmicroplus (Canestrini). I. Development of ticks onBos taurus.J. Parasitol. 54, 663–666.
Spear, R.C., 1997. Large simulation models: calibration,uniqueness and goodness of fit. Environ. Model. Software 12,219–228.
Spear, R.C., Grieb, T.M., Shang, N., 1994. Parameter uncertaintyand interaction in complex environmental models. WaterResourc. Res. 30, 3159–3169.
Teclaw, R.F., Romo, S., Garcia, Z., Castaneda, M., Wagner, G.G.,1985. A seroepidemiologic study of bovine babesiosis in the
Mexican states of Nuevo Leon, Tamaulipas, and Coahuila. Prev.Vet. Med. 3, 403–415.
Teel, P.D., Marın, S.L., Grant, W.E., 1996. Simulation ofhost-parasite-landscape interactions: influence of season andhabitat on cattle-fever tick (Boophilus sp.) population dynamics.Ecol. Model. 84, 19–30.
Teel, P.D., Marın, S.L., Grant, W.E., Stuth, J.W., 1997. Simulationof host-parasite-landscape interactions: influence of seasonand habitat on cattle-fever tick (Boophilus sp.) populationdynamics in rotational grazing systems. Ecol. Model. 97,87–97.
Teel, P.D., Grant, W.E., Marın, S.L., Stuth, J.W., 1998. Simulatedcattle-fever tick infestations in rotational grazing systems. J.Range Manag. 51, 501–508.
Utech, K.B.W., Wharton, R.H., Kerr, J.D., 1978. Resistance toBoophilus microplus (Canestrini) in different breeds of cattle.Aust. J. Agric. Res. 29, 885–895.
Wharton, R.H., Utech, K.B.W., 1970. The relation betweenengorgement and dropping ofBoophilus microplus (Canestrini)(Ixodidae) to the assessment of tick numbers on cattle. J. Aust.Entomol. Soc. 9, 171–182.
Related Documents