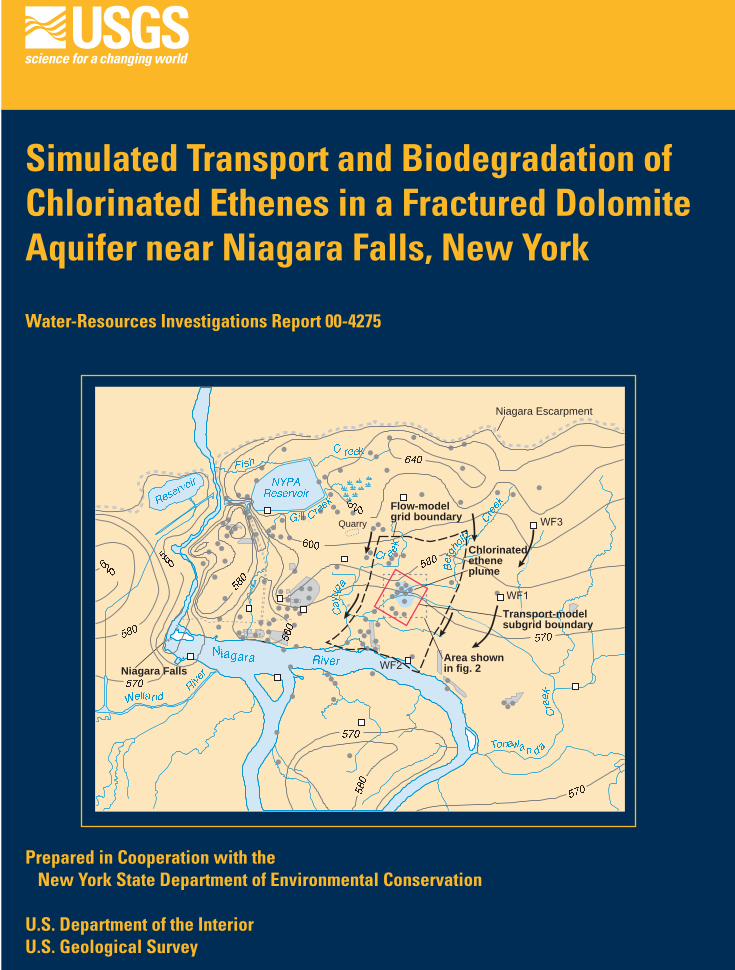
Niagara Escarpment Niagara Falls Quarry Flow-model grid boundary Area shown in fig. 2 Transport-model subgrid boundary WF3 WF1 WF2 Chlorinated ethene plume Simulated Transport and Biodegradation of Chlorinated Ethenes in a Fractured Dolomite Aquifer near Niagara Falls, New York Water-Resources Investigations Report 00-4275 Prepared in Cooperation with the New York State Department of Environmental Conservation U.S. Department of the Interior U.S. Geological Survey

Welcome message from author
This document is posted to help you gain knowledge. Please leave a comment to let me know what you think about it! Share it to your friends and learn new things together.
Transcript
Niagara Escarpment
Niagara Falls
570
580
580
640
600
580
620
570
570
570
580
620
560
560
Quarry
Flow-modelgrid boundary
Area shownin fig. 2
Transport-modelsubgrid boundary
WF3
WF1
WF2
Chlorinatedetheneplume
Cayu
g
a
Cr e
ek
Gill CreekRe
servoir NYPA
Reservoir
Tonawan d
a
Creek
Niagara River
Welland
R
iver
F ish
C reekBergho
ltz
Creek
Simulated Transport and Biodegradation of Chlorinated Ethenes in a Fractured Dolomite Aquifer near Niagara Falls, New York
Water-Resources Investigations Report 00-4275
Prepared in Cooperation with the New York State Department of Environmental Conservation
U.S. Department of the InteriorU.S. Geological Survey
Simulated Transport and Biodegradation of Chlorinated Ethenes in a Fractured Dolomite Aquifer near Niagara Falls, New York
By Richard M. Yager
U.S. GEOLOGICAL SURVEY
Water-Resources Investigations Report 00-4275
Prepared in cooperation with
NEW YORK STATE DEPARTMENT OF
ENVIRONMENTAL CONSERVATION
I
U.S. DEPARTMENT OF THE INTERIOR
Gail A. Norton, Secretary
U.S. GEOLOGICAL SURVEY
Charles Groat, Director
For additional information Copies of this report can bewrite to: purchased from:
U.S. Geological SurveySubdistrict Chief Books and Open-File Reports SectionU.S. Geological Survey, WRD Federal Center30 Brown Road Box 25425Ithaca, N.Y. 12180 Denver, CO 80225
CONTENTS
Abstract.................................................................................................................................................................................. 1Introduction .......................................................................................................................................................................... 2
Purpose and Scope....................................................................................................................................................... 2Study Methods............................................................................................................................................................. 3
Pore Pressure and Streamflow Measurements ................................................................................................... 5Ground-Water Sampling and Analysis .............................................................................................................. 5
Acknowledgments ....................................................................................................................................................... 5Hydrogeology ........................................................................................................................................................................ 5
Lockport Group ........................................................................................................................................................... 6Fracture Zones ............................................................................................................................................................. 7Hydraulic Properties .................................................................................................................................................... 7Ground-Water Flow ..................................................................................................................................................... 9Ground-Water Chemistry............................................................................................................................................. 10
Inorganic Constituents ....................................................................................................................................... 10Tritium ............................................................................................................................................................... 14
Chlorinated Ethenes In Fractured-Dolomite Aquifer ............................................................................................................ 14Distribution and Remediation...................................................................................................................................... 15Fate of Chlorinated Ethenes......................................................................................................................................... 15
Biodegradation................................................................................................................................................... 15Physical Transport Processes............................................................................................................................. 22
Ground-Water Flow Model.................................................................................................................................................... 23Model Design .............................................................................................................................................................. 24Model Calibration........................................................................................................................................................ 24Simulation Results ....................................................................................................................................................... 26
Model Error ....................................................................................................................................................... 27Water Budget ..................................................................................................................................................... 32Model Parameter Values .................................................................................................................................... 32Flow Paths ......................................................................................................................................................... 33
Simulation Of Transport And Biodegradation Of Chlorinated Ethenes ............................................................................... 35Modeling Approach ..................................................................................................................................................... 35Model Description ....................................................................................................................................................... 35Model Design .............................................................................................................................................................. 37Model Calibration........................................................................................................................................................ 37Simulation Results ....................................................................................................................................................... 39
BIOMOC Simulations ....................................................................................................................................... 39Monod Kinetics ....................................................................................................................................... 39First-Order Reactions .............................................................................................................................. 44
MOC3D Simulations ......................................................................................................................................... 45Matrix Diffusion ...................................................................................................................................... 45Ground-Water Age................................................................................................................................... 46
Discussion Of Model Results ................................................................................................................................................ 49Ground-Water-flow Model........................................................................................................................................... 49Solute Transport Model ............................................................................................................................................... 49
Summary And Conclusions ................................................................................................................................................... 51References ............................................................................................................................................................................. 53
Contents III
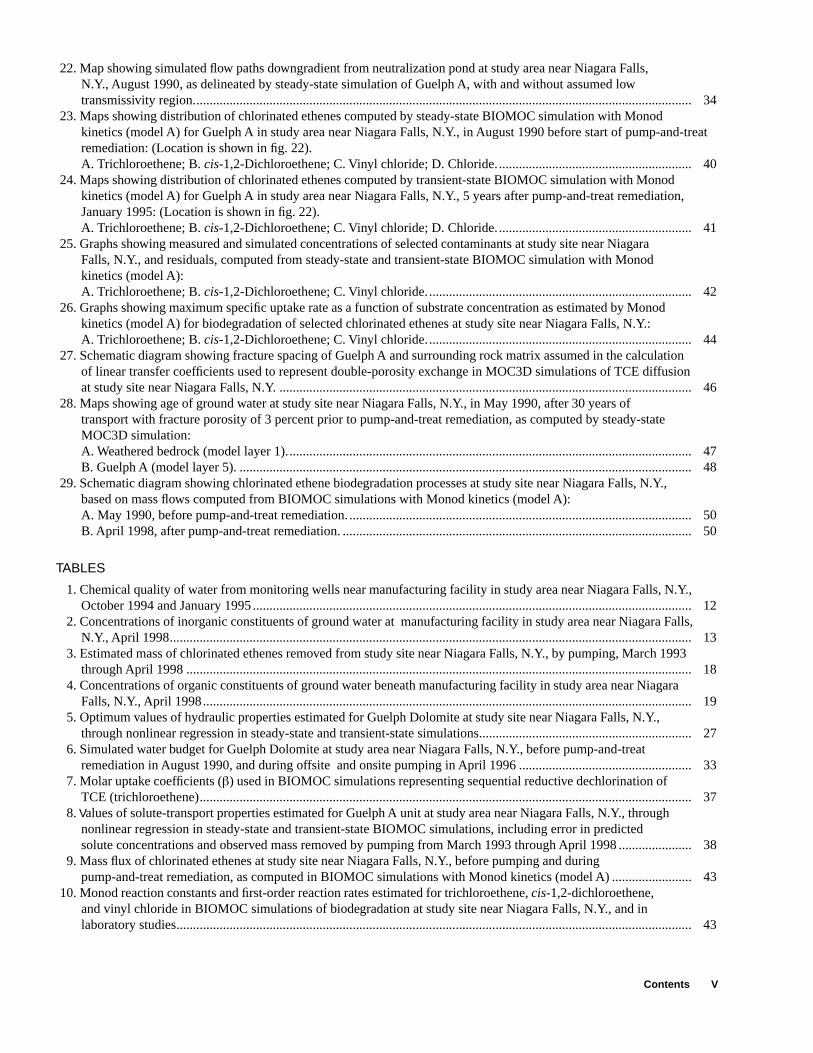
1.Map showing location of study area, potentiometric-surface altitude in weathered bedrock (Yager, 1996) and boundaries of ground-water flow model and solute-transport model in the study area near Niagara Falls, N.Y. ......... 3
2. Map showing locations of wells, DNAPL plume, and aqueous chlorinated-ethene plume at study site, near Niagara Falls, N.Y., 1990. (Location is shown in fig. 2) ............................................................................................................. 4
3. Vertical section A-A’ through chlorinated ethene plume at study site near Niagara Falls, N.Y., 1990. (Location of section is shown in fig. 1). ............................................................................................................................................. 6
4. Box plots showing distribution of transmissivity values estimated from single-hole tests at study site near Niagara Falls, N.Y. .................................................................................................................................................................. 7
5. Polar plot showing directional diffusivity values estimated from cross-hole pumping test at study site near Niagara Falls, N.Y., 1989. ........................................................................................................................................................... 8
6. Hydraulic-head distribution in the Guelph A at study site near Niagara Falls, N.Y. (Site location is shown in fig. 1)A. Under prepumping conditions, August 1990; B. Under pumping conditions, January 1995................................... 9
7. Trilinear diagram showing percentage of major cations and anions in water from the Lockport Group beneath manufacturing facility at study site near Niagara Falls, N.Y. and along a regional flow path. (Well locations and direction of flow path are shown in fig. 1)..................................................................................................................... 11
8. Three year moving average of tritium activity measured in precipitation at Ottawa, Canada, corrected for radioactive decay to 1995 and range within chlorinated ethene plume and along plume boundary. (Precipitation data from International Atomic Energy Agency, 1998). ................................................................................................................ 14
9. Maps showing distribution of chlorinated ethenes in Guelph A beneath the manufacturing facility at study site near Niagara Falls, N.Y., May 1990. (Well locations are shown in fig. 2).A. Trichloroethene (TCE); B. cis-1,2-Dichloroethene (DCE); C. Vinyl chloride (VC)................................................ 16
10. Maps showing distribution of chlorinated ethenes in Guelph A beneath the manufacturing facility at study site near Niagara Falls, N.Y., January 1995.A. Trichloroethene (TCE); B. cis-1,2-Dichloroethene (DCE); C. Vinyl chloride (VC)................................................ 17
11. Trichloroethene concentrations in water from offsite and onsite recovery wells at study site near Niagara Falls, N.Y., March 1993 through April 1998. (Well locations are shown in fig. 2). ......................................................................... 18
12. Map showing distribution of ethene in Guelph A at study site near Niagara Falls, N.Y., April 1998. .......................... 2013. Graph showing relation between chloride and sodium concentrations in water from wells inside and outside the
contaminant plume at study site near Niagara Falls, N.Y., January 1995. .................................................................... 2114. Sequential conversion of trichloroethene to cis-1-2-dichloroethene, vinyl chloride, and ethene by microorganisms
in water from well 87-12(1) at study site near Niagara Falls, N.Y. (From Yager and others, 1997, fig. 6). (Well location is shown in fig. 12) ............................................................................................................................................................ 21
15. Gas chromatograms of solvent-extracted dolomite samples:A. Prior to microbial degradation, showing n-alkanes (C16 to C25) characteristic of naturally occurring petroleum hydrocarbons; B. After microbial degradation; decreased height of n-alkane peaks indicate depletionof hydrocarbons. ............................................................................................................................................................ 22
16. Schematic section depicting principal solute-transport processes within the fracture network at study site near Niagara Falls, N.Y. ........................................................................................................................................................ 23
17. Map showing model boundary conditions within the study area near Niagara Falls, N.Y. (Location is shown in fig. 1). .................................................................................................................................................................. 25
18. Schematic section showing model layers that represent the Guelph Dolomite in the upper Lockport Group along section B-B’ in study area near Niagara Falls, N.Y. (Trace of section is shown in fig. 17). ............................... 26
19. Maps showing distribution of hydraulic head and residuals in study area near Niagara Falls, N.Y., before pump-and-treat remediation that began in August 1990, as computed by steady-state simulation:A. In weathered bedrock (model layer 1). ..................................................................................................................... 28B. In Guelph A unit (model layer 5).............................................................................................................................. 29
20. Maps showing distribution of hydraulic head and residuals in study area near Niagara Falls, N.Y., after pump-and-treat remediation, January 1995, as computed by transient-state simulation:A. In weathered bedrock (model layer 1). ..................................................................................................................... 30B. In Guelph A unit (model layer 5).............................................................................................................................. 31
21. Graphs showing measured heads and residuals as a function of simulated heads in Guelph A in study area near Niagara Falls, N.Y., before, during, and after pump-and-treat remediation, 1990-98:A. Measured and simulated heads; B. Simulated values and residuals. ........................................................................ 32
IV Contents
22. Map showing simulated flow paths downgradient from neutralization pond at study area near Niagara Falls, N.Y., August 1990, as delineated by steady-state simulation of Guelph A, with and without assumed low transmissivity region...................................................................................................................................................... 34
23. Maps showing distribution of chlorinated ethenes computed by steady-state BIOMOC simulation with Monod kinetics (model A) for Guelph A in study area near Niagara Falls, N.Y., in August 1990 before start of pump-and-treat remediation: (Location is shown in fig. 22).A. Trichloroethene; B. cis-1,2-Dichloroethene; C. Vinyl chloride; D. Chloride. .......................................................... 40
24. Maps showing distribution of chlorinated ethenes computed by transient-state BIOMOC simulation with Monod kinetics (model A) for Guelph A in study area near Niagara Falls, N.Y., 5 years after pump-and-treat remediation, January 1995: (Location is shown in fig. 22).A. Trichloroethene; B. cis-1,2-Dichloroethene; C. Vinyl chloride; D. Chloride. .......................................................... 41
25. Graphs showing measured and simulated concentrations of selected contaminants at study site near Niagara Falls, N.Y., and residuals, computed from steady-state and transient-state BIOMOC simulation with Monod kinetics (model A):A. Trichloroethene; B. cis-1,2-Dichloroethene; C. Vinyl chloride................................................................................ 42
26. Graphs showing maximum specific uptake rate as a function of substrate concentration as estimated by Monod kinetics (model A) for biodegradation of selected chlorinated ethenes at study site near Niagara Falls, N.Y.:A. Trichloroethene; B. cis-1,2-Dichloroethene; C. Vinyl chloride................................................................................ 44
27. Schematic diagram showing fracture spacing of Guelph A and surrounding rock matrix assumed in the calculation of linear transfer coefficients used to represent double-porosity exchange in MOC3D simulations of TCE diffusion at study site near Niagara Falls, N.Y. ............................................................................................................................ 46
28. Maps showing age of ground water at study site near Niagara Falls, N.Y., in May 1990, after 30 years of transport with fracture porosity of 3 percent prior to pump-and-treat remediation, as computed by steady-state MOC3D simulation:A. Weathered bedrock (model layer 1).......................................................................................................................... 47 B. Guelph A (model layer 5). ........................................................................................................................................ 48
29. Schematic diagram showing chlorinated ethene biodegradation processes at study site near Niagara Falls, N.Y., based on mass flows computed from BIOMOC simulations with Monod kinetics (model A):A. May 1990, before pump-and-treat remediation. ....................................................................................................... 50B. April 1998, after pump-and-treat remediation. ......................................................................................................... 50
TABLES
1. Chemical quality of water from monitoring wells near manufacturing facility in study area near Niagara Falls, N.Y., October 1994 and January 1995 .................................................................................................................................... 12
2. Concentrations of inorganic constituents of ground water at manufacturing facility in study area near Niagara Falls, N.Y., April 1998............................................................................................................................................................. 13
3. Estimated mass of chlorinated ethenes removed from study site near Niagara Falls, N.Y., by pumping, March 1993 through April 1998 ........................................................................................................................................................ 18
4. Concentrations of organic constituents of ground water beneath manufacturing facility in study area near Niagara Falls, N.Y., April 1998................................................................................................................................................... 19
5. Optimum values of hydraulic properties estimated for Guelph Dolomite at study site near Niagara Falls, N.Y., through nonlinear regression in steady-state and transient-state simulations................................................................ 27
6. Simulated water budget for Guelph Dolomite at study area near Niagara Falls, N.Y., before pump-and-treat remediation in August 1990, and during offsite and onsite pumping in April 1996 .................................................... 33
7. Molar uptake coefficients (β) used in BIOMOC simulations representing sequential reductive dechlorination of TCE (trichloroethene).................................................................................................................................................... 37
8. Values of solute-transport properties estimated for Guelph A unit at study area near Niagara Falls, N.Y., through nonlinear regression in steady-state and transient-state BIOMOC simulations, including error in predicted solute concentrations and observed mass removed by pumping from March 1993 through April 1998 ...................... 38
9. Mass flux of chlorinated ethenes at study site near Niagara Falls, N.Y., before pumping and during pump-and-treat remediation, as computed in BIOMOC simulations with Monod kinetics (model A) ........................ 43
10. Monod reaction constants and first-order reaction rates estimated for trichloroethene, cis-1,2-dichloroethene, and vinyl chloride in BIOMOC simulations of biodegradation at study site near Niagara Falls, N.Y., and in laboratory studies........................................................................................................................................................... 43
Contents V
11. First -order reaction constants for trichloroethene, cis-1,2-dichloroethene, and vinyl chloride estimated through nonlinear regression in BIOMOC simulations of prepumping conditions and pump-and-treat remediation at study site near Niagara Falls, N.Y., and by previous field studies at other sites............................................................ 45
12. Mass of trichloroethene in contaminant plume at study site near Niagara Falls, N.Y., in May 1990 before pumping began, as computed from first-order reactions from MOC3D simulations with and without diffusion into surrounding rock matrix and within Guelph A.............................................................................................................. 46
CONVERSION FACTORS AND VERTICAL DATUM
Multiply By To obtain
Lengthinch (in) 25.4 millimeter (mm)
foot (ft) 0.3048 meter (m)
mile (mi) 1.609 kilometer (km)
Areaacre (ac) 0.4047 hectare (ha)
square mile (mi2) 2.59 square kilometer (km2)
Volumecubic feet (ft3) 0.02832 cubic meters (m3)
gallon (gal) 3785. milliliter (ml)
gallon 3.785 liter (L)
gallon 0.003785 cubic meters
Hydraulic conductivityfeet per day (ft/d) 3.528 x10⁻⁶ meters per second (m2/s)
Transmissivityfeet squared per day (ft2/d) 1.075 x10⁻⁶ meters squared per second (m2/d)
Weightpounds (lb) 0.4536 kilograms (kg)
Chemical concentrationmilligrams per liter (mg/L) 1 parts per million1
micrograms per liter (µg/L) 1 parts per billion
picoCuries per liter (pci/L) 0.3132 tritium units (TU)
milligrams per liter:
trichloroethene 0.1314 micromoles per liter (µM)
cis-1,2-dichloroethene 0.09592 micromoles per liter
1Milligrams per liter approximately equal parts per million when dissolved-solids concentration isless than about 7,000 milligrams per liter.
VI Contents
Abstract 1
Simulated Transport and Biodegradation of Chlorinated Ethenes in a Fractured Dolomite Aquifer Near Niagara Falls, New York
Richard M. Yager
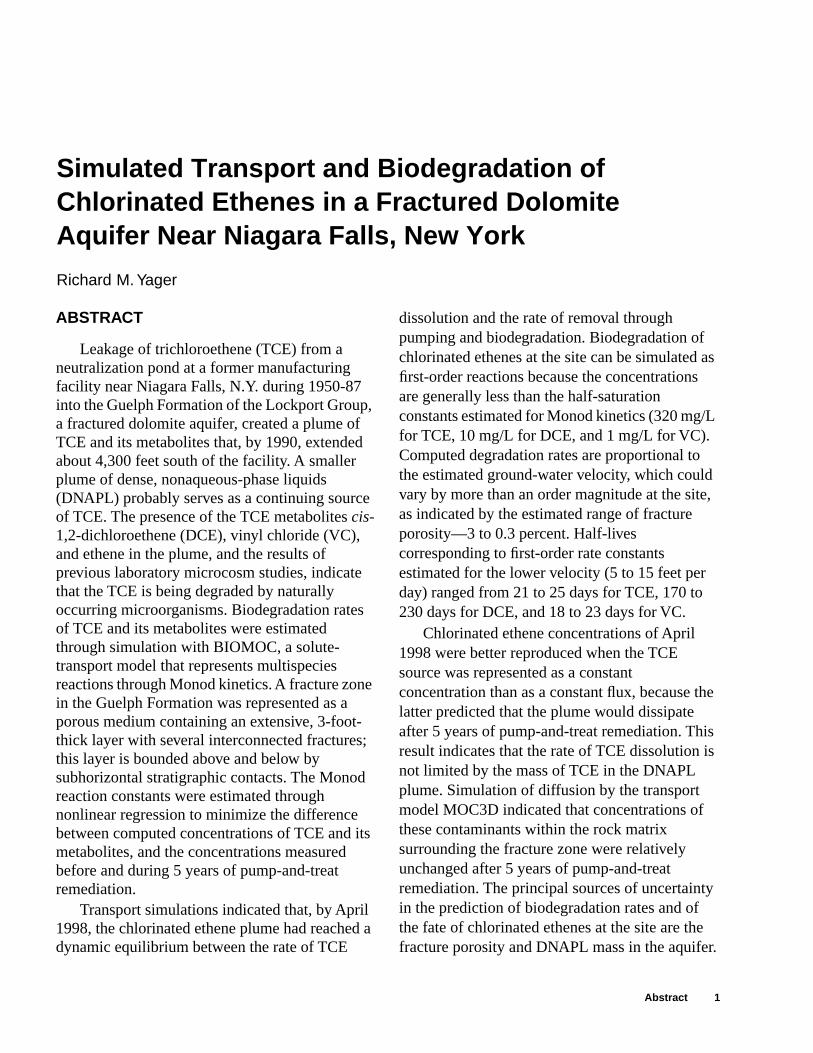
ABSTRACT
Leakage of trichloroethene (TCE) from a neutralization pond at a former manufacturing facility near Niagara Falls, N.Y. during 1950-87 into the Guelph Formation of the Lockport Group, a fractured dolomite aquifer, created a plume of TCE and its metabolites that, by 1990, extended about 4,300 feet south of the facility. A smaller plume of dense, nonaqueous-phase liquids (DNAPL) probably serves as a continuing source of TCE. The presence of the TCE metabolites
cis
-1,2-dichloroethene (DCE), vinyl chloride (VC), and ethene in the plume, and the results of previous laboratory microcosm studies, indicate that the TCE is being degraded by naturally occurring microorganisms. Biodegradation rates of TCE and its metabolites were estimated through simulation with BIOMOC, a solute-transport model that represents multispecies reactions through Monod kinetics. A fracture zone in the Guelph Formation was represented as a porous medium containing an extensive, 3-foot-thick layer with several interconnected fractures; this layer is bounded above and below by subhorizontal stratigraphic contacts. The Monod reaction constants were estimated through nonlinear regression to minimize the difference between computed concentrations of TCE and its metabolites, and the concentrations measured before and during 5 years of pump-and-treat remediation.
Transport simulations indicated that, by April 1998, the chlorinated ethene plume had reached a dynamic equilibrium between the rate of TCE
dissolution and the rate of removal through pumping and biodegradation. Biodegradation of chlorinated ethenes at the site can be simulated as first-order reactions because the concentrations are generally less than the half-saturation constants estimated for Monod kinetics (320 mg/L for TCE, 10 mg/L for DCE, and 1 mg/L for VC). Computed degradation rates are proportional to the estimated ground-water velocity, which could vary by more than an order magnitude at the site, as indicated by the estimated range of fracture porosity—3 to 0.3 percent. Half-lives corresponding to first-order rate constants estimated for the lower velocity (5 to 15 feet per day) ranged from 21 to 25 days for TCE, 170 to 230 days for DCE, and 18 to 23 days for VC.
Chlorinated ethene concentrations of April 1998 were better reproduced when the TCE source was represented as a constant concentration than as a constant flux, because the latter predicted that the plume would dissipate after 5 years of pump-and-treat remediation. This result indicates that the rate of TCE dissolution is not limited by the mass of TCE in the DNAPL plume. Simulation of diffusion by the transport model MOC3D indicated that concentrations of these contaminants within the rock matrix surrounding the fracture zone were relatively unchanged after 5 years of pump-and-treat remediation. The principal sources of uncertainty in the prediction of biodegradation rates and of the fate of chlorinated ethenes at the site are the fracture porosity and DNAPL mass in the aquifer.
2 Simulated Transport and Biodegradation of Chlorinated Ethenes in a Fractured Dolomite Aquifer near Niagara Falls, New York
INTRODUCTION
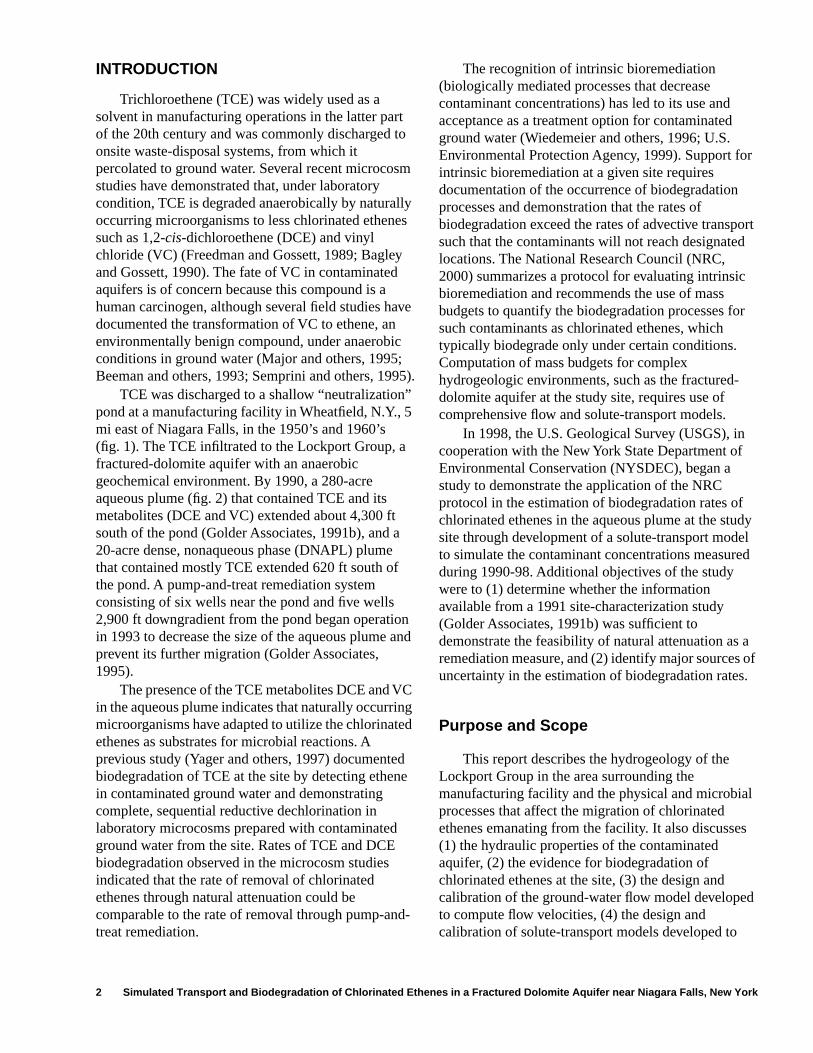
Trichloroethene (TCE) was widely used as a solvent in manufacturing operations in the latter part of the 20th century and was commonly discharged to onsite waste-disposal systems, from which it percolated to ground water. Several recent microcosm studies have demonstrated that, under laboratory condition, TCE is degraded anaerobically by naturally occurring microorganisms to less chlorinated ethenes such as 1,2-
cis-
dichloroethene (DCE) and vinyl chloride (VC) (Freedman and Gossett, 1989; Bagley and Gossett, 1990). The fate of VC in contaminated aquifers is of concern because this compound is a human carcinogen, although several field studies have documented the transformation of VC to ethene, an environmentally benign compound, under anaerobic conditions in ground water (Major and others, 1995; Beeman and others, 1993; Semprini and others, 1995).
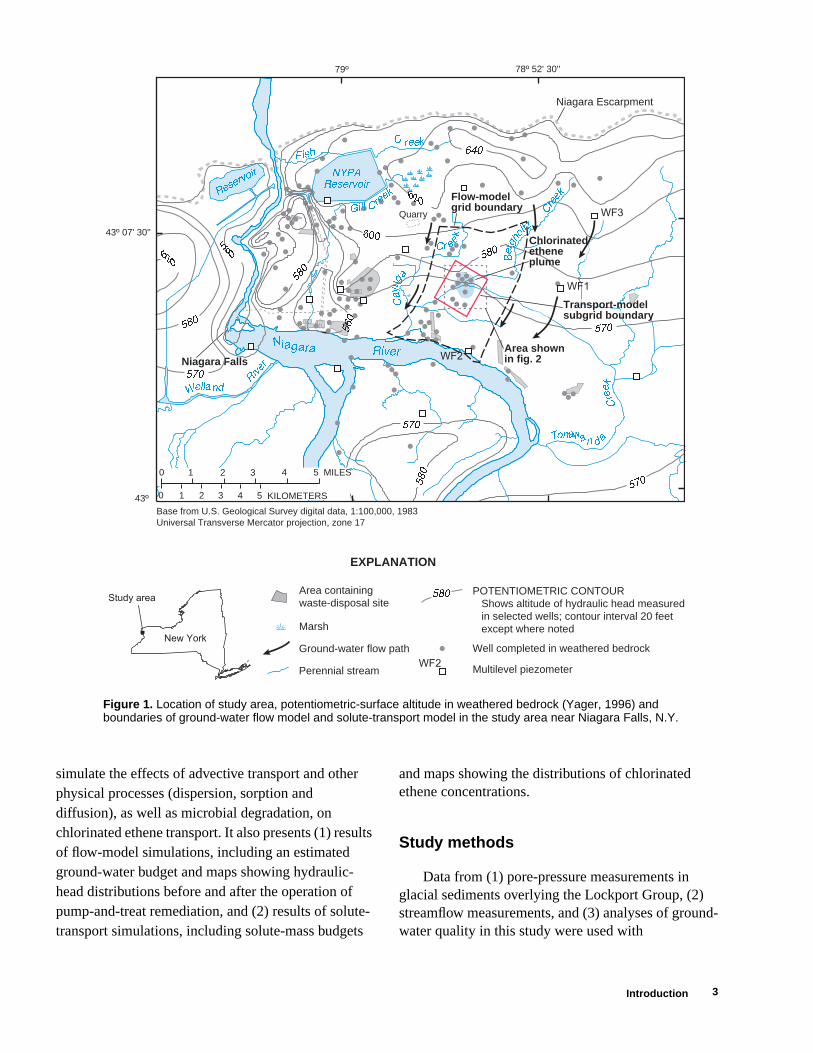
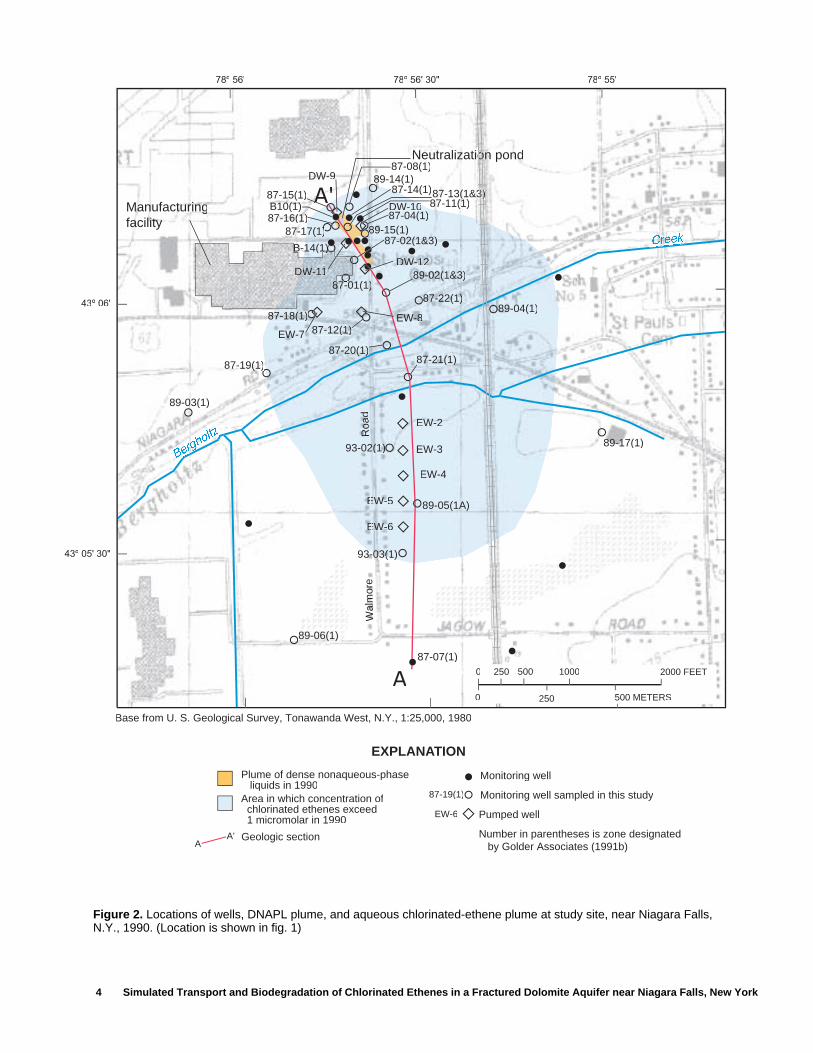
TCE was discharged to a shallow “neutralization” pond at a manufacturing facility in Wheatfield, N.Y., 5 mi east of Niagara Falls, in the 1950’s and 1960’s (fig. 1). The TCE infiltrated to the Lockport Group, a fractured-dolomite aquifer with an anaerobic geochemical environment. By 1990, a 280-acre aqueous plume (fig. 2) that contained TCE and its metabolites (DCE and VC) extended about 4,300 ft south of the pond (Golder Associates, 1991b), and a 20-acre dense, nonaqueous phase (DNAPL) plume that contained mostly TCE extended 620 ft south of the pond. A pump-and-treat remediation system consisting of six wells near the pond and five wells 2,900 ft downgradient from the pond began operation in 1993 to decrease the size of the aqueous plume and prevent its further migration (Golder Associates, 1995).
The presence of the TCE metabolites DCE and VC in the aqueous plume indicates that naturally occurring microorganisms have adapted to utilize the chlorinated ethenes as substrates for microbial reactions. A previous study (Yager and others, 1997) documented biodegradation of TCE at the site by detecting ethene in contaminated ground water and demonstrating complete, sequential reductive dechlorination in laboratory microcosms prepared with contaminated ground water from the site. Rates of TCE and DCE biodegradation observed in the microcosm studies indicated that the rate of removal of chlorinated ethenes through natural attenuation could be comparable to the rate of removal through pump-and-treat remediation.
The recognition of intrinsic bioremediation (biologically mediated processes that decrease contaminant concentrations) has led to its use and acceptance as a treatment option for contaminated ground water (Wiedemeier and others, 1996; U.S. Environmental Protection Agency, 1999). Support for intrinsic bioremediation at a given site requires documentation of the occurrence of biodegradation processes and demonstration that the rates of biodegradation exceed the rates of advective transport such that the contaminants will not reach designated locations. The National Research Council (NRC, 2000) summarizes a protocol for evaluating intrinsic bioremediation and recommends the use of mass budgets to quantify the biodegradation processes for such contaminants as chlorinated ethenes, which typically biodegrade only under certain conditions. Computation of mass budgets for complex hydrogeologic environments, such as the fractured-dolomite aquifer at the study site, requires use of comprehensive flow and solute-transport models.
In 1998, the U.S. Geological Survey (USGS), in cooperation with the New York State Department of Environmental Conservation (NYSDEC), began a study to demonstrate the application of the NRC protocol in the estimation of biodegradation rates of chlorinated ethenes in the aqueous plume at the study site through development of a solute-transport model to simulate the contaminant concentrations measured during 1990-98. Additional objectives of the study were to (1) determine whether the information available from a 1991 site-characterization study (Golder Associates, 1991b) was sufficient to demonstrate the feasibility of natural attenuation as a remediation measure, and (2) identify major sources of uncertainty in the estimation of biodegradation rates.
Purpose and Scope
This report describes the hydrogeology of the Lockport Group in the area surrounding the manufacturing facility and the physical and microbial processes that affect the migration of chlorinated ethenes emanating from the facility. It also discusses (1) the hydraulic properties of the contaminated aquifer, (2) the evidence for biodegradation of chlorinated ethenes at the site, (3) the design and calibration of the ground-water flow model developed to compute flow velocities, (4) the design and calibration of solute-transport models developed to
3
Niagara Escarpment
Niagara Falls
570
580
580
640
600
580
620
570
570
570
580
620
560
560
580
EXPLANATION
Area containingwaste-disposal site
Perennial stream
Ground-water flow path
Quarry
Marsh
Well completed in weathered bedrock
POTENTIOMETRIC CONTOUR Shows altitude of hydraulic head measured in selected wells; contour interval 20 feet except where noted
Multilevel piezometer
Base from U.S. Geological Survey digital data, 1:100,000, 1983Universal Transverse Mercator projection, zone 17
43º 07' 30''
43º
79º 78º 52' 30''
Flow-modelgrid boundary
Area shownin fig. 2
Transport-modelsubgrid boundary
WF3
WF1
WF2
WF2
Chlorinatedetheneplume
Cayu
g
a
Cr e
ek
New York
Study area
Gill CreekRe
servoir NYPA
Reservoir
Tonawan d
a
Creek
Niagara River
Welland
R
iver
F ish
C reek
Bergho
ltz
Creek
430 1 2
5 MILES
KILOMETERS
1 2 3 4
5
0
Figure 1.
Location of study area, potentiometric-surface altitude in weathered bedrock (Yager, 1996) and boundaries of ground-water flow model and solute-transport model in the study area near Niagara Falls, N.Y.
simulate the effects of advective transport and other physical processes (dispersion, sorption and diffusion), as well as microbial degradation, on chlorinated ethene transport. It also presents (1) results of flow-model simulations, including an estimated ground-water budget and maps showing hydraulic-head distributions before and after the operation of pump-and-treat remediation, and (2) results of solute-transport simulations, including solute-mass budgets
and maps showing the distributions of chlorinated ethene concentrations.
Study methods
Data from (1) pore-pressure measurements in glacial sediments overlying the Lockport Group, (2) streamflow measurements, and (3) analyses of ground-water quality in this study were used with
Introduction
4 Simulated Transport and Biodegradation of Chlorinated Ethenes in a Fractured Dolomite Aquifer near Niagara Falls, New York
CreekCre
Bergh
oltzz
Be
Plume of dense nonaqueous-phase liquids in 1990Area in which concentration of chlorinated ethenes exceed 1 micromolar in 1990
Monitoring well
Monitoring well sampled in this study
Pumped well
Number in parentheses is zone designated by Golder Associates (1991b)
EW-6
87-19(1)
Geologic sectionA
A'
EXPLANATION
A
A'
Base from U. S. Geological Survey, Tonawanda West, N.Y., 1:25,000, 1980B
Neutralization pond
Manufacturingfacility
Wal
mor
e
Roa
d
89-04(1)
87-21(1)
89-06(1)
89-05(1A)
EW-3
EW-2
EW-4
EW-5 E
EW-6 E
93-03(1)-03(1) 3-3
89-17(1)93-02(1) 02
87-19(1))
87-07(1)
89-03(1)
87-12(1)
87-20(1))
EW-7
887-18(1)
87-01(1)7 0889-02(1&3)
87-22(1)
EW-8
87-17(1))
87-15(1)B10(1)87-16(1)
DW-9
DWDW-11
1)B-114(1))
87-13(1&3)0DW-10
DW-12
89-15(1)8887-04(1)
87-08(1)
87-11(1)(( )
87-14(1)8789-14(1)
87-02(1&3)
78º 55'78º 56' 30"78º 56'
43º 05' 30"
43º 06'
250 500 METERS
2000 FEET
0
0 1000500250
Figure 2.
Locations of wells, DNAPL plume, and aqueous chlorinated-ethene plume at study site, near Niagara Falls, N.Y., 1990. (Location is shown in fig. 1)
5
hydrogeologic information from previous studies to develop a conceptual model of ground-water flow and recharge in the aquifer system and to aid in the design of three-dimensional ground-water flow and solute-transport models.
Pore pressure and streamflow measurements
Two pressure transducers were installed in augered holes near well WF-2 (fig. 1) within glacial sediments at depths of 12.6 ft and 23.2 ft in November 1998. The transducers were placed within saturated sand packs, and the holes were sealed to land surface with an expanding grout to isolate the monitored intervals from atmospheric pressure. A third pressure transducer was installed in well WF-2 in a monitored interval open to fractures at the weathered bedrock surface. A datalogger monitored the transducers at 15-min intervals to provide a continuous record of pore pressure from November 1998 through November 1999. Streamflow measurements were made at several locations along Bergholtz Creek by standard USGS techniques (Rantz and others, 1982).
Ground-water sampling and analysis
Water samples were collected from 26 monitoring wells in April 1998 after removal of three well volumes and analyzed for inorganic and organic constituents. Samples were collected by a peristaltic pump and dedicated high-density polyethylene tubing.
Stable inorganic constituents and tritium in water samples were measured by the USGS National Water Quality Laboratory through standard techniques (Fishman and Friedman, 1989). Tritium was measured by liquid scintillation counting with a detection limit of 5 pci/L. Samples analyzed for hydrogen were collected with a gas-stripping procedure described by Chapelle and others (1995), in which a glass gas-sampling bulb is used to create a bubble of gases that equilibrates with the stream of water produced from the well. The gas sample is then extracted through a septum with a needle for analysis in the field by gas chromatography. Concentrations of gaseous hydrogen were measured with a gas chromatograph equipped with a reduction gas detector, and concentrations of aqueous hydrogen were then calculated from hydrogen-solubility data, as described by Chapelle and others (1995). Unfiltered samples were analyzed in the field for dissolved oxygen by a colorimetric procedure
and for ferrous iron, total iron, and sulfide by spectroscopic procedures (Hach Company, 1996).
Concentrations of chlorinated ethenes and methane were measured onsite. Chlorinated ethenes in head spaces of water samples were analyzed with a gas chromatograph (Photovac 10s50) equipped with a photoionization detector and a capillary column packed with SV-30 substrate. The column oven was operated isothermally at room temperature of about 28˚ C with ultra-zero air carrier gas at a flow rate of 1.0 mL/min. Elution times of the chlorinated ethenes were typically from 5 s for vinyl chloride to 200 s for perchloroethylene. Methane in the head spaces of water samples was analyzed by a gas chromatograph (MTIP200D) equipped with a thermal conductivity detector and a microcolumn packed with 5-angstrom molecular sieves. The column oven was operated at a constant 80˚C with helium carrier gas at a flow rate of 1.0 mL/min. Retention time of methane ranged from 55 to 65 s. Dissolved organic carbon in ground-water samples were measured by the USGS National Water Quality Laboratory in accordance with standard water-quality techniques (Wershaw and others, 1987).
Acknowledgments
Textron Inc. provided access to the site and financial support for the study. David Wehn and Anthony Grasso of Golder Associates provided logistical support for fieldwork and prompt response to information requests. William Wertz of the NYSDEC and Eugene Madsen of Cornell University provided information on the physical and microbial processes that affect contaminant migration at the site.
HYDROGEOLOGY
The study area surrounds a former aircraft-manufacturing facility about 5 mi east of Niagara Falls in western New York (fig. 1). The facility overlies 15 to 40 ft of till and lacustrine silt and clay (Golder Associates, 1991b) that are in turn underlain by virtually undeformed dolomite of the Niagaran Series (Middle Silurian), which strikes east-west and dips gently to the south at about 25 ft/mi (Brett and others, 1995). The Lockport Group crops out along the Niagara Escarpment, where it forms the cap rock of Niagara Falls, and is overlain
Hydrogeology
6 Simulated Transport and Biodegradation of Chlorinated Ethenes in a Fractured Dolomite Aquifer near Niagara Falls, New York
EXPLANATIONSTRATIGRAPHIC NOMENCLATURE
Brett and others (1995)Golder Associates (1991b)CONCENTRATION OF TOTAL CHLORINATEDETHENES IN GUELPH A, IN MICROMOLESPER LITER
A'North
ASouthFEET
Formation contact
Informal unit contactGreater than 1,000
100 to 1,000
10 to 100
1 to 10
Less than 1
Hydraulic head in Guelph A, August 1990
Well number and screened interval
Guelph Dolomite
Eramosa Dolomite
Gue
lph
Era
mos
a
Zone 1
Zone 2
Zone 3
units A-C
unit F
units C-E
units A&BZone 4
87-2
1(1)
Berg
holtz C
reek
Alti
tude
, in
feet
abo
ve s
ea le
vel
575
555
535
515
595
neutralizationpond
Extent of dense,nonaqueous-phase liquidsin Guelph A
o
87-2
1(1)
89-7
(1A
)
89-5
(1A
)
89-0
2(1&
3)
87-1
5(1&
3)
0 500 1,000 FEET
0 100 200 METERS
weathered bedrock
AAAAAAAAAFFF
C, D, EC D,C C D E, ED EDAAAAA, BA, BBA BA,A, B
B, C
glacialsediments
Vertical exaggeration x40
to the south by shales of the Salina Group. Contaminants from the facility have entered the upper part of the Lockport Group.
Lockport Group
The Lockport Group is a petroliferous dolomite that contains gypsum and metal sulfides (Zenger, 1965). Naturally derived hydrocarbons that impart a brown color are disseminated throughout the rock matrix in some stratigraphic horizons. Thin layers of bitumin are also present and are commonly associated
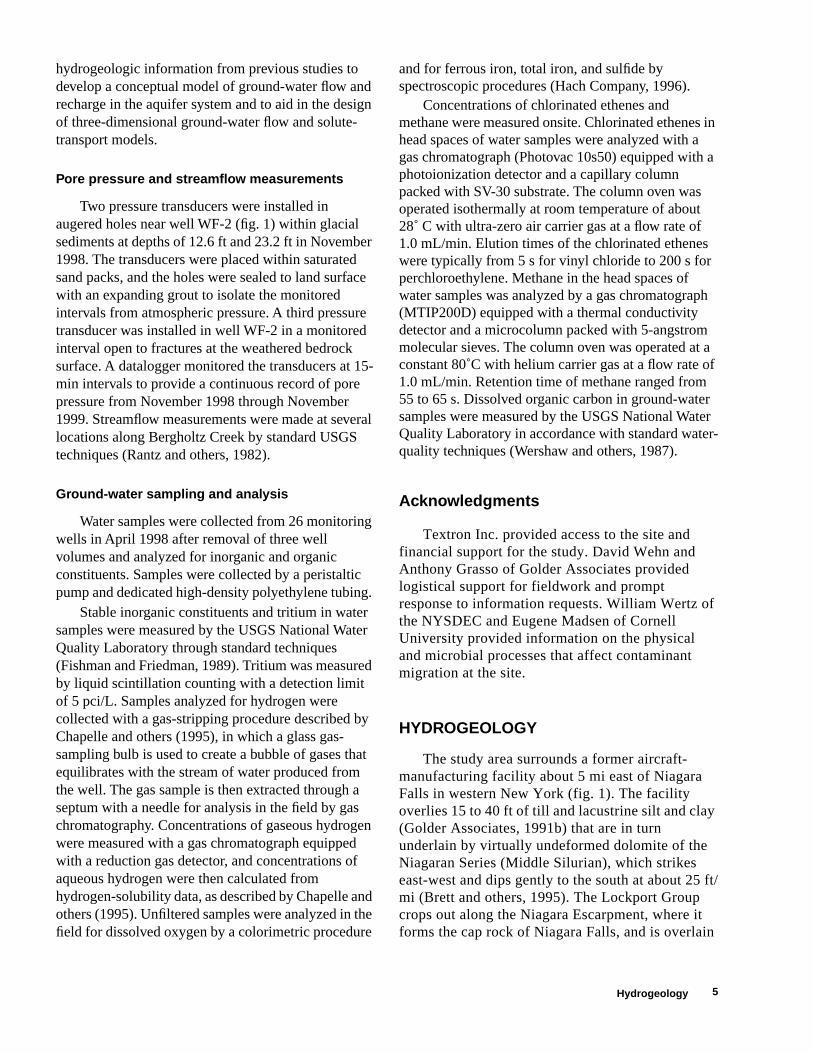
with layers of gypsum. Freshly broken surfaces of rock cores from two depths (zones 1 and 3 in fig. 3) emit a distinct petroliferous (oily) odor.
Many observation wells have been installed near the facility; they are screened in the Guelph Dolomite and the Eramosa Dolomite (fig. 3), the uppermost formations of the Lockport Group, as described by Brett and others (1995). Previous investigators of the site (Golder Associates, 1991b) delineated four bedrock zones that correspond to nine informal units described by Brett and others (1995). Zone 1 is a light-gray, fine-grained, laminated dolomite 10 to 20 ft thick
Figure 3.
Vertical section A-A’ through chlorinated ethene plume at study site near Niagara Falls, N.Y., 1990. (Location of section is shown in fig. 2).
7
that is equivalent to the Guelph Dolomite (fig. 3). Zone 2, which underlies zone 1, is an olive-gray, massive, 8-ft thick dolomite equivalent to the Eramosa Dolomite unit F. Zone 3 is a brownish-gray, vuggy, saccharoidal-textured dolomite of variable thickness (18 to 29 ft) that is equivalent to Eramosa Dolomite units C, D, and E. Zone 4 is a light to medium-brownish gray, fine- to medium-grained dolomite 60 to 65 ft thick, equivalent to Eramosa Dolomite units A and B. These zones and their relation to those of Brett and others (1995) are indicated in fig. 3.
Fracture Zones
The hydraulic properties of the Lockport Group are related primarily to secondary permeability caused by fractures and vugs. The principal water-bearing zones in the Lockport Group are the weathered bedrock surface and horizontal-fracture zones bounded by stratigraphic contacts (Kappel and Tepper, 1992). These horizontal-fracture zones are connected by high-angle fractures and by subcrop areas where the fracture zones intersect the bedrock surface.
The Guelph Dolomite (zone 1) at the manufacturing facility is the zone that contains the TCE plume. It includes two horizontal-fracture zones—the 5-ft-thick weathered bedrock surface referred to as Guelph unit C by Brett and others (1995), and a 3- to 4-ft-thick stromatolitic dolomite at the lower contact with the Eramosa Dolomite, referred to as unit A by Brett and others (1995) and as the A-marker bed by previous site investigators. The weathered bedrock contains many open fractures, some of which have been widened by dissolution of dolomite and gypsum (Golder Associates, 1991b). Most of the bedrock wells at the site are finished in fractures within the Guelph Dolomite unit A (referred to as Guelph A herein), which contains open bedding partings formed through gypsum dissolution and is commonly associated with water loss during drilling. High-angle fractures encountered in some boreholes suggest hydraulic connections between the Guelph A and the weathered bedrock.
The massive dolomite beneath the Guelph A is the Eramosa Dolomite unit F (zone 2), which appears relatively unfractured, but the presence of chlorinated ethenes in a small area within the underlying Eramosa Dolomite units C, D, and E (zone 3) indicates that some high-angle fractures probably penetrate Eramosa F and form pathways for downward migration from
the Guelph A. The lower part of the Eramosa Dolomite contains vugs and bedding-plane fractures. These units, and four regional fracture zones that stratigraphically bound units A through D, have been mapped in previous studies summarized by Yager (1996).
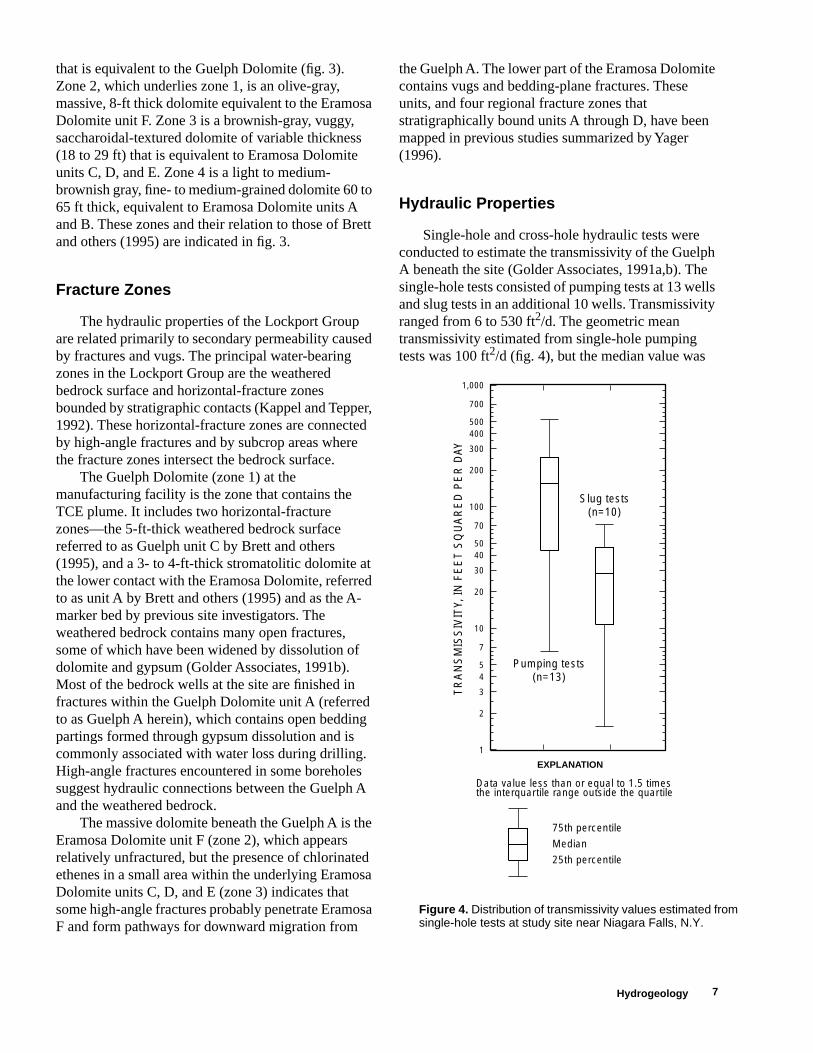
Hydraulic Properties
Single-hole and cross-hole hydraulic tests were conducted to estimate the transmissivity of the Guelph A beneath the site (Golder Associates, 1991a,b). The single-hole tests consisted of pumping tests at 13 wells and slug tests in an additional 10 wells. Transmissivity ranged from 6 to 530 ft
2
/d. The geometric mean transmissivity estimated from single-hole pumping tests was 100 ft
2
/d (fig. 4), but the median value was
EXPLANATION
25th percentile
Median
75th percentile
Data value less than or equal to 1.5 timesthe interquartile range outside the quartile
Pumping tests(n=13)
Slug tests(n=10)
TR
AN
SM
ISS
IVIT
Y, IN
FE
ET
SQ
UA
RE
D P
ER
DAY
1
1,000
2
3
45
7
10
20
30
4050
70
100
200
300
400500
700
Figure 4.
Distribution of transmissivity values estimated from single-hole tests at study site near Niagara Falls, N.Y.
Hydrogeology
8 Simulated Transport and Biodegradation of Chlorinated Ethenes in a Fractured Dolomite Aquifer near Niagara Falls, New York
0º
Azimuth
30º
60º
90º
120º
150º180º
210º
240º
270º
300º
330º
●
Dense non-aqueous-phase liquids plume
EXPLANATIONObservation well monitored duringpumping test
High transmissivity path
Joint sets in Niagara Falls area (Gross and Engelder, 1991)
87-15(1)
87-15(1)
87-16(1)87-13(1)
B-10(1)
87-11(1)
87-08(1)
87-04(1)
0 0.5 1 1.5 2 2.5
Directional diffusivityin [ft2/s]1/2
..
..
..
.
.
200 ft
2
/d, indicating that values were skewed toward the higher end of the range. Transmissivity estimated from the pumping tests was about 5 times greater than that estimated from the slug tests.
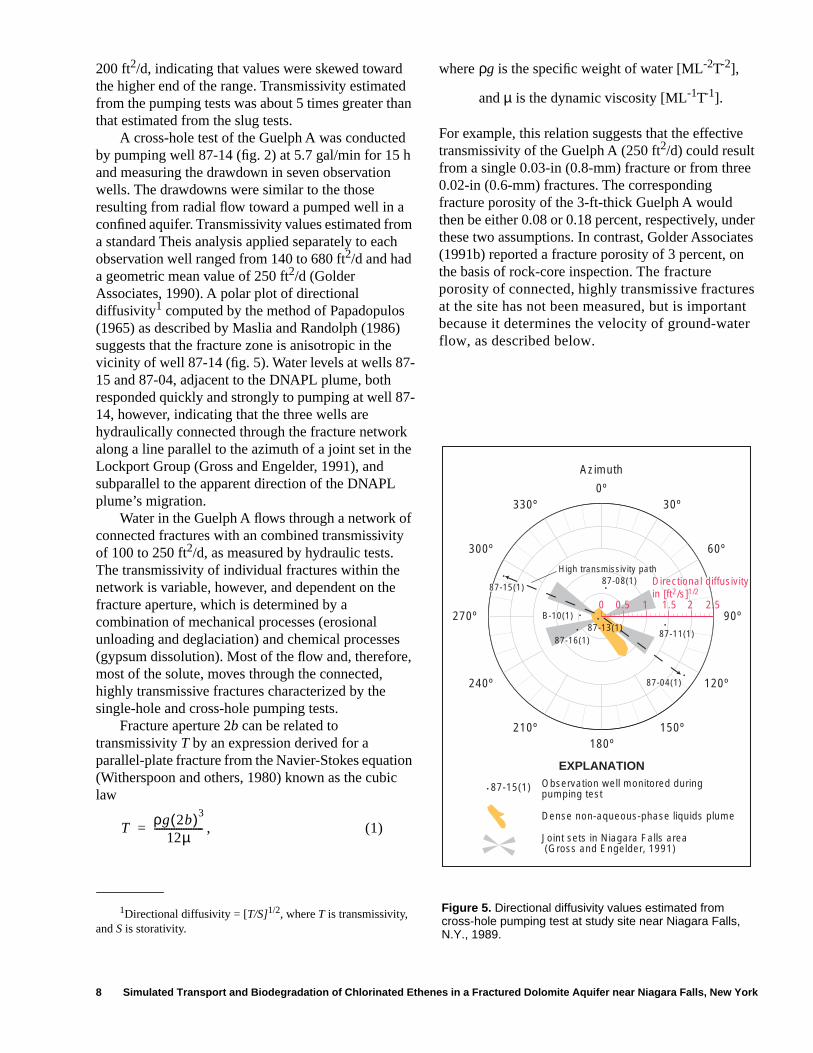
A cross-hole test of the Guelph A was conducted by pumping well 87-14 (fig. 2) at 5.7 gal/min for 15 h and measuring the drawdown in seven observation wells. The drawdowns were similar to the those resulting from radial flow toward a pumped well in a confined aquifer. Transmissivity values estimated from a standard Theis analysis applied separately to each observation well ranged from 140 to 680 ft
2
/d and had a geometric mean value of 250 ft
2
/d (Golder Associates, 1990). A polar plot of directional diffusivity
1
computed by the method of Papadopulos (1965) as described by Maslia and Randolph (1986) suggests that the fracture zone is anisotropic in the vicinity of well 87-14 (fig. 5). Water levels at wells 87-15 and 87-04, adjacent to the DNAPL plume, both responded quickly and strongly to pumping at well 87-14, however, indicating that the three wells are hydraulically connected through the fracture network along a line parallel to the azimuth of a joint set in the Lockport Group (Gross and Engelder, 1991), and subparallel to the apparent direction of the DNAPL plume’s migration.
Water in the Guelph A flows through a network of connected fractures with an combined transmissivity of 100 to 250 ft
2
/d, as measured by hydraulic tests. The transmissivity of individual fractures within the network is variable, however, and dependent on the fracture aperture, which is determined by a combination of mechanical processes (erosional unloading and deglaciation) and chemical processes (gypsum dissolution). Most of the flow and, therefore, most of the solute, moves through the connected, highly transmissive fractures characterized by the single-hole and cross-hole pumping tests.
Fracture aperture 2
b
can be related to transmissivity
T
by an expression derived for a parallel-plate fracture from the Navier-Stokes equation (Witherspoon and others, 1980) known as the cubic law
, (1)
where
ρ
g
is the specific weight of water [ML
-2
T
-2
],
and
µ
is the dynamic viscosity [ML
-1
T
-1
]. For example, this relation suggests that the effective transmissivity of the Guelph A (250 ft
2
/d) could result from a single 0.03-in (0.8-mm) fracture or from three 0.02-in (0.6-mm) fractures. The corresponding fracture porosity of the 3-ft-thick Guelph A would then be either 0.08 or 0.18 percent, respectively, under these two assumptions. In contrast, Golder Associates (1991b) reported a fracture porosity of 3 percent, on the basis of rock-core inspection. The fracture porosity of connected, highly transmissive fractures at the site has not been measured, but is important because it determines the velocity of ground-water flow, as described below.
1
Directional diffusivity = [
T/S]
1/2
, where
T
is transmissivity, and
S
is storativity.
Tρg 2b( )3
12µ--------------------=
Figure 5.
Directional diffusivity values estimated from cross-hole pumping test at study site near Niagara Falls, N.Y., 1989.
9
06'
30"
78º 56' 78º 56' 30" 78º 55'
0.25 0.5 MILES
0.25 0.5 KILOMETERS0
0
Bergholtz
rg
Creek
Bergholtz
rg
CreekC
565565
580
570570
575
560
560
560
568
56956
580
570570
575
76767
567
565667
56
B. January 1995yyyA. August 1990t
Neutralization pond
..
570
Monitoring wellRecovery well pumped in 1995
EXPLANATION
LINE OF EQUAL HYDRAULIC HEAD, IN FEET – Interval varies. Datum is sea level. Arrows indicate direction of ground-water flow
Dense non-aqueous-phase liquid plume in 1990
Aqueous phase plume in 1990
.
.
....
....
...
......
.
........
.............
..
.
.
.
...
..
.
..
.
.....
.
.
......
.
..
....
....
.
..
.
.
.
.
.
......
.
.
.
.
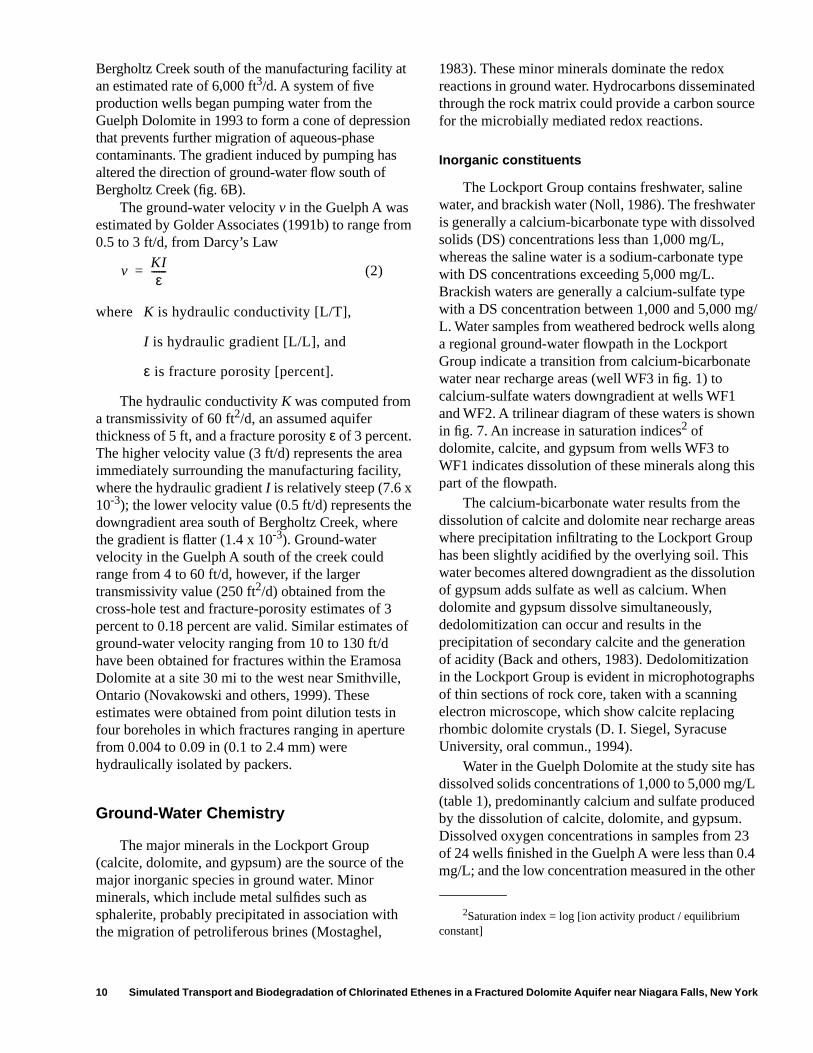
Ground-Water Flow
Ground water flows through the Lockport Group southward and westward from recharge areas near the Niagara Escarpment toward perennial streams, the Niagara River, and outcrops along the Niagara River gorge (fig. 1). The glacial sediments overlying the Lockport Group act as a confining unit that impedes the flow of water to or from the more permeable weathered bedrock below. Yager (1996) suggested that ground water in low-lying areas near the Niagara River could discharge upward from the weathered bedrock through the glacial material toward land surface. That hypothesis was refuted in this study when the hydraulic gradient in saturated glacial sediments near the Niagara River was found to be
consistently downward (from land surface toward the weathered bedrock) from the winter of 1998 through the fall of 1999, as indicated by pressure transducers installed in sealed boreholes at well WF2 (fig. 1).
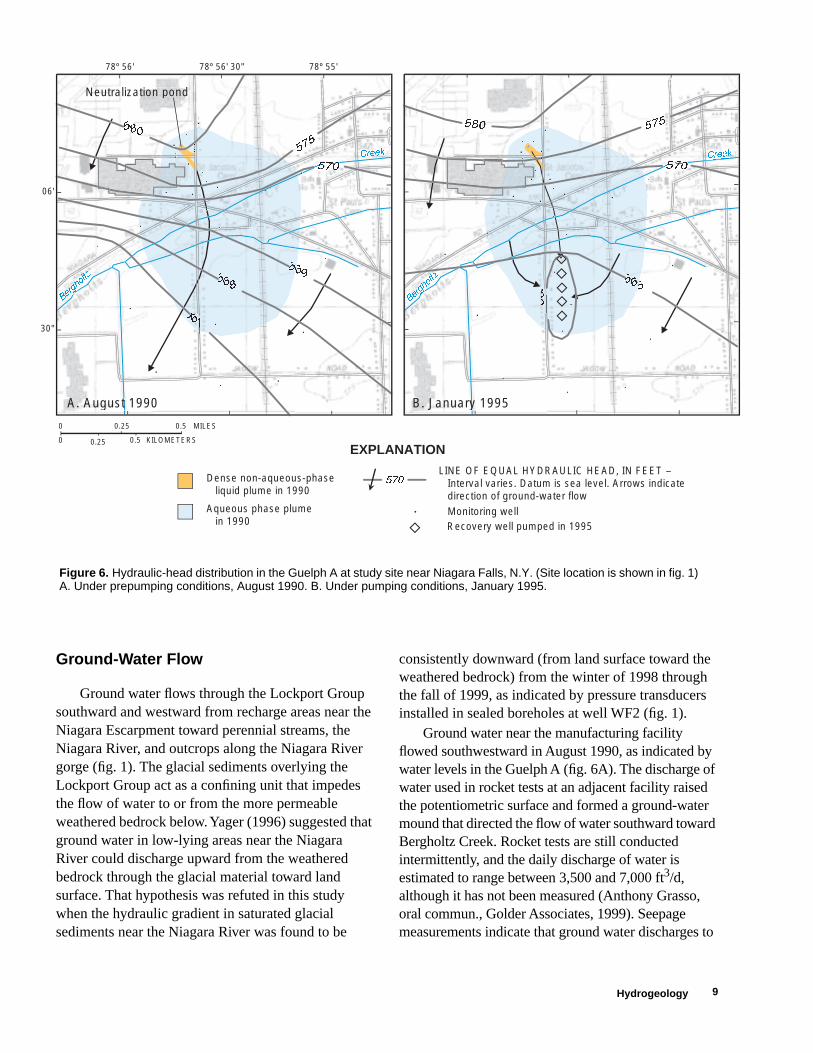
Ground water near the manufacturing facility flowed southwestward in August 1990, as indicated by water levels in the Guelph A (fig. 6A). The discharge of water used in rocket tests at an adjacent facility raised the potentiometric surface and formed a ground-water mound that directed the flow of water southward toward Bergholtz Creek. Rocket tests are still conducted intermittently, and the daily discharge of water is estimated to range between 3,500 and 7,000 ft
3
/d, although it has not been measured (Anthony Grasso, oral commun., Golder Associates, 1999). Seepage measurements indicate that ground water discharges to
Figure 6.
Hydraulic-head distribution in the Guelph A at study site near Niagara Falls, N.Y. (Site location is shown in fig. 1) A. Under prepumping conditions, August 1990. B. Under pumping conditions, January 1995.
Hydrogeology
10 Simulated Transport and Biodegradation of Chlorinated Ethenes in a Fractured Dolomite Aquifer near Niagara Falls, New York
Bergholtz Creek south of the manufacturing facility at an estimated rate of 6,000 ft
3
/d. A system of five production wells began pumping water from the Guelph Dolomite in 1993 to form a cone of depression that prevents further migration of aqueous-phase contaminants. The gradient induced by pumping has altered the direction of ground-water flow south of Bergholtz Creek (fig. 6B).
The ground-water velocity
v
in the Guelph A was estimated by Golder Associates (1991b) to range from 0.5 to 3 ft/d, from Darcy’s Law
(2)
where
K
is hydraulic conductivity [L/T],
I
is hydraulic gradient [L/L], and
ε
is fracture porosity [percent].
The hydraulic conductivity
K
was computed from a transmissivity of 60 ft
2
/d, an assumed aquifer thickness of 5 ft, and a fracture porosity
ε
of 3 percent. The higher velocity value (3 ft/d) represents the area immediately surrounding the manufacturing facility, where the hydraulic gradient
I
is relatively steep (7.6 x 10
-3
); the lower velocity value (0.5 ft/d) represents the downgradient area south of Bergholtz Creek, where the gradient is flatter (1.4 x 10
-3
). Ground-water velocity in the Guelph A south of the creek could range from 4 to 60 ft/d, however, if the larger transmissivity value (250 ft
2
/d) obtained from the cross-hole test and fracture-porosity estimates of 3 percent to 0.18 percent are valid. Similar estimates of ground-water velocity ranging from 10 to 130 ft/d have been obtained for fractures within the Eramosa Dolomite at a site 30 mi to the west near Smithville, Ontario (Novakowski and others, 1999). These estimates were obtained from point dilution tests in four boreholes in which fractures ranging in aperture from 0.004 to 0.09 in (0.1 to 2.4 mm) were hydraulically isolated by packers.
Ground-Water Chemistry
The major minerals in the Lockport Group (calcite, dolomite, and gypsum) are the source of the major inorganic species in ground water. Minor minerals, which include metal sulfides such as sphalerite, probably precipitated in association with the migration of petroliferous brines (Mostaghel,
1983). These minor minerals dominate the redox reactions in ground water. Hydrocarbons disseminated through the rock matrix could provide a carbon source for the microbially mediated redox reactions.
Inorganic constituents
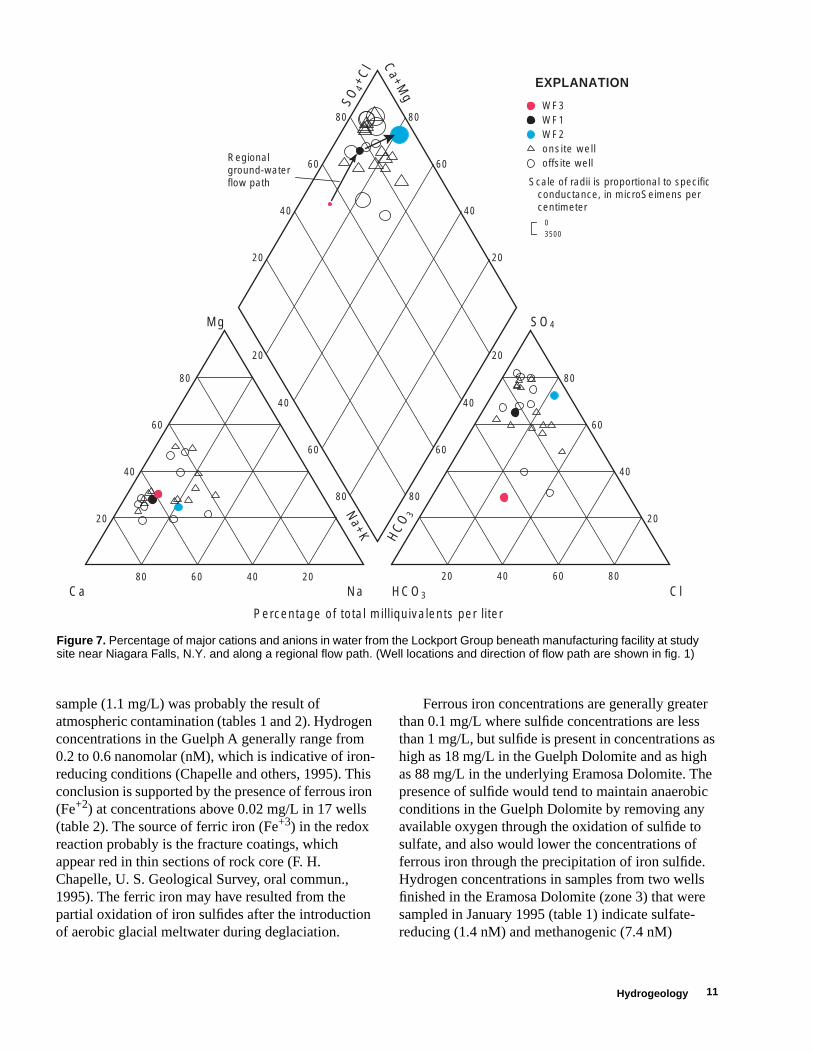
The Lockport Group contains freshwater, saline water, and brackish water (Noll, 1986). The freshwater is generally a calcium-bicarbonate type with dissolved solids (DS) concentrations less than 1,000 mg/L, whereas the saline water is a sodium-carbonate type with DS concentrations exceeding 5,000 mg/L. Brackish waters are generally a calcium-sulfate type with a DS concentration between 1,000 and 5,000 mg/L. Water samples from weathered bedrock wells along a regional ground-water flowpath in the Lockport Group indicate a transition from calcium-bicarbonate water near recharge areas (well WF3 in fig. 1) to calcium-sulfate waters downgradient at wells WF1 and WF2. A trilinear diagram of these waters is shown in fig. 7. An increase in saturation indices
2
of dolomite, calcite, and gypsum from wells WF3 to WF1 indicates dissolution of these minerals along this part of the flowpath.
The calcium-bicarbonate water results from the dissolution of calcite and dolomite near recharge areas where precipitation infiltrating to the Lockport Group has been slightly acidified by the overlying soil. This water becomes altered downgradient as the dissolution of gypsum adds sulfate as well as calcium. When dolomite and gypsum dissolve simultaneously, dedolomitization can occur and results in the precipitation of secondary calcite and the generation of acidity (Back and others, 1983). Dedolomitization in the Lockport Group is evident in microphotographs of thin sections of rock core, taken with a scanning electron microscope, which show calcite replacing rhombic dolomite crystals (D. I. Siegel, Syracuse University, oral commun., 1994).
Water in the Guelph Dolomite at the study site has dissolved solids concentrations of 1,000 to 5,000 mg/L (table 1), predominantly calcium and sulfate produced by the dissolution of calcite, dolomite, and gypsum. Dissolved oxygen concentrations in samples from 23 of 24 wells finished in the Guelph A were less than 0.4 mg/L; and the low concentration measured in the other
vKIε
------=
2
Saturation index = log [ion activity product / equilibrium constant]
11
EXPLANATION
WF3WF1WF2onsite welloffsite well
0 3500
Scale of radii is proportional to specific conductance, in microSeimens per centimeter
Regionalground-waterflow path
20
20
40
40
60
60
80
80
20
40
60
80
20
40
60
80
Ca+M
g
SO 4
+Cl
80 60 40 20 20 40 60 80
20
40
60
80 80
60
40
20
Mg SO4
Ca Na HCO3 Cl
Na+K H
CO 3
Percentage of total milliquivalents per liter
sample (1.1 mg/L) was probably the result of atmospheric contamination (tables 1 and 2). Hydrogen concentrations in the Guelph A generally range from 0.2 to 0.6 nanomolar (nM), which is indicative of iron-reducing conditions (Chapelle and others, 1995). This conclusion is supported by the presence of ferrous iron (Fe
+2
) at concentrations above 0.02 mg/L in 17 wells (table 2). The source of ferric iron (Fe
+3
) in the redox reaction probably is the fracture coatings, which appear red in thin sections of rock core (F. H. Chapelle, U. S. Geological Survey, oral commun., 1995). The ferric iron may have resulted from the partial oxidation of iron sulfides after the introduction of aerobic glacial meltwater during deglaciation.
Ferrous iron concentrations are generally greater than 0.1 mg/L where sulfide concentrations are less than 1 mg/L, but sulfide is present in concentrations as high as 18 mg/L in the Guelph Dolomite and as high as 88 mg/L in the underlying Eramosa Dolomite. The presence of sulfide would tend to maintain anaerobic conditions in the Guelph Dolomite by removing any available oxygen through the oxidation of sulfide to sulfate, and also would lower the concentrations of ferrous iron through the precipitation of iron sulfide. Hydrogen concentrations in samples from two wells finished in the Eramosa Dolomite (zone 3) that were sampled in January 1995 (table 1) indicate sulfate-reducing (1.4 nM) and methanogenic (7.4 nM)
Figure 7.
Percentage of major cations and anions in water from the Lockport Group beneath manufacturing facility at study site near Niagara Falls, N.Y. and along a regional flow path. (Well locations and direction of flow path are shown in fig. 1)
Hydrogeology
12S
imulated T
ransport and Biodegradation of C
hlorinated Ethenes in a F
ractured Dolom
ite Aquifer near N
iagara Falls, N
ew Y
ork
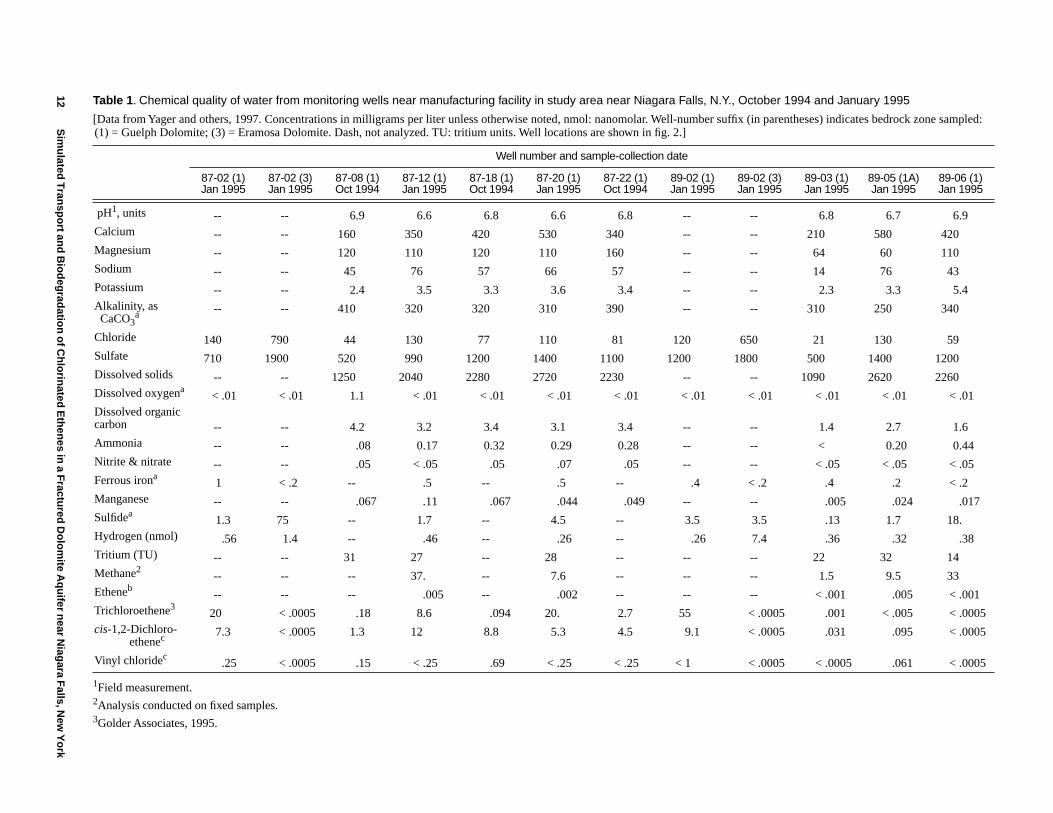
Table 1
. Chemical quality of water from monitoring wells near manufacturing facility in study area near Niagara Falls, N.Y., October 1994 and January 1995
[Data from Yager and others, 1997. Concentrations in milligrams per liter unless otherwise noted, nmol: nanomolar. Well-number suffix (in parentheses) indicates bedrock zone sampled: (1) = Guelph Dolomite; (3) = Eramosa Dolomite. Dash, not analyzed. TU: tritium units. Well locations are shown in fig. 2.]
Well number and sample-collection date
87-02 (1) Jan 1995
87-02 (3) Jan 1995
87-08 (1)Oct 1994
87-12 (1) Jan 1995
87-18 (1)Oct 1994
87-20 (1) Jan 1995
87-22 (1)Oct 1994
89-02 (1) Jan 1995
89-02 (3) Jan 1995
89-03 (1) Jan 1995
89-05 (1A) Jan 1995
89-06 (1) Jan 1995
pH
1
, units
1
Field measurement.
-- -- 6.9 6.6 6.8 6.6 6.8 -- -- 6.8 6.7 6.9Calcium -- -- 160 350 420 530 340 -- -- 210 580 420Magnesium -- -- 120 110 120 110 160 -- -- 64 60 110Sodium -- -- 45 76 57 66 57 -- -- 14 76 43Potassium -- -- 2.4 3.5 3.3 3.6 3.4 -- -- 2.3 3.3 5.4Alkalinity, as CaCO
3a
-- -- 410 320 320 310 390 -- -- 310 250 340
Chloride 140 790 44 130 77 110 81 120 650 21 130 59Sulfate 710 1900 520 990 1200 1400 1100 1200 1800 500 1400 1200Dissolved solids -- -- 1250 2040 2280 2720 2230 -- -- 1090 2620 2260Dissolved oxygen
a
< .01 < .01 1.1 < .01 < .01 < .01 < .01 < .01 < .01 < .01 < .01 < .01Dissolved organic carbon -- -- 4.2 3.2 3.4 3.1 3.4 -- -- 1.4 2.7 1.6Ammonia -- -- .08 0.17 0.32 0.29 0.28 -- -- < 0.20 0.44Nitrite & nitrate -- -- .05 < .05 .05 .07 .05 -- -- < .05 < .05 < .05Ferrous iron
a
1 < .2 -- .5 -- .5 -- .4 < .2 .4 .2 < .2Manganese -- -- .067 .11 .067 .044 .049 -- -- .005 .024 .017Sulfide
a
1.3 75 -- 1.7 -- 4.5 -- 3.5 3.5 .13 1.7 18.Hydrogen (nmol) .56 1.4 -- .46 -- .26 -- .26 7.4 .36 .32 .38Tritium (TU) -- -- 31 27 -- 28 -- -- -- 22 32 14Methane
2
2
Analysis conducted on fixed samples.
-- -- -- 37. -- 7.6 -- -- -- 1.5 9.5 33Ethene
b
-- -- -- .005 -- .002 -- -- -- < .001 .005 < .001Trichloroethene
3
3
Golder Associates, 1995.
20 < .0005 .18 8.6 .094 20. 2.7 55 < .0005 .001 < .005 < .0005
cis
-1,2-Dichloro-ethene
c
7.3 < .0005 1.3 12 8.8 5.3 4.5 9.1 < .0005 .031 .095 < .0005
Vinyl chloride
c
.25 < .0005 .15 < .25 .69 < .25 < .25 < 1 < .0005 < .0005 .061 < .0005
13
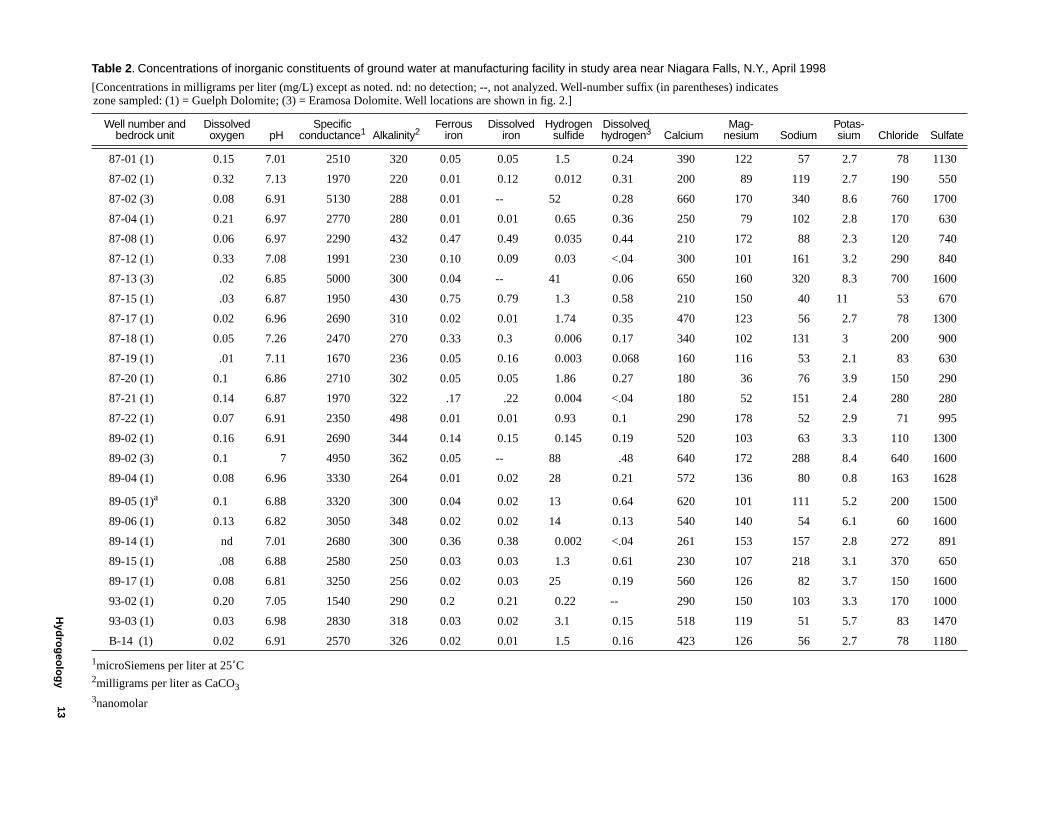
Table 2
. Concentrations of inorganic constituents of ground water at manufacturing facility in study area near Niagara Falls, N.Y., April 1998
[Concentrations in milligrams per liter (mg/L) except as noted. nd: no detection; --, not analyzed. Well-number suffix (in parentheses) indicates zone sampled: (1) = Guelph Dolomite; (3) = Eramosa Dolomite. Well locations are shown in fig. 2.]
Well number and bedrock unit
Dissolved oxygen pH
Specific conductance
1
1
microSiemens per liter at 25˚C
Alkalinity
2
2
milligrams per liter as CaCO
3
Ferrous iron
Dissolved iron
Hydrogen sulfide
Dissolved hydrogen
3
3
nanomolar
CalciumMag-
nesium SodiumPotas-sium Chloride Sulfate
87-01 (1) 0.15 7.01 2510 320 0.05 0.05 1.5 0.24 390 122 57 2.7 78 1130
87-02 (1) 0.32 7.13 1970 220 0.01 0.12 0.012 0.31 200 89 119 2.7 190 550
87-02 (3) 0.08 6.91 5130 288 0.01 -- 52 0.28 660 170 340 8.6 760 1700
87-04 (1) 0.21 6.97 2770 280 0.01 0.01 0.65 0.36 250 79 102 2.8 170 630
87-08 (1) 0.06 6.97 2290 432 0.47 0.49 0.035 0.44 210 172 88 2.3 120 740
87-12 (1) 0.33 7.08 1991 230 0.10 0.09 0.03 <.04 300 101 161 3.2 290 840
87-13 (3) .02 6.85 5000 300 0.04 -- 41 0.06 650 160 320 8.3 700 1600
87-15 (1) .03 6.87 1950 430 0.75 0.79 1.3 0.58 210 150 40 11 53 670
87-17 (1) 0.02 6.96 2690 310 0.02 0.01 1.74 0.35 470 123 56 2.7 78 1300
87-18 (1) 0.05 7.26 2470 270 0.33 0.3 0.006 0.17 340 102 131 3 200 900
87-19 (1) .01 7.11 1670 236 0.05 0.16 0.003 0.068 160 116 53 2.1 83 630
87-20 (1) 0.1 6.86 2710 302 0.05 0.05 1.86 0.27 180 36 76 3.9 150 290
87-21 (1) 0.14 6.87 1970 322 .17 .22 0.004 <.04 180 52 151 2.4 280 280
87-22 (1) 0.07 6.91 2350 498 0.01 0.01 0.93 0.1 290 178 52 2.9 71 995
89-02 (1) 0.16 6.91 2690 344 0.14 0.15 0.145 0.19 520 103 63 3.3 110 1300
89-02 (3) 0.1 7 4950 362 0.05 -- 88 .48 640 172 288 8.4 640 1600
89-04 (1) 0.08 6.96 3330 264 0.01 0.02 28 0.21 572 136 80 0.8 163 1628
89-05 (1)
a
0.1 6.88 3320 300 0.04 0.02 13 0.64 620 101 111 5.2 200 1500
89-06 (1) 0.13 6.82 3050 348 0.02 0.02 14 0.13 540 140 54 6.1 60 1600
89-14 (1) nd 7.01 2680 300 0.36 0.38 0.002 <.04 261 153 157 2.8 272 891
89-15 (1) .08 6.88 2580 250 0.03 0.03 1.3 0.61 230 107 218 3.1 370 650
89-17 (1) 0.08 6.81 3250 256 0.02 0.03 25 0.19 560 126 82 3.7 150 1600
93-02 (1) 0.20 7.05 1540 290 0.2 0.21 0.22 -- 290 150 103 3.3 170 1000
93-03 (1) 0.03 6.98 2830 318 0.03 0.02 3.1 0.15 518 119 51 5.7 83 1470
B-14 (1) 0.02 6.91 2570 326 0.02 0.01 1.5 0.16 423 126 56 2.7 78 1180
Hydrogeology
14 Simulated Transport and Biodegradation of Chlorinated Ethenes in a Fractured Dolomite Aquifer near Niagara Falls, New York
RANGE OF VALUES
within contaminant plume, 4 samples
along plume boundary, 2 samples
3-year moving-average tritium activity, decayed to January 1995
1952 1954 1956 1958 1960 1962 1964 1966 1968 1970 1972 1974 1976 1978 1980 1982 1984 1986 1988 1990 1992 19940
200
0
20
40
60
80
100
120
140
160
180T
RIT
IUM
AC
TIV
ITY,
CO
RR
EC
TE
D F
OR
RA
DIO
AC
TIV
E D
EC
AY T
O 1
995,
IN T
RIT
IUM
UN
ITS
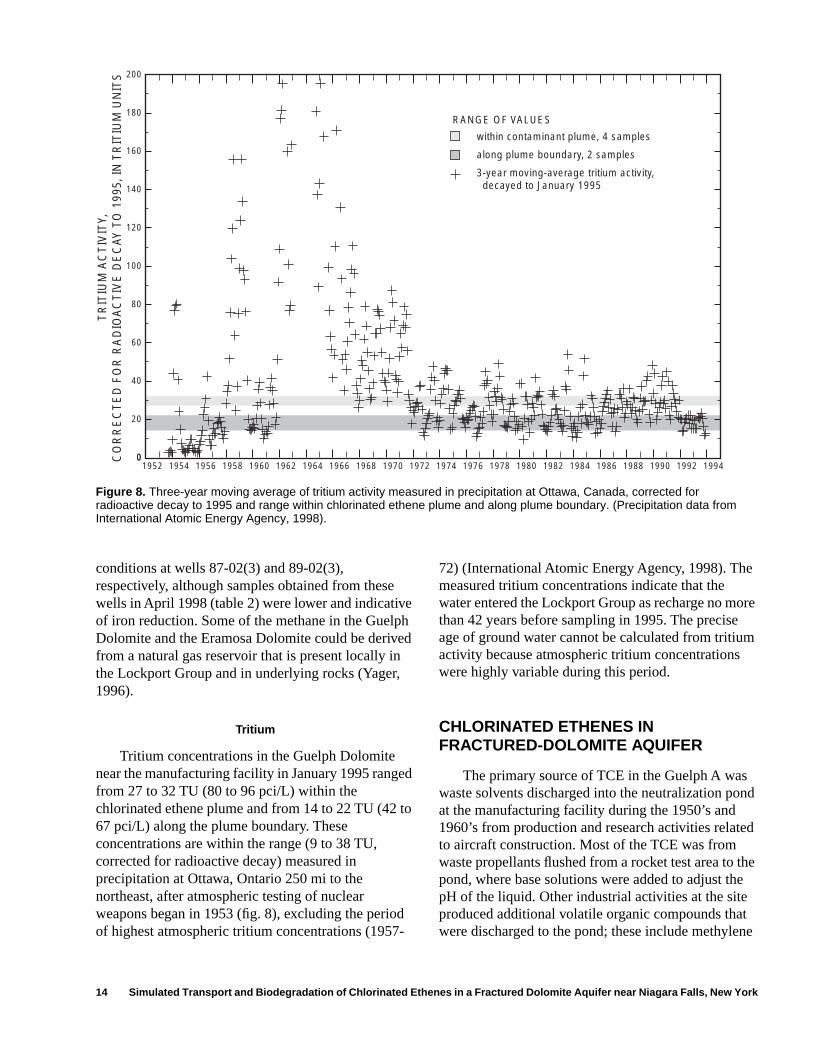
Figure 8.
Three-year moving average of tritium activity measured in precipitation at Ottawa, Canada, corrected for radioactive decay to 1995 and range within chlorinated ethene plume and along plume boundary. (Precipitation data from International Atomic Energy Agency, 1998).
conditions at wells 87-02(3) and 89-02(3), respectively, although samples obtained from these wells in April 1998 (table 2) were lower and indicative of iron reduction. Some of the methane in the Guelph Dolomite and the Eramosa Dolomite could be derived from a natural gas reservoir that is present locally in the Lockport Group and in underlying rocks (Yager, 1996).
Tritium
Tritium concentrations in the Guelph Dolomite near the manufacturing facility in January 1995 ranged from 27 to 32 TU (80 to 96 pci/L) within the chlorinated ethene plume and from 14 to 22 TU (42 to 67 pci/L) along the plume boundary. These concentrations are within the range (9 to 38 TU, corrected for radioactive decay) measured in precipitation at Ottawa, Ontario 250 mi to the northeast, after atmospheric testing of nuclear weapons began in 1953 (fig. 8), excluding the period of highest atmospheric tritium concentrations (1957-
72) (International Atomic Energy Agency, 1998). The measured tritium concentrations indicate that the water entered the Lockport Group as recharge no more than 42 years before sampling in 1995. The precise age of ground water cannot be calculated from tritium activity because atmospheric tritium concentrations were highly variable during this period.
CHLORINATED ETHENES IN FRACTURED-DOLOMITE AQUIFER
The primary source of TCE in the Guelph A was waste solvents discharged into the neutralization pond at the manufacturing facility during the 1950’s and 1960’s from production and research activities related to aircraft construction. Most of the TCE was from waste propellants flushed from a rocket test area to the pond, where base solutions were added to adjust the pH of the liquid. Other industrial activities at the site produced additional volatile organic compounds that were discharged to the pond; these include methylene
15
chloride and acetone, which also were present in the waste propellants. The neutralization pond was filled and capped in 1987.
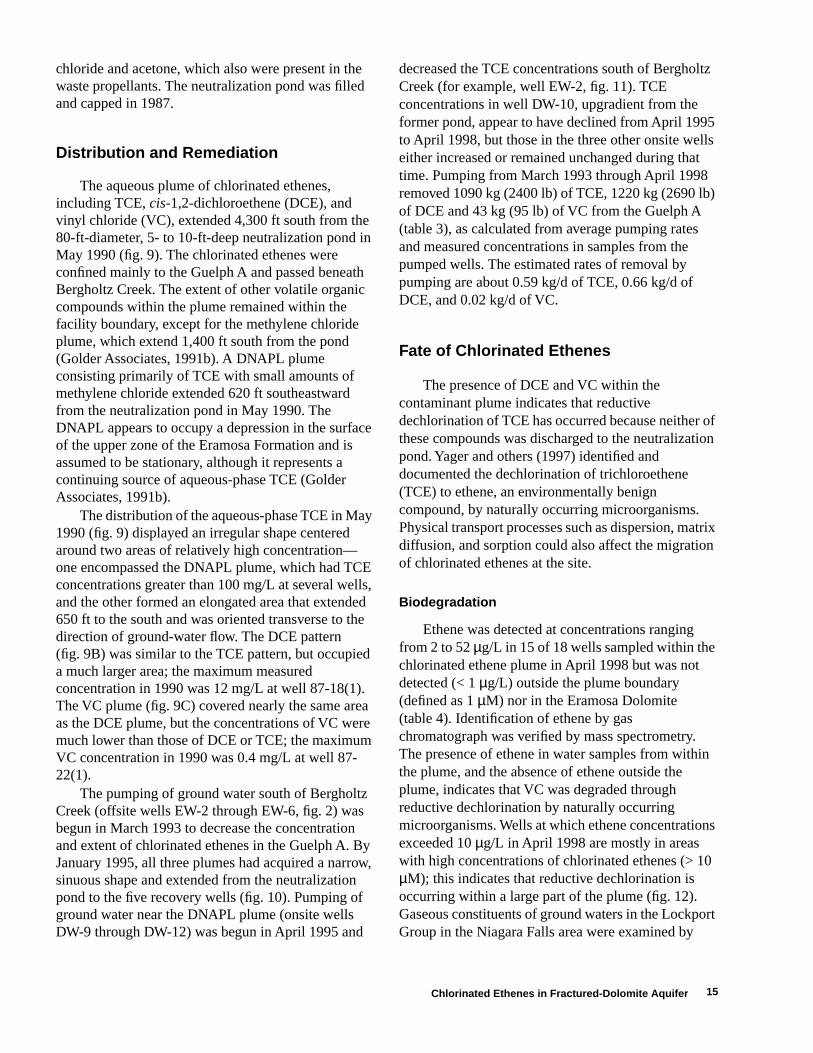
Distribution and Remediation
The aqueous plume of chlorinated ethenes, including TCE, cis-1,2-dichloroethene (DCE), and vinyl chloride (VC), extended 4,300 ft south from the 80-ft-diameter, 5- to 10-ft-deep neutralization pond in May 1990 (fig. 9). The chlorinated ethenes were confined mainly to the Guelph A and passed beneath Bergholtz Creek. The extent of other volatile organic compounds within the plume remained within the facility boundary, except for the methylene chloride plume, which extend 1,400 ft south from the pond (Golder Associates, 1991b). A DNAPL plume consisting primarily of TCE with small amounts of methylene chloride extended 620 ft southeastward from the neutralization pond in May 1990. The DNAPL appears to occupy a depression in the surface of the upper zone of the Eramosa Formation and is assumed to be stationary, although it represents a continuing source of aqueous-phase TCE (Golder Associates, 1991b).
The distribution of the aqueous-phase TCE in May 1990 (fig. 9) displayed an irregular shape centered around two areas of relatively high concentration— one encompassed the DNAPL plume, which had TCE concentrations greater than 100 mg/L at several wells, and the other formed an elongated area that extended 650 ft to the south and was oriented transverse to the direction of ground-water flow. The DCE pattern (fig. 9B) was similar to the TCE pattern, but occupied a much larger area; the maximum measured concentration in 1990 was 12 mg/L at well 87-18(1). The VC plume (fig. 9C) covered nearly the same area as the DCE plume, but the concentrations of VC were much lower than those of DCE or TCE; the maximum VC concentration in 1990 was 0.4 mg/L at well 87-22(1).
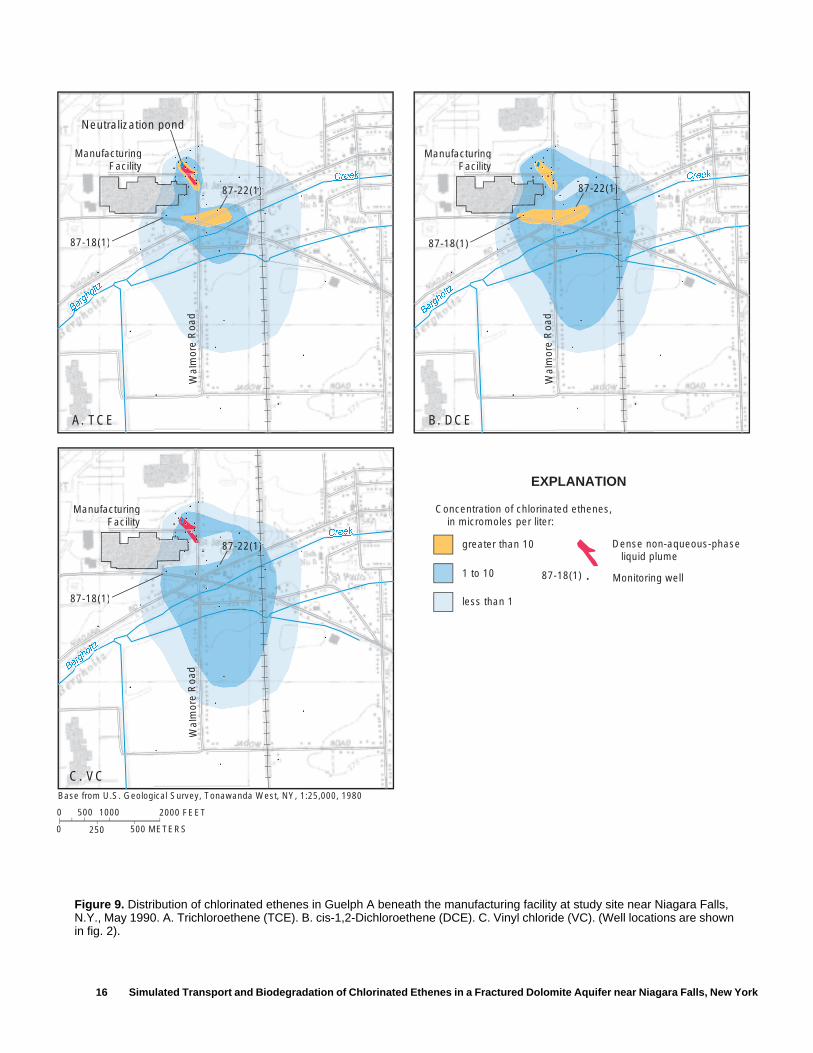
The pumping of ground water south of Bergholtz Creek (offsite wells EW-2 through EW-6, fig. 2) was begun in March 1993 to decrease the concentration and extent of chlorinated ethenes in the Guelph A. By January 1995, all three plumes had acquired a narrow, sinuous shape and extended from the neutralization pond to the five recovery wells (fig. 10). Pumping of ground water near the DNAPL plume (onsite wells DW-9 through DW-12) was begun in April 1995 and
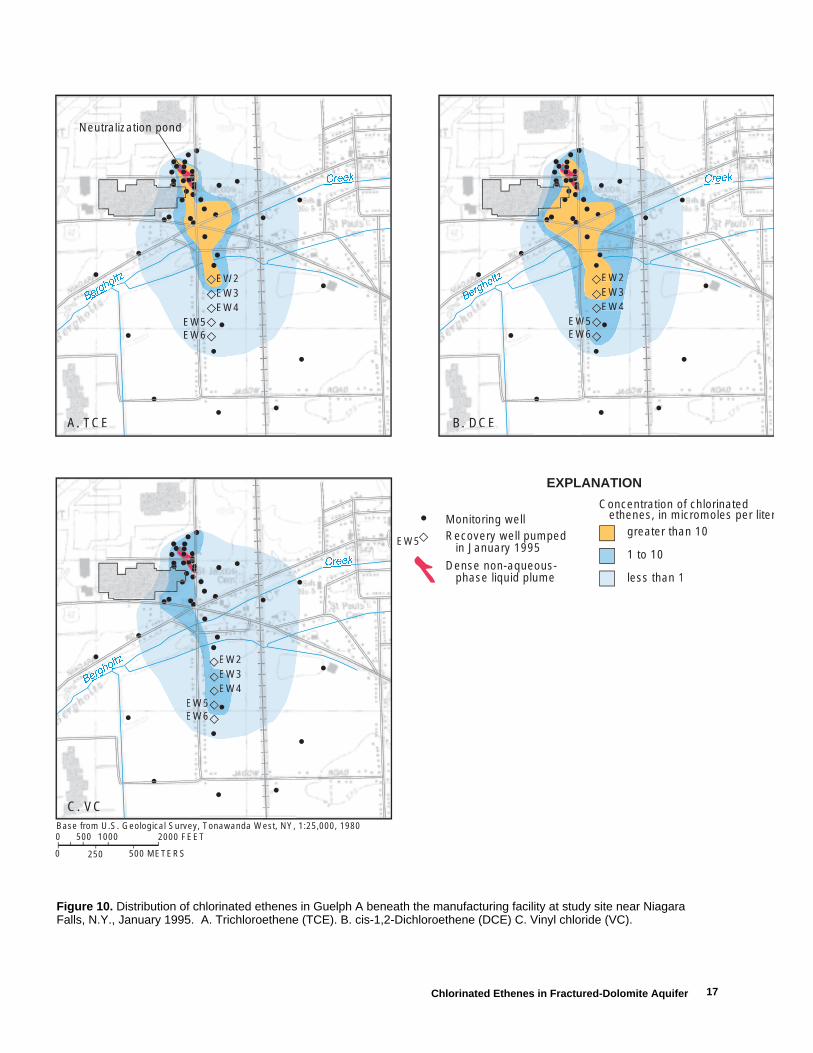
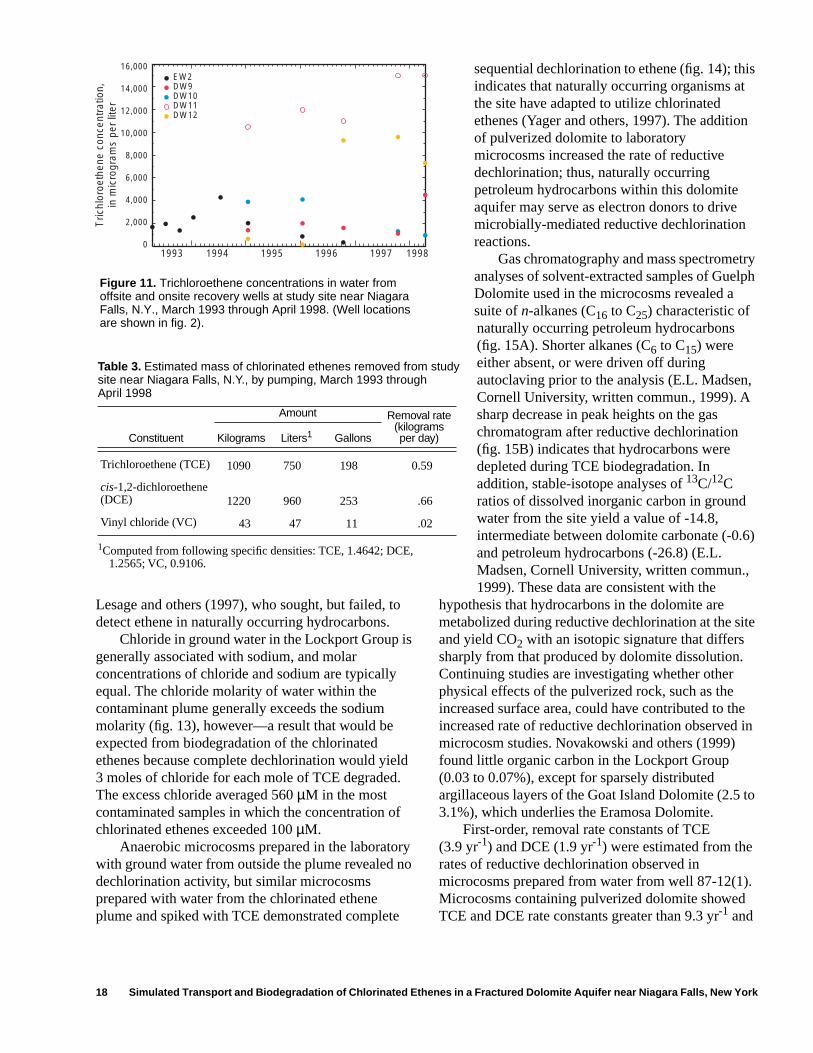
decreased the TCE concentrations south of Bergholtz Creek (for example, well EW-2, fig. 11). TCE concentrations in well DW-10, upgradient from the former pond, appear to have declined from April 1995 to April 1998, but those in the three other onsite wells either increased or remained unchanged during that time. Pumping from March 1993 through April 1998 removed 1090 kg (2400 lb) of TCE, 1220 kg (2690 lb) of DCE and 43 kg (95 lb) of VC from the Guelph A (table 3), as calculated from average pumping rates and measured concentrations in samples from the pumped wells. The estimated rates of removal by pumping are about 0.59 kg/d of TCE, 0.66 kg/d of DCE, and 0.02 kg/d of VC.
Fate of Chlorinated Ethenes
The presence of DCE and VC within the contaminant plume indicates that reductive dechlorination of TCE has occurred because neither of these compounds was discharged to the neutralization pond. Yager and others (1997) identified and documented the dechlorination of trichloroethene (TCE) to ethene, an environmentally benign compound, by naturally occurring microorganisms. Physical transport processes such as dispersion, matrix diffusion, and sorption could also affect the migration of chlorinated ethenes at the site.
Biodegradation
Ethene was detected at concentrations ranging from 2 to 52 µg/L in 15 of 18 wells sampled within the chlorinated ethene plume in April 1998 but was not detected (< 1 µg/L) outside the plume boundary (defined as 1 µM) nor in the Eramosa Dolomite (table 4). Identification of ethene by gas chromatograph was verified by mass spectrometry. The presence of ethene in water samples from within the plume, and the absence of ethene outside the plume, indicates that VC was degraded through reductive dechlorination by naturally occurring microorganisms. Wells at which ethene concentrations exceeded 10 µg/L in April 1998 are mostly in areas with high concentrations of chlorinated ethenes (> 10 µM); this indicates that reductive dechlorination is occurring within a large part of the plume (fig. 12). Gaseous constituents of ground waters in the Lockport Group in the Niagara Falls area were examined by
Chlorinated Ethenes in Fractured-Dolomite Aquifer
16 Simulated Transport and Biodegradation of Chlorinated Ethenes in a Fractured Dolomite Aquifer near Niagara Falls, New York
250 500 METERS
2000 FEET
0
0 1000500
..
Bergholtz
Berghol
Bergholtz
ergholt
Bergholtz
e
CreekCreek CreekCre
CreekCree
Neutralization pond
Wal
mor
e e R
oad
Wal
mor
e re R
oad
Wal
mor
e R
e R
oad
EXPLANATION
Monitoring well
ManufacturingFacility
ManufacturingFacility
ManufacturingFacility
Base from U.S. Geological Survey, Tonawanda West, NY, 1:25,000, 1980
greater than 10
1 to 10
87-18(1)
less than 1
Concentration of chlorinated ethenes, in micromoles per liter:
Dense non-aqueous-phase liquid plume
A. TCE B. DCE
C. VC
87-18(1)
87-18(1)
87-22(1))))))) 87-22(1)))87
))87-22(1)7-22(1))))))
87-18(1)
...
..
.
..
..
......
.... .....
..... .....................
. . ..... ...
.
.
...
.
.
.
.
....
..
.
..
..
...
....... ...
.... ...................
. . ... ..
..
.
.
. .
...
.
.
.
.
...
..
.
..
..
......
....... ......
..... ......................
. . ..... .....
.
.
...
.
.
.
.
Figure 9. Distribution of chlorinated ethenes in Guelph A beneath the manufacturing facility at study site near Niagara Falls, N.Y., May 1990. A. Trichloroethene (TCE). B. cis-1,2-Dichloroethene (DCE). C. Vinyl chloride (VC). (Well locations are shown in fig. 2).
17
250 500 METERS
2000 FEET
0
0 1000500
CreekCre
Bergh
oltz
o
Bergh
CreekCre
Bergh
oltz
CreekCre
Bergh
oltz
o
Berg
Monitoring wellgreater than 10
Concentration of chlorinated ethenes, in micromoles per liter
1 to 10
less than 1
EXPLANATION
Recovery well pumped in January 1995
Dense non-aqueous- phase liquid plume
A. TCE
C. VC
B. DCE
Base from U.S. Geological Survey, Tonawanda West, NY, 1:25,000, 1980
Neutralization pond
W2EWEEW3EWEW4
EW5WW
EW5
EW6WW
W2EWW3EW
4EW4WW5EWWWW66EWWW
EW2EW3EW
W4EWW55EWWW
EW6WW
Figure 10. Distribution of chlorinated ethenes in Guelph A beneath the manufacturing facility at study site near Niagara Falls, N.Y., January 1995. A. Trichloroethene (TCE). B. cis-1,2-Dichloroethene (DCE) C. Vinyl chloride (VC).
Chlorinated Ethenes in Fractured-Dolomite Aquifer
18 Simulated Transport and Biodegradation of Chlorinated Ethenes in a Fractured Dolomite Aquifer near Niagara Falls, New York
Lesage and others (1997), who sought, but failed, to detect ethene in naturally occurring hydrocarbons.
Chloride in ground water in the Lockport Group is generally associated with sodium, and molar concentrations of chloride and sodium are typically equal. The chloride molarity of water within the contaminant plume generally exceeds the sodium molarity (fig. 13), however—a result that would be expected from biodegradation of the chlorinated ethenes because complete dechlorination would yield 3 moles of chloride for each mole of TCE degraded. The excess chloride averaged 560 µM in the most contaminated samples in which the concentration of chlorinated ethenes exceeded 100 µM.
Anaerobic microcosms prepared in the laboratory with ground water from outside the plume revealed no dechlorination activity, but similar microcosms prepared with water from the chlorinated ethene plume and spiked with TCE demonstrated complete
sequential dechlorination to ethene (fig. 14); this indicates that naturally occurring organisms at the site have adapted to utilize chlorinated ethenes (Yager and others, 1997). The addition of pulverized dolomite to laboratory microcosms increased the rate of reductive dechlorination; thus, naturally occurring petroleum hydrocarbons within this dolomite aquifer may serve as electron donors to drive microbially-mediated reductive dechlorination reactions.
Gas chromatography and mass spectrometry analyses of solvent-extracted samples of Guelph Dolomite used in the microcosms revealed a suite of n-alkanes (C16 to C25) characteristic of naturally occurring petroleum hydrocarbons (fig. 15A). Shorter alkanes (C6 to C15) were either absent, or were driven off during autoclaving prior to the analysis (E.L. Madsen, Cornell University, written commun., 1999). A sharp decrease in peak heights on the gas chromatogram after reductive dechlorination (fig. 15B) indicates that hydrocarbons were depleted during TCE biodegradation. In addition, stable-isotope analyses of 13C/12C ratios of dissolved inorganic carbon in ground water from the site yield a value of -14.8, intermediate between dolomite carbonate (-0.6) and petroleum hydrocarbons (-26.8) (E.L. Madsen, Cornell University, written commun., 1999). These data are consistent with the
hypothesis that hydrocarbons in the dolomite are metabolized during reductive dechlorination at the site and yield CO2 with an isotopic signature that differs sharply from that produced by dolomite dissolution. Continuing studies are investigating whether other physical effects of the pulverized rock, such as the increased surface area, could have contributed to the increased rate of reductive dechlorination observed in microcosm studies. Novakowski and others (1999) found little organic carbon in the Lockport Group (0.03 to 0.07%), except for sparsely distributed argillaceous layers of the Goat Island Dolomite (2.5 to 3.1%), which underlies the Eramosa Dolomite.
First-order, removal rate constants of TCE (3.9 yr-1) and DCE (1.9 yr-1) were estimated from the rates of reductive dechlorination observed in microcosms prepared from water from well 87-12(1). Microcosms containing pulverized dolomite showed TCE and DCE rate constants greater than 9.3 yr-1 and
Table 3. Estimated mass of chlorinated ethenes removed from study site near Niagara Falls, N.Y., by pumping, March 1993 through April 1998
Constituent
Amount Removal rate(kilograms per day)Kilograms Liters1
1Computed from following specific densities: TCE, 1.4642; DCE, 1.2565; VC, 0.9106.
Gallons
Trichloroethene (TCE) 1090 750 198 0.59
cis-1,2-dichloroethene (DCE) 1220 960 253 .66
Vinyl chloride (VC) 43 47 11 .02
Tric
hlor
oeth
ene
conc
entr
atio
n,in
mic
rogr
ams
per
liter
EW2DW9DW10DW11DW12
1993 1994 1995 1996 1997 19980
16,000
2,000
4,000
6,000
8,000
10,000
12,000
14,000
Figure 11. Trichloroethene concentrations in water from offsite and onsite recovery wells at study site near Niagara Falls, N.Y., March 1993 through April 1998. (Well locations are shown in fig. 2).
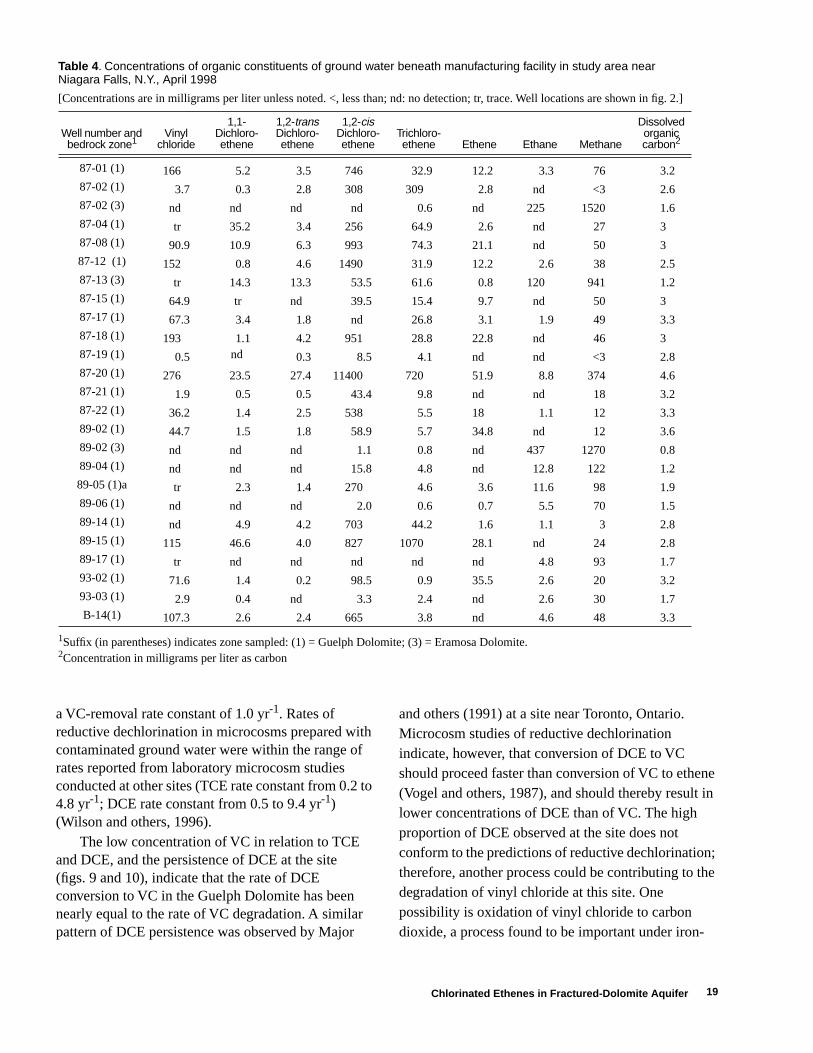
19
Table 4. Concentrations of organic constituents of ground water beneath manufacturing facility in study area near Niagara Falls, N.Y., April 1998
[Concentrations are in milligrams per liter unless noted. <, less than; nd: no detection; tr, trace. Well locations are shown in fig. 2.]
Well number and bedrock zone1
1Suffix (in parentheses) indicates zone sampled: (1) = Guelph Dolomite; (3) = Eramosa Dolomite.
Vinyl chloride
1,1-Dichloro-ethene
1,2-trans Dichloro-ethene
1,2-cis Dichloro-ethene
Trichloro-ethene Ethene Ethane Methane
Dissolved organic carbon2
2Concentration in milligrams per liter as carbon
87-01 (1) 166 5.2 3.5 746 32.9 12.2 3.3 76 3.287-02 (1) 3.7 0.3 2.8 308 309 2.8 nd <3 2.687-02 (3) nd nd nd nd 0.6 nd 225 1520 1.687-04 (1) tr 35.2 3.4 256 64.9 2.6 nd 27 387-08 (1) 90.9 10.9 6.3 993 74.3 21.1 nd 50 387-12 (1) 152 0.8 4.6 1490 31.9 12.2 2.6 38 2.587-13 (3) tr 14.3 13.3 53.5 61.6 0.8 120 941 1.287-15 (1) 64.9 tr nd 39.5 15.4 9.7 nd 50 387-17 (1) 67.3 3.4 1.8 nd 26.8 3.1 1.9 49 3.387-18 (1) 193 1.1 4.2 951 28.8 22.8 nd 46 387-19 (1) 0.5 nd 0.3 8.5 4.1 nd nd <3 2.887-20 (1) 276 23.5 27.4 11400 720 51.9 8.8 374 4.687-21 (1) 1.9 0.5 0.5 43.4 9.8 nd nd 18 3.287-22 (1) 36.2 1.4 2.5 538 5.5 18 1.1 12 3.389-02 (1) 44.7 1.5 1.8 58.9 5.7 34.8 nd 12 3.689-02 (3) nd nd nd 1.1 0.8 nd 437 1270 0.889-04 (1) nd nd nd 15.8 4.8 nd 12.8 122 1.289-05 (1)a tr 2.3 1.4 270 4.6 3.6 11.6 98 1.989-06 (1) nd nd nd 2.0 0.6 0.7 5.5 70 1.589-14 (1) nd 4.9 4.2 703 44.2 1.6 1.1 3 2.889-15 (1) 115 46.6 4.0 827 1070 28.1 nd 24 2.889-17 (1) tr nd nd nd nd nd 4.8 93 1.793-02 (1) 71.6 1.4 0.2 98.5 0.9 35.5 2.6 20 3.293-03 (1) 2.9 0.4 nd 3.3 2.4 nd 2.6 30 1.7B-14(1) 107.3 2.6 2.4 665 3.8 nd 4.6 48 3.3
a VC-removal rate constant of 1.0 yr-1. Rates of reductive dechlorination in microcosms prepared with contaminated ground water were within the range of rates reported from laboratory microcosm studies conducted at other sites (TCE rate constant from 0.2 to 4.8 yr-1; DCE rate constant from 0.5 to 9.4 yr-1) (Wilson and others, 1996).
The low concentration of VC in relation to TCE and DCE, and the persistence of DCE at the site (figs. 9 and 10), indicate that the rate of DCE conversion to VC in the Guelph Dolomite has been nearly equal to the rate of VC degradation. A similar pattern of DCE persistence was observed by Major
and others (1991) at a site near Toronto, Ontario. Microcosm studies of reductive dechlorination indicate, however, that conversion of DCE to VC should proceed faster than conversion of VC to ethene (Vogel and others, 1987), and should thereby result in lower concentrations of DCE than of VC. The high proportion of DCE observed at the site does not conform to the predictions of reductive dechlorination; therefore, another process could be contributing to the degradation of vinyl chloride at this site. One possibility is oxidation of vinyl chloride to carbon dioxide, a process found to be important under iron-
Chlorinated Ethenes in Fractured-Dolomite Aquifer
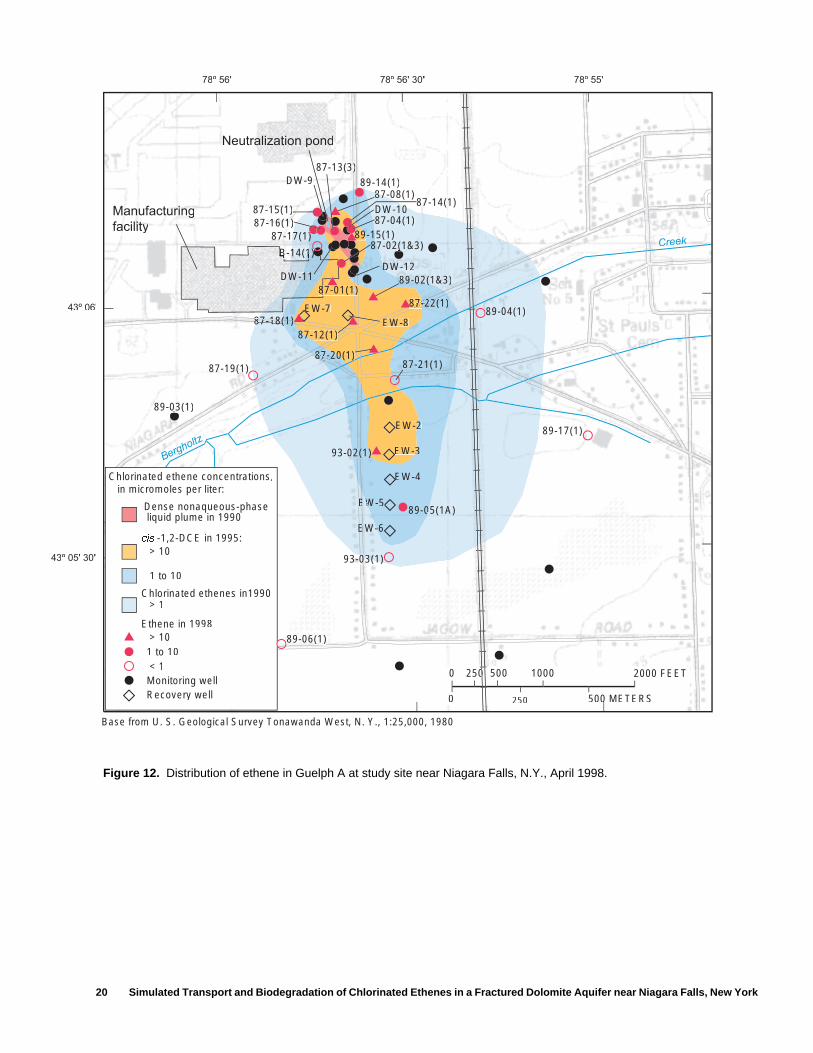
20 Simulated Transport and Biodegradation of Chlorinated Ethenes in a Fractured Dolomite Aquifer near Niagara Falls, New York
250 500 METERS
2000 FEET
0
0 1000500250
43º 06'
43º 05' 30"
78º 56' 78º 56' 30" 78º 55'
cis -1,2-DCE in 1995:
Chlorinated ethene concentrations, in micromoles per liter:
Chlorinated ethenes in1990
Ethene in 1998
Dense nonaqueous-phase liquid plume in 1990
> 10
1 to 10
> 1
Monitoring wellRecovery well
> 101 to 10 < 1
Creek
Bergholtz
Neutralization pond
Manufacturing
facility
Base from U. S. Geological Survey Tonawanda West, N. Y., 1:25,000, 1980
89-04(1)
87-21(1))
89-06(1))
05(1A)89-0
3EW-3E
2EW-2
EW-4E
EWW-5E 5
EW--6EE
93-03(1)-03(1)00
89-17(1)
93-002(1))(2
87-19(1)
89-03(1)
87-87-12(1))1)
8787-20(20(1))887-287
EW-7E887-18((1)87-18(87 18((1)(1)
87-01(1)))889-02(1&3)89-02(1
-22(1)87-87-287-228
EW-8EW
87-177(1)))
87-15(1)87-16(1)
DW-9
DWDW-1-11
B-114(11)B 14(1)))
87-13(3))
0DW-10
DW-12D
15(1)9-189888887-04(1)
87-08(1)87-087-14(1)
89-14(1)
87-02(1&3)87 (
Figure 12. Distribution of ethene in Guelph A at study site near Niagara Falls, N.Y., April 1998.
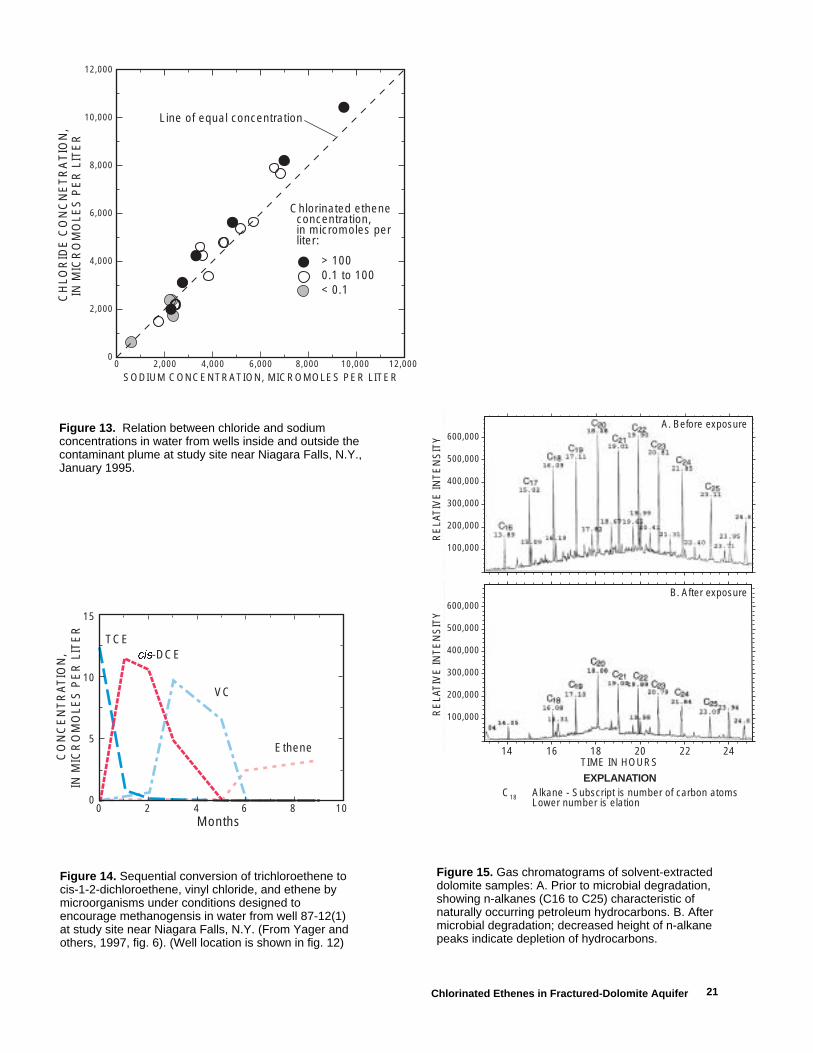
21
12,0000 2,000 4,000 6,000 8,000 10,000
SODIUM CONCENTRATION, MICROMOLES PER LITER
12,000
0
2,000
4,000
6,000
8,000
10,000
CH
LOR
IDE
CO
NC
NE
TR
AT
ION
,IN
MIC
RO
MO
LES
PE
R L
ITE
R
Line of equal concentration
Chlorinated ethene concentration, in micromoles per liter:
> 1000.1 to 100< 0.1
00
5
10
15
2 4 6Months
CO
NC
EN
TR
AT
ION
,IN
MIC
RO
MO
LES
PE
R L
ITE
R
8 10
TCEcis-DCE
VC
Ethene
A. Before exposure
B. After exposure
14 16 18 20 22 24
RE
LAT
IVE
INT
EN
SIT
YR
ELA
TIV
E IN
TE
NS
ITY
600,000
500,000
400,000
300,000
200,000
100,000
600,000
500,000
400,000
300,000
200,000
100,000
TIME IN HOURS
EXPLANATIONC18 Alkane - Subscript is number of carbon atoms
Lower number is elation
Figure 15. Gas chromatograms of solvent-extracted dolomite samples: A. Prior to microbial degradation, showing n-alkanes (C16 to C25) characteristic of naturally occurring petroleum hydrocarbons. B. After microbial degradation; decreased height of n-alkane peaks indicate depletion of hydrocarbons.
Figure 14. Sequential conversion of trichloroethene to cis-1-2-dichloroethene, vinyl chloride, and ethene by microorganisms under conditions designed to encourage methanogensis in water from well 87-12(1) at study site near Niagara Falls, N.Y. (From Yager and others, 1997, fig. 6). (Well location is shown in fig. 12)
Figure 13. Relation between chloride and sodium concentrations in water from wells inside and outside the contaminant plume at study site near Niagara Falls, N.Y., January 1995.
Chlorinated Ethenes in Fractured-Dolomite Aquifer
22 Simulated Transport and Biodegradation of Chlorinated Ethenes in a Fractured Dolomite Aquifer near Niagara Falls, New York
reducing conditions at two sites near Jacksonville, FL., and Plattsburg, N.Y. (Bradley and Chapelle, 1996).
Physical transport processes
The distribution of chlorinated-ethene concentrations at the site reflects several physical processes, such as dispersion, diffusion, and sorption, all of which affect solute transport through the fracture network.
Dispersion, the spreading of a solute front during transport, is a scale-dependent process that is assumed to result from the mixing of solutes that follow differing flow paths. Flow paths through a network of fractures are primarily determined by the connections between fractures; flow occurs primarily along fractures that are interconnected, rather than those that pinch out in some or all directions. Principal flow paths within interconnected fractures coincide with areas of large fracture aperture that transmit the most flow. Consequently, flow converges along the principal (most transmissive) flow paths, and moves most rapidly through those parts of the fracture network. The transmissivity of these principal paths in soluble bedrock, such as dolomite, can be enhanced by dissolution, which reinforces the pattern of preferential flow.
Diffusion is assumed to govern the transfer of solute between mobile water within well-connected fractures and relatively immobile water within poorly connected fractures and the rock matrix. The diffusive mass flux qD between the fracture and regions of immobile water is defined by Tang and others (1981) as
(3)
where ε is porosity [dimensionless], is solute concentration of the immobile water
[ML-3], D′ is the effective diffusion coefficient in the
immobile-water region [L2T], andz is the spatial coordinate in the direction of
diffusive transport [L]. The diffusive flux is directly related to the
concentration gradient and porosity within the immobile-flow region, and inversely related to fracture aperture 2b and, therefore, velocity in the mobile-water region. Diffusion into immobile-water regions slows the propagation of the solute front and can serve
as a secondary source of solute if the concentration within the fracture declines below that in the immobile-water region; this reverses the direction of the concentration gradient.
Sorption of organic chemicals to fracture walls and the rock matrix can slow the propagation of the solute front if organic carbon or iron oxides are present in the rock. The effect of sorption is commonly expressed as a retardation factor R, defined for the rock matrix as
(4)
where ρb is the bulk density of the matrix [ML-3],and Kdm is a distribution coefficient related to the rate of sorption in the matrix [L3M-1].
Novakowski and others (1999) define the retardation factor for a fracture as
(5)
where Kdf is a distribution coefficient related to the rate of sorption in the fracture, and
(6)
where δ is a geometric factor related to matrix porosity ranging from 0.01 to 0.5 (Freeze and Cherry, 1979).
The contaminant plume in the Guelph A in May 1990 (fig. 9) displayed two characteristics that could indicate transport within a fracture network with a nonuniform distribution of fracture aperture. First, the plume was wide relative to its length, which indicates that transverse dispersion, perpendicular to the apparent direction of plume migration, was nearly as large as longitudinal dispersion parallel to the direction of migration, even though transverse dispersion in porous media is typically only a small fraction of the longitudinal dispersion (Sudicky and others, 1983; Garabedian and others, 1991). A similar pattern was observed in the distribution of chloride concentrations in a fractured basalt aquifer near the Idaho National Engineering Laboratory (Robertson, 1974). Second, the apparent direction of migration (southward) was not aligned with the southwestward hydraulic gradient (fig. 6A), as would be expected for a homogeneous medium. Both of these characteristics could result from the distribution of fracture apertures and the pattern of fracture connections within the
qD2εD'2b
-----------=
C
∂C∂z-------
Rm 1ρb
ε-----Kdm+=
R f 12Kdf
2bγ------------+=
γ 2εδρb---------=
'-∂C∂z-------
z b=
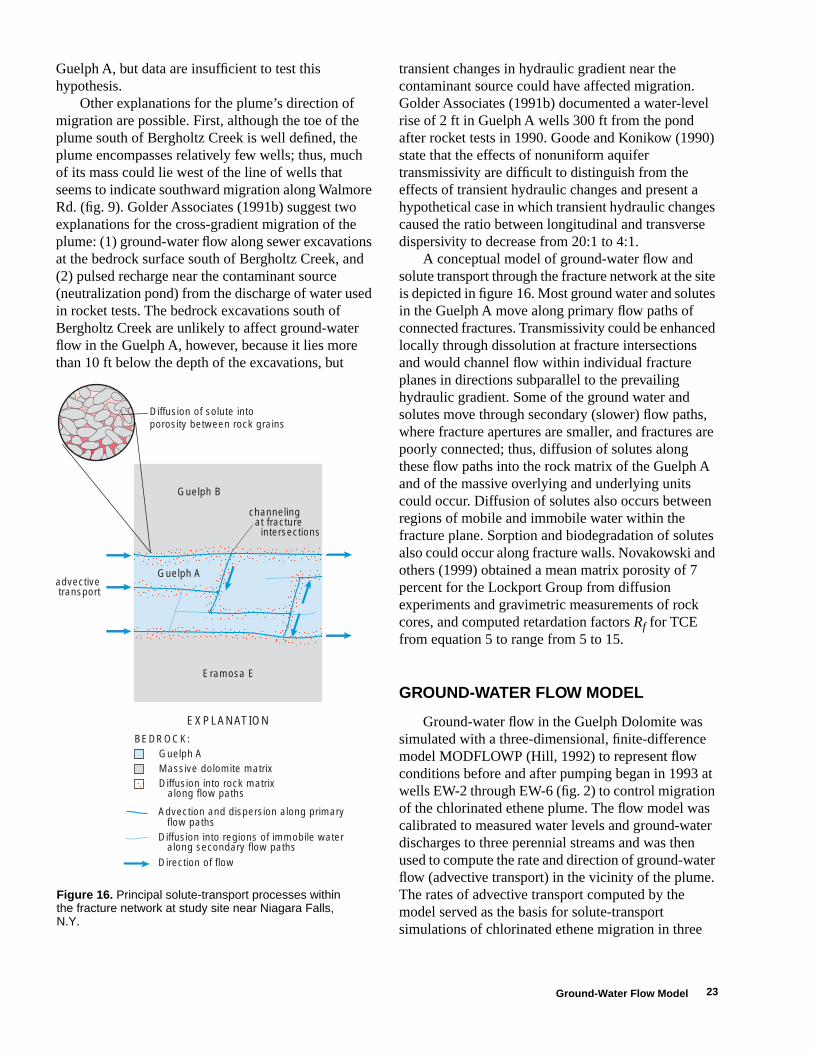
23
Guelph A, but data are insufficient to test this hypothesis.
Other explanations for the plume’s direction of migration are possible. First, although the toe of the plume south of Bergholtz Creek is well defined, the plume encompasses relatively few wells; thus, much of its mass could lie west of the line of wells that seems to indicate southward migration along Walmore Rd. (fig. 9). Golder Associates (1991b) suggest two explanations for the cross-gradient migration of the plume: (1) ground-water flow along sewer excavations at the bedrock surface south of Bergholtz Creek, and (2) pulsed recharge near the contaminant source (neutralization pond) from the discharge of water used in rocket tests. The bedrock excavations south of Bergholtz Creek are unlikely to affect ground-water flow in the Guelph A, however, because it lies more than 10 ft below the depth of the excavations, but
transient changes in hydraulic gradient near the contaminant source could have affected migration. Golder Associates (1991b) documented a water-level rise of 2 ft in Guelph A wells 300 ft from the pond after rocket tests in 1990. Goode and Konikow (1990) state that the effects of nonuniform aquifer transmissivity are difficult to distinguish from the effects of transient hydraulic changes and present a hypothetical case in which transient hydraulic changes caused the ratio between longitudinal and transverse dispersivity to decrease from 20:1 to 4:1.
A conceptual model of ground-water flow and solute transport through the fracture network at the site is depicted in figure 16. Most ground water and solutes in the Guelph A move along primary flow paths of connected fractures. Transmissivity could be enhanced locally through dissolution at fracture intersections and would channel flow within individual fracture planes in directions subparallel to the prevailing hydraulic gradient. Some of the ground water and solutes move through secondary (slower) flow paths, where fracture apertures are smaller, and fractures are poorly connected; thus, diffusion of solutes along these flow paths into the rock matrix of the Guelph A and of the massive overlying and underlying units could occur. Diffusion of solutes also occurs between regions of mobile and immobile water within the fracture plane. Sorption and biodegradation of solutes also could occur along fracture walls. Novakowski and others (1999) obtained a mean matrix porosity of 7 percent for the Lockport Group from diffusion experiments and gravimetric measurements of rock cores, and computed retardation factors Rf for TCE from equation 5 to range from 5 to 15.
GROUND-WATER FLOW MODEL
Ground-water flow in the Guelph Dolomite was simulated with a three-dimensional, finite-difference model MODFLOWP (Hill, 1992) to represent flow conditions before and after pumping began in 1993 at wells EW-2 through EW-6 (fig. 2) to control migration of the chlorinated ethene plume. The flow model was calibrated to measured water levels and ground-water discharges to three perennial streams and was then used to compute the rate and direction of ground-water flow (advective transport) in the vicinity of the plume. The rates of advective transport computed by the model served as the basis for solute-transport simulations of chlorinated ethene migration in three
Figure 16. Principal solute-transport processes within the fracture network at study site near Niagara Falls, N.Y.
advective transport
Diffusion of solute intoporosity between rock grains
Advection and dispersion along primary flow pathsDiffusion into regions of immobile water along secondary flow paths
Direction of flow
BEDROCK:
EXPLANATION
Guelph B
Guelph A
Eramosa E
Guelph AMassive dolomite matrixDiffusion into rock matrix along flow paths
channeling at fracture intersections
Ground-Water Flow Model
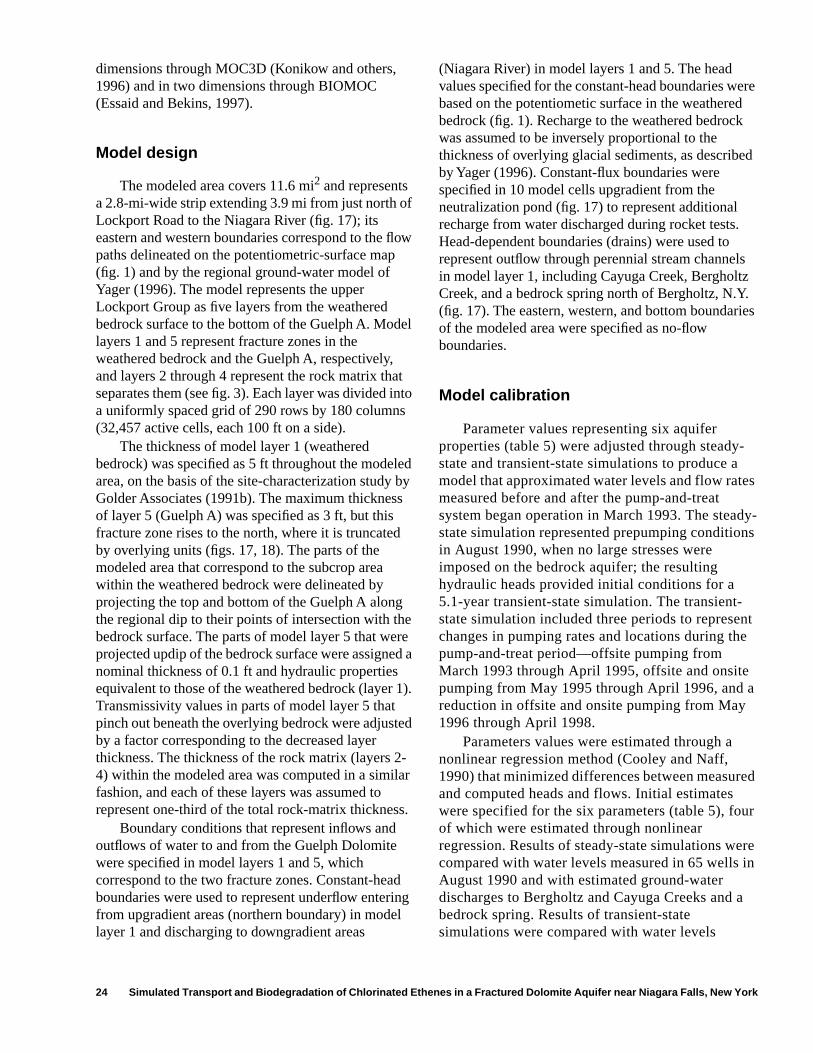
24 Simulated Transport and Biodegradation of Chlorinated Ethenes in a Fractured Dolomite Aquifer near Niagara Falls, New York
dimensions through MOC3D (Konikow and others, 1996) and in two dimensions through BIOMOC (Essaid and Bekins, 1997).
Model design
The modeled area covers 11.6 mi2 and represents a 2.8-mi-wide strip extending 3.9 mi from just north of Lockport Road to the Niagara River (fig. 17); its eastern and western boundaries correspond to the flow paths delineated on the potentiometric-surface map (fig. 1) and by the regional ground-water model of Yager (1996). The model represents the upper Lockport Group as five layers from the weathered bedrock surface to the bottom of the Guelph A. Model layers 1 and 5 represent fracture zones in the weathered bedrock and the Guelph A, respectively, and layers 2 through 4 represent the rock matrix that separates them (see fig. 3). Each layer was divided into a uniformly spaced grid of 290 rows by 180 columns (32,457 active cells, each 100 ft on a side).
The thickness of model layer 1 (weathered bedrock) was specified as 5 ft throughout the modeled area, on the basis of the site-characterization study by Golder Associates (1991b). The maximum thickness of layer 5 (Guelph A) was specified as 3 ft, but this fracture zone rises to the north, where it is truncated by overlying units (figs. 17, 18). The parts of the modeled area that correspond to the subcrop area within the weathered bedrock were delineated by projecting the top and bottom of the Guelph A along the regional dip to their points of intersection with the bedrock surface. The parts of model layer 5 that were projected updip of the bedrock surface were assigned a nominal thickness of 0.1 ft and hydraulic properties equivalent to those of the weathered bedrock (layer 1). Transmissivity values in parts of model layer 5 that pinch out beneath the overlying bedrock were adjusted by a factor corresponding to the decreased layer thickness. The thickness of the rock matrix (layers 2-4) within the modeled area was computed in a similar fashion, and each of these layers was assumed to represent one-third of the total rock-matrix thickness.
Boundary conditions that represent inflows and outflows of water to and from the Guelph Dolomite were specified in model layers 1 and 5, which correspond to the two fracture zones. Constant-head boundaries were used to represent underflow entering from upgradient areas (northern boundary) in model layer 1 and discharging to downgradient areas
(Niagara River) in model layers 1 and 5. The head values specified for the constant-head boundaries were based on the potentiometic surface in the weathered bedrock (fig. 1). Recharge to the weathered bedrock was assumed to be inversely proportional to the thickness of overlying glacial sediments, as described by Yager (1996). Constant-flux boundaries were specified in 10 model cells upgradient from the neutralization pond (fig. 17) to represent additional recharge from water discharged during rocket tests. Head-dependent boundaries (drains) were used to represent outflow through perennial stream channels in model layer 1, including Cayuga Creek, Bergholtz Creek, and a bedrock spring north of Bergholtz, N.Y. (fig. 17). The eastern, western, and bottom boundaries of the modeled area were specified as no-flow boundaries.
Model calibration
Parameter values representing six aquifer properties (table 5) were adjusted through steady-state and transient-state simulations to produce a model that approximated water levels and flow rates measured before and after the pump-and-treat system began operation in March 1993. The steady-state simulation represented prepumping conditions in August 1990, when no large stresses were imposed on the bedrock aquifer; the resulting hydraulic heads provided initial conditions for a 5.1-year transient-state simulation. The transient-state simulation included three periods to represent changes in pumping rates and locations during the pump-and-treat period—offsite pumping from March 1993 through April 1995, offsite and onsite pumping from May 1995 through April 1996, and a reduction in offsite and onsite pumping from May 1996 through April 1998.
Parameters values were estimated through a nonlinear regression method (Cooley and Naff, 1990) that minimized differences between measured and computed heads and flows. Initial estimates were specified for the six parameters (table 5), four of which were estimated through nonlinear regression. Results of steady-state simulations were compared with water levels measured in 65 wells in August 1990 and with estimated ground-water discharges to Bergholtz and Cayuga Creeks and a bedrock spring. Results of transient-state simulations were compared with water levels
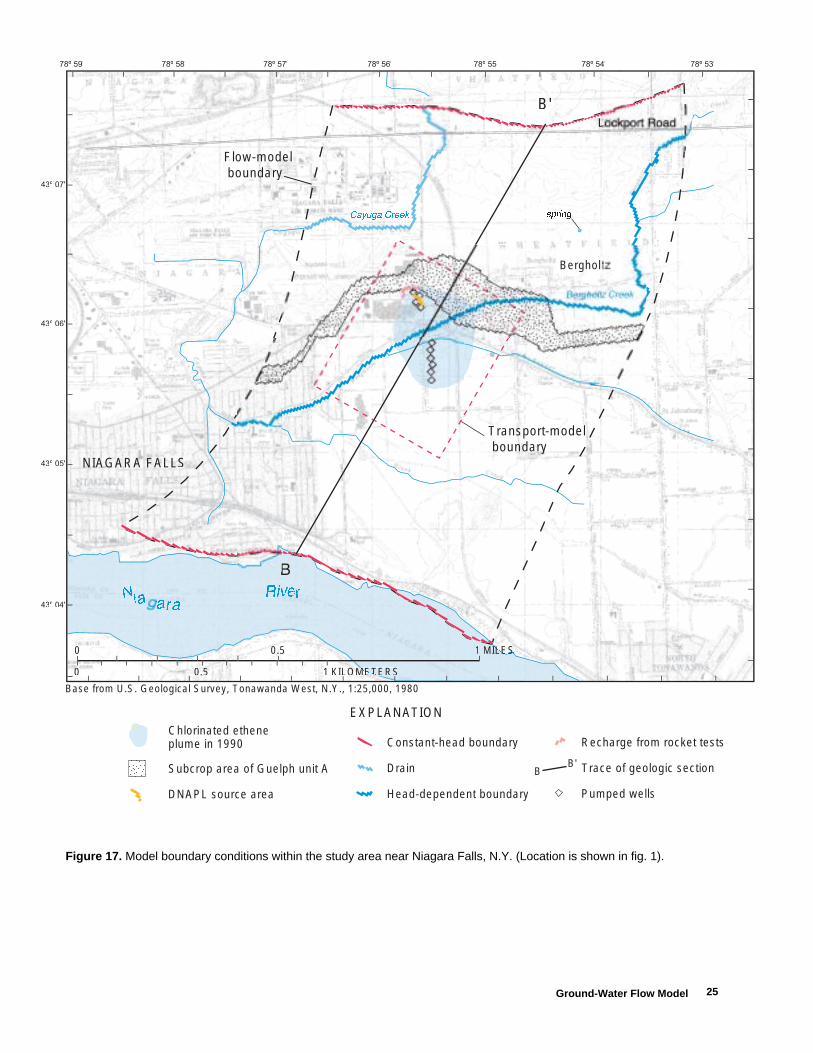
25
NiNiaiaaararara
RiRivi everer
Flow-model boundary
Transport-model boundary
NIAGARA FALLS
43º 06'
43º 07'
43º 05'
43º 04'
78º 56'78º 57'78º 58'878º 59' 78º 55' 78º 54' 78º 53'
0.5 LESMILESLESILES1
0.5 KILOMETMETERSMETEMETE1
0
0
EXPLANATION
B'
Cayuga Creek spring
Bergholt
BB'
Chlorinated etheneplume in 1990
Subcrop area of Guelph unit A Trace of geologic section
Constant-head boundary
Drain
Head-dependent boundary
Recharge from rocket tests
Pumped wells
Base from U.S. Geological Survey, Tonawanda West, N.Y., 1:25,000, 1980
DNAPL source area
Figure 17. Model boundary conditions within the study area near Niagara Falls, N.Y. (Location is shown in fig. 1).
Ground-Water Flow Model
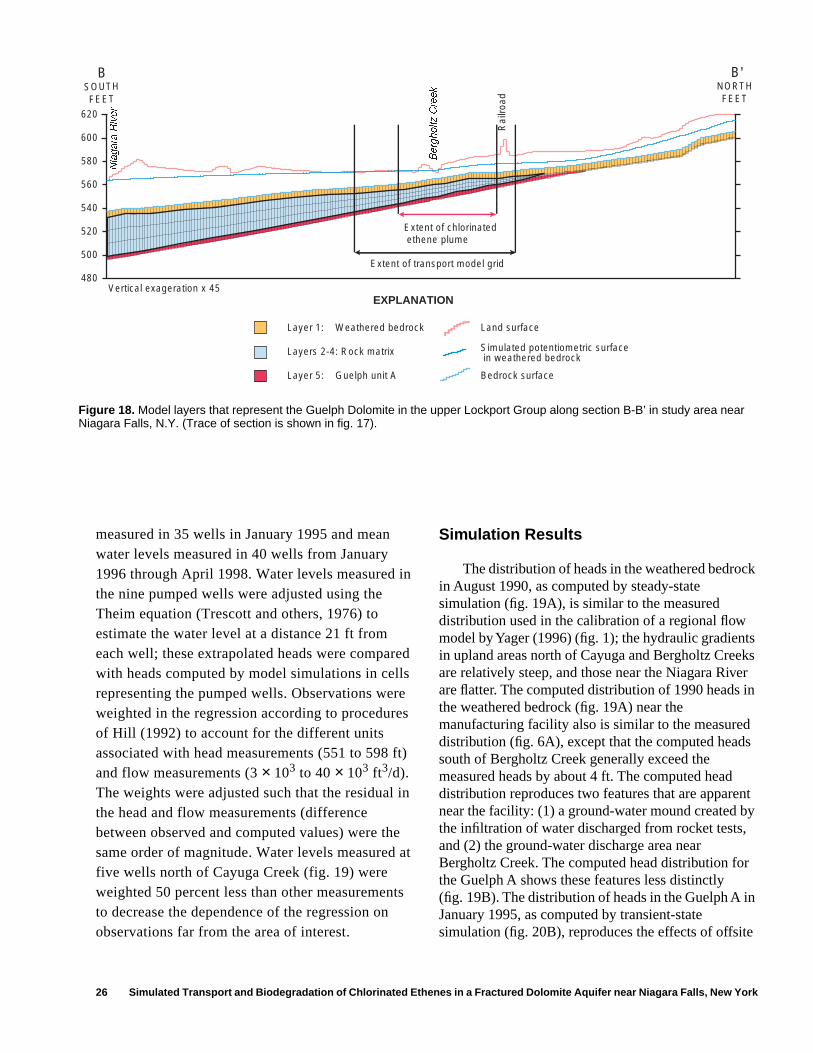
26 Simulated Transport and Biodegradation of Chlorinated Ethenes in a Fractured Dolomite Aquifer near Niagara Falls, New York
measured in 35 wells in January 1995 and mean water levels measured in 40 wells from January 1996 through April 1998. Water levels measured in the nine pumped wells were adjusted using the Theim equation (Trescott and others, 1976) to estimate the water level at a distance 21 ft from each well; these extrapolated heads were compared with heads computed by model simulations in cells representing the pumped wells. Observations were weighted in the regression according to procedures of Hill (1992) to account for the different units associated with head measurements (551 to 598 ft) and flow measurements (3 × 10³ to 40 × 103 ft3/d). The weights were adjusted such that the residual in the head and flow measurements (difference between observed and computed values) were the same order of magnitude. Water levels measured at five wells north of Cayuga Creek (fig. 19) were weighted 50 percent less than other measurements to decrease the dependence of the regression on observations far from the area of interest.
Simulation Results
The distribution of heads in the weathered bedrock in August 1990, as computed by steady-state simulation (fig. 19A), is similar to the measured distribution used in the calibration of a regional flow model by Yager (1996) (fig. 1); the hydraulic gradients in upland areas north of Cayuga and Bergholtz Creeks are relatively steep, and those near the Niagara River are flatter. The computed distribution of 1990 heads in the weathered bedrock (fig. 19A) near the manufacturing facility also is similar to the measured distribution (fig. 6A), except that the computed heads south of Bergholtz Creek generally exceed the measured heads by about 4 ft. The computed head distribution reproduces two features that are apparent near the facility: (1) a ground-water mound created by the infiltration of water discharged from rocket tests, and (2) the ground-water discharge area near Bergholtz Creek. The computed head distribution for the Guelph A shows these features less distinctly (fig. 19B). The distribution of heads in the Guelph A in January 1995, as computed by transient-state simulation (fig. 20B), reproduces the effects of offsite
EXPLANATION
620
600
580
560
540
520
500
480Vertical exageration x 45
Layer 1: Weathered bedrock
Layers 2-4: Rock matrix
Layer 5: Guelph unit A
Land surface
Simulated potentiometric surface in weathered bedrock
Bedrock surface
Extent of chlorinated ethene plume
Extent of transport model grid
Berg
holtz C
reek
Rai
lroad
Nia
gara
River
B'BNORTHSOUTHFEETFEET
Figure 18. Model layers that represent the Guelph Dolomite in the upper Lockport Group along section B-B’ in study area near Niagara Falls, N.Y. (Trace of section is shown in fig. 17).
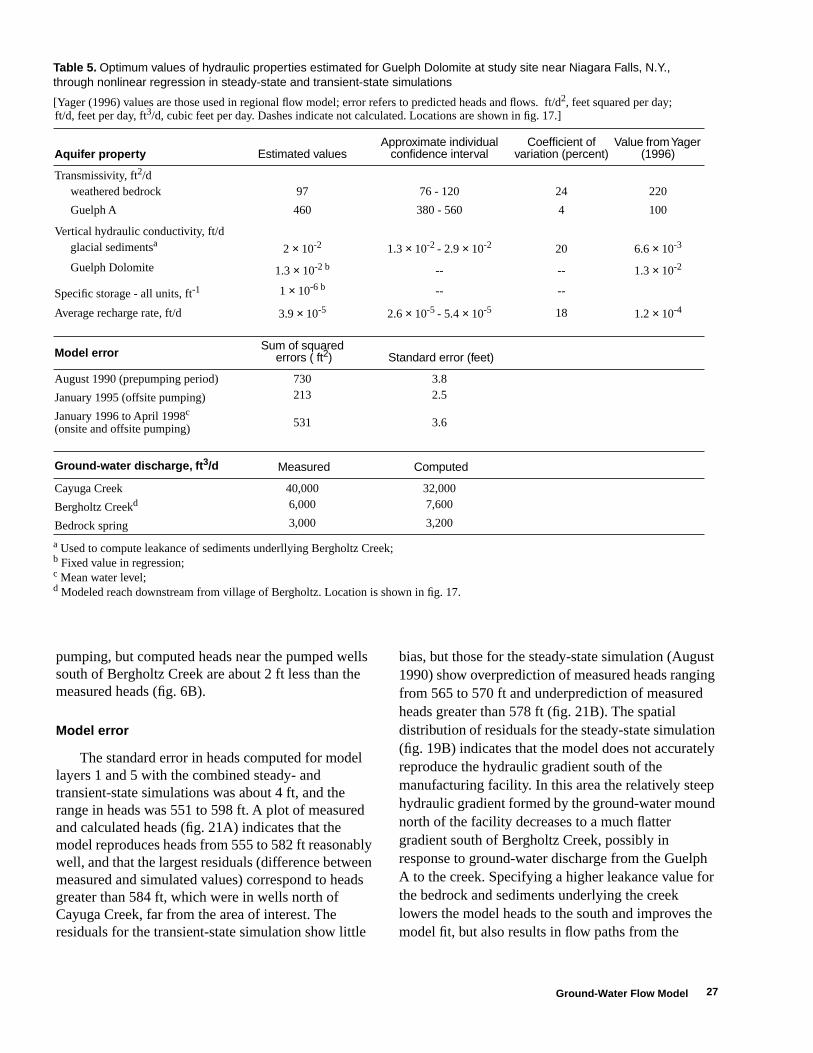
27
pumping, but computed heads near the pumped wells south of Bergholtz Creek are about 2 ft less than the measured heads (fig. 6B).
Model error
The standard error in heads computed for model layers 1 and 5 with the combined steady- and transient-state simulations was about 4 ft, and the range in heads was 551 to 598 ft. A plot of measured and calculated heads (fig. 21A) indicates that the model reproduces heads from 555 to 582 ft reasonably well, and that the largest residuals (difference between measured and simulated values) correspond to heads greater than 584 ft, which were in wells north of Cayuga Creek, far from the area of interest. The residuals for the transient-state simulation show little
bias, but those for the steady-state simulation (August 1990) show overprediction of measured heads ranging from 565 to 570 ft and underprediction of measured heads greater than 578 ft (fig. 21B). The spatial distribution of residuals for the steady-state simulation (fig. 19B) indicates that the model does not accurately reproduce the hydraulic gradient south of the manufacturing facility. In this area the relatively steep hydraulic gradient formed by the ground-water mound north of the facility decreases to a much flatter gradient south of Bergholtz Creek, possibly in response to ground-water discharge from the Guelph A to the creek. Specifying a higher leakance value for the bedrock and sediments underlying the creek lowers the model heads to the south and improves the model fit, but also results in flow paths from the
Table 5. Optimum values of hydraulic properties estimated for Guelph Dolomite at study site near Niagara Falls, N.Y., through nonlinear regression in steady-state and transient-state simulations
[Yager (1996) values are those used in regional flow model; error refers to predicted heads and flows. ft/d2, feet squared per day; ft/d, feet per day, ft3/d, cubic feet per day. Dashes indicate not calculated. Locations are shown in fig. 17.]
a Used to compute leakance of sediments underllying Bergholtz Creek;b Fixed value in regression;c Mean water level;d Modeled reach downstream from village of Bergholtz. Location is shown in fig. 17.
Aquifer property Estimated valuesApproximate individual
confidence intervalCoefficient of
variation (percent)Value from Yager
(1996)
Transmissivity, ft2/d weathered bedrock 97 76 - 120 24 220
Guelph A 460 380 - 560 4 100
Vertical hydraulic conductivity, ft/dglacial sedimentsa 2 × 10⁻² 1.3 × 10⁻² - 2.9 × 10⁻² 20 6.6 × 10⁻³
Guelph Dolomite 1.3 × 10⁻² b -- -- 1.3 × 10⁻²
Specific storage - all units, ft-1 1 × 10⁻⁶ b -- --
Average recharge rate, ft/d 3.9 × 10⁻⁵ 2.6 × 10⁻⁵ - 5.4 × 10⁻⁵ 18 1.2 × 10⁻⁴
Model errorSum of squared
errors ( ft2) Standard error (feet)
August 1990 (prepumping period) 730 3.8
January 1995 (offsite pumping) 213 2.5
January 1996 to April 1998c
(onsite and offsite pumping) 531 3.6
Ground-water discharge, ft 3/d Measured Computed
Cayuga Creek 40,000 32,000
Bergholtz Creekd 6,000 7,600
Bedrock spring 3,000 3,200
Ground-Water Flow Model
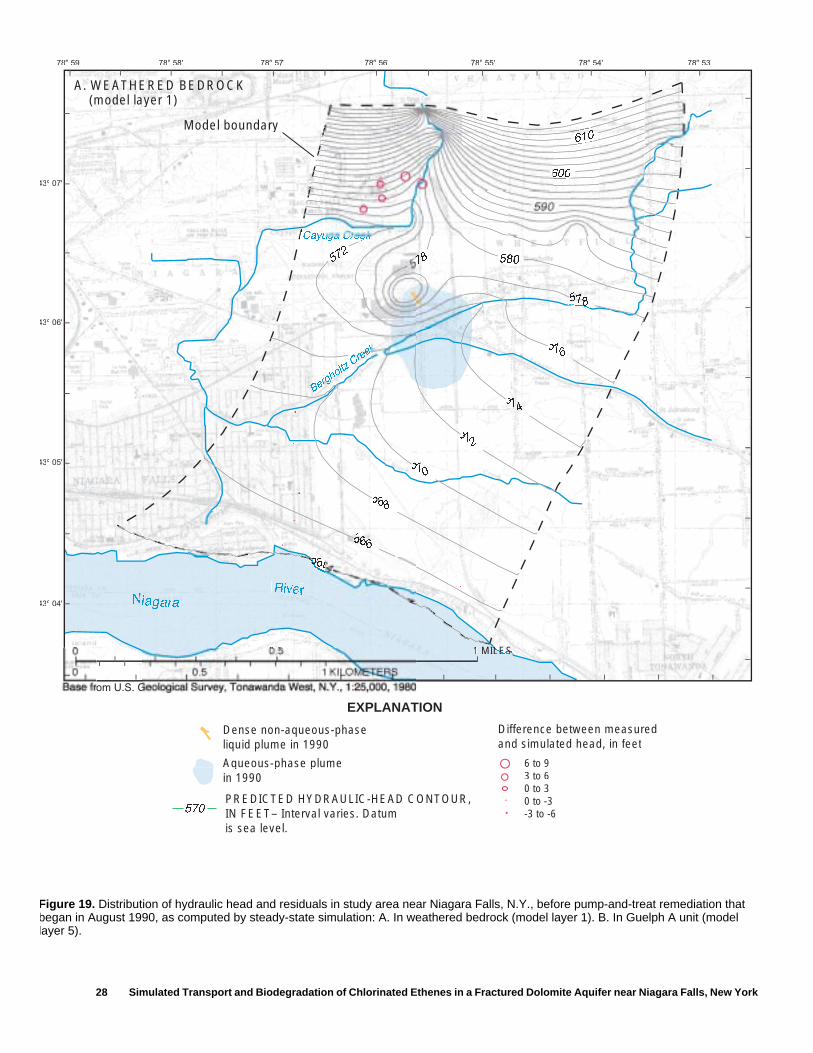
28 Simulated Transport and Biodegradation of Chlorinated Ethenes in a Fractured Dolomite Aquifer near Niagara Falls, New York
Model boundary
5564564564
566
568
570
572
572
5
574
576
5785785
580
600
610106
578
570
EXPLANATION
PREDICTED HYDRAULIC-HEAD CONTOUR,IN FEET– Interval varies. Datumis sea level.
Dense non-aqueous-phaseliquid plume in 1990
queous p ase p u eAqueous-phase plumein 1990
A. WEATHERED BEDROCK (model layer 1)
Difference between measuredand simulated head, in feet
.
.
.
.
.
.
.
.
43º 06'
43º 07'
43º 05'
43º 04'
78º 56'78º 57'78º 58'878º 59' 78º 55' 78º 54' 78º 53'
6 to 93 to 60 to 30 to -3 -3 to -6
0 5 ESEMILELESSLESSSLES10
NiNiaiagagagara ar
RiRivi everer
Berg
holtz CreekCreek
Cayuga Creekeek
Figure 19. Distribution of hydraulic head and residuals in study area near Niagara Falls, N.Y., before pump-and-treat remediation that began in August 1990, as computed by steady-state simulation: A. In weathered bedrock (model layer 1). B. In Guelph A unit (model layer 5).
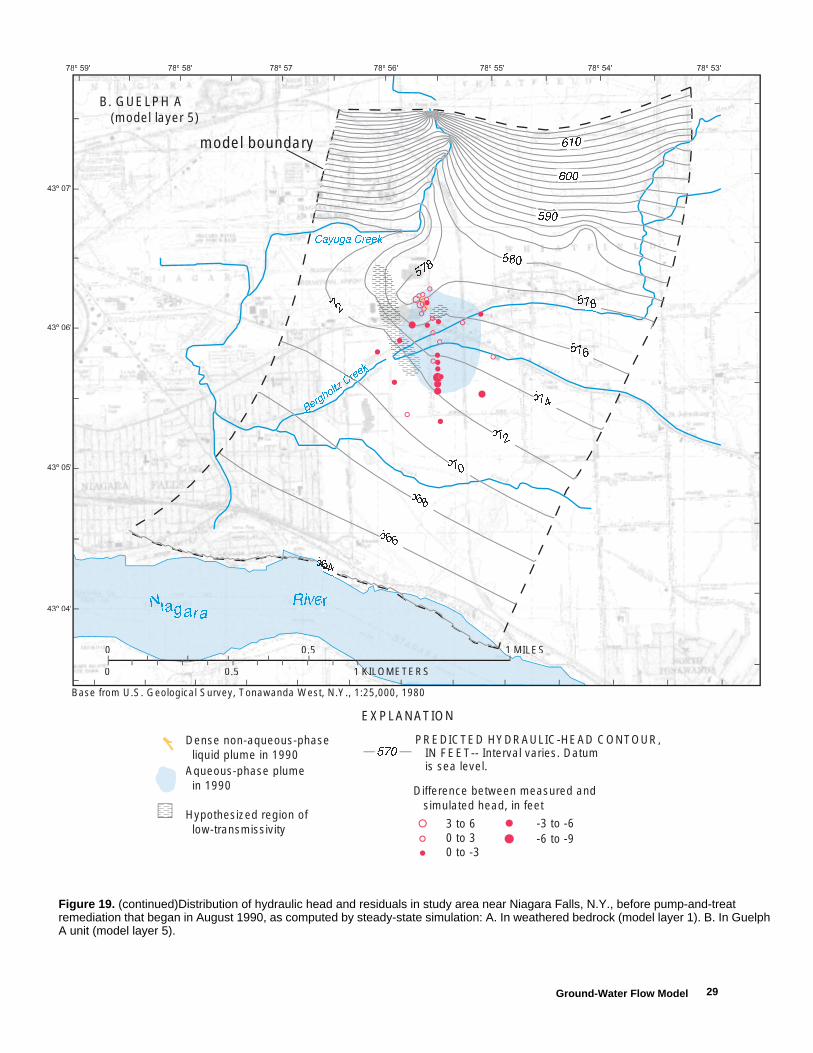
29
0.5 MILES1
0.5 KILOMETERSKILKIIKIL1
0
0
model boundary
NiNiaiagagagararara
RiRivi everer
5645646564565
566
568
5705
5725
572
5
5745
576
578785
5805
590
600
610610
578
5
Berg
holtz Cre
BCre
ekkCree
Cayuga Creekeek
570
EXPLANATION
PREDICTED HYDRAULIC-HEAD CONTOUR, IN FEET-- Interval varies. Datum is sea level.
Dense non-aqueous-phase liquid plume in 1990Aqueous-phase plumeAqueous-phase plume in 1990
Hypothesized region of low-transmissivity
B. GUELPH A (model layer 5)
Difference between measured and simulated head, in feet
3 to 60 to 30 to -3
-3 to -6-6 to -9
43º 06'
43º 07'
43º 05'
43º 04'
78º 56'78º 57'78º 58'878º 59' 78º 55' 78º 54' 78º 53'
Base from U.S. Geological Survey, Tonawanda West, N.Y., 1:25,000, 1980
Ground-Water Flow Model
Figure 19. (continued)Distribution of hydraulic head and residuals in study area near Niagara Falls, N.Y., before pump-and-treat remediation that began in August 1990, as computed by steady-state simulation: A. In weathered bedrock (model layer 1). B. In Guelph A unit (model layer 5).
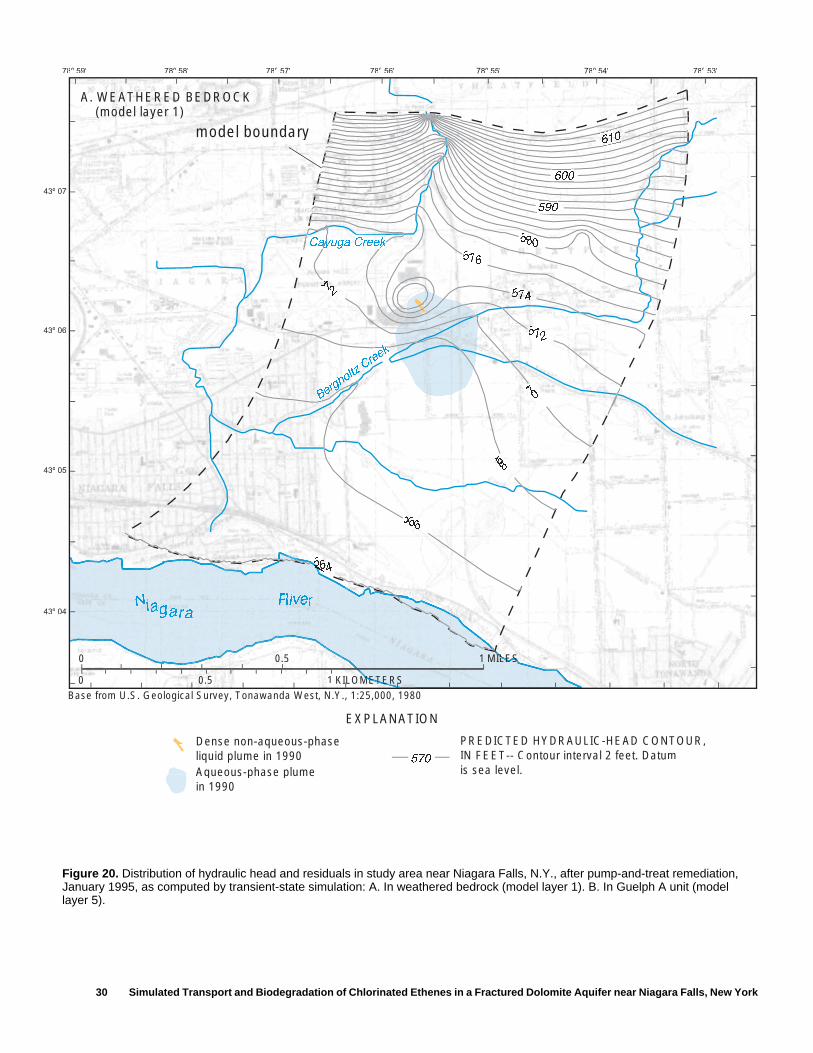
30 Simulated Transport and Biodegradation of Chlorinated Ethenes in a Fractured Dolomite Aquifer near Niagara Falls, New York
0.5 EMILESELESSLESLLILES1
0.5 METERSMETEKILOMETEMMMETE1
0
0
model boundary
NiNiaiagagagararara
RiRivi everer
564555556
566
568
570
572
572 574
576
580
590
600
610610610
570
EXPLANATION
PREDICTED HYDRAULIC-HEAD CONTOUR,IN FEET-- Contour interval 2 feet. Datumis sea level.
Dense non-aqueous-phaseliquid plume in 1990Aqueous phase plumeAqueous-phase plumein 1990
A. WEATHERED BEDROCK (model layer 1)
Berg
holtz Creekk
ayuga CreekCay ekCay
43º 06'
43º 07'
43º 05'
43º 04'
78º 56'78º 57'78º 58'878º 59' 78º 55' 78º 54' 78º 53'
Base from U.S. Geological Survey, Tonawanda West, N.Y., 1:25,000, 1980
Figure 20. Distribution of hydraulic head and residuals in study area near Niagara Falls, N.Y., after pump-and-treat remediation, January 1995, as computed by transient-state simulation: A. In weathered bedrock (model layer 1). B. In Guelph A unit (model layer 5).
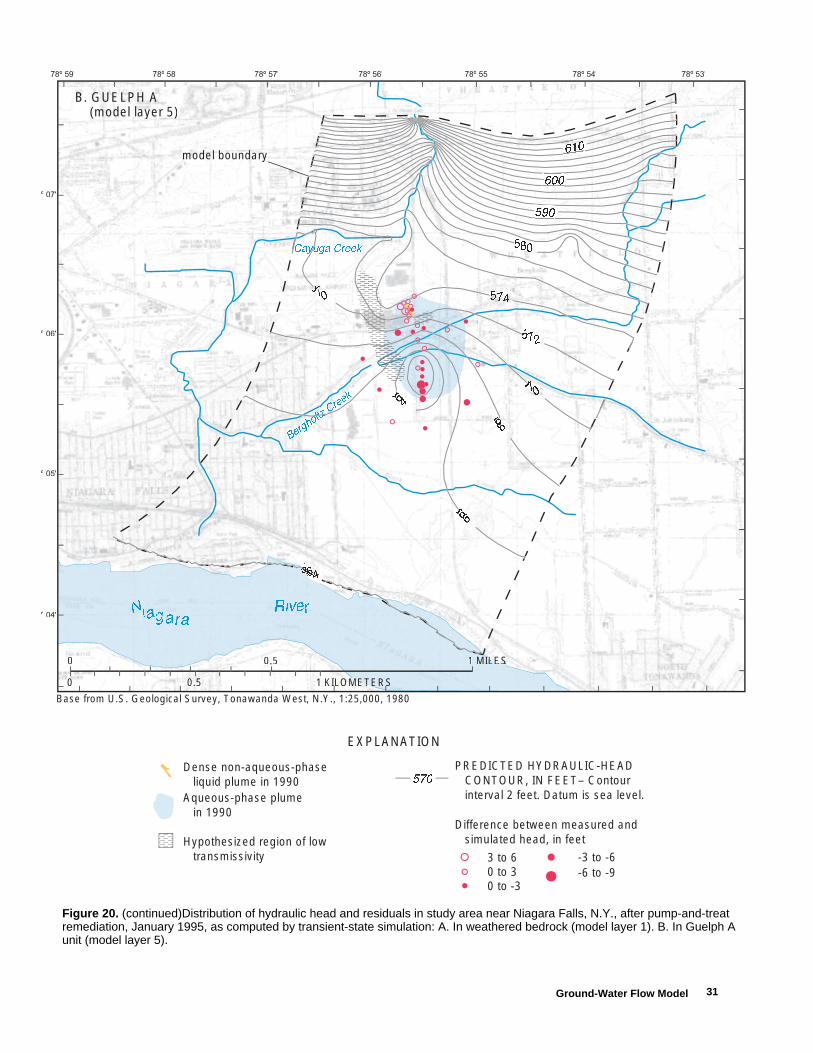
31
NiNiaiagagagararara
RiRivi everer
Berg
holtz Creek
Cayuga Creek
0.5 ILESSSESMILELILES1
0.5 METERSMETKILOMETTMMMETE1
0
0
model boundary
564564656456
564
5
566
5
568
5
570
5
570
5725
5745
5805
59090
600
61010610
570570
EXPLANATION
PREDICTED HYDRAULIC-HEAD CONTOUR, IN FEET– Contour interval 2 feet. Datum is sea level.
Dense non-aqueous-phase liquid plume in 1990Aqueous-phase plume in 1990
Hypothesized region of low transmissivity
Difference between measured and simulated head, in feet
3 to 60 to 30 to -3
-3 to -6-6 to -9
B. GUELPH A (model layer 5)
3º 06'
3º 07'
3º 05'
3º 04'
78º 56'78º 57'78º 58'878º 59' 78º 55' 78º 54' 78º 53'
Base from U.S. Geological Survey, Tonawanda West, N.Y., 1:25,000, 1980
Ground-Water Flow Model
Figure 20. (continued)Distribution of hydraulic head and residuals in study area near Niagara Falls, N.Y., after pump-and-treat remediation, January 1995, as computed by transient-state simulation: A. In weathered bedrock (model layer 1). B. In Guelph A unit (model layer 5).
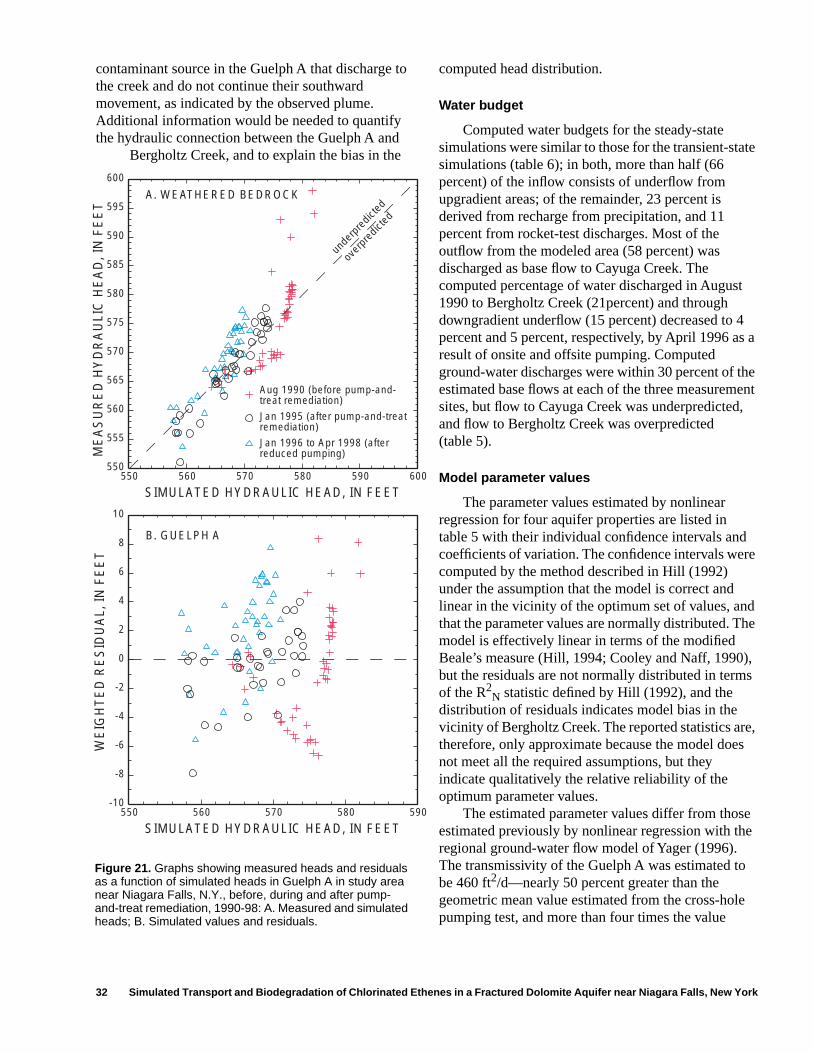
32 Simulated Transport and Biodegradation of Chlorinated Ethenes in a Fractured Dolomite Aquifer near Niagara Falls, New York
SIMULATED HYDRAULIC HEAD, IN FEET
ME
AS
UR
ED
HY
DR
AU
LIC
HE
AD
, IN
FE
ET
SIMULATED HYDRAULIC HEAD, IN FEET
WE
IGH
TE
D R
ES
IDU
AL,
IN F
EE
T
unde
rpre
dicte
d
over
pred
icted
A. WEATHERED BEDROCK
B. GUELPH A
550 600560 570 580 590550
600
555
560
565
570
575
580
585
590
595
590560 570 580
10
-10
-8
-6
-4
-2
0
2
4
6
8
550
Aug 1990 (before pump-and-treat remediation)
Jan 1995 (after pump-and-treatremediation)
Jan 1996 to Apr 1998 (afterreduced pumping)
contaminant source in the Guelph A that discharge to the creek and do not continue their southward movement, as indicated by the observed plume. Additional information would be needed to quantify the hydraulic connection between the Guelph A and
Bergholtz Creek, and to explain the bias in the
computed head distribution.
Water budget
Computed water budgets for the steady-state simulations were similar to those for the transient-state simulations (table 6); in both, more than half (66 percent) of the inflow consists of underflow from upgradient areas; of the remainder, 23 percent is derived from recharge from precipitation, and 11 percent from rocket-test discharges. Most of the outflow from the modeled area (58 percent) was discharged as base flow to Cayuga Creek. The computed percentage of water discharged in August 1990 to Bergholtz Creek (21percent) and through downgradient underflow (15 percent) decreased to 4 percent and 5 percent, respectively, by April 1996 as a result of onsite and offsite pumping. Computed ground-water discharges were within 30 percent of the estimated base flows at each of the three measurement sites, but flow to Cayuga Creek was underpredicted, and flow to Bergholtz Creek was overpredicted (table 5).
Model parameter values
The parameter values estimated by nonlinear regression for four aquifer properties are listed in table 5 with their individual confidence intervals and coefficients of variation. The confidence intervals were computed by the method described in Hill (1992) under the assumption that the model is correct and linear in the vicinity of the optimum set of values, and that the parameter values are normally distributed. The model is effectively linear in terms of the modified Beale’s measure (Hill, 1994; Cooley and Naff, 1990), but the residuals are not normally distributed in terms of the R2
N statistic defined by Hill (1992), and the distribution of residuals indicates model bias in the vicinity of Bergholtz Creek. The reported statistics are, therefore, only approximate because the model does not meet all the required assumptions, but they indicate qualitatively the relative reliability of the optimum parameter values.
The estimated parameter values differ from those estimated previously by nonlinear regression with the regional ground-water flow model of Yager (1996). The transmissivity of the Guelph A was estimated to be 460 ft2/d—nearly 50 percent greater than the geometric mean value estimated from the cross-hole pumping test, and more than four times the value
Figure 21. Graphs showing measured heads and residuals as a function of simulated heads in Guelph A in study area near Niagara Falls, N.Y., before, during and after pump-and-treat remediation, 1990-98: A. Measured and simulated heads; B. Simulated values and residuals.
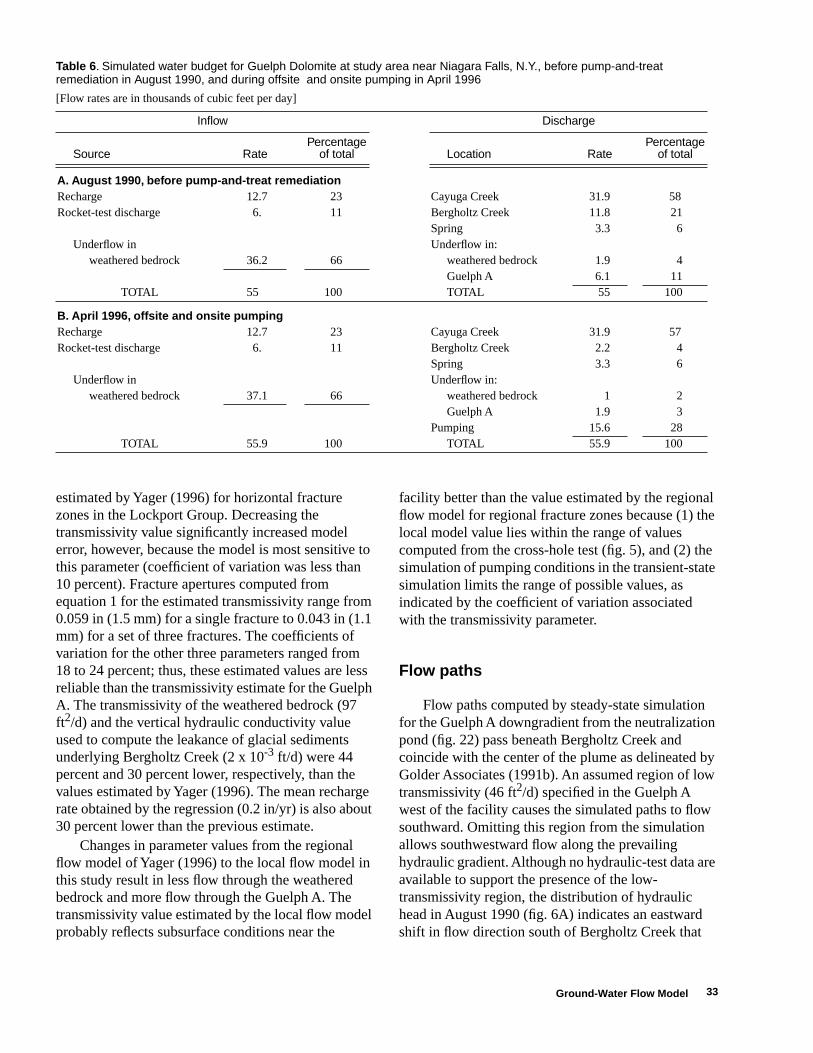
33
estimated by Yager (1996) for horizontal fracture zones in the Lockport Group. Decreasing the transmissivity value significantly increased model error, however, because the model is most sensitive to this parameter (coefficient of variation was less than 10 percent). Fracture apertures computed from equation 1 for the estimated transmissivity range from 0.059 in (1.5 mm) for a single fracture to 0.043 in (1.1 mm) for a set of three fractures. The coefficients of variation for the other three parameters ranged from 18 to 24 percent; thus, these estimated values are less reliable than the transmissivity estimate for the Guelph A. The transmissivity of the weathered bedrock (97 ft2/d) and the vertical hydraulic conductivity value used to compute the leakance of glacial sediments underlying Bergholtz Creek (2 x 10⁻³ ft/d) were 44 percent and 30 percent lower, respectively, than the values estimated by Yager (1996). The mean recharge rate obtained by the regression (0.2 in/yr) is also about 30 percent lower than the previous estimate.
Changes in parameter values from the regional flow model of Yager (1996) to the local flow model in this study result in less flow through the weathered bedrock and more flow through the Guelph A. The transmissivity value estimated by the local flow model probably reflects subsurface conditions near the
facility better than the value estimated by the regional flow model for regional fracture zones because (1) the local model value lies within the range of values computed from the cross-hole test (fig. 5), and (2) the simulation of pumping conditions in the transient-state simulation limits the range of possible values, as indicated by the coefficient of variation associated with the transmissivity parameter.
Flow paths
Flow paths computed by steady-state simulation for the Guelph A downgradient from the neutralization pond (fig. 22) pass beneath Bergholtz Creek and coincide with the center of the plume as delineated by Golder Associates (1991b). An assumed region of low transmissivity (46 ft2/d) specified in the Guelph A west of the facility causes the simulated paths to flow southward. Omitting this region from the simulation allows southwestward flow along the prevailing hydraulic gradient. Although no hydraulic-test data are available to support the presence of the low-transmissivity region, the distribution of hydraulic head in August 1990 (fig. 6A) indicates an eastward shift in flow direction south of Bergholtz Creek that
Table 6. Simulated water budget for Guelph Dolomite at study area near Niagara Falls, N.Y., before pump-and-treat remediation in August 1990, and during offsite and onsite pumping in April 1996
[Flow rates are in thousands of cubic feet per day]
Inflow Discharge
Source RatePercentage
of total Location RatePercentage
of total
A. August 1990, before pump-and-treat remediationRecharge 12.7 23 Cayuga Creek 31.9 58Rocket-test discharge 6. 11 Bergholtz Creek 11.8 21
Spring 3.3 6Underflow in Underflow in:
weathered bedrock 36.2 66 weathered bedrock 1.9 4Guelph A 6.1 11
TOTAL 55 100 TOTAL 55 100
B. April 1996, offsite and onsite pumpingRecharge 12.7 23 Cayuga Creek 31.9 57Rocket-test discharge 6. 11 Bergholtz Creek 2.2 4
Spring 3.3 6Underflow in Underflow in:
weathered bedrock 37.1 66 weathered bedrock 1 2Guelph A 1.9 3
Pumping 15.6 28TOTAL 55.9 100 TOTAL 55.9 100
Ground-Water Flow Model
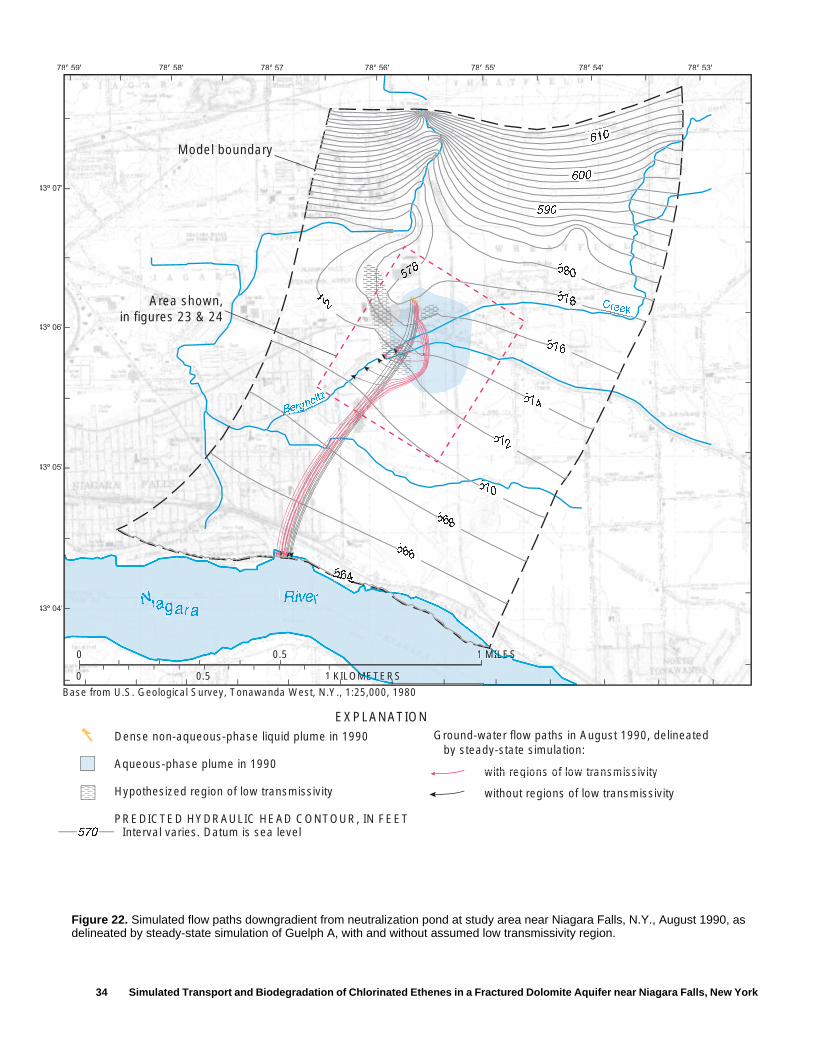
34 Simulated Transport and Biodegradation of Chlorinated Ethenes in a Fractured Dolomite Aquifer near Niagara Falls, New York
NiNiaiagagagararara
RiRivi everer
564555564
566
5685
5705
572
5745
576
578885
580
590
600
61061061
572
5
578
0.5 ILESILESMILESSEIIMILESSESESMILEIILESI1
0.5 KILOMETMETERSMETETMMETMETEMET1
0
0
EXPLANATION
570
Dense non-aqueous-phase liquid plume in 1990
Aqueous-phase plume in 1990
Hypothesized region of low transmissivity
PREDICTED HYDRAULIC HEAD CONTOUR, IN FEETInterval varies. Datum is sea level
Ground-water flow paths in August 1990, delineated by steady-state simulation:
with regions of low transmissivitywith regions of low transmissivity
without regions of low transmissivity
CreekeeCreek
Berg
Berg
Bho
ltzho
ltz
rghg
Model boundary
Area shown,in figures 23 & 24
43º 06'
43º 07'
43º 05'
43º 04'
78º 56'78º 57'78º 58'878º 59' 78º 55' 78º 54' 78º 53'
Base from U.S. Geological Survey, Tonawanda West, N.Y., 1:25,000, 1980
Figure 22. Simulated flow paths downgradient from neutralization pond at study area near Niagara Falls, N.Y., August 1990, as delineated by steady-state simulation of Guelph A, with and without assumed low transmissivity region.
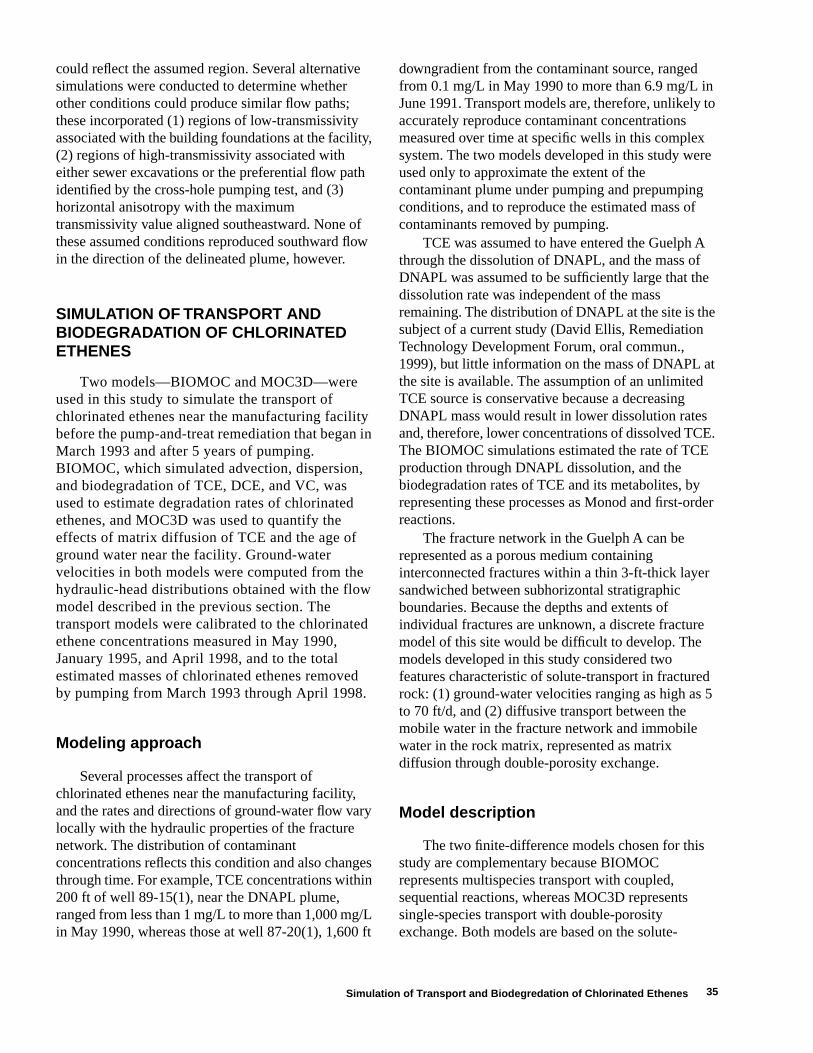
35
could reflect the assumed region. Several alternative simulations were conducted to determine whether other conditions could produce similar flow paths; these incorporated (1) regions of low-transmissivity associated with the building foundations at the facility, (2) regions of high-transmissivity associated with either sewer excavations or the preferential flow path identified by the cross-hole pumping test, and (3) horizontal anisotropy with the maximum transmissivity value aligned southeastward. None of these assumed conditions reproduced southward flow in the direction of the delineated plume, however.
SIMULATION OF TRANSPORT AND BIODEGRADATION OF CHLORINATED ETHENES
Two models—BIOMOC and MOC3D—were used in this study to simulate the transport of chlorinated ethenes near the manufacturing facility before the pump-and-treat remediation that began in March 1993 and after 5 years of pumping. BIOMOC, which simulated advection, dispersion, and biodegradation of TCE, DCE, and VC, was used to estimate degradation rates of chlorinated ethenes, and MOC3D was used to quantify the effects of matrix diffusion of TCE and the age of ground water near the facility. Ground-water velocities in both models were computed from the hydraulic-head distributions obtained with the flow model described in the previous section. The transport models were calibrated to the chlorinated ethene concentrations measured in May 1990, January 1995, and April 1998, and to the total estimated masses of chlorinated ethenes removed by pumping from March 1993 through April 1998.
Modeling approach
Several processes affect the transport of chlorinated ethenes near the manufacturing facility, and the rates and directions of ground-water flow vary locally with the hydraulic properties of the fracture network. The distribution of contaminant concentrations reflects this condition and also changes through time. For example, TCE concentrations within 200 ft of well 89-15(1), near the DNAPL plume, ranged from less than 1 mg/L to more than 1,000 mg/L in May 1990, whereas those at well 87-20(1), 1,600 ft
downgradient from the contaminant source, ranged from 0.1 mg/L in May 1990 to more than 6.9 mg/L in June 1991. Transport models are, therefore, unlikely to accurately reproduce contaminant concentrations measured over time at specific wells in this complex system. The two models developed in this study were used only to approximate the extent of the contaminant plume under pumping and prepumping conditions, and to reproduce the estimated mass of contaminants removed by pumping.
TCE was assumed to have entered the Guelph A through the dissolution of DNAPL, and the mass of DNAPL was assumed to be sufficiently large that the dissolution rate was independent of the mass remaining. The distribution of DNAPL at the site is the subject of a current study (David Ellis, Remediation Technology Development Forum, oral commun., 1999), but little information on the mass of DNAPL at the site is available. The assumption of an unlimited TCE source is conservative because a decreasing DNAPL mass would result in lower dissolution rates and, therefore, lower concentrations of dissolved TCE. The BIOMOC simulations estimated the rate of TCE production through DNAPL dissolution, and the biodegradation rates of TCE and its metabolites, by representing these processes as Monod and first-order reactions.
The fracture network in the Guelph A can be represented as a porous medium containing interconnected fractures within a thin 3-ft-thick layer sandwiched between subhorizontal stratigraphic boundaries. Because the depths and extents of individual fractures are unknown, a discrete fracture model of this site would be difficult to develop. The models developed in this study considered two features characteristic of solute-transport in fractured rock: (1) ground-water velocities ranging as high as 5 to 70 ft/d, and (2) diffusive transport between the mobile water in the fracture network and immobile water in the rock matrix, represented as matrix diffusion through double-porosity exchange.
Model description
The two finite-difference models chosen for this study are complementary because BIOMOC represents multispecies transport with coupled, sequential reactions, whereas MOC3D represents single-species transport with double-porosity exchange. Both models are based on the solute-
Simulation of Transport and Biodegredation of Chlorinated Ethenes
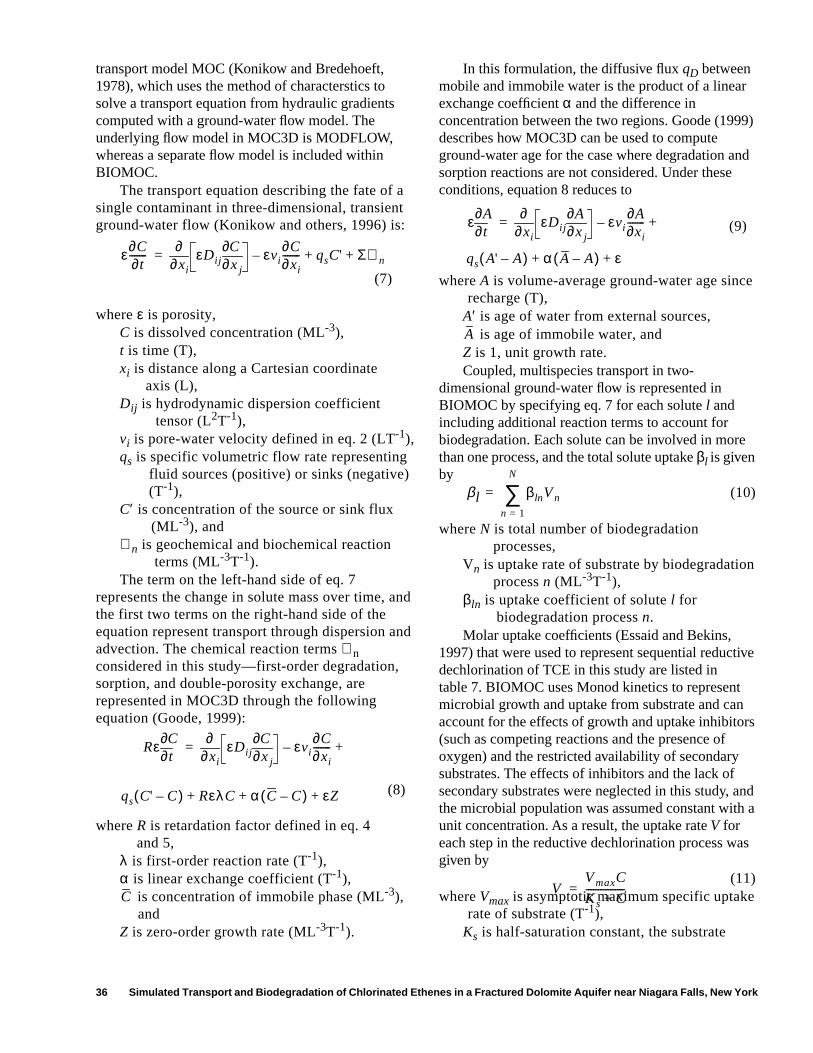
36 Simulated Transport and Biodegradation of Chlorinated Ethenes in a Fractured Dolomite Aquifer near Niagara Falls, New York
transport model MOC (Konikow and Bredehoeft, 1978), which uses the method of characterstics to solve a transport equation from hydraulic gradients computed with a ground-water flow model. The underlying flow model in MOC3D is MODFLOW, whereas a separate flow model is included within BIOMOC.
The transport equation describing the fate of a single contaminant in three-dimensional, transient ground-water flow (Konikow and others, 1996) is:
(7)
where ε is porosity,C is dissolved concentration (ML-3),t is time (T),xi is distance along a Cartesian coordinate
axis (L),Dij is hydrodynamic dispersion coefficient
tensor (L2T-1),vi is pore-water velocity defined in eq. 2 (LT-1),qs is specific volumetric flow rate representing
fluid sources (positive) or sinks (negative) (T-1),
C′ is concentration of the source or sink flux (ML-3), and
ℜ n is geochemical and biochemical reaction terms (ML-3T-1).
The term on the left-hand side of eq. 7 represents the change in solute mass over time, and the first two terms on the right-hand side of the equation represent transport through dispersion and advection. The chemical reaction terms ℜ n considered in this study—first-order degradation, sorption, and double-porosity exchange, are represented in MOC3D through the following equation (Goode, 1999):
(8)
where R is retardation factor defined in eq. 4 and 5,
λ is first-order reaction rate (T-1),α is linear exchange coefficient (T-1),
is concentration of immobile phase (ML-3), and
Z is zero-order growth rate (ML-3T-1).
In this formulation, the diffusive flux qD between mobile and immobile water is the product of a linear exchange coefficient α and the difference in concentration between the two regions. Goode (1999) describes how MOC3D can be used to compute ground-water age for the case where degradation and sorption reactions are not considered. Under these conditions, equation 8 reduces to
(9)
where A is volume-average ground-water age since recharge (T),
A′ is age of water from external sources, is age of immobile water, and
Z is 1, unit growth rate.Coupled, multispecies transport in two-
dimensional ground-water flow is represented in BIOMOC by specifying eq. 7 for each solute l and including additional reaction terms to account for biodegradation. Each solute can be involved in more than one process, and the total solute uptake βl
is given by
(10)
where N is total number of biodegradation processes,
Vn is uptake rate of substrate by biodegradation process n (ML-3T-1),
βln is uptake coefficient of solute l for biodegradation process n.
Molar uptake coefficients (Essaid and Bekins, 1997) that were used to represent sequential reductive dechlorination of TCE in this study are listed in table 7. BIOMOC uses Monod kinetics to represent microbial growth and uptake from substrate and can account for the effects of growth and uptake inhibitors (such as competing reactions and the presence of oxygen) and the restricted availability of secondary substrates. The effects of inhibitors and the lack of secondary substrates were neglected in this study, and the microbial population was assumed constant with a unit concentration. As a result, the uptake rate V for each step in the reductive dechlorination process was given by
(11)where Vmax is asymptotic maximum specific uptake
rate of substrate (T-1),Ks is half-saturation constant, the substrate
ε∂C∂t-------
xi∂∂ εDij x j∂
∂C εvi∂C∂xi-------– qsC' Σℜ n+ +=
Rεt∂
∂Cxi∂∂ εDij x j∂
∂C εvi∂C∂xi-------– +=
qs C' C–( ) RελC α C C–( ) εZ+ + +
C
εt∂
∂Axi∂∂ εDij x j∂
∂A εvi∂A∂xi-------– +=
qs A' A–( ) α A A–( ) ε+ +
A
βl βlnV n
n 1=
N
∑=
VV maxC
Ks C+----------------=
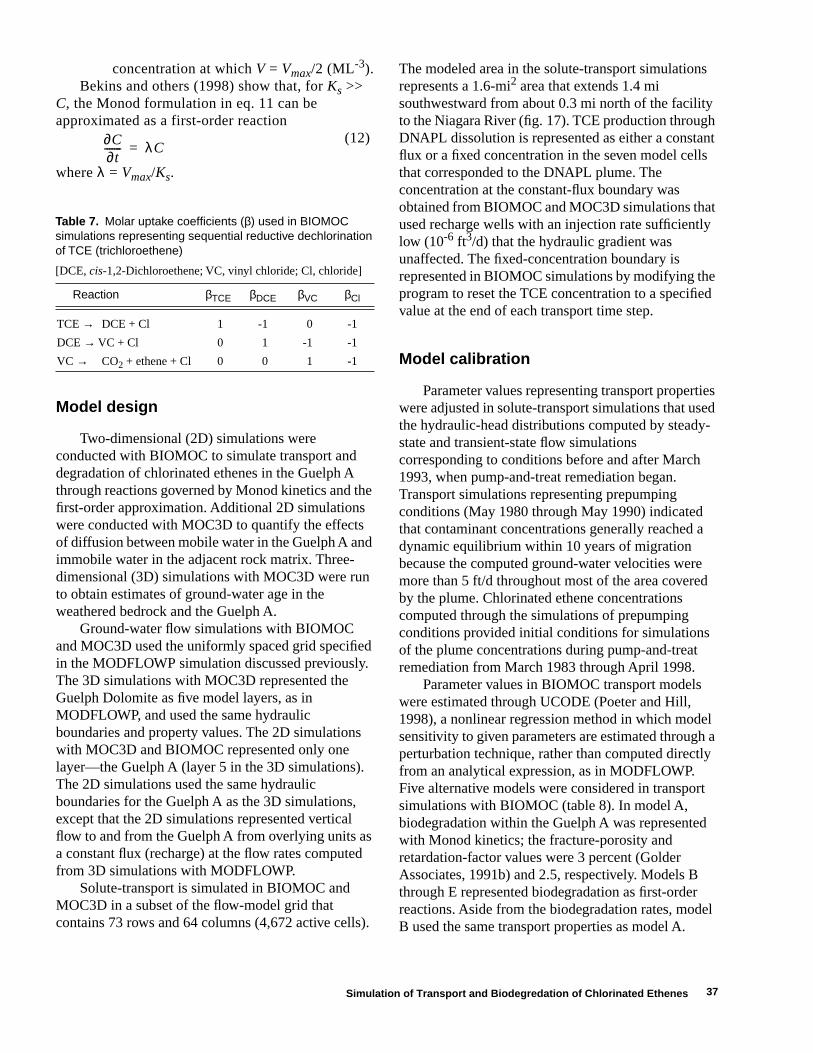
37
concentration at which V = Vmax/2 (ML-3).Bekins and others (1998) show that, for Ks >>
C, the Monod formulation in eq. 11 can be approximated as a first-order reaction
(12)
where λ = Vmax/Ks.
Model design
Two-dimensional (2D) simulations were conducted with BIOMOC to simulate transport and degradation of chlorinated ethenes in the Guelph A through reactions governed by Monod kinetics and the first-order approximation. Additional 2D simulations were conducted with MOC3D to quantify the effects of diffusion between mobile water in the Guelph A and immobile water in the adjacent rock matrix. Three-dimensional (3D) simulations with MOC3D were run to obtain estimates of ground-water age in the weathered bedrock and the Guelph A.
Ground-water flow simulations with BIOMOC and MOC3D used the uniformly spaced grid specified in the MODFLOWP simulation discussed previously. The 3D simulations with MOC3D represented the Guelph Dolomite as five model layers, as in MODFLOWP, and used the same hydraulic boundaries and property values. The 2D simulations with MOC3D and BIOMOC represented only one layer—the Guelph A (layer 5 in the 3D simulations). The 2D simulations used the same hydraulic boundaries for the Guelph A as the 3D simulations, except that the 2D simulations represented vertical flow to and from the Guelph A from overlying units as a constant flux (recharge) at the flow rates computed from 3D simulations with MODFLOWP.
Solute-transport is simulated in BIOMOC and MOC3D in a subset of the flow-model grid that contains 73 rows and 64 columns (4,672 active cells).
The modeled area in the solute-transport simulations represents a 1.6-mi2 area that extends 1.4 mi southwestward from about 0.3 mi north of the facility to the Niagara River (fig. 17). TCE production through DNAPL dissolution is represented as either a constant flux or a fixed concentration in the seven model cells that corresponded to the DNAPL plume. The concentration at the constant-flux boundary was obtained from BIOMOC and MOC3D simulations that used recharge wells with an injection rate sufficiently low (10-6 ft3/d) that the hydraulic gradient was unaffected. The fixed-concentration boundary is represented in BIOMOC simulations by modifying the program to reset the TCE concentration to a specified value at the end of each transport time step.
Model calibration
Parameter values representing transport properties were adjusted in solute-transport simulations that used the hydraulic-head distributions computed by steady-state and transient-state flow simulations corresponding to conditions before and after March 1993, when pump-and-treat remediation began. Transport simulations representing prepumping conditions (May 1980 through May 1990) indicated that contaminant concentrations generally reached a dynamic equilibrium within 10 years of migration because the computed ground-water velocities were more than 5 ft/d throughout most of the area covered by the plume. Chlorinated ethene concentrations computed through the simulations of prepumping conditions provided initial conditions for simulations of the plume concentrations during pump-and-treat remediation from March 1983 through April 1998.
Parameter values in BIOMOC transport models were estimated through UCODE (Poeter and Hill, 1998), a nonlinear regression method in which model sensitivity to given parameters are estimated through a perturbation technique, rather than computed directly from an analytical expression, as in MODFLOWP. Five alternative models were considered in transport simulations with BIOMOC (table 8). In model A, biodegradation within the Guelph A was represented with Monod kinetics; the fracture-porosity and retardation-factor values were 3 percent (Golder Associates, 1991b) and 2.5, respectively. Models B through E represented biodegradation as first-order reactions. Aside from the biodegradation rates, model B used the same transport properties as model A.
∂C∂t------- λC=
Table 7. Molar uptake coefficients (β) used in BIOMOC simulations representing sequential reductive dechlorination of TCE (trichloroethene)
[DCE, cis-1,2-Dichloroethene; VC, vinyl chloride; Cl, chloride]
Reaction βTCE βDCE βVC βCl
TCE → DCE + Cl 1 -1 0 -1
DCE → VC + Cl 0 1 -1 -1
VC → CO2 + ethene + Cl 0 0 1 -1
Simulation of Transport and Biodegredation of Chlorinated Ethenes
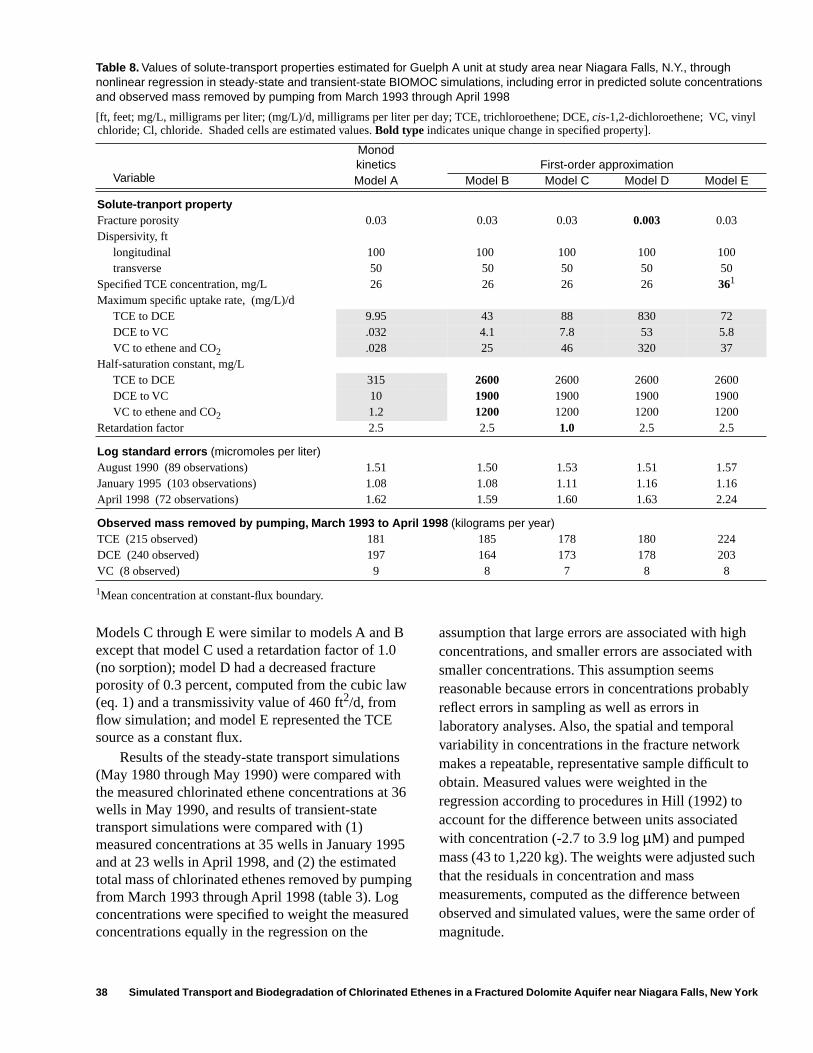
38 Simulated Transport and Biodegradation of Chlorinated Ethenes in a Fractured Dolomite Aquifer near Niagara Falls, New York
Models C through E were similar to models A and B except that model C used a retardation factor of 1.0 (no sorption); model D had a decreased fracture porosity of 0.3 percent, computed from the cubic law (eq. 1) and a transmissivity value of 460 ft2/d, from flow simulation; and model E represented the TCE source as a constant flux.
Results of the steady-state transport simulations (May 1980 through May 1990) were compared with the measured chlorinated ethene concentrations at 36 wells in May 1990, and results of transient-state transport simulations were compared with (1) measured concentrations at 35 wells in January 1995 and at 23 wells in April 1998, and (2) the estimated total mass of chlorinated ethenes removed by pumping from March 1993 through April 1998 (table 3). Log concentrations were specified to weight the measured concentrations equally in the regression on the
assumption that large errors are associated with high concentrations, and smaller errors are associated with smaller concentrations. This assumption seems reasonable because errors in concentrations probably reflect errors in sampling as well as errors in laboratory analyses. Also, the spatial and temporal variability in concentrations in the fracture network makes a repeatable, representative sample difficult to obtain. Measured values were weighted in the regression according to procedures in Hill (1992) to account for the difference between units associated with concentration (-2.7 to 3.9 log µM) and pumped mass (43 to 1,220 kg). The weights were adjusted such that the residuals in concentration and mass measurements, computed as the difference between observed and simulated values, were the same order of magnitude.
Table 8. Values of solute-transport properties estimated for Guelph A unit at study area near Niagara Falls, N.Y., through nonlinear regression in steady-state and transient-state BIOMOC simulations, including error in predicted solute concentrations and observed mass removed by pumping from March 1993 through April 1998
[ft, feet; mg/L, milligrams per liter; (mg/L)/d, milligrams per liter per day; TCE, trichloroethene; DCE, cis-1,2-dichloroethene; VC, vinyl chloride; Cl, chloride. Shaded cells are estimated values. Bold type indicates unique change in specified property].
Variable
Monod kinetics First-order approximationModel A Model B Model C Model D Model E
Solute-tranport propertyFracture porosity 0.03 0.03 0.03 0.003 0.03Dispersivity, ft
longitudinal 100 100 100 100 100transverse 50 50 50 50 50
Specified TCE concentration, mg/L 26 26 26 26 361
1Mean concentration at constant-flux boundary.
Maximum specific uptake rate, (mg/L)/dTCE to DCE 9.95 43 88 830 72DCE to VC .032 4.1 7.8 53 5.8VC to ethene and CO2 .028 25 46 320 37
Half-saturation constant, mg/LTCE to DCE 315 2600 2600 2600 2600DCE to VC 10 1900 1900 1900 1900VC to ethene and CO2 1.2 1200 1200 1200 1200
Retardation factor 2.5 2.5 1.0 2.5 2.5
Log standard errors (micromoles per liter) August 1990 (89 observations) 1.51 1.50 1.53 1.51 1.57January 1995 (103 observations) 1.08 1.08 1.11 1.16 1.16April 1998 (72 observations) 1.62 1.59 1.60 1.63 2.24
Observed mass removed by pumping, March 1993 to April 1998 (kilograms per year)TCE (215 observed) 181 185 178 180 224DCE (240 observed) 197 164 173 178 203VC (8 observed) 9 8 7 8 8
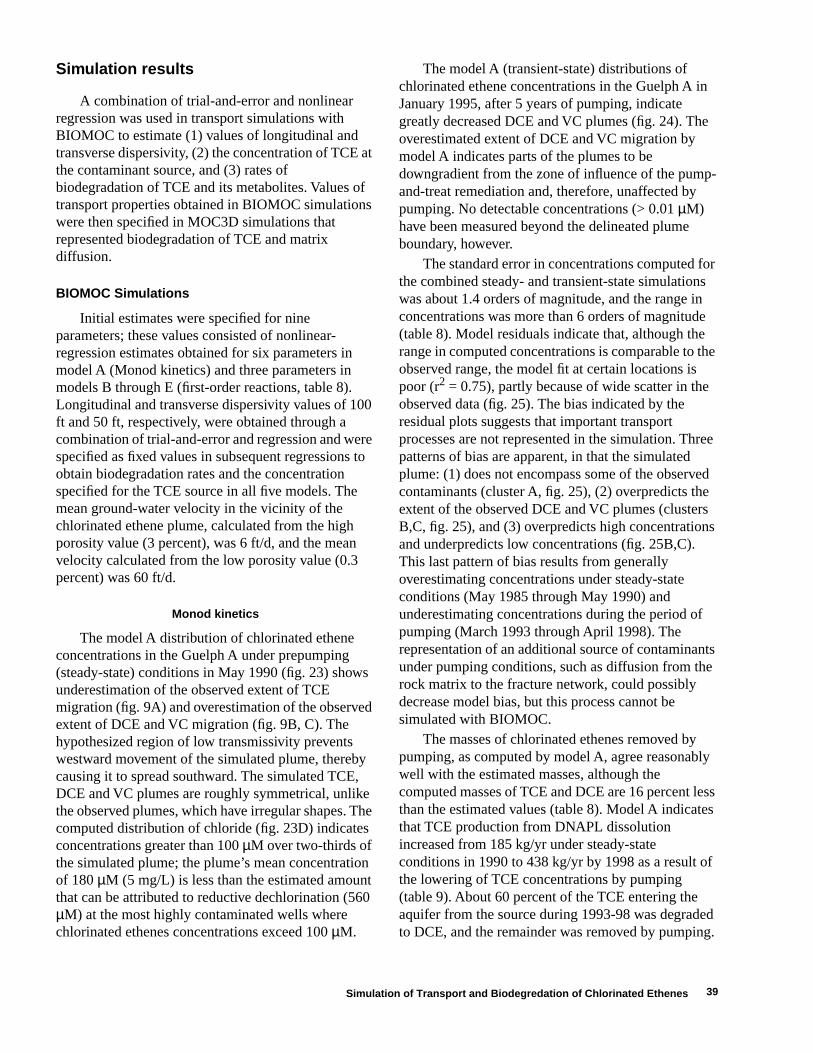
39
Simulation results
A combination of trial-and-error and nonlinear regression was used in transport simulations with BIOMOC to estimate (1) values of longitudinal and transverse dispersivity, (2) the concentration of TCE at the contaminant source, and (3) rates of biodegradation of TCE and its metabolites. Values of transport properties obtained in BIOMOC simulations were then specified in MOC3D simulations that represented biodegradation of TCE and matrix diffusion.
BIOMOC Simulations
Initial estimates were specified for nine parameters; these values consisted of nonlinear-regression estimates obtained for six parameters in model A (Monod kinetics) and three parameters in models B through E (first-order reactions, table 8). Longitudinal and transverse dispersivity values of 100 ft and 50 ft, respectively, were obtained through a combination of trial-and-error and regression and were specified as fixed values in subsequent regressions to obtain biodegradation rates and the concentration specified for the TCE source in all five models. The mean ground-water velocity in the vicinity of the chlorinated ethene plume, calculated from the high porosity value (3 percent), was 6 ft/d, and the mean velocity calculated from the low porosity value (0.3 percent) was 60 ft/d.
Monod kinetics
The model A distribution of chlorinated ethene concentrations in the Guelph A under prepumping (steady-state) conditions in May 1990 (fig. 23) shows underestimation of the observed extent of TCE migration (fig. 9A) and overestimation of the observed extent of DCE and VC migration (fig. 9B, C). The hypothesized region of low transmissivity prevents westward movement of the simulated plume, thereby causing it to spread southward. The simulated TCE, DCE and VC plumes are roughly symmetrical, unlike the observed plumes, which have irregular shapes. The computed distribution of chloride (fig. 23D) indicates concentrations greater than 100 µM over two-thirds of the simulated plume; the plume’s mean concentration of 180 µM (5 mg/L) is less than the estimated amount that can be attributed to reductive dechlorination (560 µM) at the most highly contaminated wells where chlorinated ethenes concentrations exceed 100 µM.
The model A (transient-state) distributions of chlorinated ethene concentrations in the Guelph A in January 1995, after 5 years of pumping, indicate greatly decreased DCE and VC plumes (fig. 24). The overestimated extent of DCE and VC migration by model A indicates parts of the plumes to be downgradient from the zone of influence of the pump-and-treat remediation and, therefore, unaffected by pumping. No detectable concentrations (> 0.01 µM) have been measured beyond the delineated plume boundary, however.
The standard error in concentrations computed for the combined steady- and transient-state simulations was about 1.4 orders of magnitude, and the range in concentrations was more than 6 orders of magnitude (table 8). Model residuals indicate that, although the range in computed concentrations is comparable to the observed range, the model fit at certain locations is poor (r2 = 0.75), partly because of wide scatter in the observed data (fig. 25). The bias indicated by the residual plots suggests that important transport processes are not represented in the simulation. Three patterns of bias are apparent, in that the simulated plume: (1) does not encompass some of the observed contaminants (cluster A, fig. 25), (2) overpredicts the extent of the observed DCE and VC plumes (clusters B,C, fig. 25), and (3) overpredicts high concentrations and underpredicts low concentrations (fig. 25B,C). This last pattern of bias results from generally overestimating concentrations under steady-state conditions (May 1985 through May 1990) and underestimating concentrations during the period of pumping (March 1993 through April 1998). The representation of an additional source of contaminants under pumping conditions, such as diffusion from the rock matrix to the fracture network, could possibly decrease model bias, but this process cannot be simulated with BIOMOC.
The masses of chlorinated ethenes removed by pumping, as computed by model A, agree reasonably well with the estimated masses, although the computed masses of TCE and DCE are 16 percent less than the estimated values (table 8). Model A indicates that TCE production from DNAPL dissolution increased from 185 kg/yr under steady-state conditions in 1990 to 438 kg/yr by 1998 as a result of the lowering of TCE concentrations by pumping (table 9). About 60 percent of the TCE entering the aquifer from the source during 1993-98 was degraded to DCE, and the remainder was removed by pumping.
Simulation of Transport and Biodegredation of Chlorinated Ethenes
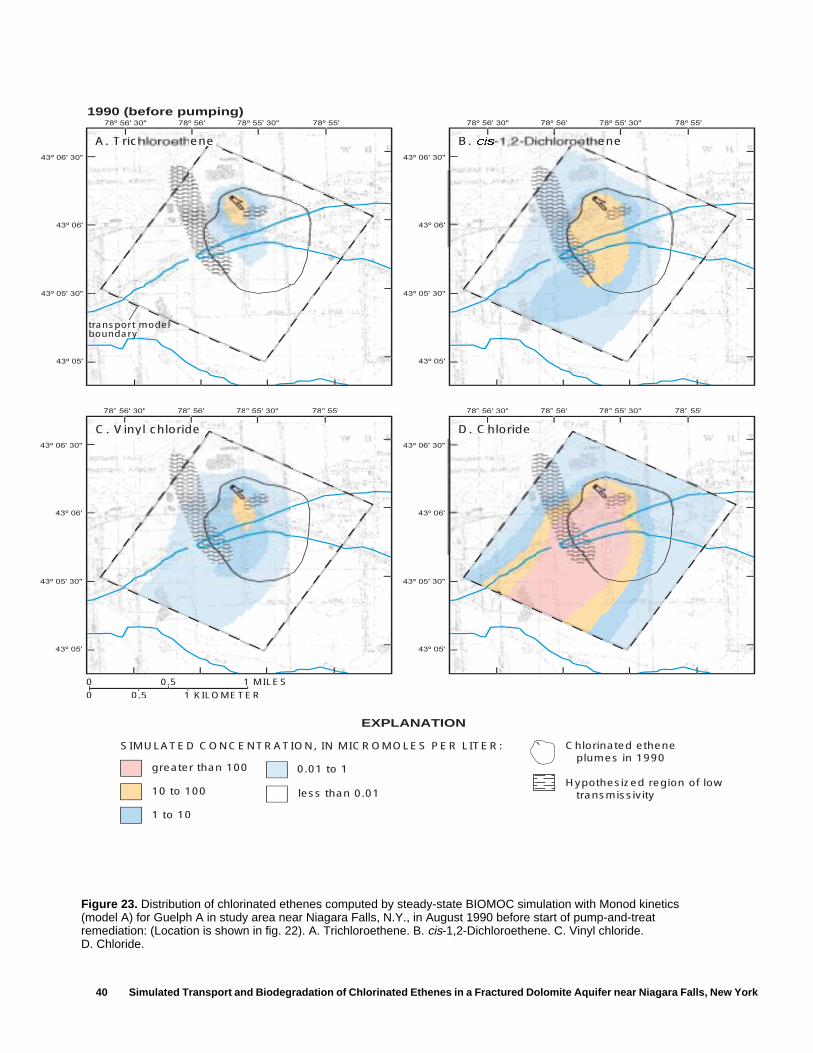
40 Simulated Transport and Biodegradation of Chlorinated Ethenes in a Fractured Dolomite Aquifer near Niagara Falls, New York
Chlorinated ethene plumes in 1990
Hypothesized region of low transmissivity10 to 100
1 to 10
0.01 to 1
SIMULATED CONCENTRATION, IN MICROMOLES PER LITER:
1990 (before pumping)
greater than 100
less than 0.01
EXPLANATION
0.5 1 MILES0
0 0.5 1 KILOMETER
transport modelboundaryy
C. Vinyl chloride D. Chloride
B. cis-1,2-DichloroetheneA. Trichloroethenene
78º 55'78º 55' 30"78º 56'
43º 06'
43º 05' 30"
43º 06' 30"
43º 05'
78º 56' 30" 78º 55'78º 55' 30"78º 56'
43º 06'
43º 05' 30"
43º 06' 30"
43º 05'
78º 56' 30"
78º 55'78º 55' 30"78º 56'
43º 06'
43º 05' 30"
43º 06' 30"
43º 05'
78º 56' 30"78º 55'78º 55' 30"78º 56'
43º 06'
43º 05' 30"
43º 06' 30"
43º 05'
78º 56' 30"
Figure 23. Distribution of chlorinated ethenes computed by steady-state BIOMOC simulation with Monod kinetics (model A) for Guelph A in study area near Niagara Falls, N.Y., in August 1990 before start of pump-and-treat remediation: (Location is shown in fig. 22). A. Trichloroethene. B. cis-1,2-Dichloroethene. C. Vinyl chloride. D. Chloride.
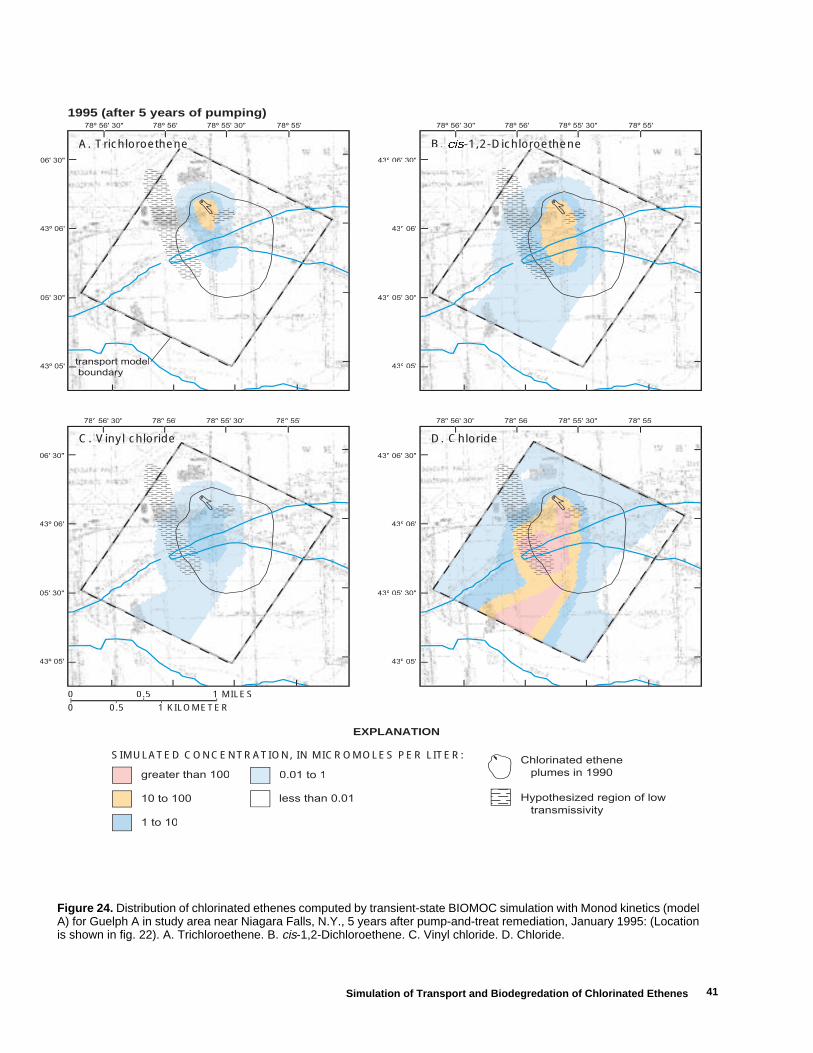
41
Chlorinated ethene
plumes in 1990
Hypothesized region of low
transmissivity
EXPLANATION
10 to 100
1 to 10
0.01 to 1greater than 100
less than 0.01
SIMULATED CONCENTRATION, IN MICROMOLES PER LITER:
1995 (after 5 years of pumping)
0.5 1 MILES0
0 0.5 1 KILOMETER
transport modell
boundary
C. Vinyl chloride D. Chloride
A. Trichloroethenene B. cis-1,2-Dichloroetheneoro
78º 55'78º 55' 30"78º 56'
43º 06'
05' 30"
06' 30"
43º 05'
78º 56' 30" 78º 55'78º 55' 30"78º 56'
43º 06'
43º 05' 30"
43º 06' 30"
43º 05'
78º 56' 30"
78º 55'78º 55' 30"78º 56'
43º 06'
43º 05' 30"
43º 06' 30"
43º 05'
78º 56' 30"78º 55'78º 55' 30"78º 56'
43º 06'
05' 30"
06' 30"
43º 05'
78º 56' 30"
Figure 24. Distribution of chlorinated ethenes computed by transient-state BIOMOC simulation with Monod kinetics (model A) for Guelph A in study area near Niagara Falls, N.Y., 5 years after pump-and-treat remediation, January 1995: (Location is shown in fig. 22). A. Trichloroethene. B. cis-1,2-Dichloroethene. C. Vinyl chloride. D. Chloride.
Simulation of Transport and Biodegredation of Chlorinated Ethenes
42 Simulated Transport and Biodegradation of Chlorinated Ethenes in a Fractured Dolomite Aquifer near Niagara Falls, New York
cluster A
cluster B
cluster C
4-4 -3 -2 -1 0 1 2 3-4
4
-3
-2
-1
0
1
2
3
-4
4
-3
-2
-1
0
1
2
3
-4 4-3 -2 -1 0 1 2 3
May 1990 Jan 1995 Apr 1998
underpredictedoverpredicted
underpredictedoverpredicted
underpredictedoverpredicted
underpredicted
overpredicte
d
underpredicted
overpredicte
d
underpredicted
overpredicte
d
CONCENTRATIONS
A. Trichloroethene
B. cis-1,2-Dichloroethene
C. Vinyl Chloride
RESIDUALS
EXPLANATION
-4 4-3 -2 -1 0 1 2 3-4
4
-3
-2
-1
0
1
2
3
-4
4
-3
-2
-1
0
1
2
3
-4 4-3 -2 -1 0 1 2 3
-4 4-3 -2 -1 0 1 2 3-4
4
-3
-2
-1
0
1
2
3
-4
4
-3
-2
-1
0
1
2
3
-4 4-3 -2 -1 0 1 2 3
SIMULATED LOG TCE, IN MICROMOLES PER LITERSIMULATED LOG TCE, IN MICROMOLES PER LITER
SIMULATED LOG DCE, IN MICROMOLES PER LITERSIMULATED LOG DCE, IN MICROMOLES PER LITER
SIMULATED LOG VC, IN MICROMOLES PER LITERSIMULATED LOG VC, IN MICROMOLES PER LITER
RE
SID
UA
L, IN
LO
GM
ICR
OM
OLE
S P
ER
LIT
ER
RE
SID
UA
L, IN
LO
GM
ICR
OM
OLE
S P
ER
LIT
ER
RE
SID
UA
L, IN
LO
GM
ICR
OM
OLE
S P
ER
LIT
ER
ME
AS
UR
ED
LO
G T
CE
, IN
MIC
RO
MO
LES
PE
R L
ITE
RM
EA
SU
RE
D L
OG
DC
E, I
NM
ICR
OM
OLE
S P
ER
LIT
ER
ME
AS
UR
ED
LO
G V
C, I
NM
ICR
OM
OLE
S P
ER
LIT
ER
Figure 25. Measured and simulated concentrations of selected contaminants at study site near Niagara Falls, N.Y., and residuals, computed from steady-state and transient-state BIOMOC simulation with Monod kinetics (model A): A. Trichloroethene. B. cis-1,2-Dichloroethene. C. Vinyl chloride.
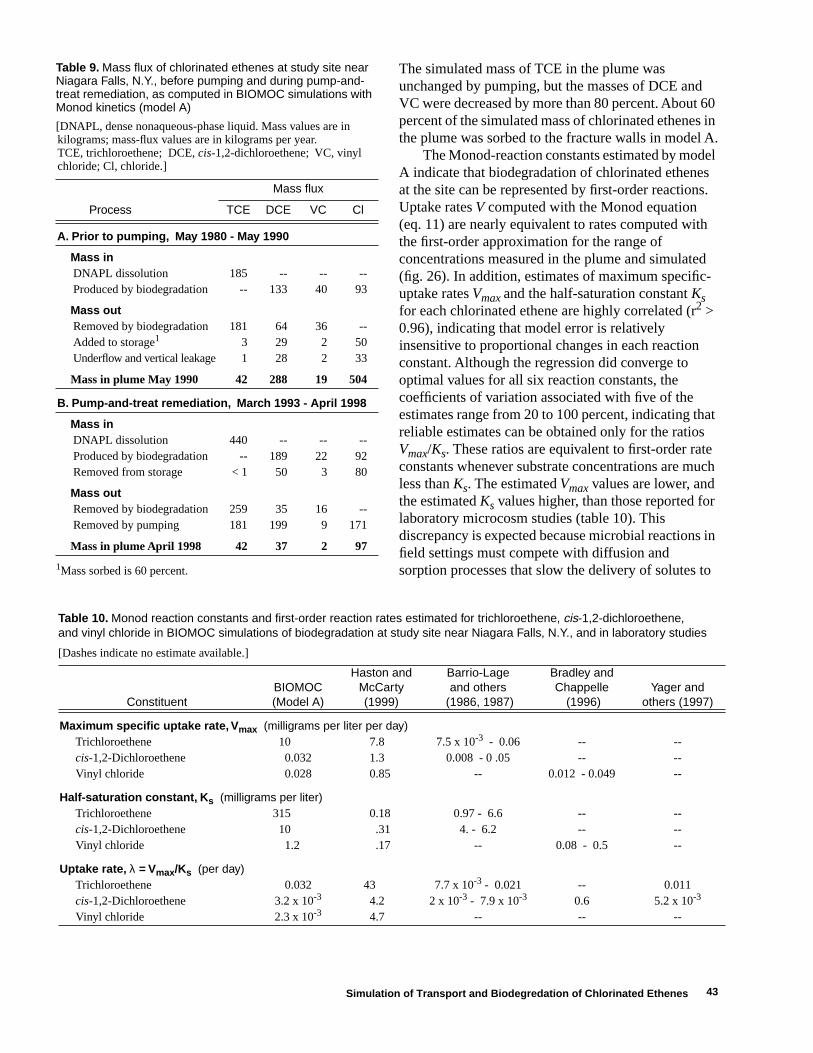
43
Table 9. Mass flux of chlorinated ethenes at study site near Niagara Falls, N.Y., before pumping and during pump-and-treat remediation, as computed in BIOMOC simulations with Monod kinetics (model A)
[DNAPL, dense nonaqueous-phase liquid. Mass values are in kilograms; mass-flux values are in kilograms per year. TCE, trichloroethene; DCE, cis-1,2-dichloroethene; VC, vinyl chloride; Cl, chloride.]
Process
Mass flux
TCE DCE VC Cl
A. Prior to pumping, May 1980 - May 1990
Mass inDNAPL dissolution 185 -- -- --Produced by biodegradation -- 133 40 93
Mass outRemoved by biodegradation 181 64 36 --Added to storage1
1Mass sorbed is 60 percent.
3 29 2 50Underflow and vertical leakage 1 28 2 33
Mass in plume May 1990 42 288 19 504
B. Pump-and-treat remediation, March 1993 - April 1998
Mass inDNAPL dissolution 440 -- -- --Produced by biodegradation -- 189 22 92Removed from storage < 1 50 3 80
Mass outRemoved by biodegradation 259 35 16 --Removed by pumping 181 199 9 171
Mass in plume April 1998 42 37 2 97
The simulated mass of TCE in the plume was unchanged by pumping, but the masses of DCE and VC were decreased by more than 80 percent. About 60 percent of the simulated mass of chlorinated ethenes in the plume was sorbed to the fracture walls in model A.
The Monod-reaction constants estimated by model A indicate that biodegradation of chlorinated ethenes at the site can be represented by first-order reactions. Uptake rates V computed with the Monod equation (eq. 11) are nearly equivalent to rates computed with the first-order approximation for the range of concentrations measured in the plume and simulated (fig. 26). In addition, estimates of maximum specific-uptake rates Vmax and the half-saturation constant Ks for each chlorinated ethene are highly correlated (r2 > 0.96), indicating that model error is relatively insensitive to proportional changes in each reaction constant. Although the regression did converge to optimal values for all six reaction constants, the coefficients of variation associated with five of the estimates range from 20 to 100 percent, indicating that reliable estimates can be obtained only for the ratios Vmax/Ks. These ratios are equivalent to first-order rate constants whenever substrate concentrations are much less than Ks. The estimated Vmax values are lower, and the estimated Ks values higher, than those reported for laboratory microcosm studies (table 10). This discrepancy is expected because microbial reactions in field settings must compete with diffusion and sorption processes that slow the delivery of solutes to
Table 10. Monod reaction constants and first-order reaction rates estimated for trichloroethene, cis-1,2-dichloroethene, and vinyl chloride in BIOMOC simulations of biodegradation at study site near Niagara Falls, N.Y., and in laboratory studies
[Dashes indicate no estimate available.]
Constituent BIOMOC (Model A)
Haston and McCarty (1999)
Barrio-Lage and others
(1986, 1987)
Bradley and Chappelle
(1996)Yager and
others (1997)
Maximum specific uptake rate, V max (milligrams per liter per day)Trichloroethene 10 7.8 7.5 x 10⁻³ - 0.06 -- --cis-1,2-Dichloroethene 0.032 1.3 0.008 - 0 .05 -- --Vinyl chloride 0.028 0.85 -- 0.012 - 0.049 --
Half-saturation constant, K s (milligrams per liter)Trichloroethene 315 0.18 0.97 - 6.6 -- --cis-1,2-Dichloroethene 10 .31 4. - 6.2 -- --Vinyl chloride 1.2 .17 -- 0.08 - 0.5 --
Uptake rate, λ = Vmax/Ks (per day)Trichloroethene 0.032 43 7.7 x 10⁻³ - 0.021 -- 0.011cis-1,2-Dichloroethene 3.2 x 10⁻³ 4.2 2 x 10⁻³ - 7.9 x 10⁻³ 0.6 5.2 x 10⁻³
Vinyl chloride 2.3 x 10⁻³ 4.7 -- -- --
Simulation of Transport and Biodegredation of Chlorinated Ethenes
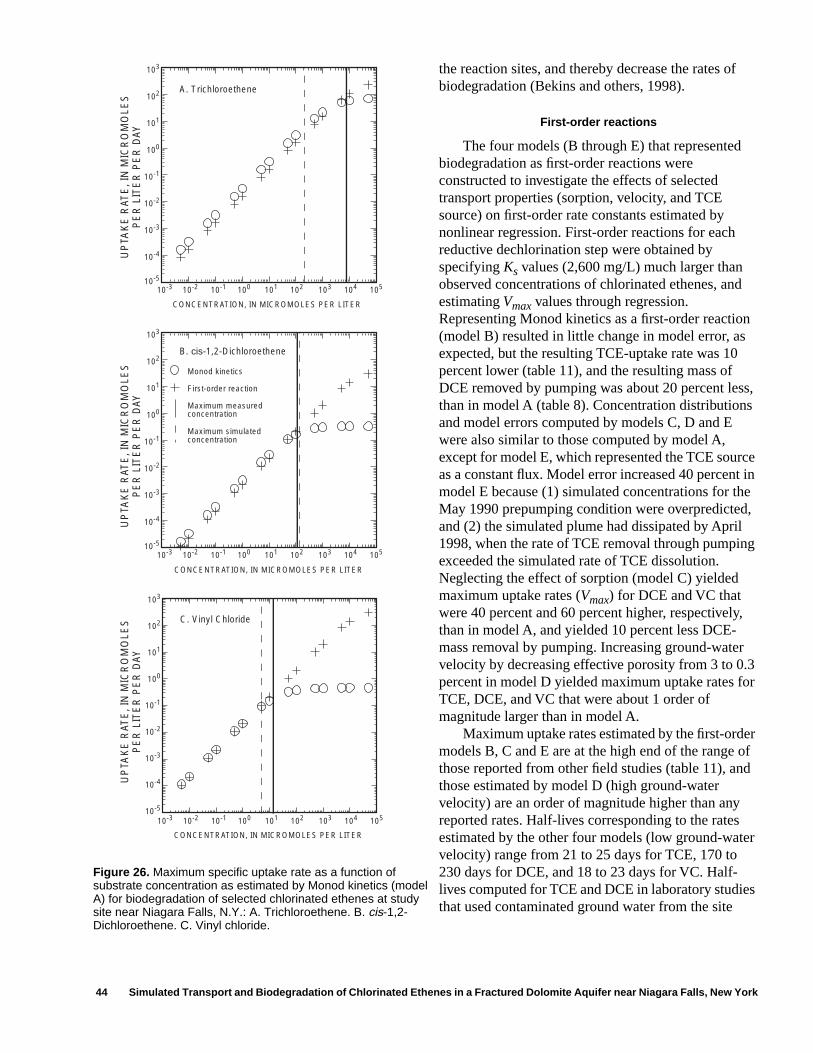
44 Simulated Transport and Biodegradation of Chlorinated Ethenes in a Fractured Dolomite Aquifer near Niagara Falls, New York
the reaction sites, and thereby decrease the rates of biodegradation (Bekins and others, 1998).
First-order reactions
The four models (B through E) that represented biodegradation as first-order reactions were constructed to investigate the effects of selected transport properties (sorption, velocity, and TCE source) on first-order rate constants estimated by nonlinear regression. First-order reactions for each reductive dechlorination step were obtained by specifying Ks values (2,600 mg/L) much larger than observed concentrations of chlorinated ethenes, and estimating Vmax values through regression. Representing Monod kinetics as a first-order reaction (model B) resulted in little change in model error, as expected, but the resulting TCE-uptake rate was 10 percent lower (table 11), and the resulting mass of DCE removed by pumping was about 20 percent less, than in model A (table 8). Concentration distributions and model errors computed by models C, D and E were also similar to those computed by model A, except for model E, which represented the TCE source as a constant flux. Model error increased 40 percent in model E because (1) simulated concentrations for the May 1990 prepumping condition were overpredicted, and (2) the simulated plume had dissipated by April 1998, when the rate of TCE removal through pumping exceeded the simulated rate of TCE dissolution. Neglecting the effect of sorption (model C) yielded maximum uptake rates (Vmax) for DCE and VC that were 40 percent and 60 percent higher, respectively, than in model A, and yielded 10 percent less DCE-mass removal by pumping. Increasing ground-water velocity by decreasing effective porosity from 3 to 0.3 percent in model D yielded maximum uptake rates for TCE, DCE, and VC that were about 1 order of magnitude larger than in model A.
Maximum uptake rates estimated by the first-order models B, C and E are at the high end of the range of those reported from other field studies (table 11), and those estimated by model D (high ground-water velocity) are an order of magnitude higher than any reported rates. Half-lives corresponding to the rates estimated by the other four models (low ground-water velocity) range from 21 to 25 days for TCE, 170 to 230 days for DCE, and 18 to 23 days for VC. Half-lives computed for TCE and DCE in laboratory studies that used contaminated ground water from the site
A. Trichloroethene
B. cis-1,2-Dichloroethene
C. Vinyl Chloride
CONCENTRATION, IN MICROMOLES PER LITER
CONCENTRATION, IN MICROMOLES PER LITER
CONCENTRATION, IN MICROMOLES PER LITER
UP
TAK
E R
ATE
, IN
MIC
RO
MO
LES
PE
R L
ITE
R P
ER
DAY
UP
TAK
E R
ATE
, IN
MIC
RO
MO
LES
PE
R L
ITE
R P
ER
DAY
UP
TAK
E R
ATE
, IN
MIC
RO
MO
LES
PE
R L
ITE
R P
ER
DAY
10-5
103
10-4
10-3
10-2
10-1
100
101
102
10-5
103
10-4
10-3
10-2
10-1
100
101
102
10-5
103
10-4
10-3
10-2
10-1
100
101
102
10-3 10-2 10-1 100 101 102 103 104 105
10-3 10-2 10-1 100 101 102 103 104 105
10-3 10-2 10-1 100 101 102 103 104 105
First-order reaction
Maximum measuredconcentration
Monod kinetics
Maximum simulatedconcentration
Figure 26. Maximum specific uptake rate as a function of substrate concentration as estimated by Monod kinetics (model A) for biodegradation of selected chlorinated ethenes at study site near Niagara Falls, N.Y.: A. Trichloroethene. B. cis-1,2-Dichloroethene. C. Vinyl chloride.
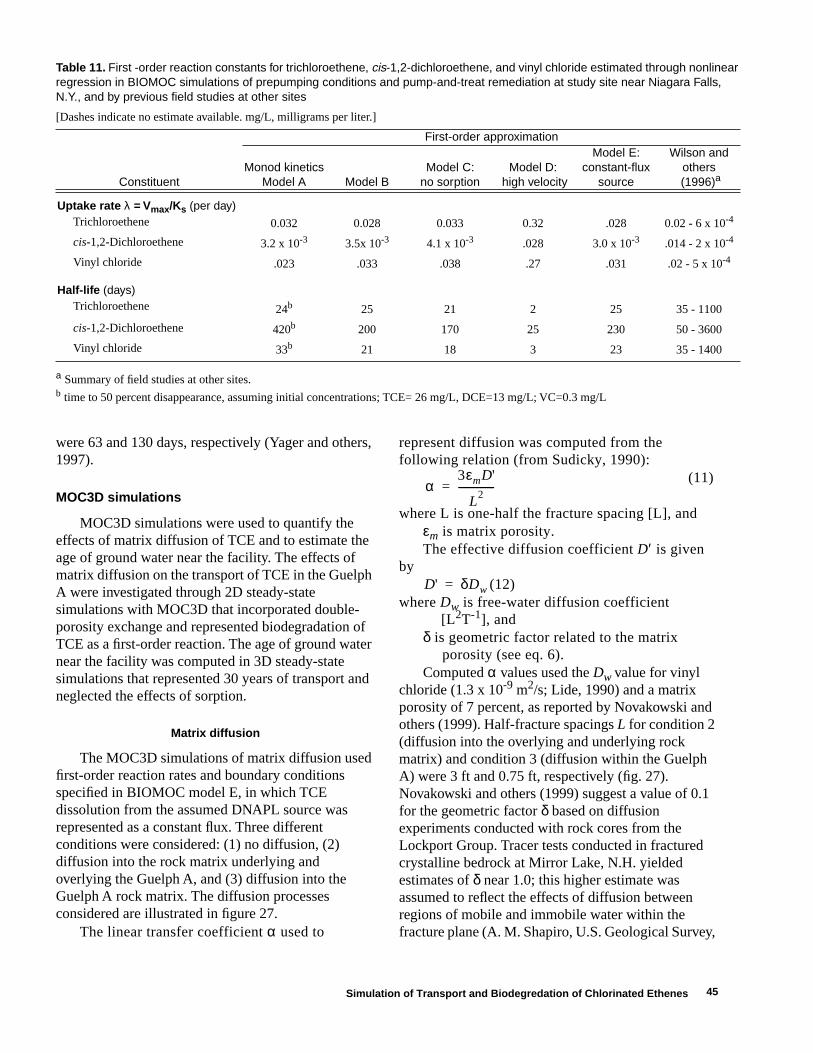
45
were 63 and 130 days, respectively (Yager and others, 1997).
MOC3D simulations
MOC3D simulations were used to quantify the effects of matrix diffusion of TCE and to estimate the age of ground water near the facility. The effects of matrix diffusion on the transport of TCE in the Guelph A were investigated through 2D steady-state simulations with MOC3D that incorporated double-porosity exchange and represented biodegradation of TCE as a first-order reaction. The age of ground water near the facility was computed in 3D steady-state simulations that represented 30 years of transport and neglected the effects of sorption.
Matrix diffusion
The MOC3D simulations of matrix diffusion used first-order reaction rates and boundary conditions specified in BIOMOC model E, in which TCE dissolution from the assumed DNAPL source was represented as a constant flux. Three different conditions were considered: (1) no diffusion, (2) diffusion into the rock matrix underlying and overlying the Guelph A, and (3) diffusion into the Guelph A rock matrix. The diffusion processes considered are illustrated in figure 27.
The linear transfer coefficient α used to
represent diffusion was computed from the following relation (from Sudicky, 1990):
(11)
where L is one-half the fracture spacing [L], andεm is matrix porosity.The effective diffusion coefficient D′ is given
by(12)
where Dw is free-water diffusion coefficient [L2T-1], and
δ is geometric factor related to the matrix porosity (see eq. 6).
Computed α values used the Dw value for vinyl chloride (1.3 x 10⁻⁹ m2/s; Lide, 1990) and a matrix porosity of 7 percent, as reported by Novakowski and others (1999). Half-fracture spacings L for condition 2 (diffusion into the overlying and underlying rock matrix) and condition 3 (diffusion within the Guelph A) were 3 ft and 0.75 ft, respectively (fig. 27). Novakowski and others (1999) suggest a value of 0.1 for the geometric factor δ based on diffusion experiments conducted with rock cores from the Lockport Group. Tracer tests conducted in fractured crystalline bedrock at Mirror Lake, N.H. yielded estimates of δ near 1.0; this higher estimate was assumed to reflect the effects of diffusion between regions of mobile and immobile water within the fracture plane (A. M. Shapiro, U.S. Geological Survey,
α3εmD'
L2
---------------=
D' δDw=
Table 11. First -order reaction constants for trichloroethene, cis-1,2-dichloroethene, and vinyl chloride estimated through nonlinear regression in BIOMOC simulations of prepumping conditions and pump-and-treat remediation at study site near Niagara Falls, N.Y., and by previous field studies at other sites
[Dashes indicate no estimate available. mg/L, milligrams per liter.]
a Summary of field studies at other sites.b time to 50 percent disappearance, assuming initial concentrations; TCE= 26 mg/L, DCE=13 mg/L; VC=0.3 mg/L
Constituent
First-order approximation
Monod kineticsModel A Model B
Model C: no sorption
Model D: high velocity
Model E: constant-flux
source
Wilson and others
(1996)a
Uptake rate λ = Vmax/Ks (per day)Trichloroethene 0.032 0.028 0.033 0.32 .028 0.02 - 6 x 10⁻⁴
cis-1,2-Dichloroethene 3.2 x 10⁻³ 3.5x 10⁻³ 4.1 x 10⁻³ .028 3.0 x 10⁻³ .014 - 2 x 10⁻⁴
Vinyl chloride .023 .033 .038 .27 .031 .02 - 5 x 10⁻⁴
Half-life (days)Trichloroethene 24b 25 21 2 25 35 - 1100
cis-1,2-Dichloroethene 420b 200 170 25 230 50 - 3600
Vinyl chloride 33b 21 18 3 23 35 - 1400
Simulation of Transport and Biodegredation of Chlorinated Ethenes
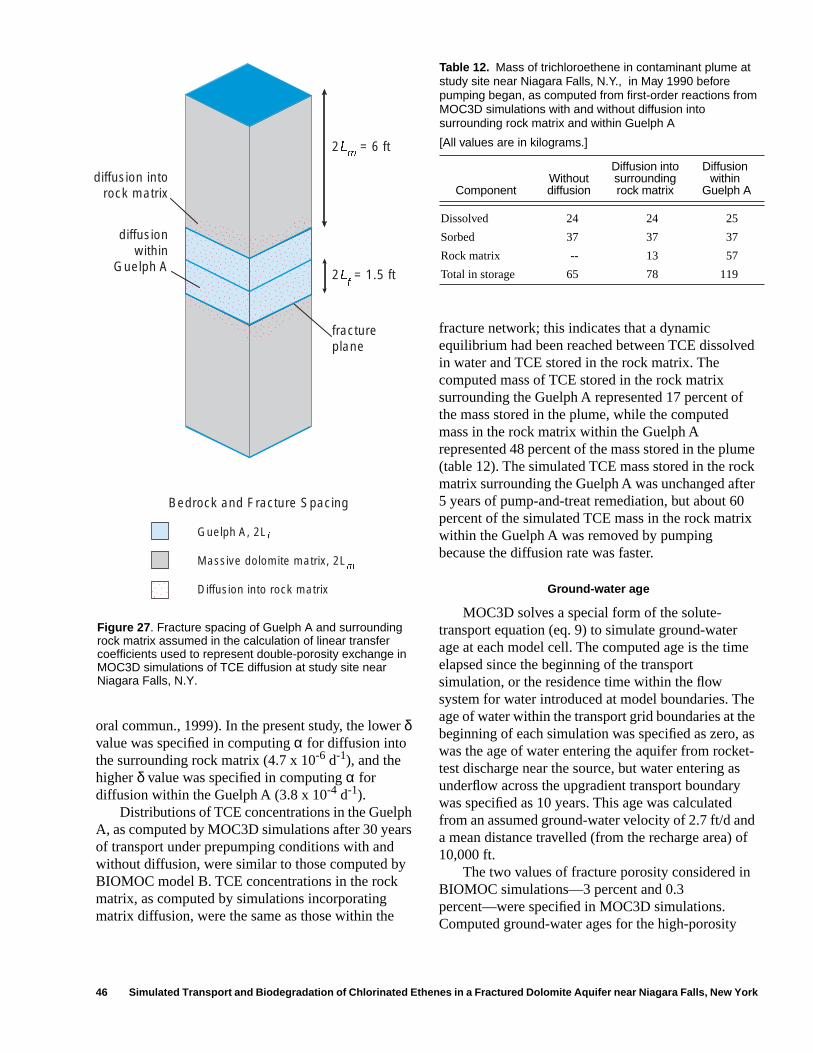
46 Simulated Transport and Biodegradation of Chlorinated Ethenes in a Fractured Dolomite Aquifer near Niagara Falls, New York
2Lf = 1.5 ft
2Lm = 6 ft
diffusionwithin
Guelph A
diffusion into rock matrix
fractureplane
Bedrock and Fracture Spacing
Guelph A, 2LfMassive dolomite matrix, 2L
m
Diffusion into rock matrix
oral commun., 1999). In the present study, the lower δ value was specified in computing α for diffusion into the surrounding rock matrix (4.7 x 10⁻⁶ d-1), and the higher δ value was specified in computing α for diffusion within the Guelph A (3.8 x 10⁻⁴ d-1).
Distributions of TCE concentrations in the Guelph A, as computed by MOC3D simulations after 30 years of transport under prepumping conditions with and without diffusion, were similar to those computed by BIOMOC model B. TCE concentrations in the rock matrix, as computed by simulations incorporating matrix diffusion, were the same as those within the
fracture network; this indicates that a dynamic equilibrium had been reached between TCE dissolved in water and TCE stored in the rock matrix. The computed mass of TCE stored in the rock matrix surrounding the Guelph A represented 17 percent of the mass stored in the plume, while the computed mass in the rock matrix within the Guelph A represented 48 percent of the mass stored in the plume (table 12). The simulated TCE mass stored in the rock matrix surrounding the Guelph A was unchanged after 5 years of pump-and-treat remediation, but about 60 percent of the simulated TCE mass in the rock matrix within the Guelph A was removed by pumping because the diffusion rate was faster.
Ground-water age
MOC3D solves a special form of the solute-transport equation (eq. 9) to simulate ground-water age at each model cell. The computed age is the time elapsed since the beginning of the transport simulation, or the residence time within the flow system for water introduced at model boundaries. The age of water within the transport grid boundaries at the beginning of each simulation was specified as zero, as was the age of water entering the aquifer from rocket-test discharge near the source, but water entering as underflow across the upgradient transport boundary was specified as 10 years. This age was calculated from an assumed ground-water velocity of 2.7 ft/d and a mean distance travelled (from the recharge area) of 10,000 ft.
The two values of fracture porosity considered in BIOMOC simulations—3 percent and 0.3 percent—were specified in MOC3D simulations. Computed ground-water ages for the high-porosity
Figure 27 . Fracture spacing of Guelph A and surrounding rock matrix assumed in the calculation of linear transfer coefficients used to represent double-porosity exchange in MOC3D simulations of TCE diffusion at study site near Niagara Falls, N.Y.
Table 12. Mass of trichloroethene in contaminant plume at study site near Niagara Falls, N.Y., in May 1990 before pumping began, as computed from first-order reactions from MOC3D simulations with and without diffusion into surrounding rock matrix and within Guelph A
[All values are in kilograms.]
Component Without diffusion
Diffusion into surrounding rock matrix
Diffusion within
Guelph A
Dissolved 24 24 25
Sorbed 37 37 37
Rock matrix -- 13 57
Total in storage 65 78 119
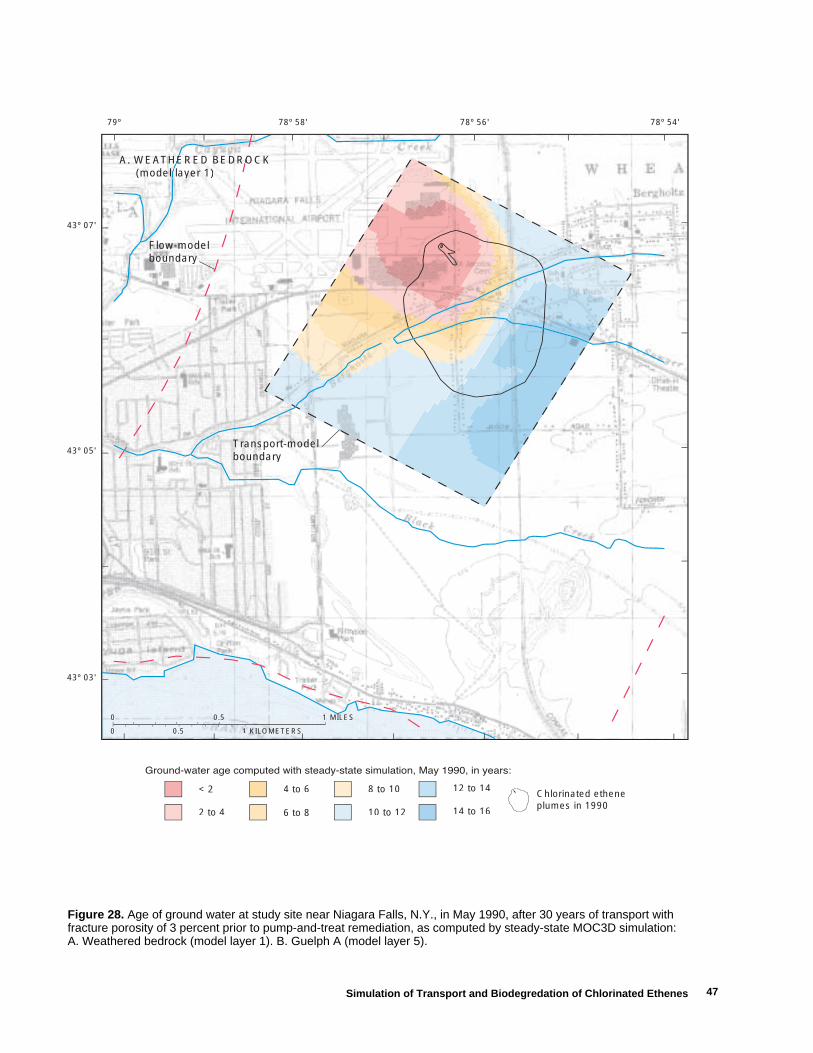
47
0.5 MILES1
0.5 KILOMETERS1
0
0
Chlorinated ethene plumes in 1990
< 2
2 to 4
4 to 6
6 to 8
8 to 10
10 to 12
12 to 14
14 to 16
A. WEATHERED BEDROCKROHE (model layer 1)
Flow-modelboundary
Transport-modelboundary
79º
43º 07'
43º 05'
43º 03'
78º 58' 78º 56' 78º 54'
Figure 28. Age of ground water at study site near Niagara Falls, N.Y., in May 1990, after 30 years of transport with fracture porosity of 3 percent prior to pump-and-treat remediation, as computed by steady-state MOC3D simulation: A. Weathered bedrock (model layer 1). B. Guelph A (model layer 5).
Simulation of Transport and Biodegredation of Chlorinated Ethenes
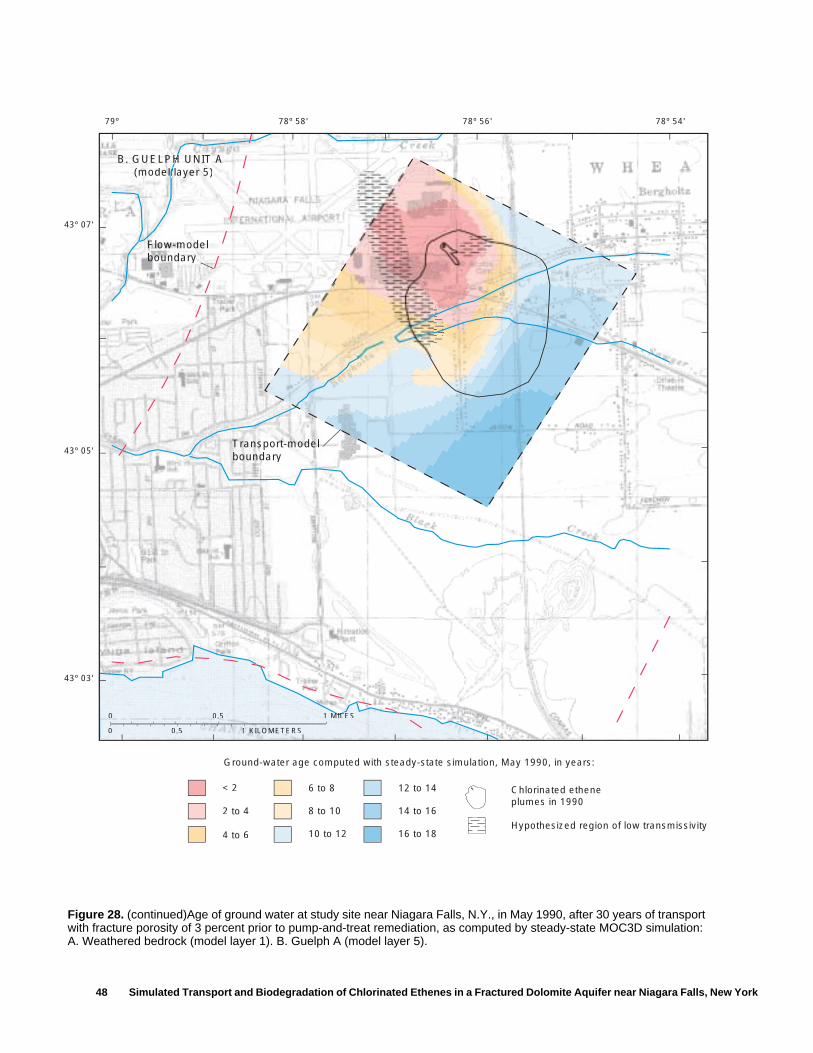
48 Simulated Transport and Biodegradation of Chlorinated Ethenes in a Fractured Dolomite Aquifer near Niagara Falls, New York
Chlorinated ethene plumes in 1990
Hypothesized region of low transmissivity
Ground-water age computed with steady-state simulation, May 1990, in years:
B. GUELPH UNIT AH (model layer 5)
Flow-modelboundary
Transport-modelboundary
< 2
4 to 6
6 to 8
2 to 4 8 to 10
10 to 12
12 to 14
14 to 16
16 to 18
0.5 MILMILESMIL1
0.5 KILOMETERS1
0
0
79º
43º 07'
43º 05'
43º 03'
78º 58' 78º 56' 78º 54'
Figure 28. (continued)Age of ground water at study site near Niagara Falls, N.Y., in May 1990, after 30 years of transport with fracture porosity of 3 percent prior to pump-and-treat remediation, as computed by steady-state MOC3D simulation: A. Weathered bedrock (model layer 1). B. Guelph A (model layer 5).

49
(low-velocity) simulation indicate that water in weathered bedrock (model layer 1) is less than 16 years old within the modeled area used in transport simulations and generally less than 6 years old near the manufacturing facility and north of Bergholtz Creek (fig. 28). The computed age of water in the Guelph A is less than 10 years within the contaminant plume and less than 18 years elsewhere. Decreasing the fracture porosity from 3 to 0.3 percent produced ground-water ages of less than 1 year throughout the contaminant plume. Ground-water ages from 4 to 10 years within the contaminant plume would be consistent with tritium activities measured in wells in 1995; this indicates that the high-porosity (low-velocity) simulation better represents ground-water flow near the facility.
The ages of less than 2 years computed for water near the TCE source area in both simulations are inconsistent with tritium activities measured in 1995. Tritium activities in precipitation at Ottawa 1995 have ranged from 12 to 23 TU since 1992, with a mean of 18 TU (fig. 8), whereas the tritium activity at well 87-08(1) in 1994 was 31 TU; therefore, the water probably entered the aquifer before 1992. The discrepancy between simulated ages and measured tritium activity near the TCE source indicates either that the ground-water mound near the facility was not caused by water discharged from recent rocket tests, or that tritium activity measured in precipitation at Ottawa does not reflect the activity of rocket-test water, which originated in the Niagara River.
DISCUSSION OF MODEL RESULTS
Transport simulations with BIOMOC indicate that the information concerning the hydrogeology and contaminant distributions at the site is sufficient to demonstrate that the chlorinated ethene plume in April 1998 had reached a dynamic equilibrium between the rate of TCE dissolution and the rate of removal through pumping and biodegradation. Moreover, the estimated biodegradation rates of TCE and its metabolites obtained for a specified fracture porosity span a relatively narrow range, despite the wide scatter in the measured concentrations of chlorinated ethenes, the relatively poor model fit, and differing assumptions concerning the effects of physical transport processes. The principal sources of uncertainty in estimating biodegradation rates and predicting the fate of chlorinated ethenes at the site are the estimates of
ground-water velocity and mass of DNAPL remaining. The uncertainty concerning possible effects of physical transport processes other than advection (dispersion, sorption, and diffusion) and assumptions regarding the distribution of hydraulic properties at the site is less important than uncertainty concerning ground-water velocity and DNAPL mass in the prediction of equilibrium contaminant concentrations.
Ground-water-flow model
The flow model represents the fracture network in the Guelph A as uniform, with a single value of transmissivity, except in an area west of the facility, where a region of lower transmissivity is hypothesized to form a partial hydraulic barrier that diverts the plume southward. This relatively simple model design does not accurately reproduce the head distribution south of the facility, where the measured hydraulic gradient north of Bergholtz Creek is steep, but flattens south of the creek. The model could be refined to accurately represent hydrogeologic conditions and ground-water-flow directions in this area if information from additional wells and hydraulic tests were available. The estimation of biodegradation rates is constrained primarily by the assumed size of the plume and the estimated mass of chlorinated ethenes removed by the pump-and-treat system; uncertainty regarding conditions that control the direction of ground-water flow is less important because the apparent dispersivity is relatively large.
Solute-transport models
Simulation of solute transport indicates that, before pumping began in 1993, chlorinated ethene migration at the site was a continuing process in which the rate of TCE dissolution equaled the rate of removal through biodegradation. The dissolution and biodegradation rates (fig. 29A) cannot be uniquely determined solely from the measured concentration distributions of TCE, DCE and VC, however, because similar distributions can be produced by proportionately increasing or decreasing each of the rates. Estimates of the mass of contaminants removed through pumping during 1993-98 provide the additional information needed to uniquely determine rates of dissolution and degradation for an assumed fracture porosity (fig. 29B). Concentration
Discussion of Model Results
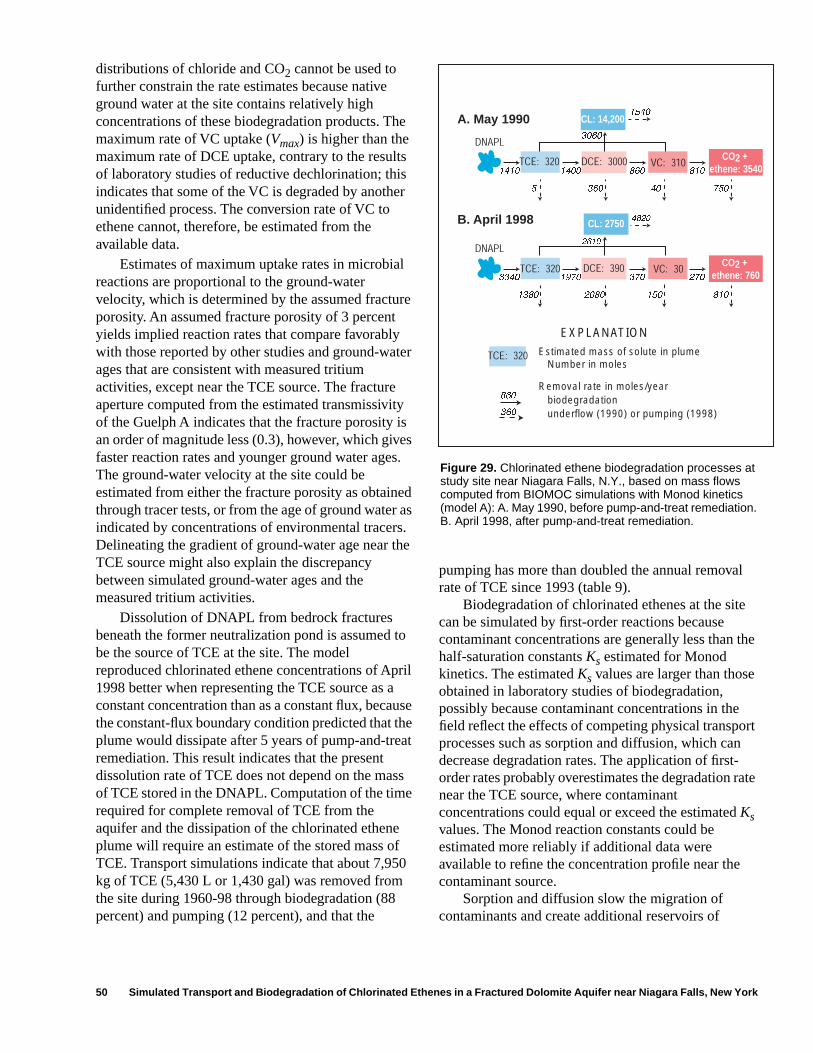
50 Simulated Transport and Biodegradation of Chlorinated Ethenes in a Fractured Dolomite Aquifer near Niagara Falls, New York
1410 1400
3060
860 810
360
860
1540
A. May 1990
EXPLANATION
DNAPL
Estimated mass of solute in plume Number in moles
Removal rate in moles/year biodegradation underflow (1990) or pumping (1998)
5 360 40 750
TCE: 320
CL: 14,200
CO2 + ethene: 3540VC: 310DCE: 3000
3340 1970
2610
370 270
4820B. April 1998
DNAPL
1380 2080 150 810
TCE: 320
TCE: 320
CL: 2750
CO2 + ethene: 760
VC: 30DCE: 390
distributions of chloride and CO2 cannot be used to further constrain the rate estimates because native ground water at the site contains relatively high concentrations of these biodegradation products. The maximum rate of VC uptake (Vmax) is higher than the maximum rate of DCE uptake, contrary to the results of laboratory studies of reductive dechlorination; this indicates that some of the VC is degraded by another unidentified process. The conversion rate of VC to ethene cannot, therefore, be estimated from the available data.
Estimates of maximum uptake rates in microbial reactions are proportional to the ground-water velocity, which is determined by the assumed fracture porosity. An assumed fracture porosity of 3 percent yields implied reaction rates that compare favorably with those reported by other studies and ground-water ages that are consistent with measured tritium activities, except near the TCE source. The fracture aperture computed from the estimated transmissivity of the Guelph A indicates that the fracture porosity is an order of magnitude less (0.3), however, which gives faster reaction rates and younger ground water ages. The ground-water velocity at the site could be estimated from either the fracture porosity as obtained through tracer tests, or from the age of ground water as indicated by concentrations of environmental tracers. Delineating the gradient of ground-water age near the TCE source might also explain the discrepancy between simulated ground-water ages and the measured tritium activities.
Dissolution of DNAPL from bedrock fractures beneath the former neutralization pond is assumed to be the source of TCE at the site. The model reproduced chlorinated ethene concentrations of April 1998 better when representing the TCE source as a constant concentration than as a constant flux, because the constant-flux boundary condition predicted that the plume would dissipate after 5 years of pump-and-treat remediation. This result indicates that the present dissolution rate of TCE does not depend on the mass of TCE stored in the DNAPL. Computation of the time required for complete removal of TCE from the aquifer and the dissipation of the chlorinated ethene plume will require an estimate of the stored mass of TCE. Transport simulations indicate that about 7,950 kg of TCE (5,430 L or 1,430 gal) was removed from the site during 1960-98 through biodegradation (88 percent) and pumping (12 percent), and that the
pumping has more than doubled the annual removal rate of TCE since 1993 (table 9).
Biodegradation of chlorinated ethenes at the site can be simulated by first-order reactions because contaminant concentrations are generally less than the half-saturation constants Ks estimated for Monod kinetics. The estimated Ks values are larger than those obtained in laboratory studies of biodegradation, possibly because contaminant concentrations in the field reflect the effects of competing physical transport processes such as sorption and diffusion, which can decrease degradation rates. The application of first-order rates probably overestimates the degradation rate near the TCE source, where contaminant concentrations could equal or exceed the estimated Ks values. The Monod reaction constants could be estimated more reliably if additional data were available to refine the concentration profile near the contaminant source.
Sorption and diffusion slow the migration of contaminants and create additional reservoirs of
Figure 29. Chlorinated ethene biodegradation processes at study site near Niagara Falls, N.Y., based on mass flows computed from BIOMOC simulations with Monod kinetics (model A): A. May 1990, before pump-and-treat remediation. B. April 1998, after pump-and-treat remediation.
51
contaminants on fracture surfaces and within the rock matrix. Simulation of sorption had little effect on the concentration distributions computed by the transport models because sorption was represented as an instantaneous reaction through a partition coefficient Kd. Simulation of diffusion also had little effect on the computed concentration distribution of TCE under prepumping conditions, but indicated that 17 to 48 percent of TCE mass in the contaminant plume could be stored within the rock matrix. Computed TCE concentrations within the rock matrix above and below the Guelph A were relatively unaffected by 5 years of pumping, whereas the simulated TCE mass therein was decreased 60 percent by pumping. These results indicate that diffusion of chlorinated ethenes from the rock matrix could provide a continuing source of contaminants at the site. The importance of sorption and diffusion reactions at the site are unknown, but could be estimated through the methods applied by Novakowski and others (1999) at Smithville, Ontario, where laboratory studies of rock cores were conducted to obtain partition and effective diffusion coefficients. Alternatively, these coefficients could be estimated from a comparison of measured pore-water concentrations of chlorinated ethenes within the rock matrix with simulated concentrations.
SUMMARY
TCE was discharged to a shallow pond at a manufacturing facility near Niagara Falls, N.Y. in the 1950’s and 1960’s and entered ground water in the Lockport Group, a fractured dolomite aquifer, where it formed a plume. By 1990, the plume encompassed 280 acres and contained TCE and its metabolites— DCE, VC, and ethene. A 20-acre plume of DNAPL that contained mostly TCE also formed close to the pond. A pump-and-treat remediation system began operation in 1993 to decrease the size of the plume and prevent its further migration. The presence of the TCE metabolites in the plume is attributed to naturally occurring microorganisms that have adapted to utilize the chlorinated ethenes as substrates for microbial reactions.
The plume lies within the Guelph Dolomite, the uppermost member of the Lockport Group. The two principal water-bearing zones at the site are a 5-ft-thick fracture zone at the weathered bedrock surface and a 3-ft-thick fracture zone (Guelph A) in a stromatolitic dolomite at the contact between the
Guelph Dolomite and the underlying Eramosa Dolomite. Both fracture zones contain subhorizontal bedding-plane fractures that have been widened by dissolution of dolomite and gypsum. Ground water generally flowed southwestward near the facility in August 1990, but discharge of water at an adjacent facility formed a local ground-water mound that directed the flow of water southward toward Bergholtz Creek. The pump-and-treat remediation system created a cone of depression in 1993 that altered the natural ground-water flow directions south of Bergholtz Creek.
The contaminant plume shows two features that are characteristic of transport through a nonuniform fracture network: (1) the plume is nearly as wide as it is long, indicating a close similarity between longitudinal and transverse dispersivity, and (2) the apparent southward direction of migration is not aligned with the southwestward hydraulic gradient. These features possibly result from local variations in fracture aperture and in the pattern of fracture connections within the Guelph A. Most of the water and solutes in the Guelph A probably flow along primary paths of connected fractures; the rest flows at a slower rate through secondary paths, where fracture apertures are smaller and the fractures are poorly connected. Sorption of solute to the fracture walls, and diffusion of solutes into the rock matrix within the Guelph A and above and below it, could create temporary reservoirs of chlorinated ethenes in the fracture network.
Ground-water flow was represented by a five-layer model that used MODFLOWP in steady-state and transient-state simulations to represent conditions before and after remedial pumping began in 1993. The top model layer represented the fracture zone in the weathered bedrock, and the bottom layer represented the Guelph A; the remaining three layers represented the rock matrix separating the two fracture zones. Inflow boundaries were specified to represent underflow from upgradient areas and recharge from precipitation and from industrial discharge. Outflow boundaries represented discharge to three perennial streams and to pumped wells. Model parameter values were adjusted through nonlinear regressions that used water levels and stream discharges measured under prepumping (steady-state) and pumping conditions.
Hydraulic-head distributions obtained from model simulations reproduced the ground-water mound near the facility and discharge to Bergholtz Creek and
Summary
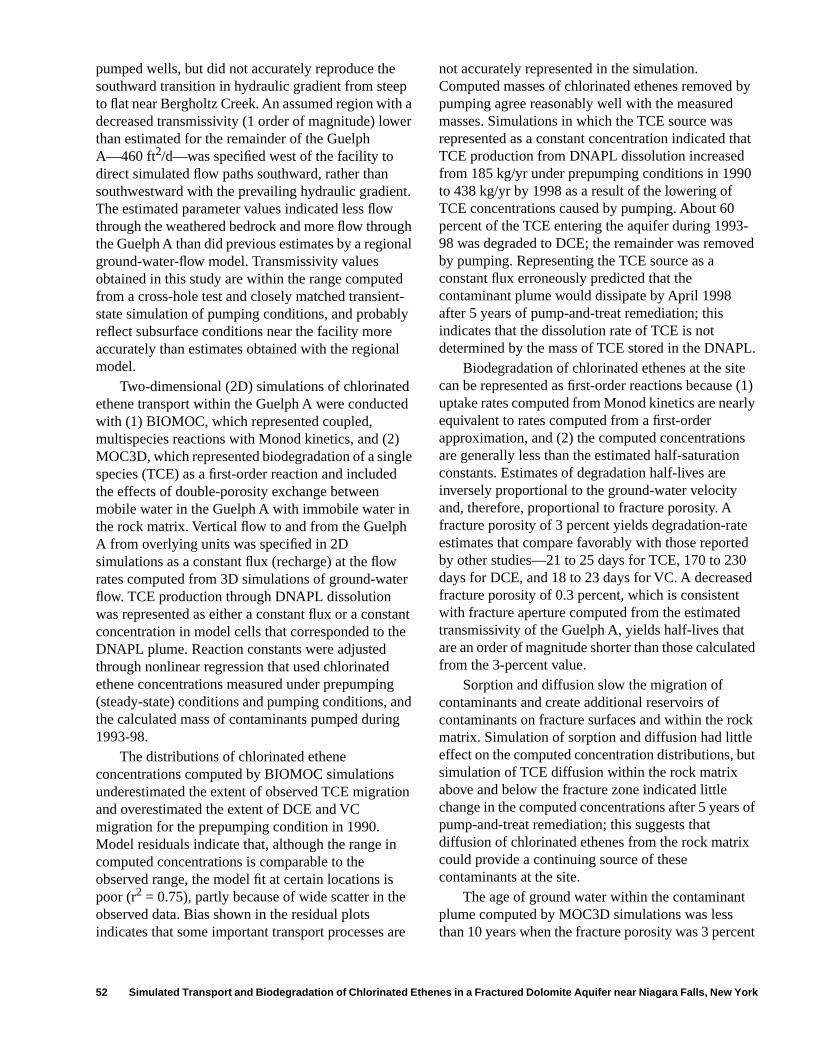
52 Simulated Transport and Biodegradation of Chlorinated Ethenes in a Fractured Dolomite Aquifer near Niagara Falls, New York
pumped wells, but did not accurately reproduce the southward transition in hydraulic gradient from steep to flat near Bergholtz Creek. An assumed region with a decreased transmissivity (1 order of magnitude) lower than estimated for the remainder of the Guelph A—460 ft2/d—was specified west of the facility to direct simulated flow paths southward, rather than southwestward with the prevailing hydraulic gradient. The estimated parameter values indicated less flow through the weathered bedrock and more flow through the Guelph A than did previous estimates by a regional ground-water-flow model. Transmissivity values obtained in this study are within the range computed from a cross-hole test and closely matched transient-state simulation of pumping conditions, and probably reflect subsurface conditions near the facility more accurately than estimates obtained with the regional model.
Two-dimensional (2D) simulations of chlorinated ethene transport within the Guelph A were conducted with (1) BIOMOC, which represented coupled, multispecies reactions with Monod kinetics, and (2) MOC3D, which represented biodegradation of a single species (TCE) as a first-order reaction and included the effects of double-porosity exchange between mobile water in the Guelph A with immobile water in the rock matrix. Vertical flow to and from the Guelph A from overlying units was specified in 2D simulations as a constant flux (recharge) at the flow rates computed from 3D simulations of ground-water flow. TCE production through DNAPL dissolution was represented as either a constant flux or a constant concentration in model cells that corresponded to the DNAPL plume. Reaction constants were adjusted through nonlinear regression that used chlorinated ethene concentrations measured under prepumping (steady-state) conditions and pumping conditions, and the calculated mass of contaminants pumped during 1993-98.
The distributions of chlorinated ethene concentrations computed by BIOMOC simulations underestimated the extent of observed TCE migration and overestimated the extent of DCE and VC migration for the prepumping condition in 1990. Model residuals indicate that, although the range in computed concentrations is comparable to the observed range, the model fit at certain locations is poor (r2 = 0.75), partly because of wide scatter in the observed data. Bias shown in the residual plots indicates that some important transport processes are
not accurately represented in the simulation. Computed masses of chlorinated ethenes removed by pumping agree reasonably well with the measured masses. Simulations in which the TCE source was represented as a constant concentration indicated that TCE production from DNAPL dissolution increased from 185 kg/yr under prepumping conditions in 1990 to 438 kg/yr by 1998 as a result of the lowering of TCE concentrations caused by pumping. About 60 percent of the TCE entering the aquifer during 1993-98 was degraded to DCE; the remainder was removed by pumping. Representing the TCE source as a constant flux erroneously predicted that the contaminant plume would dissipate by April 1998 after 5 years of pump-and-treat remediation; this indicates that the dissolution rate of TCE is not determined by the mass of TCE stored in the DNAPL.
Biodegradation of chlorinated ethenes at the site can be represented as first-order reactions because (1) uptake rates computed from Monod kinetics are nearly equivalent to rates computed from a first-order approximation, and (2) the computed concentrations are generally less than the estimated half-saturation constants. Estimates of degradation half-lives are inversely proportional to the ground-water velocity and, therefore, proportional to fracture porosity. A fracture porosity of 3 percent yields degradation-rate estimates that compare favorably with those reported by other studies—21 to 25 days for TCE, 170 to 230 days for DCE, and 18 to 23 days for VC. A decreased fracture porosity of 0.3 percent, which is consistent with fracture aperture computed from the estimated transmissivity of the Guelph A, yields half-lives that are an order of magnitude shorter than those calculated from the 3-percent value.
Sorption and diffusion slow the migration of contaminants and create additional reservoirs of contaminants on fracture surfaces and within the rock matrix. Simulation of sorption and diffusion had little effect on the computed concentration distributions, but simulation of TCE diffusion within the rock matrix above and below the fracture zone indicated little change in the computed concentrations after 5 years of pump-and-treat remediation; this suggests that diffusion of chlorinated ethenes from the rock matrix could provide a continuing source of these contaminants at the site.
The age of ground water within the contaminant plume computed by MOC3D simulations was less than 10 years when the fracture porosity was 3 percent
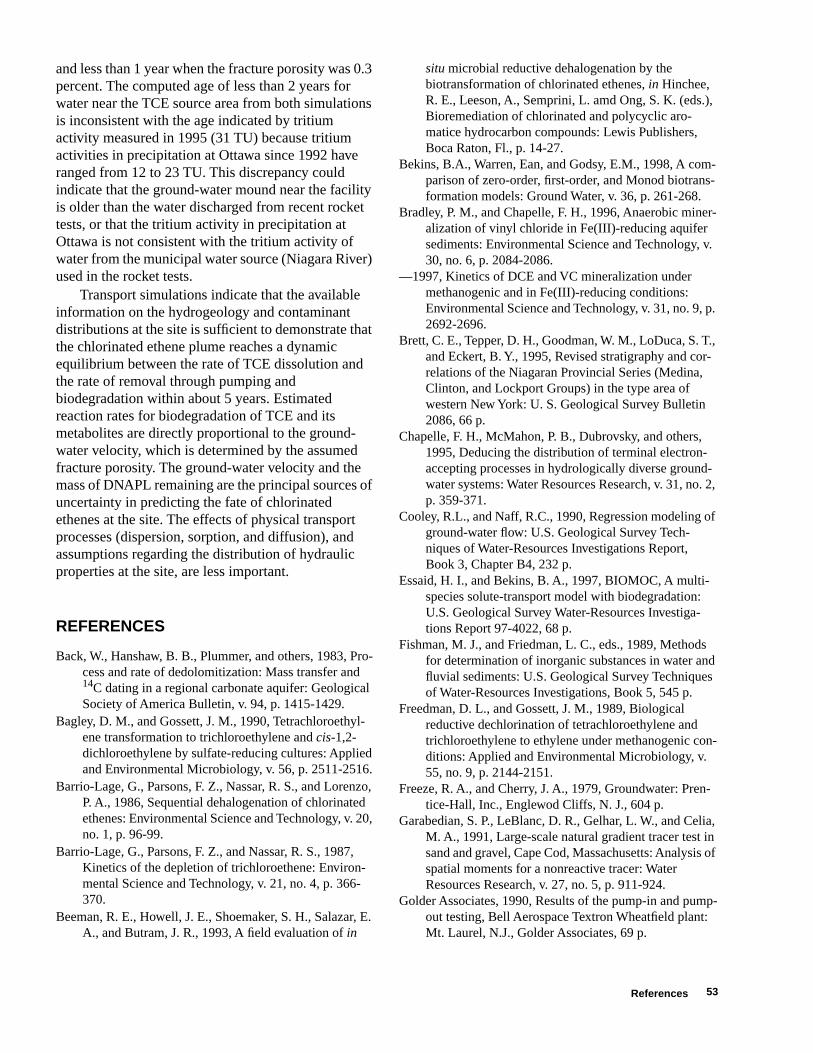
53
and less than 1 year when the fracture porosity was 0.3 percent. The computed age of less than 2 years for water near the TCE source area from both simulations is inconsistent with the age indicated by tritium activity measured in 1995 (31 TU) because tritium activities in precipitation at Ottawa since 1992 have ranged from 12 to 23 TU. This discrepancy could indicate that the ground-water mound near the facility is older than the water discharged from recent rocket tests, or that the tritium activity in precipitation at Ottawa is not consistent with the tritium activity of water from the municipal water source (Niagara River) used in the rocket tests.
Transport simulations indicate that the available information on the hydrogeology and contaminant distributions at the site is sufficient to demonstrate that the chlorinated ethene plume reaches a dynamic equilibrium between the rate of TCE dissolution and the rate of removal through pumping and biodegradation within about 5 years. Estimated reaction rates for biodegradation of TCE and its metabolites are directly proportional to the ground-water velocity, which is determined by the assumed fracture porosity. The ground-water velocity and the mass of DNAPL remaining are the principal sources of uncertainty in predicting the fate of chlorinated ethenes at the site. The effects of physical transport processes (dispersion, sorption, and diffusion), and assumptions regarding the distribution of hydraulic properties at the site, are less important.
REFERENCES
Back, W., Hanshaw, B. B., Plummer, and others, 1983, Pro-cess and rate of dedolomitization: Mass transfer and 14C dating in a regional carbonate aquifer: Geological Society of America Bulletin, v. 94, p. 1415-1429.
Bagley, D. M., and Gossett, J. M., 1990, Tetrachloroethyl-ene transformation to trichloroethylene and cis-1,2-dichloroethylene by sulfate-reducing cultures: Applied and Environmental Microbiology, v. 56, p. 2511-2516.
Barrio-Lage, G., Parsons, F. Z., Nassar, R. S., and Lorenzo, P. A., 1986, Sequential dehalogenation of chlorinated ethenes: Environmental Science and Technology, v. 20, no. 1, p. 96-99.
Barrio-Lage, G., Parsons, F. Z., and Nassar, R. S., 1987, Kinetics of the depletion of trichloroethene: Environ-mental Science and Technology, v. 21, no. 4, p. 366-370.
Beeman, R. E., Howell, J. E., Shoemaker, S. H., Salazar, E. A., and Butram, J. R., 1993, A field evaluation of in
situ microbial reductive dehalogenation by the biotransformation of chlorinated ethenes, in Hinchee, R. E., Leeson, A., Semprini, L. amd Ong, S. K. (eds.), Bioremediation of chlorinated and polycyclic aro-matice hydrocarbon compounds: Lewis Publishers, Boca Raton, Fl., p. 14-27.
Bekins, B.A., Warren, Ean, and Godsy, E.M., 1998, A com-parison of zero-order, first-order, and Monod biotrans-formation models: Ground Water, v. 36, p. 261-268.
Bradley, P. M., and Chapelle, F. H., 1996, Anaerobic miner-alization of vinyl chloride in Fe(III)-reducing aquifer sediments: Environmental Science and Technology, v. 30, no. 6, p. 2084-2086.
—1997, Kinetics of DCE and VC mineralization under methanogenic and in Fe(III)-reducing conditions: Environmental Science and Technology, v. 31, no. 9, p. 2692-2696.
Brett, C. E., Tepper, D. H., Goodman, W. M., LoDuca, S. T., and Eckert, B. Y., 1995, Revised stratigraphy and cor-relations of the Niagaran Provincial Series (Medina, Clinton, and Lockport Groups) in the type area of western New York: U. S. Geological Survey Bulletin 2086, 66 p.
Chapelle, F. H., McMahon, P. B., Dubrovsky, and others, 1995, Deducing the distribution of terminal electron-accepting processes in hydrologically diverse ground-water systems: Water Resources Research, v. 31, no. 2, p. 359-371.
Cooley, R.L., and Naff, R.C., 1990, Regression modeling of ground-water flow: U.S. Geological Survey Tech-niques of Water-Resources Investigations Report, Book 3, Chapter B4, 232 p.
Essaid, H. I., and Bekins, B. A., 1997, BIOMOC, A multi-species solute-transport model with biodegradation: U.S. Geological Survey Water-Resources Investiga-tions Report 97-4022, 68 p.
Fishman, M. J., and Friedman, L. C., eds., 1989, Methods for determination of inorganic substances in water and fluvial sediments: U.S. Geological Survey Techniques of Water-Resources Investigations, Book 5, 545 p.
Freedman, D. L., and Gossett, J. M., 1989, Biological reductive dechlorination of tetrachloroethylene and trichloroethylene to ethylene under methanogenic con-ditions: Applied and Environmental Microbiology, v. 55, no. 9, p. 2144-2151.
Freeze, R. A., and Cherry, J. A., 1979, Groundwater: Pren-tice-Hall, Inc., Englewod Cliffs, N. J., 604 p.
Garabedian, S. P., LeBlanc, D. R., Gelhar, L. W., and Celia, M. A., 1991, Large-scale natural gradient tracer test in sand and gravel, Cape Cod, Massachusetts: Analysis of spatial moments for a nonreactive tracer: Water Resources Research, v. 27, no. 5, p. 911-924.
Golder Associates, 1990, Results of the pump-in and pump-out testing, Bell Aerospace Textron Wheatfield plant: Mt. Laurel, N.J., Golder Associates, 69 p.
References
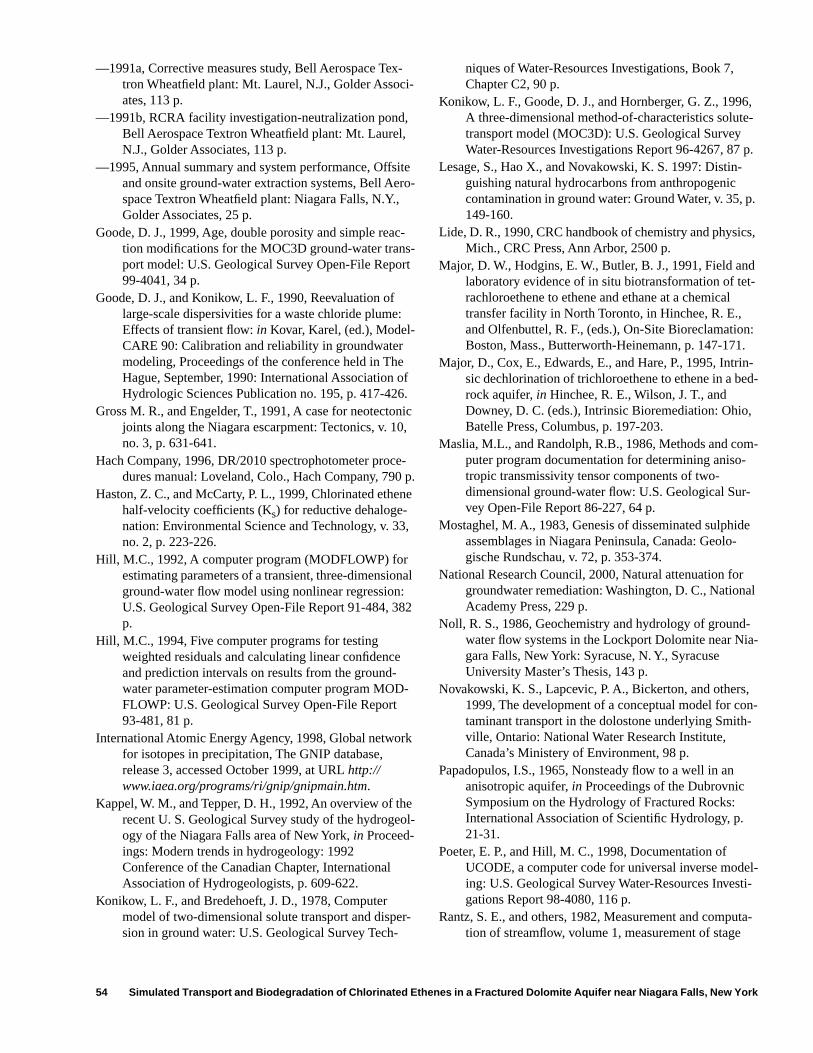
54 Simulated Transport and Biodegradation of Chlorinated Ethenes in a Fractured Dolomite Aquifer near Niagara Falls, New York
—1991a, Corrective measures study, Bell Aerospace Tex-tron Wheatfield plant: Mt. Laurel, N.J., Golder Associ-ates, 113 p.
—1991b, RCRA facility investigation-neutralization pond, Bell Aerospace Textron Wheatfield plant: Mt. Laurel, N.J., Golder Associates, 113 p.
—1995, Annual summary and system performance, Offsite and onsite ground-water extraction systems, Bell Aero-space Textron Wheatfield plant: Niagara Falls, N.Y., Golder Associates, 25 p.
Goode, D. J., 1999, Age, double porosity and simple reac-tion modifications for the MOC3D ground-water trans-port model: U.S. Geological Survey Open-File Report 99-4041, 34 p.
Goode, D. J., and Konikow, L. F., 1990, Reevaluation of large-scale dispersivities for a waste chloride plume: Effects of transient flow: in Kovar, Karel, (ed.), Model-CARE 90: Calibration and reliability in groundwater modeling, Proceedings of the conference held in The Hague, September, 1990: International Association of Hydrologic Sciences Publication no. 195, p. 417-426.
Gross M. R., and Engelder, T., 1991, A case for neotectonic joints along the Niagara escarpment: Tectonics, v. 10, no. 3, p. 631-641.
Hach Company, 1996, DR/2010 spectrophotometer proce-dures manual: Loveland, Colo., Hach Company, 790 p.
Haston, Z. C., and McCarty, P. L., 1999, Chlorinated ethene half-velocity coefficients (Ks) for reductive dehaloge-nation: Environmental Science and Technology, v. 33, no. 2, p. 223-226.
Hill, M.C., 1992, A computer program (MODFLOWP) for estimating parameters of a transient, three-dimensional ground-water flow model using nonlinear regression: U.S. Geological Survey Open-File Report 91-484, 382 p.
Hill, M.C., 1994, Five computer programs for testing weighted residuals and calculating linear confidence and prediction intervals on results from the ground-water parameter-estimation computer program MOD-FLOWP: U.S. Geological Survey Open-File Report 93-481, 81 p.
International Atomic Energy Agency, 1998, Global network for isotopes in precipitation, The GNIP database, release 3, accessed October 1999, at URL http://www.iaea.org/programs/ri/gnip/gnipmain.htm.
Kappel, W. M., and Tepper, D. H., 1992, An overview of the recent U. S. Geological Survey study of the hydrogeol-ogy of the Niagara Falls area of New York, in Proceed-ings: Modern trends in hydrogeology: 1992 Conference of the Canadian Chapter, International Association of Hydrogeologists, p. 609-622.
Konikow, L. F., and Bredehoeft, J. D., 1978, Computer model of two-dimensional solute transport and disper-sion in ground water: U.S. Geological Survey Tech-
niques of Water-Resources Investigations, Book 7, Chapter C2, 90 p.
Konikow, L. F., Goode, D. J., and Hornberger, G. Z., 1996, A three-dimensional method-of-characteristics solute-transport model (MOC3D): U.S. Geological Survey Water-Resources Investigations Report 96-4267, 87 p.
Lesage, S., Hao X., and Novakowski, K. S. 1997: Distin-guishing natural hydrocarbons from anthropogenic contamination in ground water: Ground Water, v. 35, p. 149-160.
Lide, D. R., 1990, CRC handbook of chemistry and physics, Mich., CRC Press, Ann Arbor, 2500 p.
Major, D. W., Hodgins, E. W., Butler, B. J., 1991, Field and laboratory evidence of in situ biotransformation of tet-rachloroethene to ethene and ethane at a chemical transfer facility in North Toronto, in Hinchee, R. E., and Olfenbuttel, R. F., (eds.), On-Site Bioreclamation: Boston, Mass., Butterworth-Heinemann, p. 147-171.
Major, D., Cox, E., Edwards, E., and Hare, P., 1995, Intrin-sic dechlorination of trichloroethene to ethene in a bed-rock aquifer, in Hinchee, R. E., Wilson, J. T., and Downey, D. C. (eds.), Intrinsic Bioremediation: Ohio, Batelle Press, Columbus, p. 197-203.
Maslia, M.L., and Randolph, R.B., 1986, Methods and com-puter program documentation for determining aniso-tropic transmissivity tensor components of two-dimensional ground-water flow: U.S. Geological Sur-vey Open-File Report 86-227, 64 p.
Mostaghel, M. A., 1983, Genesis of disseminated sulphide assemblages in Niagara Peninsula, Canada: Geolo-gische Rundschau, v. 72, p. 353-374.
National Research Council, 2000, Natural attenuation for groundwater remediation: Washington, D. C., National Academy Press, 229 p.
Noll, R. S., 1986, Geochemistry and hydrology of ground-water flow systems in the Lockport Dolomite near Nia-gara Falls, New York: Syracuse, N. Y., Syracuse University Master’s Thesis, 143 p.
Novakowski, K. S., Lapcevic, P. A., Bickerton, and others, 1999, The development of a conceptual model for con-taminant transport in the dolostone underlying Smith-ville, Ontario: National Water Research Institute, Canada’s Ministery of Environment, 98 p.
Papadopulos, I.S., 1965, Nonsteady flow to a well in an anisotropic aquifer, in Proceedings of the Dubrovnic Symposium on the Hydrology of Fractured Rocks: International Association of Scientific Hydrology, p. 21-31.
Poeter, E. P., and Hill, M. C., 1998, Documentation of UCODE, a computer code for universal inverse model-ing: U.S. Geological Survey Water-Resources Investi-gations Report 98-4080, 116 p.
Rantz, S. E., and others, 1982, Measurement and computa-tion of streamflow, volume 1, measurement of stage
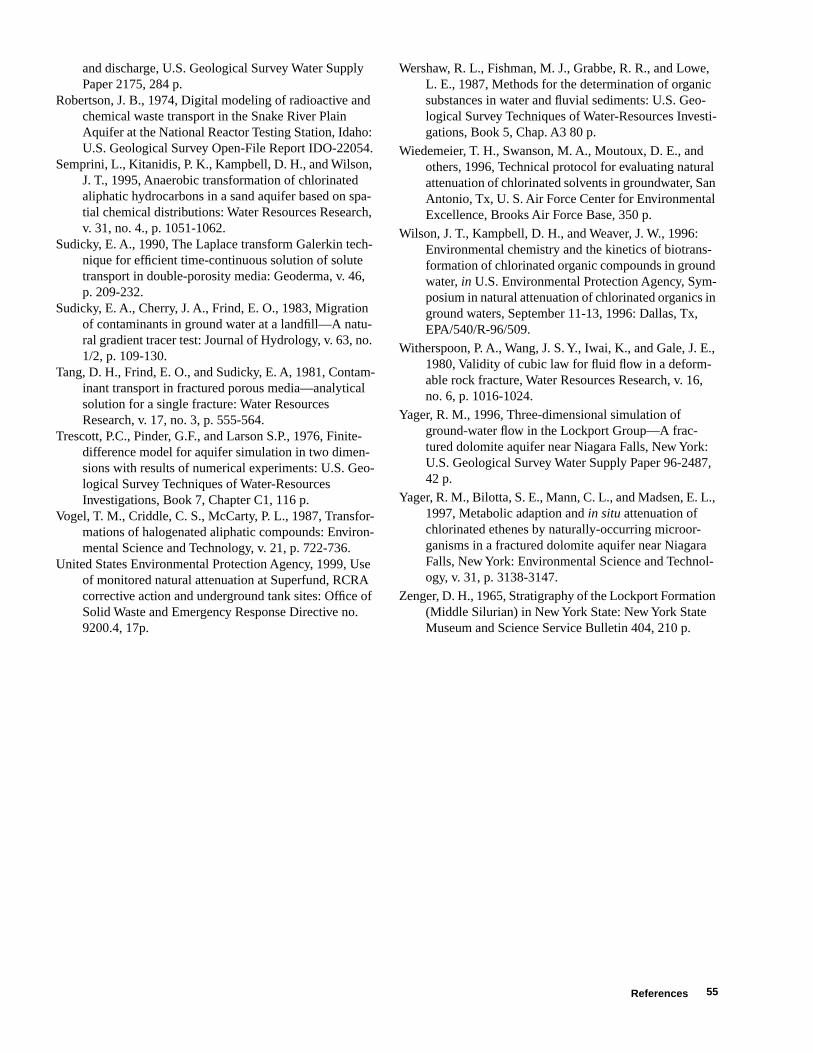
55
and discharge, U.S. Geological Survey Water Supply Paper 2175, 284 p.
Robertson, J. B., 1974, Digital modeling of radioactive and chemical waste transport in the Snake River Plain Aquifer at the National Reactor Testing Station, Idaho: U.S. Geological Survey Open-File Report IDO-22054.
Semprini, L., Kitanidis, P. K., Kampbell, D. H., and Wilson, J. T., 1995, Anaerobic transformation of chlorinated aliphatic hydrocarbons in a sand aquifer based on spa-tial chemical distributions: Water Resources Research, v. 31, no. 4., p. 1051-1062.
Sudicky, E. A., 1990, The Laplace transform Galerkin tech-nique for efficient time-continuous solution of solute transport in double-porosity media: Geoderma, v. 46, p. 209-232.
Sudicky, E. A., Cherry, J. A., Frind, E. O., 1983, Migration of contaminants in ground water at a landfill—A natu-ral gradient tracer test: Journal of Hydrology, v. 63, no. 1/2, p. 109-130.
Tang, D. H., Frind, E. O., and Sudicky, E. A, 1981, Contam-inant transport in fractured porous media—analytical solution for a single fracture: Water Resources Research, v. 17, no. 3, p. 555-564.
Trescott, P.C., Pinder, G.F., and Larson S.P., 1976, Finite-difference model for aquifer simulation in two dimen-sions with results of numerical experiments: U.S. Geo-logical Survey Techniques of Water-Resources Investigations, Book 7, Chapter C1, 116 p.
Vogel, T. M., Criddle, C. S., McCarty, P. L., 1987, Transfor-mations of halogenated aliphatic compounds: Environ-mental Science and Technology, v. 21, p. 722-736.
United States Environmental Protection Agency, 1999, Use of monitored natural attenuation at Superfund, RCRA corrective action and underground tank sites: Office of Solid Waste and Emergency Response Directive no. 9200.4, 17p.
Wershaw, R. L., Fishman, M. J., Grabbe, R. R., and Lowe, L. E., 1987, Methods for the determination of organic substances in water and fluvial sediments: U.S. Geo-logical Survey Techniques of Water-Resources Investi-gations, Book 5, Chap. A3 80 p.
Wiedemeier, T. H., Swanson, M. A., Moutoux, D. E., and others, 1996, Technical protocol for evaluating natural attenuation of chlorinated solvents in groundwater, San Antonio, Tx, U. S. Air Force Center for Environmental Excellence, Brooks Air Force Base, 350 p.
Wilson, J. T., Kampbell, D. H., and Weaver, J. W., 1996: Environmental chemistry and the kinetics of biotrans-formation of chlorinated organic compounds in ground water, in U.S. Environmental Protection Agency, Sym-posium in natural attenuation of chlorinated organics in ground waters, September 11-13, 1996: Dallas, Tx, EPA/540/R-96/509.
Witherspoon, P. A., Wang, J. S. Y., Iwai, K., and Gale, J. E., 1980, Validity of cubic law for fluid flow in a deform-able rock fracture, Water Resources Research, v. 16, no. 6, p. 1016-1024.
Yager, R. M., 1996, Three-dimensional simulation of ground-water flow in the Lockport Group—A frac-tured dolomite aquifer near Niagara Falls, New York: U.S. Geological Survey Water Supply Paper 96-2487, 42 p.
Yager, R. M., Bilotta, S. E., Mann, C. L., and Madsen, E. L., 1997, Metabolic adaption and in situ attenuation of chlorinated ethenes by naturally-occurring microor-ganisms in a fractured dolomite aquifer near Niagara Falls, New York: Environmental Science and Technol-ogy, v. 31, p. 3138-3147.
Zenger, D. H., 1965, Stratigraphy of the Lockport Formation (Middle Silurian) in New York State: New York State Museum and Science Service Bulletin 404, 210 p.
References
Related Documents