p1 Simplifying CE-SDS Data Processing Approach for Mitigating Product Peak Migration Time Drift Samuel Shepherd 1 , KieranKumar Mistry 1 , Whitney Lane Smith 2 , Nicholas Bond 1 , Vivian Lindo 1 , Sam Fox 3 , Jim Thorn 3 1 MedImmune, Cambridge, UK 2 SCIEX, Darmstadt, Germany 3 SCIEX, Warrington, UK Introduction Capillary electrophoresis SDS (CE-SDS) is an industry standard for fragment analysis of monoclonal antibodies and other novel large biologics. The Sciex PA 800 Plus is one such system that demonstrates high sensitivity and resolution in the support of this analysis. An industry known issue with CE-SDS is drift over time of the product peaks, giving rise to complications in data analysis, peak identification, and comparability. During each experiment it was observed that the inlet gel buffer vials are subject to evaporation (Figure 2), and this was believed to be correlated to the occurrence of profile drift (Figure 3). A collaboration between Sciex and MedImmune undertook an investigation into the use of mineral oil layered on top of gel buffer solutions during system preparation. It was hypothesised that evaporation of water from the gel buffer during the course of the sequence leads to concentration of the gel buffer components. This would result in changes to the migration of the product through the capillary during electrophoresis, giving rise to the observed drift. The addition of mineral oil was proposed as a mechanism to reduce gel buffer evaporation. This would result in consistent migration times of the various product peaks and minimised profile drift. Experimental work showed that the addition of mineral oil to the Gel‑R buffer vials stabilised the migration time in both reduced and non-reduced separations (Figure 1). Key Feature of CE-SDS Method Update • Stabilises migration time of all samples in CE-SDS sequences • Simplifies data analysis in chromatography data software • Maximises the data which may be analysed automatically PA 800 Plus Pharmaceutical Analysis System Figure 1. Stable migration times with modified method. Stressed reduced (red) and non-reduced (blue) NIST mAb.

Welcome message from author
This document is posted to help you gain knowledge. Please leave a comment to let me know what you think about it! Share it to your friends and learn new things together.
Transcript
p1
Simplifying CE-SDS Data Processing
Approach for Mitigating Product Peak Migration Time Drift Samuel Shepherd1, KieranKumar Mistry1, Whitney Lane Smith2, Nicholas Bond1, Vivian Lindo1, Sam Fox3, Jim Thorn3
1 MedImmune, Cambridge, UK 2 SCIEX, Darmstadt, Germany 3 SCIEX, Warrington, UK
Introduction
Capillary electrophoresis SDS (CE-SDS) is an industry standard
for fragment analysis of monoclonal antibodies and other novel
large biologics. The Sciex PA 800 Plus is one such system that
demonstrates high sensitivity and resolution in the support of this
analysis.
An industry known issue with CE-SDS is drift over time of the
product peaks, giving rise to complications in data analysis, peak
identification, and comparability. During each experiment
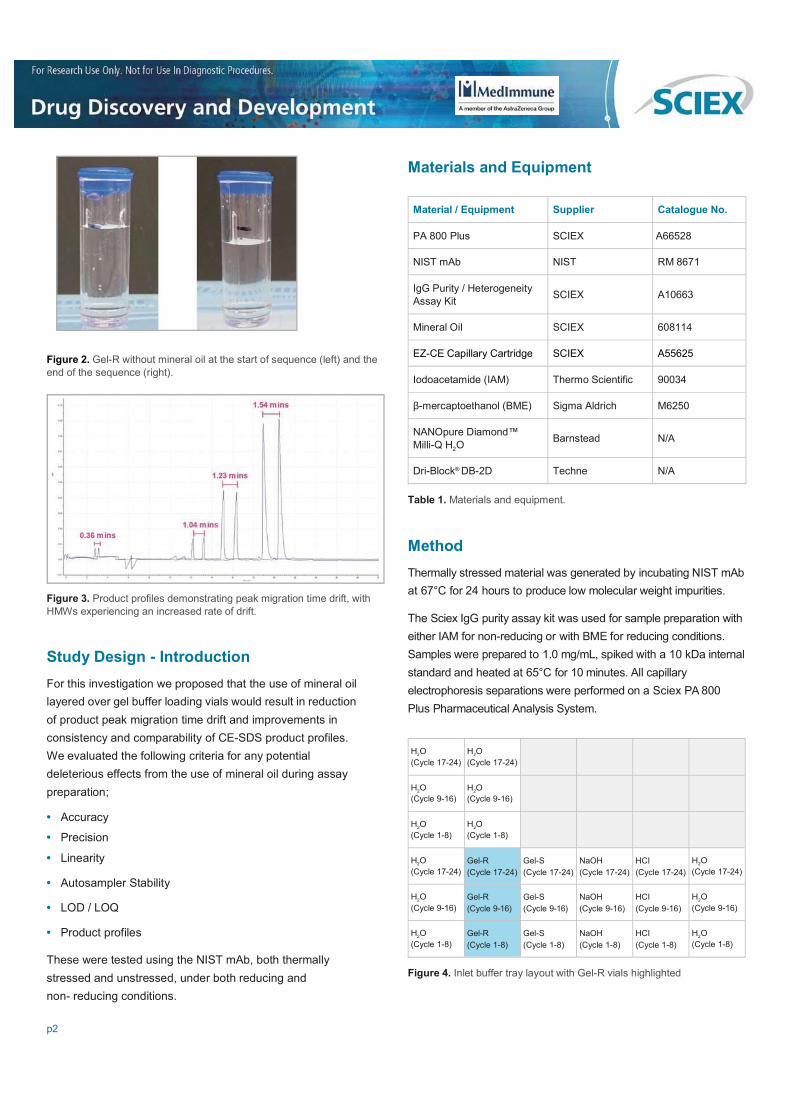
it was observed that the inlet gel buffer vials are subject to
evaporation (Figure 2), and this was believed to be correlated to
the occurrence of profile drift (Figure 3). A collaboration between
Sciex and MedImmune undertook an investigation into the use
of mineral oil layered on top of gel buffer solutions during system
preparation.
It was hypothesised that evaporation of water from the gel buffer
during the course of the sequence leads to concentration of the
gel buffer components. This would result in changes to the
migration of the product through the capillary during
electrophoresis, giving rise to the observed drift. The addition of
mineral oil was proposed as a mechanism to reduce gel buffer
evaporation. This would result in consistent migration times of
the various product peaks and minimised profile drift.
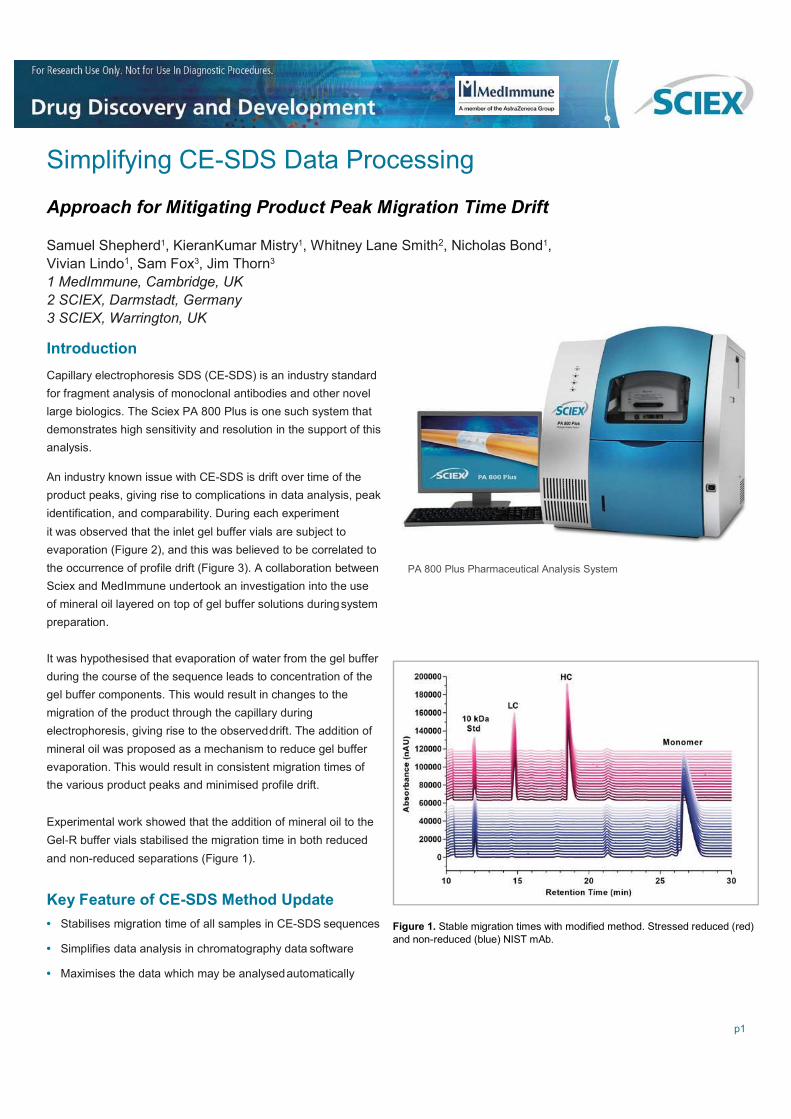
Experimental work showed that the addition of mineral oil to the
Gel‑R buffer vials stabilised the migration time in both reduced
and non-reduced separations (Figure 1).
Key Feature of CE-SDS Method Update
• Stabilises migration time of all samples in CE-SDS sequences
• Simplifies data analysis in chromatography data software
• Maximises the data which may be analysed automatically
PA 800 Plus Pharmaceutical Analysis System
Figure 1. Stable migration times with modified method. Stressed reduced (red) and non-reduced (blue) NIST mAb.
p2
Figure 2. Gel-R without mineral oil at the start of sequence (left) and the end of the sequence (right).
Figure 3. Product profiles demonstrating peak migration time drift, with HMWs experiencing an increased rate of drift.
Study Design - Introduction
For this investigation we proposed that the use of mineral oil
layered over gel buffer loading vials would result in reduction
of product peak migration time drift and improvements in
consistency and comparability of CE-SDS product profiles.
We evaluated the following criteria for any potential
deleterious effects from the use of mineral oil during assay
preparation;
• Accuracy
• Precision
• Linearity
• Autosampler Stability
• LOD / LOQ
• Product profiles
These were tested using the NIST mAb, both thermally
stressed and unstressed, under both reducing and
non- reducing conditions.
Materials and Equipment
Material / Equipment Supplier Catalogue No.
PA 800 Plus SCIEX A66528
NIST mAb NIST RM 8671
IgG Purity / Heterogeneity Assay Kit
SCIEX
A10663
Mineral Oil SCIEX 608114
EZ-CE Capillary Cartridge SCIEX A55625
Iodoacetamide (IAM) Thermo Scientific 90034
β-mercaptoethanol (BME) Sigma Aldrich M6250
NANOpure Diamond™ Milli-Q H2O
Barnstead
N/A
Dri-Block® DB-2D Techne N/A
Table 1. Materials and equipment.
Method
Thermally stressed material was generated by incubating NIST mAb
at 67°C for 24 hours to produce low molecular weight impurities.
The Sciex IgG purity assay kit was used for sample preparation with
either IAM for non-reducing or with BME for reducing conditions.
Samples were prepared to 1.0 mg/mL, spiked with a 10 kDa internal
standard and heated at 65°C for 10 minutes. All capillary
electrophoresis separations were performed on a Sciex PA 800
Plus Pharmaceutical Analysis System.
H2O (Cycle 17-24)
H2O (Cycle 17-24)
H2O (Cycle 9-16)
H2O (Cycle 9-16)
H2O (Cycle 1-8)
H2O (Cycle 1-8)
H2O (Cycle 17-24)
Gel-R (Cycle 17-24)
Gel-S (Cycle 17-24)
NaOH (Cycle 17-24)
HCI (Cycle 17-24)
H2O (Cycle 17-24)
H2O (Cycle 9-16)
Gel-R (Cycle 9-16)
Gel-S (Cycle 9-16)
NaOH (Cycle 9-16)
HCI (Cycle 9-16)
H2O (Cycle 9-16)
H2O (Cycle 1-8)
Gel-R (Cycle 1-8)
Gel-S (Cycle 1-8)
NaOH (Cycle 1-8)
HCI (Cycle 1-8)
H2O (Cycle 1-8)
Figure 4. Inlet buffer tray layout with Gel-R vials highlighted
p3
Capillary Electrophoresis
• Column: 20 cm effective length (30 cm total, 50 µm ID bare fused silica capillary (EZ-CE Capillary Cartridge))
• Separation gel buffer: HR
• Sample storage temp: 25°C
• Separation temp: 25°C
• Separation voltage: 15 kV (0.17 min ramp time), E=1000 V/cm
• Polarity: Reversed (cathode at injection side) • Sample Injection: 1kV for 40 seconds • Detection: PDA detector at 214 nm • Method run time: 54 mins / sample
Data acquisition was performed by 32 Karat (version 10.1 SCIEX)
and data analysis performed on Empower™ version 2
chromatography data software.
Results
We observe that over the course of a run the level of evaporation
from Gel-R buffer vials is significantly reduced after the application
of mineral oil during assay preparation (Figure 5), when
compared against vials prepared without mineral oil (Figure 2).
Precision: Precision was assessed by analysing 20 replicates of
NIST mAb within a single run. Migration times of the product
peaks under non-reducing (monomer peak) and reducing
conditions (Light chain (LC) and Heavy chain (HC) peaks) were
evaluated, and results compared between runs that used Gel-R
vials either with or without the addition of mineral oil.
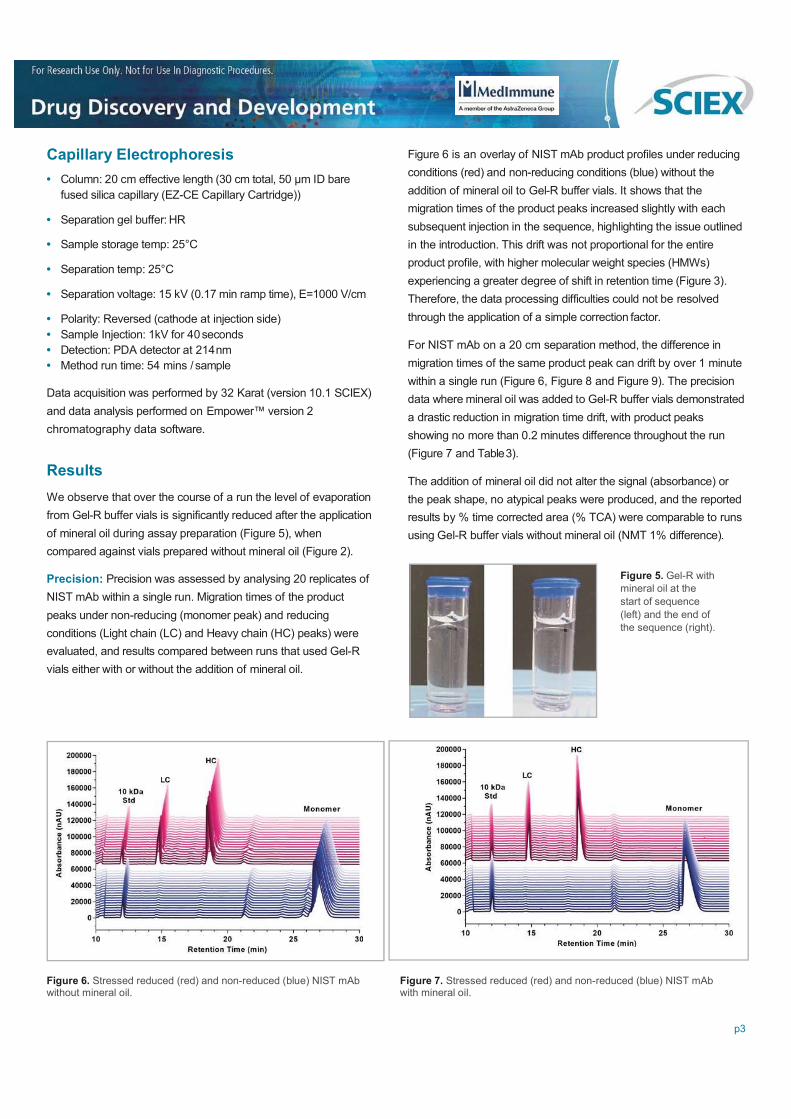
Figure 6 is an overlay of NIST mAb product profiles under reducing
conditions (red) and non-reducing conditions (blue) without the
addition of mineral oil to Gel-R buffer vials. It shows that the
migration times of the product peaks increased slightly with each
subsequent injection in the sequence, highlighting the issue outlined
in the introduction. This drift was not proportional for the entire
product profile, with higher molecular weight species (HMWs)
experiencing a greater degree of shift in retention time (Figure 3).
Therefore, the data processing difficulties could not be resolved
through the application of a simple correction factor.
For NIST mAb on a 20 cm separation method, the difference in
migration times of the same product peak can drift by over 1 minute
within a single run (Figure 6, Figure 8 and Figure 9). The precision
data where mineral oil was added to Gel-R buffer vials demonstrated
a drastic reduction in migration time drift, with product peaks
showing no more than 0.2 minutes difference throughout the run
(Figure 7 and Table 3).
The addition of mineral oil did not alter the signal (absorbance) or
the peak shape, no atypical peaks were produced, and the reported
results by % time corrected area (% TCA) were comparable to runs
using Gel-R buffer vials without mineral oil (NMT 1% difference).
Figure 5. Gel-R with mineral oil at the start of sequence (left) and the end of the sequence (right).
Figure 6. Stressed reduced (red) and non-reduced (blue) NIST mAb without mineral oil.
Figure 7. Stressed reduced (red) and non-reduced (blue) NIST mAb with mineral oil.

p4
Figure 8. Retention times of NIST mAb product peaks under non-reducing conditions with (+MO) and without (-MO) mineral oil.
Figure 9. Retention times of NIST mAb product peaks under reducing conditions with (+MO) and without (-MO) mineral oil.
Linearity: NIST mAb was prepared in triplicate at 0.8, 0.9, 1.0, 1.1
and 1.2 mg/ml and analysed for linear regression (R2) and accuracy
of purity levels in the presence and absence of mineral oil, under
both reducing and non-reducing conditions. Figure 10 and Figure 11
show that the R2 value was greater than or equal to 0.98 for both
conditions, independent of whether or not mineral oil was added to
Gel-R vials. These results demonstrate that the use of mineral oil
had no impact on linear regression for the NIST mAb under reduced
or non-reduced conditions.
Accuracy: Data from the linearity study were used in the
assessment of the impact upon accuracy. Results for % purity, %
leading peak (LP), and % heavy chain leading peak (HCLP) differed
across all n=15 replicates by not more than (NMT) 1%. Results at
each concentration (n=3) differed from the average of the whole data
set (n=15) by NMT 1%.
Test
Linearity (non-reducing)
Linearity (reducing)
LOQ LOD LOQ LOD
With Mineral Oil
0.15
0.05
0.14
0.04
Without Mineral Oil
0.21
0.07
0.13
0.04
Table 2. Calculated LOQ / LOD as % TCA for NIST mAb under reducing and non-reducing conditions, with and without mineral oil.
Figure 10. Linearity results for NIST mAb under non-reducing conditions with (+MO) and without (-MO) mineral oil.
Figure 11. Linearity results for NIST mAb under reducing condition with (+MO) and without (-MO) mineral oil.
LOD and LOQ: The limits of detection / quantitation were determined
using data from the linearity results (Table 2). A single peak was
selected and results were calculated as follows.
These results demonstrate that the LOD / LOQ values were not
impacted by the application of mineral oil to Gel-R vials.
p5
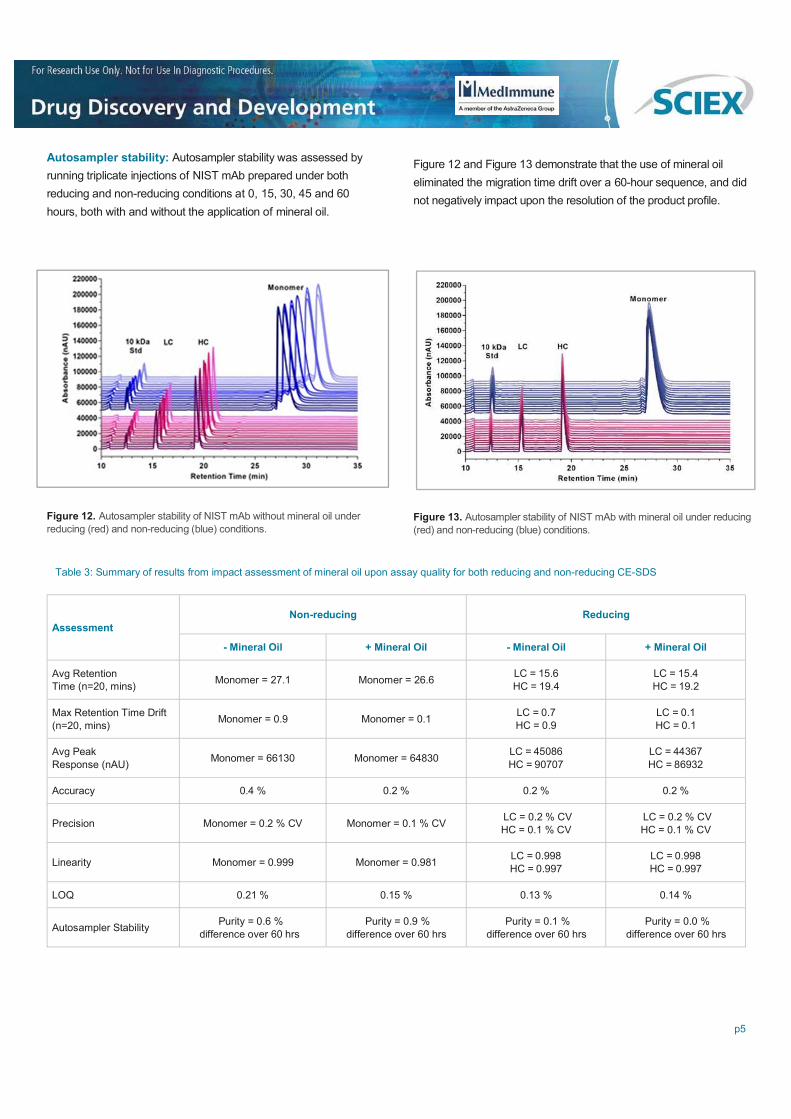
Autosampler stability: Autosampler stability was assessed by
running triplicate injections of NIST mAb prepared under both
reducing and non-reducing conditions at 0, 15, 30, 45 and 60
hours, both with and without the application of mineral oil.
Figure 12. Autosampler stability of NIST mAb without mineral oil under reducing (red) and non-reducing (blue) conditions.
Figure 12 and Figure 13 demonstrate that the use of mineral oil
eliminated the migration time drift over a 60-hour sequence, and did
not negatively impact upon the resolution of the product profile.
Figure 13. Autosampler stability of NIST mAb with mineral oil under reducing (red) and non-reducing (blue) conditions.
Table 3: Summary of results from impact assessment of mineral oil upon assay quality for both reducing and non-reducing CE-SDS
Assessment
Non-reducing
Reducing
- Mineral Oil + Mineral Oil - Mineral Oil + Mineral Oil
Avg Retention Time (n=20, mins)
Monomer = 27.1
Monomer = 26.6
LC = 15.6 HC = 19.4
LC = 15.4 HC = 19.2
Max Retention Time Drift (n=20, mins)
Monomer = 0.9
Monomer = 0.1
LC = 0.7 HC = 0.9
LC = 0.1 HC = 0.1
Avg Peak Response (nAU)
Monomer = 66130
Monomer = 64830
LC = 45086 HC = 90707
LC = 44367 HC = 86932
Accuracy 0.4 % 0.2 % 0.2 % 0.2 %
Precision
Monomer = 0.2 % CV
Monomer = 0.1 % CV
LC = 0.2 % CV HC = 0.1 % CV
LC = 0.2 % CV HC = 0.1 % CV
Linearity
Monomer = 0.999
Monomer = 0.981
LC = 0.998 HC = 0.997
LC = 0.998 HC = 0.997
LOQ 0.21 % 0.15 % 0.13 % 0.14 %
Autosampler Stability
Purity = 0.6 % difference over 60 hrs
Purity = 0.9 % difference over 60 hrs
Purity = 0.1 % difference over 60 hrs
Purity = 0.0 % difference over 60 hrs
Conclusions
We have demonstrated that the addition of mineral oil to the
Gel-R buffer vials during CE-SDS assay preparation significantly
reduced evaporation of the gel buffer. This resulted in a
significant improvement in the consistency of product profiles by
almost completely mitigating product peak drift.
Throughout this study there were no observable changes to the
product profiles as a result of using mineral oil, and no new or
spurious peaks were detected.
Using NIST mAb as a test molecule, we have also shown through
a series of experiments that there were no deleterious effects upon
the assays accuracy, precision, linearity, LOD/LOQ, or autosampler
stability. There were no observable changes in signal response,
and all reportable results in the form of % TCA were comparable
between runs using mineral oil and runs that did not.
The analysis of samples that displayed greater consistency in
product profiles with more reproduceable migration times for
product peaks, simplified the data processing aspect of CE-SDS
testing significantly. Correct assignment of peak IDs was more
reliable as integration windows could be tightened, without risk of
peak migration time shift leading to mislabeling or errors in purity
calculations.
Together, this eases the demand on analysts as the need for manual
adjustment of integration windows on a sample by sample basis was
reduced.
It is our recommendation that the application of mineral oil to
Gel-R buffer vials should be included as a regular part of assay
setup. Since mineral oil is added to buffer vials that are used for
capillary reconditioning and does not directly come into contact with
prepared sample, it is not expected that there would be any product
specific issues with its use.
Who is SCIEX? SCIEX company’s global leadership and
world- class service and support in the capillary electrophoresis
and liquid chromatography-mass spectrometry industry have
made it a trusted partner to thousands of the scientists and
lab analysts worldwide who are focused on basic research,
drug discovery and development, food and environmental
testing, forensics and clinical research.
Contact Us: sciex.com/contact-us
For Research Use Only. Not for use in diagnostic procedures.
© 2018 AB SCIEX. SCIEX is part of AB SCIEX. The trademarks mentioned herein are the property of AB Sciex Pte. Ltd. or their respective owners. AB SCIEX™ is being used under license. Mention of trade names or commercial products in this publication is solely for the purpose of providing specific information and does not imply recommendation or endorsement by the USDA.
Publication number: RUO-MKT-02-8773A 10/2018
Headquarters 500 Old Connecticut Path, Framingham, MA 01701, USA Phone 508-383-7800 sciex.com
International Sales For our office locations please call the division headquarters or refer to our website at sciex.com/offices
Related Documents