Simplified Nonlinearity Correction of Oxygen-15-Water Regional Cerebral Blood Flow Images without Blood Sampling Marco A. Mejia, Masatoshi Itoh, Hiroshi Watabe, Takehiko Fujiwara and Takashi Nakamura Nuclear Medicine Division and Department of Radiation Protection, Cyclotron and Radioisotope Center, Tohoku University, Tohoku, Japan A noninvasive method, the double-integration method, was de veloped to estimate regional cerebral blood flow (rCBF) by using 150-water and PET. It relies on the acquisition of images with a correction of nonlinearity of brain tissue counts and can produce rCBF images on a pixel-by-pixel basis. Methods: Oxygen-15- water PET studies were performed on five normal human vol unteers, and continuous sampling from the radial artery was conducted to generate functional CBF images according to the invasive catheterization method. The method centers on a com puter-based program elaborated to calculate an arterial input function with an assumption of the whole brain blood rate of 50 ml/dl/min and consequently does not require arterial catheteriza tion or arterial input function sampled from other studies. Results: The results indicate a good correlation between this method and the invasive method (r > 0.966, p< 0.001). Conclusion: This noninvasive method was demonstrated to provide an accurate estimation of rCBF and may simplify the activation studies. Key Words: regional cerebral blood flow; oxygen-15-water; PET; noninvasive method J NucÃ-Med 1994; 35:1870-1877 .he measurement of regional cerebral blood flow (rCBF) was established with PET and 150-water. Several methods have been described to measure rCBF, such as a combination of dynamic and integral methods (1,2), the integrated projection technique (3), weighted-integration technique (4), the steady-state method (5) and the autora- diographic method (6-8). These methods take into account functional information derived from tissue counts and ap propriate arterial blood samples. At the same time, a cor rection for delay and dispersion within an arterial counting device has to be determined to avoid errors in the calcu lated rCBF (9,10). On the other hand, the use of arterial catheterization to collect blood samples is an undesirable procedure, especially in studies that require repeated mea surements (e.g., activation studies), because discomfort and pain may affect the real flow values (11). Furthermore, patient complaints and pain may result in some inconve nience for both the patients and examiners. Therefore, arterial catheterization has had to be abandoned in some studies. In these cases, a standard input function has been used to calculate rCBF. However, this procedure has the pitfall of increasing the nonlinearity in the corrected flow because this standard input function can be different from the true individual input function. In the present article, a noninvasive method, the double- integration method (DIM), is proposed to linearize brain activity without arterial blood sampling. This method as sumes the whole brain blood rate to be 50 ml/dl/min, and double integration is done of the tissue activity curve to calculate the input function. The 15O-water kinetic data obtained with a PET scanner were processed for the cal culation of the rCBF. The method has the ability to pro duce a pixel-by-pixel image of the rCBF. The principles of the theoretics and the computational scheme are pre sented. Computer simulations were realized to validate the results. In this study, both this method and the invasive method were performed, and the results achieved by both procedures were correlated to assess the accuracy of this noninvasive method. THEORY According to the principle of inert gas exchange between capillary blood and tissue, in a single-compartment model for the CBF measurement using 15O-labeledwater devel oped by Ketty (12), the tissue radiotracer concentration is expressed with the rate constant of K, (influx or clearance) and k2 (efflux or rate) as follows: dC,(t) dt - k2Q(t), Eq.l Received Nov. 29,1993; revision accepted June 13,1994. For correspondence or reprints contact: Dr. Marco A. Mejia, Nuclear Medicine Division, Cyclotron and Radioisotope Center, Tohoku University, Aramaki-Aoba, Aoba-ku. Sendai 980, Japan. where K! = f (flow), k2 = f/Vd (Vd = volume of distribu tion of water for brain tissue) and Ca(t) and C,(t) are decay- corrected arterial and tissue concentrations, respectively. 1870 TheJournalof NudearMedicine• Vol.35 • No.11• November1994 by on February 29, 2016. For personal use only. jnm.snmjournals.org Downloaded from

Welcome message from author
This document is posted to help you gain knowledge. Please leave a comment to let me know what you think about it! Share it to your friends and learn new things together.
Transcript

Simplified Nonlinearity Correction ofOxygen-15-Water Regional Cerebral Blood FlowImages without Blood SamplingMarco A. Mejia, Masatoshi Itoh, Hiroshi Watabe, Takehiko Fujiwara and Takashi Nakamura
Nuclear Medicine Division and Department of Radiation Protection, Cyclotron and Radioisotope Center,Tohoku University, Tohoku, Japan
A noninvasive method, the double-integration method, was de
veloped to estimate regional cerebral blood flow (rCBF) by using150-water and PET. It relies on the acquisition of images with a
correction of nonlinearity of brain tissue counts and can producerCBF images on a pixel-by-pixel basis. Methods: Oxygen-15-
water PET studies were performed on five normal human volunteers, and continuous sampling from the radial artery wasconducted to generate functional CBF images according to theinvasive catheterization method. The method centers on a computer-based program elaborated to calculate an arterial input
function with an assumption of the whole brain blood rate of 50ml/dl/min and consequently does not require arterial catheterization or arterial input function sampled from other studies.Results: The results indicate a good correlation between thismethod and the invasive method (r > 0.966, p < 0.001).Conclusion: This noninvasive method was demonstrated toprovide an accurate estimation of rCBF and may simplify theactivation studies.
Key Words: regional cerebral blood flow; oxygen-15-water;PET; noninvasive method
J NucÃMed 1994; 35:1870-1877
.he measurement of regional cerebral blood flow(rCBF) was established with PET and 150-water. Several
methods have been described to measure rCBF, such as acombination of dynamic and integral methods (1,2), theintegrated projection technique (3), weighted-integrationtechnique (4), the steady-state method (5) and the autora-diographic method (6-8). These methods take into accountfunctional information derived from tissue counts and appropriate arterial blood samples. At the same time, a correction for delay and dispersion within an arterial countingdevice has to be determined to avoid errors in the calculated rCBF (9,10). On the other hand, the use of arterialcatheterization to collect blood samples is an undesirable
procedure, especially in studies that require repeated measurements (e.g., activation studies), because discomfortand pain may affect the real flow values (11). Furthermore,patient complaints and pain may result in some inconvenience for both the patients and examiners. Therefore,arterial catheterization has had to be abandoned in somestudies. In these cases, a standard input function has beenused to calculate rCBF. However, this procedure has thepitfall of increasing the nonlinearity in the corrected flowbecause this standard input function can be different fromthe true individual input function.
In the present article, a noninvasive method, the double-integration method (DIM), is proposed to linearize brainactivity without arterial blood sampling. This method assumes the whole brain blood rate to be 50 ml/dl/min, anddouble integration is done of the tissue activity curve tocalculate the input function. The 15O-water kinetic data
obtained with a PET scanner were processed for the calculation of the rCBF. The method has the ability to produce a pixel-by-pixel image of the rCBF. The principles ofthe theoretics and the computational scheme are presented. Computer simulations were realized to validate theresults. In this study, both this method and the invasivemethod were performed, and the results achieved by bothprocedures were correlated to assess the accuracy of thisnoninvasive method.
THEORY
According to the principle of inert gas exchange betweencapillary blood and tissue, in a single-compartment modelfor the CBF measurement using 15O-labeledwater devel
oped by Ketty (12), the tissue radiotracer concentration isexpressed with the rate constant of K, (influxor clearance)and k2 (efflux or rate) as follows:
dC,(t)
dt- k2Q(t), Eq.l
Received Nov. 29,1993; revision accepted June 13,1994.For correspondence or reprints contact: Dr. Marco A. Mejia, Nuclear Medicine
Division, Cyclotron and Radioisotope Center, Tohoku University, Aramaki-Aoba,Aoba-ku. Sendai 980, Japan.
where K! = f (flow), k2 = f/Vd (Vd = volume of distribution of water for brain tissue) and Ca(t) and C,(t) are decay-corrected arterial and tissue concentrations, respectively.
1870 TheJournalof NudearMedicine•Vol.35•No.11•November1994
by on February 29, 2016. For personal use only. jnm.snmjournals.org Downloaded from
1500l
1000
au
500
J_200
Time (sec)
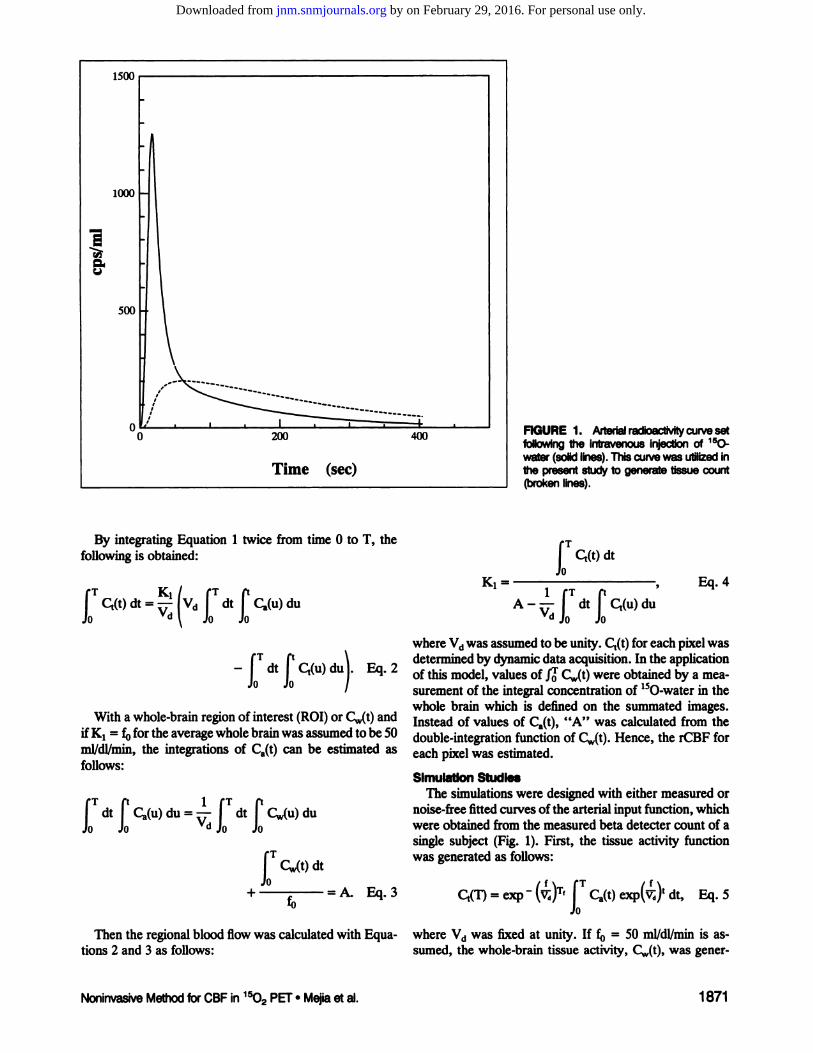
400 RGURE 1. Arterial radioactivity curve setfollowing the intravenous injection of 15O-
water (solid lines). This curve was utilized inthe present study to generate tissue count(broken lines).
By integrating Equation 1 twice from time 0 to T, thefollowing is obtained:
fT KI / fT ftI Q(t)dt = -i Vd dt Ca(u)du
Jo d \ Jo Jo
o oQ(u)du. Eq. 2
With a whole-brain region of interest (ROI) or (^(t) andif K! = f0for the average whole brain was assumed to be 50
ml/dl/min, the integrations of Ca(t) can be estimated asfollows:
fT dt P QCu) du = — P dt P CJu) du
Jo Jo V<UO Jo
fCw(t) dt
+ A. Eq.3
Then the regional blood flow was calculated with Equa-
tions 2 and 3 as follows:
K,fQ(t) dt
1 fT ft-— dt Q(u)du
Vd Jo JO
Eq. 4
where Vd was assumed to be unity. C,(t) for each pixel wasdetermined by dynamic data acquisition. In the applicationof this model, values of /J C^t) were obtained by a measurement of the integral concentration of 150-water in the
whole brain which is defined on the summated images.Instead of values of Ca(t), "A" was calculated from the
double-integration function of C^t). Hence, the rCBF for
each pixel was estimated.
Simulation StudiesThe simulations were designed with either measured or
noise-free fitted curves of the arterial input function, which
were obtained from the measured beta détectercount of asingle subject (Fig. 1). First, the tissue activity functionwas generated as follows:
Q(T) = exp - (v¡)T-i Ca(t) exp(v¡)' dt, Eq. 5
Jo
where Vd was fixed at unity. If ÕQ= 50 ml/dl/min is assumed, the whole-brain tissue activity, Cw(t), was gener-
Noninvasive Method for CBF in 1502 PET •Mejia et al. 1871
by on February 29, 2016. For personal use only. jnm.snmjournals.org Downloaded from

ated (Fig. 1). The tissue activity for other brain regions wassimilarly generated with different flow values, e.g., 20 and80 ml/dl/min. Finally, according to Equation 4, K! wascalculated for each simulated tissue activity as describedearlier.
Regions of white and gray matter were simulated byassuming the flow to be 20 and 80 ml/dl/min, respectively.
MATERIALS AND METHODS
PET Studies and Data ProcessingThe study was performed on five normal volunteers (age
range 23-32 yr, mean ±s.d. 27 ±3 yr). All subjects
included in this study participated in an activation studyprotocol. Two control states were studied. Cerebral bloodflow was measured with 15O-water and the ECAT 931
(CTI, Knoxville, TN). The system has an image resolutionin reconstructed transaxial and axial dimensions of 8 and7.5 mm, respectively. A transmission scan was performedto correct tissue attenuation with a ^Ge-^Ga external ringsource. For the measurement of CBF, 40 mCi of 15O-water
was injected in a period of 20 sec through the antecubital
30
•o
oC
10
20
5560"
100 200 300
Scan time (sec)
400
g1
oe
IB
120
100
8050
55
60
100 200 300
Scan time (sec)
RGURE 2. Effectof whole-braincurvewithCBF notequalto 50ml/dl/min on estimation of flow values. CBF was obtained by assuming CBF = 50 ml/dl/min in the calculation of a by using a fitted inputfunction.
gis
25
20
i31
45
50
55
60
I20 40 60
Scan time (sec)
I
I
a
i
100
60
55
60
40 60
Scan time (sec)
FIGURE 3. Effectof whole-braincurvewithCBF notequalto 50ml/dl/min on estimationof flow values. CBF was obtained by assuming CBF = 50 ml/dl/min in the calculation of a by using a measuredinput function.
vein. Four 15O-water scans were collected; each scan wasstarted simultaneously with the 15O-water injection. Here
only the results of the first and last scan performed underresting baseline conditions will be given. Sequential imageswere obtained at the same levels of the brain with thecenter of the axial field of view at 50 mm above the Deutchhorizontal line. Each study included the following protocol: a 30-sec background scan followed by 18 consecutive
frames of 5 sec each (scan frame time) during 90 sec (scantime). After image reconstruction, dynamic image datawere transferred to a work station for image processing.
The arterial radioactivity concentration was monitoredwith a beta counter set along a blood draining line. With adraining pump, blood was withdrawn from the radial arteryby a cannula at a flow rate of 4 ml/min, and radioactivitywas counted with a counter that consisted of a plasticscintillator and counting electronics to yield the arterialinput function. The concentration of radioactivity in thearterial line was measured in a well counter for the calibration between the beta detector and the well counter.
1872 The Journal of Nuclear Medicine •Vol. 35 •No. 11 •November 1994
by on February 29, 2016. For personal use only. jnm.snmjournals.org Downloaded from

lle
l1l
20.5
20
19.5 Scan time = 100 sec
Scan time = 200 sec
Scan time = 400 sec
i l L L20 60
Scan frame time (sec)
i
u 79.5Scan time - 100 sec
Scan time = 200 sec
Scan time = 400 sec
I i I J_20 40 60 80
Scan frame time (sec)
100
FIGURE 4. Effect of interval scan time on a 5-100-sec interval
was considered with a different total scan time from 100, 200 and400 sec by using a fitted input function.
With these images and the arterial radioactivity curve,CBF was calculated. Values of the delay time were estimated (73) from the least-squares fit between the initial
slope of the total counts of the PET system and those of theestimated brain activity curve that was generated from thearterial curve with a dispersion time constant of 25 sec,according to the method of Lammertsma et al. (1). Standard rCBF images were generated according to the auto-
radiographic technique with an individual arterial inputfunction and a standard input function (7). However, aprogram was elaborated to calculate pixel-by-pixel rCBFimages, according to the method described. The whole-
brain ROIs were set manually on the summated images.Several elliptic ROIs were defined on the functional im
ages generated by the autoradiographic method and projected with the same location on those generated by thecurrent method for comparison, including the whole brain,the frontal cortex and the frontal white matter. Similarly,images generated by the autoradiographic method werecompared with those generated with a standard input function.
RESULTS
SimulationThe rCBF was correctly calculated by this method when
the whole-brain flow was 50 ml/dl/min in either a low- (20ml/dl/min) or high-flow region (80 ml/dl/min) for any scantime (Fig. 2). When the real whole-brain flow was higher orlower than 50 ml/dl/min, the regional flow was under- or
overestimated. This situation is not affected by using themeasured arterial curve (Fig. 3) or a fitted noise-free curve
(Fig- 2).Figure 4 depicts the effect of scan frame time (abscissa)
as a function of the scan time from 100, 200 and 400 sec forhigh- (80 ml/dl/min) and low-flow (20 ml/dl/min) regions.
The calculated flow showed some divergence; however,the CBF values shifted only slightly. For example, in alow-flow region, the underestimation was approximately3% (Fig. 4a), whereas in the high-flow region, the overes-
timation was approximately 1.5% (Fig. 4b) on the totalscan time selected at 100 sec.
The effect of fixing Vd at unity was evaluated by generating C,(t) with various Vd values, as shown in Figure 5. It
a1
1
I
—
11 16 -
200
Scan time (sec)
1
100 200 300
Scan time (sec)
FIGURE 5. Error due to an incorrect Vd of water (arrows). CBFvalues were plotted for varying Vd from 0.8 to 1.2 in increments of 0.1by using a fitted input function.
Noninvasive Method for CBF in 1502 PET •Mejia et al. 1873
by on February 29, 2016. For personal use only. jnm.snmjournals.org Downloaded from

can be seen that Vd values less than 1.0 produce a systematic underestimation in the calculated flow and a systematic overestimation with Vd values more than 1.0, especially when flow was high. For example, more than 10% oferror in CBF resulted from a 20% overestimation of Vd ata scan time of 100 sec (Fig. 6). Statistical random noise wasintroduced into tissue activities (14), including the wholebrain (Fig. 7). It was noted that the calculated flow wasrather stable with a shorter scan time; 20% of tissue noiseinduced less than 5% CBF error.
Human StudiesFigure 8 shows the corresponding CBF images by the
autoradiographic method and by the current method in onesubject. Comparisons of flow values of the whole brain,cortical regions and white matter are shown for each patient in Table 1. Note that the CBF values for the wholebrain in the current method are comparable with those inthe autoradiographic method. The correlation betweenthese images was evaluated by a pixel-by-pixel plot of all
image pixels, as shown in Figure 9 for a typical case. Asignificant correlation was obtained. The correlation wasalso tested between images obtained with individual arte-
1
I
1
22
20
20 40 60
Scan time (sec)
j
1
j
80
0.9
OS
20 80
Scan time (sec)
FIGURE 6. Errordue to an incorrectVd of water (arrows).CBFvalues were plottedfor varying Vdfrom 0.8 to 1.2 in increments of 0.1by using a measured input function.
2O5
i 20
eB 19.5 Scan lime = 100 sec
Scan lime = 200 sec
Scan lime = 400 sec
10 20
b error in PET data
30
84
.0 82B
76
Scan time = 100 sec
Scan time = 200 sec
Scan time = 400 sec
10 20
5 error in PET data
30
FIGURE 7. Percentageof error in noisescan levelwas plottedusing 100-, 200- and 400-sec total scan time with flows of 20 and 80ml/dl/min.
FIGURE 8. Raw imagesand quantitativesimages.Two originalimages were processed according to the invasive method and DIM.This corresponds to one study.
1874 The Journal of Nuclear Medicine •Vol. 35 •No. 11 •November 1994
by on February 29, 2016. For personal use only. jnm.snmjournals.org Downloaded from

TABLE 1Autoradiographic Method Versus Double-Integration Method Comparison*
Study 1 Study 2 Study 3 Study 4 Study 5
Run 1 Run 2 Run 1 Run 2 Run 1 Run 2 Run 1 Run 2 Run 1 Run 2
Whole brain
Gray matter
White matterARM
ARMDIMARMDIM49.5
+ 2.369 1 * 4167.1
+4.3248 + 0623.3
±0.752.0
68664.730226.53.4SI4"i1
71.550.0
±1.1 47.6 ±2.0 50.1 ±3.2 47.7 ±2.761 8 + 46 670-|-83 61 2 + 6 5 614 +9762.5
+ 4.6 71.4 + 9.4 62.0 + 8.3 58.5 +8.7264 + 16 26 0 + 02 29 0 + 20 314 +2028.7
±2.3 25.4 ±1.0 30.0 ±2.0 29.5 + 1.147.9
±2.761 0 + 6663.6
+6.7256 + 2125.3
+ 1.149.6
64069.428126.33.66667?72.753.3±1.2
688 +9663.5+9.231.5+
1.627.6+ 2.050.6
69767.025.228.60.7677flOR4.0
'Values are expressed as mean ±s.d.
ARM = autoradiographic method; DIM = double-integration method.
rial input function and those obtained with a standard inputfunction (Fig. 10). Although a good correlation was observed, distortion of the linearity was found in the higher-
flow regions. On the other hand, the mean and s.d. on thefrontal cortex by the autoradiographic method with a standard input function were significantly larger than thosefrom the noninvasive method (76.42 ±11.6). The accuracyof the letter method is clearly demonstrated.
DISCUSSIONThe goal of this study was to estimate rCBF with 150-
water and PET noninvasively. Such measurement of rCBFrequires serial arterial blood sampling to determine theinput function. Because arterial blood sampling is stressfulto subjects, simplified semiquantitative methods have beenused, such as using the tissue activity alone or substitutingindividual blood activity by the average standardized arterial curve (15,16). In either case, regional flow was normalized by assuming a whole-brain flow rate of a certain value,
such as 50 ml/dl/min. However, the nonlinearity between
normalized brain counts and real flow are not solved because individual true input functions are not known. Thepresent method is an attractive approach to the estimate ofrCBF by the use of 15O-water. It also assumes a fixed
whole-brain flow value not only to normalize flow but also
to cancel out arterial input function. The method was basedon the dynamic approach and has the advantage of avoiding arterial data from other studies. If the whole brain flowis assumed to be 50 ml/dl/min and the Vd to be unity, themethod generates flow images in a short time.
In the computer simulations with an ideal input curve,free from noise, with short scan times (such as 10 sec),CBF was accurately calculated. These simulations suggestany scan protocol may be applicable as long as noise-free
tissue function is obtained. When a measured (with statistical noise) curve for input function was used, the simulation corroborated the results by a fitted curve. However, asshown in Figure 5, flow values become more labile withlonger scan times because of the effects of tissue hetero-
genity. There is a potential problem of the sampling pitch in
100.0
20.0 40.0 60.0 80.0Autoradiographic Method (CBF ml/dl/min)
100.0
FIGURE 9. Comparisonof rCBF valuesmeasured by DIM and the autoradiographicmethod on a pixel-by-pixel basis, corresponding to a study. The solid line represents the linear-regression line.
Noninvasive Method for CBF in 1502 PET •Mejia et al. 1875
by on February 29, 2016. For personal use only. jnm.snmjournals.org Downloaded from
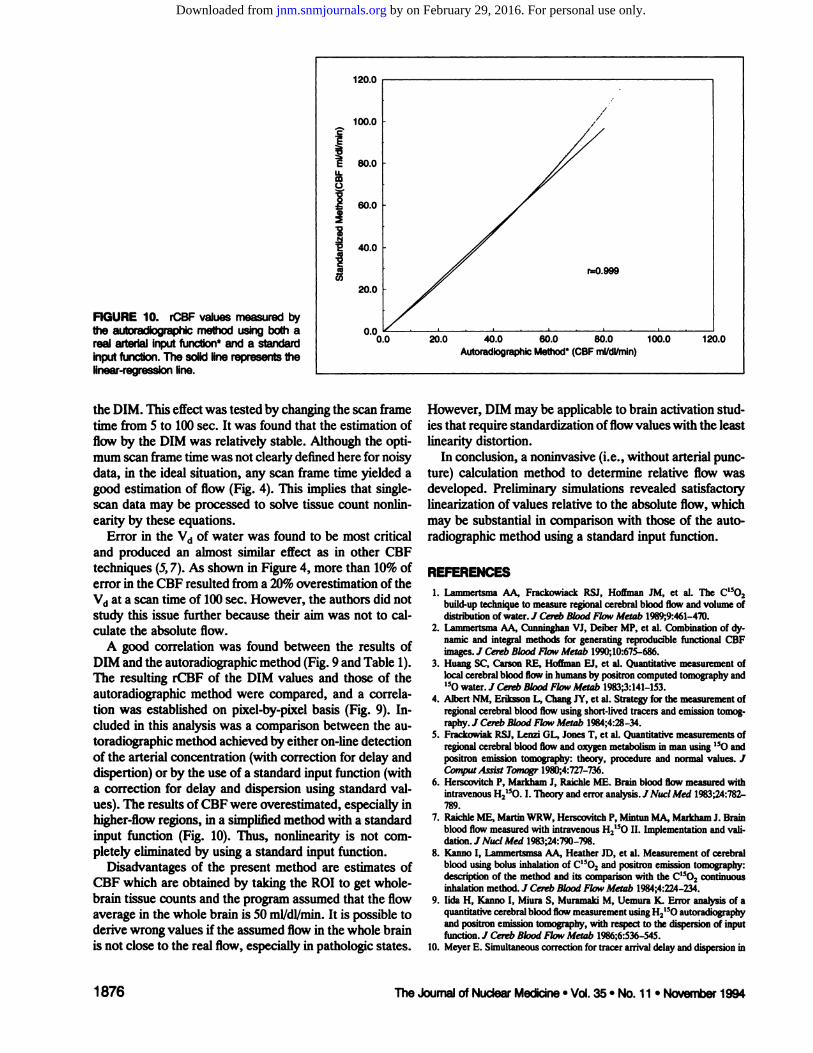
FIGURE 10. rCBF values measured bythe autoradiographic method using both areal arterial input function* and a standard
input function. The solid line represents thelinear-regression line.
CDO
120.0
100.0
80.0
60.0
.N'S 40.0
l20.0
0.0
r=0.999
0.0 20.0 40.0 60.0 80.0Autoradiographic Method* (CBF ml/dl/min)
100.0 120.0
the DIM. This effect was tested by changing the scan frametime from 5 to 100 sec. It was found that the estimation offlow by the DIM was relatively stable. Although the optimum scan frame time was not clearly defined here for noisydata, in the ideal situation, any scan frame time yielded agood estimation of flow (Fig. 4). This implies that single-scan data may be processed to solve tissue count nonlin-
earity by these equations.Error in the Vd of water was found to be most critical
and produced an almost similar effect as in other CBFtechniques (5,7). As shown in Figure 4, more than 10% oferror in the CBF resulted from a 20% overestimation of theVd at a scan time of 100 sec. However, the authors did notstudy this issue further because their aim was not to calculate the absolute flow.
A good correlation was found between the results ofDIM and the autoradiographic method (Fig. 9 and Table 1).The resulting rCBF of the DIM values and those of theautoradiographic method were compared, and a correlation was established on pixel-by-pixel basis (Fig. 9). In
cluded in this analysis was a comparison between the autoradiographic method achieved by either on-line detection
of the arterial concentration (with correction for delay anddispertion) or by the use of a standard input function (witha correction for delay and dispersion using standard values). The results of CBF were overestimated, especially inhigher-flow regions, in a simplified method with a standard
input function (Fig. 10). Thus, nonlinearity is not completely eliminated by using a standard input function.
Disadvantages of the present method are estimates ofCBF which are obtained by taking the ROI to get whole-
brain tissue counts and the program assumed that the flowaverage in the whole brain is 50 ml/dl/min. It is possible toderive wrong values if the assumed flow in the whole brainis not close to the real flow, especially in pathologic states.
However, DIM may be applicable to brain activation studies that require standardization of flow values with the leastlinearity distortion.
In conclusion, a noninvasive (i.e., without arterial puncture) calculation method to determine relative flow wasdeveloped. Preliminary simulations revealed satisfactorylinearization of values relative to the absolute flow, whichmay be substantial in comparison with those of the autoradiographic method using a standard input function.
REFERENCES1. Lammertsma AA, Frackowiack RSJ, Hoffman JM, et al. The C1502
build-up technique to measure regional cerebral blood flow and volume ofdistribution of water. J Cereb Blood Flow Metab 1989;9:461-470.
2. Lammertsma AA, Cunninghan VJ, Deiber MP, et al. Combination of dynamic and integral methods for generating reproducible functional CBFimages. J Cereb Blood Flow Metab 1990;10:675-686.
3. Huang SC, Carson RE, Hoffman El, et al. Quantitative measurement oflocal cerebral blood flow in humans by positron computed tomography and15Owater. J Cereb Blood Flow Metab 1983;3:141-153.
4. Albert NM, Eriksson L, Chang JY, et al. Strategy for the measurement ofregional cerebral blood flow using short-lived tracers and emission tomography. J Cereb Blood Flow Metab 1984;4:28-34.
5. Frackowiak RSJ, Lenzi GL, Jones T, et al. Quantitative measurements ofregional cerebral blood flow and oxygen metabolism in man using ISO and
positron emission tomography: theory, procedure and normal values. JCompia Assist Tomogr 1980;4:727-736.
6. Herscovitch P, Markham J, Raichle ME. Brain blood flow measured withintravenous H215O. I. Theory and error analysis. J NucÃMed 1983;24:782-
789.7. Raichle ME, Martin WRW, Herscovitch P, Mintun MA, Markham J. Brain
blood flow measured with intravenous H21S0 II. Implementation and vali
dation. J NucÃMed 1983;24:790-798.8. Kann»I, Lammertsmsa AA, Heather JD, et al. Measurement of cerebral
blood using bolus inhalation of C15O2and positron emission tomography:description of the method and its comparison with the ('"<), continuous
inhalation method. J Cereb Blood Flow Metab 1984;4:224-234.9. lida H, Kanno I, Miura S, Muramaki M, Uemura K. Error analysis of a
quantitative cerebral blood flow measurement using 11,'''<) autoradiography
and positron emission tomography, with respect to the dispersion of inputfunction. J Cereb Blood Flow Metab 1986;6:536-545.
10. Meyer E. Simultaneous correction for tracer arrival delay and dispersion in
1876 The Journal of Nuclear Medicine •Vol. 35 •No. 11 •November 1994
by on February 29, 2016. For personal use only. jnm.snmjournals.org Downloaded from

CBF measurements by the H2150 autoradiographic method and dynamic as a noninvasive input function in dynamic oxygen-15-water positron emis-
PET. J NucÃMed 1989;30:1069-1078. sion tomography. J NucÃMed 1992;33:1669-1677.11. Resnick S, Skolnic B, Alavi A, Rervich M. The effect of anxiety on cortical 15. Iida H, Kanno I, Miura S, et al. Error analysis of a quantitative cerebral
cerebral blood flow and metabolism. J Cereb Blood Flow Metab 1987;7: blood flow measurements using H2"O autoradiography and positron emis
sion tomography, with respect to the dispersion of the input function. /12. Ketty SS. The theory and apphcation of the exchange of inert gas at thelungLd tissues. PharmacdRev 1951*1-41. Cereb Blood Flow Metab 1^6:536-545.
13. Iida H, Kanno I, Miura S, et al. A determination of the regional brain/blood 16' Itoh H-Iida H- Muramaki M- * al. A method for measurement of regionalpartition coefficient of water using dynamic positron emission tomography. cerebral blood flow using N-isopropyl-p-[123I]iodoamphetamine (123I-IMP)
J Cereb Blood Flow Metab 1989;9:874-885. SPECT; two scans with one point blood data sampling technique. Jpn J14. Iida H, Rhodes CG, Silva R, et al. Use of the ventricular time-activity curve NucÃMed [Kakuigaku] 1992;9:1193-1200.
Noninvasive Method for CBF in 1SO2PET •Mejia et al. 1877
by on February 29, 2016. For personal use only. jnm.snmjournals.org Downloaded from

1994;35:1870-1877.J Nucl Med. Marco A. Mejia, Masatoshi Itoh, Hiroshi Watabe, Takehiko Fujiwara and Takashi Nakamura Images without Blood SamplingSimplified Nonlinearity Correction of Oxygen-15-Water Regional Cerebral Blood Flow
http://jnm.snmjournals.org/content/35/11/1870This article and updated information are available at:
http://jnm.snmjournals.org/site/subscriptions/online.xhtml
Information about subscriptions to JNM can be found at:
http://jnm.snmjournals.org/site/misc/permission.xhtmlInformation about reproducing figures, tables, or other portions of this article can be found online at:
(Print ISSN: 0161-5505, Online ISSN: 2159-662X)1850 Samuel Morse Drive, Reston, VA 20190.SNMMI | Society of Nuclear Medicine and Molecular Imaging
is published monthly.The Journal of Nuclear Medicine
© Copyright 1994 SNMMI; all rights reserved.
by on February 29, 2016. For personal use only. jnm.snmjournals.org Downloaded from
Related Documents