Brigham Young University Brigham Young University BYU ScholarsArchive BYU ScholarsArchive Theses and Dissertations 2006-07-19 Simple Sequence Repeat Development, Polymorphism and Simple Sequence Repeat Development, Polymorphism and Genetic Mapping in Quinoa (Chenopodium quinoa Willd.) Genetic Mapping in Quinoa (Chenopodium quinoa Willd.) David Jarvis Brigham Young University - Provo Follow this and additional works at: https://scholarsarchive.byu.edu/etd Part of the Animal Sciences Commons BYU ScholarsArchive Citation BYU ScholarsArchive Citation Jarvis, David, "Simple Sequence Repeat Development, Polymorphism and Genetic Mapping in Quinoa (Chenopodium quinoa Willd.)" (2006). Theses and Dissertations. 504. https://scholarsarchive.byu.edu/etd/504 This Thesis is brought to you for free and open access by BYU ScholarsArchive. It has been accepted for inclusion in Theses and Dissertations by an authorized administrator of BYU ScholarsArchive. For more information, please contact [email protected], [email protected].

Welcome message from author
This document is posted to help you gain knowledge. Please leave a comment to let me know what you think about it! Share it to your friends and learn new things together.
Transcript

Brigham Young University Brigham Young University
BYU ScholarsArchive BYU ScholarsArchive
Theses and Dissertations
2006-07-19
Simple Sequence Repeat Development, Polymorphism and Simple Sequence Repeat Development, Polymorphism and
Genetic Mapping in Quinoa (Chenopodium quinoa Willd.) Genetic Mapping in Quinoa (Chenopodium quinoa Willd.)
David Jarvis Brigham Young University - Provo
Follow this and additional works at: https://scholarsarchive.byu.edu/etd
Part of the Animal Sciences Commons
BYU ScholarsArchive Citation BYU ScholarsArchive Citation Jarvis, David, "Simple Sequence Repeat Development, Polymorphism and Genetic Mapping in Quinoa (Chenopodium quinoa Willd.)" (2006). Theses and Dissertations. 504. https://scholarsarchive.byu.edu/etd/504
This Thesis is brought to you for free and open access by BYU ScholarsArchive. It has been accepted for inclusion in Theses and Dissertations by an authorized administrator of BYU ScholarsArchive. For more information, please contact [email protected], [email protected].

SIMPLE SEQUNCE REPEAT DEVELOPMENT, POLYMORPHISM
AND GENETIC MAPPING IN QUINOA
(CHENOPODIUM QUINOA WILLD.)
by
David E. Jarvis
A thesis submitted to the faculty of
Brigham Young University
in partial fulfillment of the degree requirements for
Master of Science
Department of Plant and Animal Sciences
Brigham Young University
August 2006

BRIGHAM YOUNG UNIVERSITY
GRADUATE COMMITTEE APPROVAL
of a thesis submitted by
David E. Jarvis
This thesis has been read by each member of the following graduate committee and by majority vote has been found to be satisfactory. ______________________________ ____________________________________ Date Eric N. Jellen, Chair ______________________________ ____________________________________ Date P. Jeffrey Maughan
______________________________ ____________________________________ Date R. Paul Evans

BRIGHAM YOUNG UNIVERSITY
As chair of the candidate’s graduate committee, I have read the thesis of David E. Jarvis in its final form and have found that (1) its format, citations, and bibliographical style are consistent and acceptable and fulfill university and departmental style requirements; (2) its illustrative material including figures, tables, and charts are in place; and (3) the final manuscript is satisfactory to the graduate committee and is ready for submission to the university library. ______________________________ _________________________________ Date Eric N. Jellen Chair, Graduate Committee Accepted for the Department _________________________________ Von D. Jolley Graduate Coordinator Accepted for the College _________________________________ Rodney J. Brown Dean, College of Biology and Agriculture

ABSTRACT
SIMPLE SEQUNCE REPEAT DEVELOPMENT, POLYMORPHISM
AND GENETIC MAPPING IN QUINOA
(CHENOPODIUM QUINOA WILLD.)
David E. Jarvis
Department of Plant and Animal Sciences
Master of Science
Quinoa is an important, highly nutritional grain crop in the Andean region of
South America. DNA markers and linkage maps are important tools for the improvement
of underdeveloped crops such as quinoa. The objectives of this study were to (i) develop
a new set of SSR markers to augment the number of SSR markers available in quinoa,
and (ii) construct a new genetic linkage map of quinoa based on SSRs using multiple
recombinant-inbred line (RIL) populations. Here we report the development of 216 new
polymorphic SSR markers from libraries enriched for GA, CAA, and AAT repeats, as
well as 6 SSR markers developed from BAC-end sequences (BES-SSRs).
Heterozygosity (H) values of the SSR markers ranged from 0.12 to 0.90, with an average
value of 0.56. These new SSR and BES-SSR markers were analyzed on two RIL

mapping populations (designated Population 1 and Population 40), each obtained by
crossing Altiplano and coastal ecotypes of quinoa. Additional markers, including AFLPs,
two 11S seed storage protein loci, a SNP, and the nucleolar organizing region (NOR),
were also analyzed on one or both populations. Linkage maps were constructed for both
populations. The Population 1 map contains 275 markers, including 200 SSR and 70
AFLP markers, as well as five additional markers. The map consists of 41 linkage
groups (LGs) covering 913 cM. The Population 40 map contains 68 markers, including
62 SSR and six BES-SSR markers, and consists of 20 LGs covering 353 cM. Thirty-nine
anchor markers common between both maps were used to combine 15 Population 1 LGs
with 13 Population 40 LGs. The resulting integrated map consists of 13 LGs containing
140 SSR, 48 AFLP, four BES-SSR, one SNP, and one NOR marker spanning a total of
606 cM. A high level of segregation distortion was observed in both populations,
indicating possible chromosomal regions associated with gametophytic factors or QTLs
conferring a selective advantage under the particular growing conditions. As these maps
are based primarily on easily-transferable SSR markers, they are particularly suitable for
applications in the underdeveloped Andean regions where quinoa is grown.

ACKNOWLEDGMENTS
Many thanks are owed to my committee chair, Dr. Eric N. Jellen, and my committee
members, Dr. P. Jeff Maughan and Dr. R. Paul Evans. Their doors and email inboxes
have always been open, and they have been always willing to answer questions or give
advice. Dr. Mikel Stevens and Dr. Craig Coleman have also been helpful and enjoyable
to work with. Thanks to all the quinoa team for making such a unique environment in
which students can learn and grow together. I am indebted to the countless undergrads
that have helped me with the tedious tasks of pouring and loading gels; there are too
many to mention them all. Dr. Olga Kopp and her team, especially Melanie Mallory, did
excellent work on the SSR development. Thanks to Aaron Towers for his help on
AFLPs, Kristin Andelin for her help on SNP mapping, and Jenny N. Thornton for her
help on 11S mapping. I am also grateful to the McKnight Foundation and the Holmes
Family Foundation, whose financial support made my project possible. Most of all, a
very special thanks to my patient and beautiful wife, Stephanie, for her constant love and
support.

vii
TABLE OF CONTENTS
Graduate Committee Approval ii
Final Reading Approval and Acceptance iii
Abstract iv
Acknowledgments vi
List of Figures ix
List of Tables x
Chapter 1: Simple Sequence Repeat Development, Polymorphism, and Genetic
Mapping in Quinoa (Chenopodium quinoa Willd.) 1
Introduction 2
Materials and Methods 4
Results and Discussion 10
Conclusions 20
References 23
Chapter 2: Tables and Figures 30
Chapter 3: Literature Review 51
Introduction 52
History 53
Taxonomy 54
Breeding 55
Biotic and Abiotic Stresses 57
Molecular Studies in Quinoa 58

viii
Molecular Markers 60
Simple Sequence Repeats 62
Mapping 63
Conclusion 64
References 65
Appendix: Scoring Data 75

ix
LIST OF FIGURES
Figure 1. Number of clones sequenced and primers developed for each library. 39
(A) Total number of sequenced clones, including those containing unique microsatellites, redundant sequences, and those not used for primer design. 39 (B) Total number of primers designed, including polymorphic and monomorphic
primers, polymorphic primers with high molecular weight amplicons, those polymorphic only between C. berlandieri and quinoa, and primers with poor
or no amplification. 39 Figure 2. Histogram showing number and heterozygosity (H) values of polymorphic markers by repeat length. 40 Figure 3. Linkage maps. 44
(A) Population 1. 44 (B) Population 40. 45 (C) Integrated map. 46
Figure 4. Comparison of loci linked to the BSP locus (BSPL) (Ricks 2005) in LG 11 of the Maughan et al. (2004) map and linkage group (LG) 1 of the integrated map reported herein. 49

x
LIST OF TABLES
Table 1. Quinoa microsatellite marker name, primary motif, complexity, type, primer sequences, expected PCR product size (PRO), observed number of alleles (ONA), and heterozygosity value (H). 31 Table 2. Significant database sequence homologies to microsatellite-containing clones for which primers were designed, including E-value, nucleotide and/or protein homology match, organism match, and GenBank accession number, as identified through BLASTN and BLASTX searches. 41 Table 3. Skewed markers scored and mapped in Populations 1 and 40. 47
(A) Name and parental direction of skewed markers scored in
Populations 1 and 40. 47 (B) Number, linkage group location, and parental direction of skewed
markers for Populations 1 and Population 40 . 48 Table 4. Potentially homoeologous loci and linkage groups (LG) in the Population 1, Population 40 and inegrated map, as indicated by a single primer set amplifying two segregating loci. 50

1
Chapter 1: SIMPLE SEQUNCE REPEAT DEVELOPMENT, POLYMORPHISM AND
GENETIC MAPPING IN QUINOA (CHENOPODIUM QUINOA WILLD.)

2
Introduction Quinoa (Chenopodium quinoa Willd.) is an allotetraploid (2n = 4x= 36) that shows
amphidiploid inheritance for most qualitative traits (Simmonds 1971; Risi and Galwey
1984; Ward 2000). It is an important South American cereal crop that recently has
gained international attention for the high nutritional value of its grain. Grown primarily
in the Altiplano regions of Bolivia, Ecuador, Chile, and Peru, quinoa has served as an
important staple crop for subsistence farmers for thousands of years (Pearsall 1992;
Wilson 1988, Maughan et al. 2004). It is well-suited as a staple crop in the Altiplano due
to its high protein content (7.5-22.1%) (Tapia et al. 1979) as well as its ability to grow in
the harsh environments that characterize much of the Altiplano, specifically high altitudes
(up to 4000 m), frequent frosts, and saline soils (Risi and Galwey 1984; Vacher 1998;
Prado et al. 2000; Jacobsen et al. 2003; Maughan et al. 2004).
Despite its many desirable nutritional characteristics, however, quinoa is plagued
by a number of biotic stressors. Serious quinoa diseases include bacterial stem rot and
downy mildew (Danielsen et al. 2003). Quinoa is also affected by avian, arthropod, and
nematode pests (Rasmussen et al. 2003; Franco 2003), all of which reduce grain yields.
Thus, a major breeding objective for quinoa includes the development of disease-
resistant, high-yielding varieties. Unlike the other major cereal crops which have
benefited greatly from modern plant breeding techniques and genetic research, genetic
improvement of quinoa has in large part been neglected. Indeed, it has been in just the
last five years that dedicated breeding programs for quinoa have been established.
Essential to these improvement programs is the development of molecular tools,
including genetic markers and genetic maps (Mason et al. 2005).

3
Genetic markers are essential tools for modern plant breeding research programs
(Staub et al. 1996). They are particularly important for germplasm conservation and
core-collection development (Diwan et al. 1995; Tanksley and McCouch 1997), as well
as in enhanced breeding applications, such as marker assisted selection. Crucial to all of
these marker applications is the development of highly informative, easily transferable,
and reliable genetic markers. The first step towards the development of genetic markers
for quinoa was made by Mason et al. (2005) who reported the development of 208
microsatellite, or simple sequence repeat (SSR), markers. These markers have already
been utilized to assess the genetic diversity among quinoa accessions within the USDA
collection (Christensen 2005) and efforts to genetically characterize Andean and Chilean
germplasm is currently underway. Unfortunately, of the 208 SSR markers identified by
Mason et al. (2005), only 67 were considered highly polymorphic (H>0.7) – highlighting
the need for additional marker development.
The first genetic linkage map of quinoa was reported by Maughan et al. (2004).
This map, which covered an estimated 60% of the genome, was based primarily on
amplified fragment length polymorphisms (AFLPs) since relatively few sequence-based
(e.g., SSR) markers were available. Unfortunately, the difficulties associated with AFLP
marker technologies and the associated transfer of this technology to developing world
countries where quinoa is cultivated have limited the utility of this map and the
development of MAS strategies within quinoa improvement program. Here we report the
generation of a second-generation map based primarily on easily-transferable and reliable
SSR markers. Specifically, the objectives of this study were: (i) develop a new set of
polymorphic SSR markers to augment the number of SSR markers available in quinoa,

4
and (ii) construct a new genetic linkage map of quinoa based primarily on the SSRs
described here and by Mason et al. (2005) using two immortalized recombinant-inbred
line (RIL) populations.
Materials and Methods
Plant material
For SSR development and characterization, seeds from 22 quinoa accessions representing
the geographical distribution of cultivated quinoa were kindly provided by Angel Mujica,
National University of the Altiplano, Puno, Peru, and Alejandro Bonifacio, PROINPA,
La Paz, Bolivia. Seeds from control species pitseed goosefoot (Chenopodium berlandieri
Moq.; PI 595315) were kindly provided by David Brenner (USDA, Chenopodium
curator, Ames, Iowa).
For genetic map construction, two RIL populations were developed (designated
Population 1 and Population 40). Population 1 consists of 82 F6 plants from a cross of
‘Ku-2’ (Chilean coastal ecotype) and ‘0654’ (Peruvian Altiplano ecotypes), while
population 40 is from a cross between ‘NL-6’ (Chilean coastal ecotype) and ‘Chucapaca’
(Bolivian Altiplano ecotype) and consists of 85 F7 plants. Both RIL populations were
produced by self-fertilizing a single F1 plant and allowing plants of subsequent
generations to self-fertilize.
All plants were greenhouse grown in Provo, Utah, USA in 15 cm (6 in) pots using
Sunshine Mix II (Sun Grow, Inc., Bellevue, WA) and were supplemented with nitrogen
fertilizer. Plants were maintained at 25°C under broad-spectrum halogen lamps with a
12-h photoperiod.

5
DNA extraction
Genomic DNA from all plants was extracted from 30 mg freeze-dried leaf tissue
following procedures described by Sambrook et al. (1989), with modifications described
by Todd and Vodkin (1996).
SSR discovery and analysis
SSR markers were developed from two sources: enriched SSR libraries and from BAC
end sequences from a BAC library reported by Steven et al. (2006). Enriched libraries
for GA, CAA, and AAT repeats were produced by Genomic Identification Services, Inc.
(Chatsworth, CA) using genomic DNA from the Bolivian Altiplano ecotype ‘Surimi’
according to protocol described by Mason et al. (2005). Libraries were plated in S-gal
media (Sigma-Aldrich, Inc., Saint Louis, MO) supplemented with 50 mg/l ampicillin, for
blue-white detection of recombinant clones. Recombinant clones were sequenced bi-
directionally using M13 forward (5’ GTA AAA CGA CGG CCA GT) and M13 reverse
(5’ CAG GAA ACA GCT ATG AC) primers at the Arizona Genomics Institute (Tucson,
AZ) using standard ABI Prism Taq dye terminator cycle sequencing methodologies. The
computer program Contig Express (InforMax, Inc., Frederick, MD) was used to
determine consensus sequences, eliminate redundant clones, and identify simple
sequence repeats.
Primers flanking each unique SSR were designed using the web-based computer
program Primer3 version 2.0 (Rozen and Skaletsky 2000) according to the program’s
default parameters. Oligonucleotide primers were synthesized by Integrated DNA
Technologies, Inc. (Iowa City, IA). All primers were screened on a panel of eight DNAs

6
including seven quinoa and one pitseed goosefoot accession. This panel was used to
eliminate monomorphic primer pairs or primer pairs that failed to amplify. Primers that
were successfully amplified on this panel and showed a simple amplification pattern were
subsequently run on a full panel consisting of the 22 quinoa and one pitseed goosefoot
control accession. All data analysis, including calculation of heterozygosity values, was
performed using data obtained from this full panel. Pitseed goosefoot was included to
assess the extent of cross-species amplification of the SSR primers.
SSR primers developed from the quinoa BAC-end sequences (BES-SSRs) were
identified using the web-based computer program Tandem Repeats Finder (Benson
1999). Only repeat sequences with repeat length greater than 20 bp (n=10 for
dinucleotides; n=7 for trinucleotides, etc.) were selected for primer design using the
program Primer3 version 2.0 (Rozen and Skaletsky 2000) as described previously.
PCR amplifications of the SSRs were performed in 10-μl PCR reactions
containing 30 ng genomic DNA, 0.2 mM of each dNTP, 2.5 mM MgCl2, 1X PCR buffer,
0.1 mM cresol red and 2% (w/v) sucrose, 0.5U JumpStart Taq polymerase (Sigma-
Aldrich, Inc., Saint Louis, MO), 1.0 µM forward primer, and 1.0 µM reverse primer.
Thermal cycling profiles was as follows: 94°C for 60 s, followed by 19 cycles of 94°C
for 60 s, 64°C for 30 s (decreasing 0.5°C every cycle), 72°C for 60 s; 30 cycles of 94°C
for 60 s, 55°C for 60 s, 72°C for 60 s, followed by a final extension at 72°C for 10 m.
PCR products were separated on 3% Metaphor agarose gels (Cambrex Bio Science, Inc.,
East Rutherford, NJ) at 120V for 4-5 h. All gels were run in 0.5X TBE and were
visualized using ethidium bromide staining with UV transillumination.

7
Data analysis
The information content for each new SSR was described using the heterozygosity (H)
value. In a multiallele system, heterozygosity values estimate the probability that any
two individuals taken at random from a population will be polymorphic and is
determined using the following equation:
where Pi is the frequency of the ith allele and k is the number of alleles (Nei 1978).
Additional markers
Amplified Fragment Length Polymorphisms. To increase the number of markers on the
map, AFLP analysis was performed on Population 1 following procedures described by
Vos et al. (1995), with minor modifications for quinoa as described by Maughan et al.
(2004). Further modifications included a selective amplification protocol consisting of
94°C for 60 s, followed by 13 cycles of 94°C for 30 s, 65°C for 30 s, and 72°C for 60 s.
The annealing temperatures were lowered 0.7°C for each of the 12 cycles, followed by 23
cycles of 94°C for 30 s, 56°C for 30 s, and 72°C for 60 s.
Nucleolar Organizing Region (NOR) mapping. Maughan et al. (2006) recently reported
the cloning and sequencing of the intergenic spacer (IGS) region of the 45S NOR in
quinoa. Sequence analysis of the parents of population 1 revealed a 43-bp indel
polymorphism - present in ‘Ku-2’ (GenBank # DQ187958) and deleted in ‘0654’
(DQ187960). Segregation analysis of the NOR was performed using standard PCR (as
k
H = 1 - ∑ Pi2
i=1

8
described above) with primers flanking the indel (5’ TTT GAA ACC ATA ACA CAC
CTA TAA AG and 5’ TGG TCC AAA GAA TGG GTA TTT). PCR products were
resolved on 1.4% agarose.
11S seed protein mapping. The isolation of two BAC clones containing homologs of the
11S seed storage protein gene was recently reported in quinoa (Stevens et al. 2006). Two
11S loci (11S_77L9, 11S_164F2), presumably from each of quinoa’s subgenomes, were
isolated and sequenced (Balzotti, personal communication).
Sequence analysis of 11S_77L9 revealed a polymorphism between ‘Ku-2’ and
‘0654’ in a DraI restriction site, allowing for mapping of the polymorphism in Population
1 using a standard cleaved amplified polymorphic sequence (CAPS) assay (Konieczny
and Ausubel 1993). Briefly, DNA from the parents and the RIL population was
amplified in a 10-μl reaction containing 30 ng genomic DNA, 0.2 mM of each dNTP, 2.5
mM MgCl2, 1X PCR buffer, 0.1 mM cresol red and 2% (w/v) sucrose, 0.125U JumpStart
Taq polymerase, 0.5 mM forward primer (5’ ACA ACA CCG GAA ATG AGC CT), and
0.5 mM reverse primer (5’ CCA CTG AAT ACG TTG CCG C). PCR conditions were as
follows: 95°C for 5 m; 40 cycles of 95°C for 30 s, 65°C for 30 s, and 72°C for 30s;
followed by a hold at 72°C for 7 m. The PCR product was brought up to a volume of 20
μl with water, 1X Tango buffer (Fermentas, Hanover, MD) and 5U DraI restriction
endonuclease (Fermentas, Hanover, MD), and was incubated at 37°C for a minimum of 2
h. Restriction fragments were size-separated on 1% agarose at 150V for 2 h, and were
visualized using ethidium bromide staining with UV transillumination.

9
Sequence analysis of 11S_164F2 revealed no polymorphisms between ‘Ku-2’ and
‘0654’ in a common restriction enzyme site; thus, a Taqman allelic discrimination assay
(Perkin Elmer Biosystems) was used to map this locus. The allelic discrimination
reactions were performed using Applied Biosystems (Foster City, CA) PCR Supermix
according to the manufacturer’s protocol. The final reaction consisted of 30 ng of quinoa
genomic DNA, 0.4 µM forward (5’ GCG CTT TTT CCA ATA TTA GAC TCA A) and
reverse (5’ TGT TGA AGT TGG TAC GTA AGC ATC A) primers, 0.2 µM of each
discrimination probe (5’ TTG TTT GCT ACA TTC A; 5’ TAT TGT TTG ATA CAT
TCA AT) and a 1X concentration of the PCR Supermix, which includes an internal ROX
standard dye. PCR amplifications were carried out on an ABI 7300 RT-thermocycler
using the following thermal cycling conditions: 50°C for 2 min, 95°C for 10 min, 40
cycles of 95°C for 15 s and 60°C for 60 s. The analysis of the allelic discrimination
assays was performed using the SDS v2.0 software (Applied Biosystems, Foster City,
CA). Genotype calls for each accession were determined by inspecting the plot of the
fluorescence signals (standardized with ROX values) from each of the allelic
discrimination probes (VIC vs. FAM) generated from the post-PCR fluorescence reads
(end-point analysis). Fluorescence of only the FAM probe or only the VIC probe
indicated homozygosity for a particular allele while intermediate fluorescence from both
reporters indicated heterozygosity at the locus. DNA samples with allelic genotypes,
verified via sequencing, were utilized as internal standards to validate each TaqMan SNP
assay.

10
Others. A SNP (S01C15) was analyzed on Population 1 using a standard CAPS assay.
The betalain color locus (scored as stem color) was also analyzed on both populations.
Map construction
For map construction, markers were scored as codominant (as was the case with a
majority of the SSR markers) or dominant (majority of the AFLP markers). Marker
segregation was analyzed for conformation to Mendelian ratios expected in RILs using a
chi-square test, with two and one degrees of freedom for codominant and dominant
markers, respectively. Linkage groups were constructed with a minimum LOD score of
3.0 using the default mapping parameters (LOD>1.0, recombination threshold = 0.4,
ripple value = 1, jump threshold = 5, Kosambi mapping function) of the computer
program JoinMap, version 3.0 (van Ooijen and Voorrips 2001). Linkage groups from the
two different populations that shared at least one common marker were combined using
the “Combine groups for map integration” function of JoinMap (Stam 1993).
Results and Discussion
SSR discovery and analysis
Here we report the results of libraries enriched for GA, CAA and AAT. These particular
libraries were chosen based on results reported by Mason et al. (2005) that suggested that
the quinoa genome contains high frequencies of GA, CAA, and AAT repeats. A total of
1172 clones were sequenced, including 490 clones from each of the GA and CAA
libraries and 192 clones from the AAT library. A total of 436 (37%) clones were
identified that contained unique SSR sequences, of which 402 were suitable for primer

11
design (178, 85, and 139 from the GA, AAT, and CAA libraries, respectively) (Fig 1a).
As expected from the enriched libraries, the most common repeats observed in the study
were GA (49%), CAA (35.6%), and AAT (12.9%). Other repeat motifs, including CA,
CGA, GAA and GGT, were also observed, albeit infrequently. Of the 402 SSRs tested,
216 (54%) were polymorphic when tested on the screening panel of seven quinoa
accessions (Fig. 1b). An additional 19 (4.7%) were polymorphic when the pitseed
goosefoot accession was included in the analysis (interspecies polymorphism). The
remaining primers (165) were monomorphic or amplified poorly. In only nine cases did
a primer successfully amplify in quinoa but not in pitseed goosefoot, suggesting that
these two Chenopodium species share a high degree of DNA sequence homology.
Indeed, gene flow between quinoa and pitseed goosefoot has been reported previously
(Wilson and Manhart 1993). Most polymorphic markers had repeat lengths of greater
than 20 bp (Fig. 2), confirming the conclusions of Mason et al. (2005) who suggested that
the future development of SSR markers in quinoa should focus on the identification of
markers with repeat lengths of >20 bp in order to maximize polymorphism (H values).
All 216 polymorphic SSRs, including 111 dinucleotide, 104 trinucleotide, and one
hexanucleotide repeat, were screened on the larger panel of 22 quinoa accessions and
one pitseed goosefoot accession to determine their polymorphic information content
(heterozygosity values). A total of 888 alleles were observed across all 22 quinoa
samples included in the full panel. The observed number of alleles per SSR ranged from
2 to 13, with an average of 4 alleles per SSR. Heterozygosity (H) values ranged from
0.12 to 0.90, with an average value of 0.56 (Table 1). These values are within the range
observed previously in quinoa (Mason et al. 2005) as well as in related species such as

12
sugar beet (Cureton et al. 2002, Rae et al. 2000). According to Ott (1992), a marker is
considered polymorphic if H ≥ 0.10 and highly polymorphic if H ≥ 0.70. Based on these
criteria, all 216 markers identified are considered polymorphic, and 53 (25%) are
considered highly polymorphic (H ≥ 0.70).
Sequence homology analysis was conducted for clones for which primers were
designed. BLASTN and BLASTX searches identified 41 sequenced clones with
significant homology (E<0.0001) to sequences in the GenBank databases (Table 2).
Seven clones showed homology to known sequences at the nucleotide level only, while
32 showed significant homology (E<0.0001) to known sequences at the amino acid level
only. Two sequences showed homology at both the nucleotide and amino acid level.
Hits to annotated gene and protein sequences on GenBank included SotA gene; an alpha
zein gene of Zea mays; proteins involved in developmental processes including a putative
C2H2 type zinc finger protein, a Circadian-clock associated protein, and proteins
involved in defense responses and protection including Nim1 (non-inducible immunity-
like protein). Metabolic proteins including isocitrate dehydrogenase, succinyl CoA
synthetase, succinyl CoA ligase, phosphoenolpyruvate carboxylase kinase, beta-amylase,
and oligosaccharyl transferase were also identified. Homologies with GeneBank
sequences were most often identified with Arabidopsis thaliana and rice (Oryza sativa
L.).
SSR marker analysis
Population 1. A total of 424 SSR primers were screened on the parents of Population 1.
Analysis on the entire population revealed 203 primers that were polymorphic and easily

13
scored, while the rest were either not segregating in the population or were too
ambiguous to score. The 203 polymorphic primers amplified 213 segregating loci, a
result of 193 primers amplifying one locus each, and 10 primers each amplifying two
loci. Quinoa is an allotetraploid and it is likely that the second band amplified in these 10
primers represents amplification products from homoeologous loci from the two
subgenomes of quinoa. Of the total marker loci scored, 190 (89%) loci were scored in a
codominant fashion, while 23 (11%) were scored as dominant. Of the dominant loci, 14
were specific to ‘Ku-2’ and nine were specific to ‘0654’. Sixteen markers (7.5%)
deviated significantly (P<0.05) from the expected 1:1 segregation ratio, eight (3.8%) of
which were highly significant (P<0.01; Table 3a). Approximately 15 SSR primers
displayed complex banding patterns when amplified in this population, as well as in
Population 40. This was previously observed in quinoa (Maughan et al. 2004) and is
likely caused by duplicate chromosome regions in the allotetraploid quinoa genome (Rae
et al. 2000).
Population 40. Population 40 was used in an effort to increase the total number of
markers placed within the genetic map. Thus, the same 424 SSR primers were screened
on the parents (‘Chucapaca’ and ‘NL-6’) of Population 40; however, only those primers
uniquely polymorphic to Population 40, as well as a small set of common (anchor)
markers, were chosen for analysis on the entire population. In total, 82 SSRs were
polymorphic and easily scored in the population. The 82 polymorphic SSRs amplified a
total of 84 polymorphic loci, again a likely result of two primers each amplifying
homoeologous loci. Thirty-seven of the 84 loci are uniquely polymorphic to Population

14
40, while the remaining 47 were used as anchor markers for cross-population map
integration. Seventy-eight (93%) markers were scored in a codominant fashion, while six
(7%) were scored as dominant loci. Four of the dominant loci were specific to
‘Chucapaca’, while two were specific to ‘NL-6’. Twenty-seven markers (32%) deviated
significantly (P<0.05) from expected segregation values, twenty-one (25%) of which
were highly significant (P<0.01; Table 3a). Eighteen BES-SSRs were also screened on
the parents of Population 40, six of which were polymorphic and easily scored on the
entire population. All of the BES-SSRs were scored as codominant loci, and none of
them showed distorted segregation.
AFLP, 11S, NOR and morphological markers
AFLP analysis was conducted only on Population 1. Twenty-four primer combinations
were chosen based on their previously demonstrated ability to amplify polymorphic loci
(Maughan et al. 2004). A total of 81 polymorphic, easily-scored loci were amplified
from the 24 AFLP primer combinations. The number of polymorphic loci per primer
combination varied from one to nine, with an average of 3.4. Of the 81 scored
polymorphic loci, 79 were dominant, and two were codominant. Thirty-one (39%) of the
dominant loci were specific to ‘Ku-2’, while 48 (61%) were specific to ‘0654’. An
unusually high number of AFLP markers showed distorted segregation; 15 and 7 markers
were significant at P<0.05 and P<0.01, respectively (Table 3a).
Five additional morphological and DNA markers were analyzed for Population 1,
including: the betalain color locus (scored as stem color), two 11S seed storage protein
loci, the NOR, and a SNP marker (S01C15; GenBank # CN782051). While

15
heterozygotes for the color locus could not be distinguished, all loci, except the betalain
color locus, were scored in a codominant fashion, and none showed distorted segregation.
Linkage analysis and map construction
Population 1. A total of 299 loci were included in the linkage analysis of Population 1;
275 (92%) of these loci mapped at a minimum LOD of 3.0, including 200 (94%) SSR, 70
(86%) AFLP, and all five additional markers (11S loci, NOR locus, betalain color locus,
and SNP). The resulting map (Fig. 3a) consists of 41 linkage groups covering 913 cM, or
approximately 54% of the predicted 1700-cM quinoa genome (Maughan et al. 2004).
Linkage groups (LGs) were numbered based on the number of markers, with LG 1
containing the most markers (41). Linkage group lengths vary from a high of 86 cM (LG
1) to a low of 0 cM (LGs 39, 40, and 41). The largest interval between two linked
markers is 22 cM on LG 21, and the average distance between all loci is 3.32 cM/marker.
Most intervals (88%) are <10 cM and 85% of intervals between SSRs markers are <10
cM. The largest gap between SSR markers is 25 cM on LG 20, with an average gap
between SSR markers of 4.6 cM.
Population 40. A total of 91 loci were included in the linkage analysis of Population 40;
68 (75%) markers mapped at a minimum LOD of 3.0, including all six BES-SSRs. The
betalain color locus did not map in Population 40. The resulting map (Fig. 3b) consists of
20 LGs covering 353 cM, or an estimated 21% of the entire quinoa genome. LG 1
contains the most markers (12) and spans the longest distance (72 cM), while eight
different LGs each contain only 2 markers, two of which cosegregated. Markers are

16
spaced at an average of 5.2 cM/marker, with the largest interval being 25 cM on LG 7.
Sixty-nine percent of all intervals are <10 cM.
Skewed markers
The high number of skewed markers in this study (particularly in Population 40), was
not observed in the AFLP linkage map constructed by Maughan et al. 2004, but has been
observed in other plant studies using both inter- and intraspecific crosses (for a review,
see Jenczewski et al. 1997). Segregation distortion of markers has been reported as a
result of random chance or as the result of linkage disequilibrium with genes that
ultimately reduce viability of the gamete and/or zygote (Zamir and Tadmor 1986). Of the
22 skewed markers that mapped in Population 1, 15 are skewed toward ‘Ku-2’, while
seven are skewed toward ‘0654’ (Table 3b). Eleven skewed markers mapped to LG 1 of
Population 1, seven of which are skewed toward ‘Ku-2’. Six of these seven markers are
localized to the first 34 cM on the LG. All four markers skewed toward ‘0654’ are
AFLPs, and are localized to a 7 cM region of LG 1. Six of the 22 skewed markers in
Population 1 are localized to a 23 cM interval on LG 13; all six markers are skewed
toward ‘Ku-2’. All skewed markers in Population 1 mapped to a total of six different
LGs. While some linkage groups contained only one skewed marker, the presence of
clusters of markers skewed to one parent or the other is suggestive of chromosomal
regions containing possible gametophytic factors (Lu et al. 2002). Alternatively, these
skewed chromosomal regions, such as those on LGs 1 and 13, may be associated with
QTL conferring a selective advantage under the particular greenhouse growing conditions
utilized to produce the RIL populations – we note that some (approximately 10%) of the

17
lines were lost during the population development process. A better understanding of the
cause of these skewed regions will require further studies. We also note that while
segregation distortion is generally believed to be greater in interspecific crosses, reaching
levels as high as 68.5% (Paterson et al. 1988), levels can also be high in intraspecific
crosses. For example, Hall and Willis (2005) observed similar levels of distortion (near
50%) in both interspecific and intraspecific crosses, an observation attributed to the high
level of genomic divergence between the parents of the intraspecific cross. Thus, the
extent of segregation distortion appears to be only indirectly related to the type of cross,
and more directly related to the extent of genome divergence between the lines being
crossed. Our populations are the result of crossing highly divergent Altiplano and
Coastal quinoa ecotypes (Mason et al. 2005). Indeed, the parents of Population 1 and
Population 40 have very low similarity coefficients (0.304 and 0.245, respectively)
suggesting a high degree of genome divergence between the parents of both crosses
(Maughan et al. 2004). This high level of genome divergence may also play a role in the
aberrant phenotypes periodically displayed in certain progeny of Population 1 throughout
the inbreeding process. These plants were shorter than normal, with reduced internode
length and thicker leaves with mostly smooth rather than toothed margins. In addition,
they displayed delayed flowering, reduced inflorescence structures, and increased
sterility.
Population 40 contains fewer markers, although a larger percentage showed
segregation distortion. Ten of the 23 skewed markers that mapped in Population 40 are
skewed toward ‘Chucapaca’, while 13 are skewed toward ‘NL-6’ (Table 3b). These 23
skewed markers mapped to 14 different LGs. Four LGs (1, 3, 7, 8) contain three skewed

18
markers, while all other LGs contain fewer than three skewed markers. In this
population, any given marker was significantly skewed if five or more individuals in the
population were heterozygous at that marker locus. Interestingly, of the 23 skewed
markers that mapped in Population 40, 17 (74%) were skewed because they contained
five or more heterozygotes. A significantly high number of heterozygotes has been
observed in other mapping studies. In mapping RFLP loci in an F2 diploid alfalfa
(Medicago sativa L.) population, Brummer et al. (1993) noted that a majority of all
skewed markers had too many heterozygotes. This observation was attributed to the
maximum heterozygosis hypothesis [Demarly (cited in Busbice et al. 1972)] which
asserts that fitness is directly correlated to the number of alleles at a locus. Thus, the high
number of heterozygous loci reported here could be evidence of heterozygote advantage
at particular loci in quinoa. Interestingly, these same loci in Population 1 do not show
excess heterozygosity, suggesting that this phenomenon may be population specific.
Integrated map. Thirty-nine mapped markers were common between Population 1 and
Population 40, and were thus used as anchor markers to integrate portions of the two
maps. Twenty Population 1 LGs shared at least one common marker with 17 different
Population 40 LGs. Five pairs of LGs sharing common markers were unable to be
combined using JoinMap software. The remaining 15 Population 1 LGs sharing common
markers with 13 Population 40 LGs were successfully integrated into 13 new LGs. This
integrated map (Fig. 3c) contains 140 SSR, 48 AFLP, four BES-SSR, one SNP, and one
NOR marker spanning a total of 606 cM. Sixteen markers in the integrated map are
unique to Population 40. Three SSR markers (KGA165, QCA053, QCA117) that

19
grouped with LG 1 in Population 1, but did not map to precise locations in that
population, were able to be more precisely mapped in the integrated map. Linkage
groups were again ordered based on the number of linked markers, with LG 1 containing
47 markers covering 147 cM, and LG 13 containing 3 markers spanning 13 cM. The
average spacing between SSR, AFLP, and all markers is 4.3, 12.6, and 3.1 cM/marker,
respectively. The largest interval between two mapped loci is 16 cM on LGs 4 and 5.
The largest interval between two linked SSR markers and between two linked AFLP
markers is 24 cM and 38 cM, on LGs 5 and 1, respectively. Ninety-two percent of all
intervals are <10 cM, while 88% and 67% of intervals between two linked SSR markers
and between two linked AFLP markers are <10 cM, respectively.
The lack of anchor markers in many of the Population 1 and 40 LGs prevented
their integration; thus, this map clearly does not represent complete genome coverage –
indeed, the integrated map covers only an estimated 37% of the estimated 1700-cM
quinoa genome. However, the map does demonstrate the ability to combine maps of
different populations in quinoa. This allows for the addition of markers polymorphic in
only one of the maps, thus increasing the total number of mapped markers. Furthermore,
an integrated map with more markers can result in higher marker density, as was the case
here. The average marker density of the integrated map was 3.1 cM/marker, compared to
3.3 and 5.2 cM/marker in Populations 1 and 40, respectively. In addition, the average LG
length in the integrated map was 47 cM, compared to 22 and 18 cM in Populations 1 and
40, respectively. Moreover, since lines within both populations have been selfed to near
homozygosity, each line can be propagated eternally without genetic changes. Such
populations are essential for the quinoa research community, since they alleviate the need

20
to develop new mapping populations each time new genetic markers become available.
Indeed, the use of RIL populations for genetic map production achieves greater mapping
resolutions since the breakpoints in RILs are more dense than those that occur in F2
populations (single meiotic events) (Broman 2005). Additionally, since the seed of these
populations are essentially limitless, these populations also lend themselves to qualitative
and quantitative traits loci mapping experiments since replicated field trials can be
analyzed using identical genetic material. The quantitative trait data can then be used to
determine if any molecular markers are closely associated with those traits – an important
first step toward map-based gene cloning.
Conclusions
The major objectives of this project were to increase the number of available SSR
markers and to build the first SSR-based genetic map of quinoa. We report the
development and characterization of 216 new SSRs markers and the development of a
genetic map based primarily on sequence-tagged SSR markers. Compared to the haploid
chromosome number (18) of quinoa, the high number of linkage groups identified in both
populations indicates that many regions of the genome have not been detected and that
additional markers and/or targeted marker development is still needed to coalesce linkage
groups and provide complete coverage of the quinoa genome. One potential method for
coalescing linkage groups into syntenic groups involves the mining of marker-containing
BACs for suitable in situ hybridization markers. These markers, or possibly their BACs
if the latter do not contain dispersed repetitive sequences, can then be hybridized in pairs
with BACs containing markers from other linkage groups directly to quinoa

21
chromosomes using fluorescent in situ hybridization (FISH). Here we report the
development and mapping of several SSR markers derived from BAC-end sequences of a
newly constructed BAC library (Stevens et al. 2006). The development of a physical
map via restriction mapping of BAC-end sequencing should prove invaluable in the
targeted development of genetic markers as well as the integration of future genetic and
physical maps of quinoa (McCouch et al. 2002; Mozo et al. 1999).
The markers, maps, and populations developed here are an important step toward
developing marker-assisted selection (MAS) strategies for important agronomic
characteristics in quinoa. For example, saponins - a bitter antinutritional triterpenoid
compound found on the quinoa seedcoats - is an ideal trait for marker-assisted selection.
The presence of saponin component deters avian predation, but also increases production
costs due to necessary washing steps. Thus, the ability to effectively select for the
presence or absence of saponins is of agronomic importance. We previously identified a
number of markers loosely linked to the bitter saponin production locus (BSPL),
including an AFLP marker (eACAmCTG-135) linked to the BSPL at 9 cM (Ricks 2005).
This same marker was also present in the Maughan et al. (2004) map (LG 11), and was
included in this study as well (Population 1 LG 1, integrated LG 1). Comparison of
markers present on the BSPL LG, LG 11 of the Maughan map, and LG 1 of the
integrated map presented here, revealed several common markers (Fig. 4). The presence
of additional markers on LG 1 of the integrated map should allow for the identification of
a marker more closely linked to the BSPL, thus improving MAS strategies.
Furthermore, the linkage maps reported here can also be used for cytogenetic
studies. Several SSR primers amplified more than one segregating locus; of these, eight

22
amplified two loci that both mapped in Population 1. One of these pairs (QATG087-A,
QATG087-B) mapped to the same linkage group, while all others mapped to different
linkage groups (Table 4). In addition, the two 11S seed storage protein loci each mapped
to different linkage groups. Thus, these linkage groups represent putative homoeologous
chromosomes in the allotetraploid quinoa genome, and in the future may be useful in
cytological analyses and genome evolutionary studies.
The markers and maps presented here will be particularly useful in the developing
regions where quinoa is cultivated. Compared to other marker techniques, SSRs are
relatively inexpensive once they have been developed, highly polymorphic, and easy to
use. SSR markers are easily transferred between laboratories and are highly
reproducible. These characteristics make them especially applicable in developing
countries that may lack the resources required for other marker techniques.

23
References
Benson G (1999) Tandem repeats finder: a program to analyze DNA sequences. Nucleic
Acids Res 27:573–80
Broman KW (2005) The genomes of recombinant inbred lines. Genetics 169:1133--1146
Brummer EC, Bouton JH, Kochert G (1993) Development of an RFLP map in diploid
alfalfa. Theor Appl Genet 86:329--332
Busbice TH, Hill RR, Carnahan HL (1972) Genetics and breeding procedures. In:
Hanson CH, ed. Alfalfa Science and Technology. American Society of Agronomy,
Madison, WI, pp. 283-314
Christensen SA (2005) Assessment of Chenopodium quinoa Willd. genetic diversity in
the USDA and CIP-FAO collections using SSRs and SNPs. Thesis. Brigham Young
University, Provo, UT
Cureton AN, Burns MJ, Ford-Lloyd BV, Newbury HJ (2002) Development of simple
sequence repeat (SSR) markers for the assessment of gene flow between sea beet (Beta
vulgaris ssp. maritima) populations. Mol Ecol Notes 2:402--403
Danielsen S, Bonifacio A, Ames T (2003) Diseases of quinoa (Chenopodium quinoa).
Food Reviews International 19:43--59

24
Diwan N, McIntosh MS, Bauchan GR (1995) Methods of developing a core collection of
annual Medicago species. Theor Appl Genet 90:775–761
Franco J (2003) Parasitic nematodes of quinoa in the Andean region of Bolivia. Food
Reviews International 19:77--85
Hall MC, Willis JH (2005) Transmission ratio distortion in intraspecific hybrids of
Mimulus guttatus: implications for genomic divergence. Genetics 170:375--386
Jacobsen S-E, Mujica A, Jensen CR (2003) The resistance of quinoa (Chenopodium
quinoa Willd.) to adverse abiotic factors. Food Reviews International 19:99--109
Jenczewski E, Gherardi M, Bonnin I, Prosperi JM, Olivieri I, Huguet T (1997) Insight on
segregation distortions in two intraspecific crosses between annual species of Medicago
(Leguminosae). Theor Appl Genet 94:682--691
Konieczny A, Ausubel FM (1993) A procedure for mapping Arabidopsis mutations using
co-dominant ecotype-specific PCR-based markers. Plant J 4:403--410
Lu H, Romero-Severson J, Bernardo R (2002) Chromosomal regions associated with
segregation distortion in maize. Theor Appl Genet 105:622--628

25
Mason SL, Stevens MR, Jellen EN, Bonifacio A, Fairbanks DJ, Coleman CE, McCarty
RR, Rasmussen AG, Maughan PJ (2005) Development and use of microsatellite markers
for germplasm characterization in quinoa (Chenopodium quinoa Willd.). Crop Sci
45:1618--1630
Maughan PJ, Bonifacio A, Jellen EN, Stevens MR, Coleman CE, Ricks M, Mason SL,
Jarvis DE, Gardunia BW, Fairbanks DJ (2004) A genetic linkage map of quinoa
(Chenopodium quinoa) based on AFLP, RAPD, and SSR markers. Theor Appl Genet
109:1188--1195
Maughan PJ, Kolano B, Maluszynska J, Coles ND, Bonifacio A, Rojas Beltran J,
Coleman CE, Stevens MR, Fairbanks DJ, Parkinson SE, Jellen EN (2006) Molecular and
cytological characterization of ribosomal DNAs in Chenopodium quinoa and
Chenopodium berlandieri. Genome, in press
McCouch SR, Teytelman L, Xu Y, Lobos KB, Clare K, Walton M, Fu B, Maghirang R,
Li Z, Xing Y, Zhang Q, Kono I, Yano M, Fjellstrom R, DeClerck G, Schneider D,
Cartinhour S, Ware D, Stein L (2002) Development and mapping of 2240 new SSR
markers for rice (Oryza sativa L.). DNA Res 9:199--207
Mozo T, Dewar K, Dunn P, Ecker JR, Fischer S, Kloska S, Lehrach H, Marra M,
Martienssen R, Meier-Ewert S, Altmann T (1999) A complete BAC-based physical map
of the Arabidopsis thaliana genome. Nature Genetics 22:271--275

26
Nei M (1978) Estimation of average heterozygosity and genetic distance from a small
number of individuals. Genetics 89:583--590
Ooijen JW van, Voorrips RE (2001) JoinMap 3.0, software for the calculation of genetic
linkage maps. Plant Research International, Wageningen
Ott J (1992) Strategies for characterizing highly polymorphic markers in human gene
mapping. Am J Hum Genet 51:283--290
Paterson AH, Lander ES, Hewitt JD, Peterson S, Lincoln SE, Tanksley SD (1988)
Resolution of quantitative trait into Mendelian factors by using a complete linkage map
of restriction fragment length polymorphisms. Nature 335:721--726
Pearsall D (1992). The origins of plant cultivation in South America. In: Cowan CW,
Watson PJ, eds. The Origins of Agriculture. An International Perspective. Washington,
London: Smithsonian Institution Press, pp. 173–205
Prado RE, Boero C, Gallard M, Gonzalez JA (2000) Effect of NaCl on germination,
growth, and soluble sugar content in Chenopodium quinoa Willd. Seeds. Bot Bull Acad
Sci 41:27--34

27
Rae SJ, Aldam C, Dominguez I, Hoebrechts M, Barnes SR, Edwards KJ (2000)
Development and incorporation of microsatellite markers into the linkage map of sugar
beet (Beta vulgaris spp.). Theor Appl Genet 100:1240--1248
Rasmussen C, Lagnaoui A, Esbjerg P (2003) Advances in the knowledge of quinoa pests.
Food Reviews International 19:61--75
Ricks, MD (2005) Genetic mapping of the bitter saponin production locus (BSP locus) in
Chenopodium quinoa Willd. Thesis. Brigham Young University, Provo, UT
Risi J, Galwey NW (1984) The Chenopodium grains of the Andes: Inca crops for modern
agriculture. Adv Appl Biol 10:145--216
Rozen S, Skaletsky HJ (2000) Primer3 on the WWW for general users and for biologist
programmers. In: Krawetz S and Misener S, eds. Bioinformatics methods and protocols:
Methods in molecular biology. Human Press, Totowa, NJ, pp 365--386
Sambrook J, Fritsch EE, Maniatis T (1989) Molecular cloning. A laboratory manual. 2nd
ed. Cold Spring Harbor Laboratory Press, Cld Spring Harbor, NY
Simmonds NW (1971) The breeding system of Chenopodium quinoa. I. Male sterility.
Heredity 27:73--82

28
Stam P (1993) Construction of integrated genetic linkage maps by means of a new
computer package: JOINMAP. The Plant Journal 3:739--744
Staub JE, Serquen FC, Gupta M (1996) Genetic markers, map construction, and their
application in plant breeding. HortScience 31:729–741
Stevens MR, Coleman CE, Parkinson SE, Maughan PJ, Zhang HB, Balzotti MR,
Kooyman DL, Arumuganathan K, Bonifacio A, Fairbanks DJ, Jellen EN, Stevens JJ
(2006) Construction of a quinoa (Chenopodium quinoa Willd.) BAC library and its use in
identifying genes encoding seed storage proteins. Theor Appl Genet 112:1593--1600
Tanksley SD, McCouch SR (1997) Seed bands and molecular maps: unlocking genetic
potential from the wild. Science 277:1063–1066
Tapia M, Gandarillas H, Alandia S, Cardozo A, Mujica R, Ortiz R, Otazu J, Rea J, Salas
B, Zanabria E (1979) Quinua y kañiwa: Cultivos andinos. CIID-IICA. Bogotá, Colombia
Todd JJ, Vodkin LO (1996) Duplications that suppress and deletions that restore
expression from a chalcone synthase multigene family. Plant Cell 8:687--699
Vacher JJ (1998) Responses of two main Andean crops, quinoa (Chenopodium quinoa
Willd.) and papa amarga (Solanum juzepezukii Buk.) to drought on the Bolivian
Altiplano: Significance of local adaption. Agric Ecosyst Environ 68:99--108

29
Vos P, Hogers R, Bleeker R, Reijans M, Van de Le T, Hornes M, Frijters A, Pot J,
Peleman J, Kuiper M, Zabeau M (1995) AFLP: a new technique for DNA fingerprinting.
Nucleic Acids Res 23:4407–4414
Ward SM (2000) Allotetraploid segregation for single-gene morphological characters in
quinoa (Chenopodium quinoa Willd). Euphytica 116:11--16
Wilson HD (1988) Quinoa biosystematics I: Domesticated populations. Econ Bot
42:461–477
Wilson H, Manhart J (1993) Crop/weed gene flow: Chenopodium quinoa Willd. and C.
berlandieri Moq. Theor Appl Genet 86:642--648
Zamir D, Tadmor Y (1986) Unequal segregation of nuclear genes in plants. Bot Gaz
147:355--358

30
Chapter 2: TABLES AND FIGURES

31
Table 1. Quinoa microsatellite marker name, primary motif, complexity, type, primer sequences, expected PCR product size (PRO), observed number of alleles (ONA), and heterozygosity value (H).
Marker name Primary motif Complexity Type Forward primer (5'-3') Reverse primer (5'-3') PRO ONA H KAAT001 (ATT)5GTT(ATT)3GTT(ATT)13 Simple Imperfect tggctatatcatatgcgtaatgtg gggctcagattgtatctcgac 176 6 0.79 KAAT004 (TAA)14 Simple Perfect gtgcagctgctcacatcttc tggcaataatagtttaggttgtgtg 198 5 0.56 KAAT005 (ATT)6(GTT)7(ATT)6(GTT)19(ATT)24 Compound Perfect caccactcaagcaatccaaa gtgggagcccagattgtatc 293 4 0.57 KAAT006 (ATT)10(GTT)7(ATT)3 Compound Perfect tctgcaggatcggtaacctt ttgtatctcggcttcccact 171 6 0.79 KAAT007 (AAT)30 Simple Perfect aggtacaggcgcaaggatac cggtagcatagcacagaacg 197 12 0.86 KAAT008 (ATT)27TGG(ATT)1ATG(ATT)3 Simple Imperfect aggaacaactcgaagccaag aaaggtgtgatcaagcaataacaa 177 7 0.73 KAAT009 (ATT)10 Simple Perfect agttgccaacatgcagagc cgacgacgcaagacattaga 212 5 0.77 KAAT010 (AAT)16 Simple Perfect cggctctccactaacttcttg atgtctttcgcctacccaaa 182 5 0.68 KAAT011 (AAT)17 Simple Perfect tttcagcaggatcgggttc agccgaccagagcagtgtag 184 8 0.73 KAAT014 (ATT)10 Simple Perfect cgctgacgcttaacattcg cacaaacaataattcaaccgaaga 191 3 0.45 KAAT016 (TAA)13 Simple Perfect gagcccgtgctacaactcat ctgggcagagcagaacagat 186 5 0.57 KAAT018 (ATT)11 Simple Perfect gcaccaacctgagtcctagc cgtgtcgctgctcatattgt 193 4 0.60 KAAT019 (ATT)10(ATC)5(ATT)3 Compound Perfect ctgcaaagcaaagtccatga cttcagtaggatcgggttcg 196 5 0.60 KAAT020 (ATT)14 Simple Perfect gcctttattattgttcatttatttgtt aggagtgggacccatattgt 199 4 0.57 KAAT021 (AAT)21TAA(AAT)4AA(CAA)3TAA(CAA)(TAA)2 Compound Imperfect cggctccctaccaatttctt gcccaatggtctttgacact 199 5 0.64 KAAT022 (ATT)12 Simple Perfect cgggcagaaacatttaccaa gcggctgctcacatcttta 199 5 0.66 KAAT023 (AAT)19A(AAT)13 Simple Imperfect agattgtatctcggctttcca cacttcattgtattgcatttagga 225 7 0.74 KAAT024 (AAT)28 Simple Perfect cctaatgccacggtttccta ccgctgaatagacacccagt 199 6 0.78 KAAT025 (AAT)14 Simple Perfect gagtgggagcccagattgta agcaaagtaaatttcaacaaagca 160 2 0.34 KAAT026 (ATT)16 Simple Perfect cggagtcagatggttctggt tcaagtgcagctcaatcacc 178 3 0.55 KAAT027 (ATT)12 Simple Perfect tttaaactttattgacccttggaaa ggatgctattgcattgctga 180 3 0.55 KAAT030 (ATT)2GCT(ATT)13AT(ATT)1 Simple Imperfect tcaaatatgtgtggaccactctaag ccaatttcttgtaaattgattgactt 199 4 0.69 KAAT031 (ATT)9 Simple Perfect agagaccaatgccggataga gttcgctatagctagaggagtgg 200 6 0.77 KAAT033 (ATT)18 Simple Perfect tgccaactgacgagacaaag gcgggagctcatatcttcac 200 5 0.62 KAAT034 (ATT)4ACT(ATT)12 Simple Imperfect aaagcaatcgaagcgttgtt ttcgggtttgatgccataat 247 9 0.73 KAAT036 (ATT)18 Simple Perfect ggcagcgatcgtgaaata gggacccaaattgtatctcg 175 6 0.70
KAAT037 AA(TAA)2(CAA)1(TAA)2TAT(TAA)1TAGTAT (TAA)1TAG(TAA)19(CAA)3(TAA)1(CAA)1(TAA)2 Compound Imperfect tcaacctccgaatcctatcaa ggatgctgattggtggataaa 284 13 0.90
KAAT038 (AAT)14 Simple Perfect ccttctctgctctgctatgctt agcctagtgtcttgcgtcgt 363 6 0.64
KAAT039 (TTA)17(CTA)4TTGATAATG(TTA)10TCAAT (GTT)5(ATT)4 Compound Imperfect agccgagcagagcagattt tgcggttgtagtcatttgaa 297 10 0.84

32
Table 1. Continued.
Marker name Primary motif Complexity Type Forward primer (5'-3') Reverse primer (5'-3') PRO ONA H
KAAT040 (AAT)2AAC(AAT)7 Simple Imperfect gcatgagtggtaatggagga cttgaaggagcagtattattcaca 166 6 0.79 KAAT041 (ATT)13AG(TAT)4TAG(TAT)5TG(TTA)5TT Compound Imperfect tgggacttccataaggcaac atattgcatgtcgagcacca 182 10 0.86 KAAT042 (ATT)33 Simple Perfect tgaatcaaatagctttcatacattcaa tatgttggcttcccaccaat 197 8 0.76 KAAT043 (AAT)24 Simple Perfect ggctcccactaatttcttgtg tcatgcggcttgagtagttt 199 5 0.76 KAAT044 (AAT)11GCGATG(ATA)11ATGCG(ATA)4GT(AAT)20 Compound Imperfect gggtggaggcccagattat cagagcagagctggcagag 272 7 0.81 KAAT045 (AAT)15 Simple Perfect cacattgtatctcggctttcc cagatgcattgaccttcgtg 200 9 0.75 KAAT047 (AAT)26 Simple Perfect tctcggttccctactaatttcttg tttatgcagcaagggttgtaaa 192 9 0.81 KAAT048 (ATT)14 Simple Perfect aaccgtgtcgtgcctaagac ccagtgtgcaccaatgtagc 178 3 0.32 KAAT049 (CAA)8TAAGAATA(AAT)21 Compound Imperfect cagattgtatcccggcttc tcgagtttcggatttgaatg 151 4 0.45 KAAT050 (ATT)ATG(ATT)9ATC(ATT)6 Simple Imperfect tcatgcctaggatcttgcttt tcgtatacggactaaattgtccac 8 0.76 KCAA002 (CAA)11 Simple Perfect caattcagctcccttgatcc tattgttggtgcgcttgtgt 183 3 0.12
KCAA003 (CAA)7CACCTATAAGAA(CAA)CAT(CAA)CATCTA (CAA)4AAGCATCTG(CAA)2CATCAG(CAA) Simple Imperfect acctttcggctgctcagata tgctgatgttgttgcagatg 179 3 0.53
KCAA005 (CAA)2CAT(CAA)CAG(CAA)9CAT(CAA)6CAT (CAA)3TAT(CAA) Simple Imperfect tcaccgcccaccttactaac gatttgcatgcccttcattt 169 2 0.09
KCAA006 (CAA)TAA(CAA)5CAG(CAA) Simple Imperfect ttgagcaggatgatgtggag ttggagaaacataccttgttgg 161 6 0.83 KCAA009 (ATT)6TT(ATT)8T(ATT)6 Simple Imperfect aatgacgtggaaccctaccc tgctagggaacaatcaaggtg 187 3 0.65 KCAA010 (GGT)CT(GGT)GCTA(GGT)4 Simple Imperfect tgggtcgtagttctgggttc cttatcaccagcagcagcac 191 3 0.66 KCAA011 (ATT)10(GTT)7GTA(GTT)15 Compound Perfect tgaacccgcttcaacaatg ccttcttcaaactccgaatcc 225 9 0.84 KCAA013 (AAT)7(AAC)4AAA(AAC)12 Compound Imperfect cctgtaaattgattgactttgtaggtt gcaaagcacgtaaaccgtct 199 3 0.49 KCAA014 (GTT)12 Simple Perfect gaatttgcatgcccttcatt ccgccctcgctactatgat 170 5 0.68 KCAA015 (GTT)7 Simple Perfect tggttggaggcaaacatacc tgagggtgaagaggaggatg 198 4 0.54 KCAA016 (CAA)15 Simple Perfect cgcggttatttaagggaagg ccaccaggagagctaggttg 188 6 0.50 KCAA019 (GTT)8 Simple Perfect gtagttgggcggatgtgtct gcgactgagctagcaggttt 166 4 0.70 KCAA022 (GAT)4(GTT)12GATCTA(CTT)3 Compound Imperfect ccaattgcatgctcctcatt aatgcaaacatgggaggaga 157 5 0.74 KCAA023 (GTT)2(TGT)3TTT(GTT)3GCT(GTT)2 Compound Imperfect tgctgttgttgttgttgtgc caaatagcaacacggcaataga 193 3 0.52 KCAA026 (CAA)4CAT(CAA)2CAG(CAA)3 Simple Imperfect gacgacgacgataacaacga agccaattcccatcatcaga 191 2 0.29 KCAA027 (ATTGTT)19 Simple Perfect agagcagagccgagtagagc gctcacctaaatcgtatatgcact 172 5 0.68 KCAA028 (GTT)7AT(GTT)1GGT Simple Imperfect ggtcgtcctacacctcttgc cccgcagggtaaccataata 196 2 0.28
KCAA029 (CAA)2CAT(CAA)5AAG(CAA)2CCA(CAA)4CAT(CAA)1 TAA(CAA)2CCA(CAA)2TAA(CAA)2CCA(CAA)4 Simple Imperfect cagactgcaggcaccaca gttgttgtggttgttgttattggt 193 9 0.75
KCAA031 (CAA)19(CGA)2(CAA)11 Compound Perfect ttgtatctcggcttcccact ggcttcagttcattaacagcacta 186 4 0.67 KCAA032 (GTT)8(GAT)2 Compound Perfect cttgtcacatgccaagttgc aacaacaacagcagcaccaa 156 3 0.66

33
Table 1. Continued.
Marker name Primary motif Complexity Type Forward primer (5'-3') Reverse primer (5'-3') PRO ONA H
KCAA033 (GTT)6GT Simple Imperfect ttccatttgggctctcattc aggactcgggtgtcctacct 182 4 0.42
KCAA036 (CAA)7AAATAG(CAA)1CAG(CAA)1CAT(CAA)4CAG (CAA)8TAG(CAA)1CAG(CAA)1(CAC)3(CAA)3TAG (CAG)2(CAA)10
Compound Imperfect ctgctgaccaatggctaggt tcatcatcatcaccatcatcatc 250 8 0.69
KCAA038 (CAA)7TAA(CAA)1(CAT)1CAG(CAA)6(CAT)2(CAA)3 Compound Imperfect caatggtgtgctacccacag gtatggcaagttgcatgctc 181 2 0.21 KCAA041 (GTT)8 Simple Perfect tggtcgtagaccacccattt cggatcactccacccttgta 197 2 0.09 KCAA044 (CAA)3CAG(CAA)4 Simple Imperfect gcaatgagatgcaacgaatg ttgcaaagcctccaaatctt 160 2 0.30 KCAA051 (GTT)14 Simple Perfect catgctcatcatttgctgct gtctttggagcggaatgcta 196 7 0.77 KCAA053 (GTT)8 Simple Perfect ggagtatcctttgttaaattggtctc aggcaaagtccatggaacag 160 2 0.50 KCAA057 (CAA)6(CAT)3(CAA)2CAG(CAA)2 Compound Imperfect tgtgctaccaactgctctgg ttggttctccatcaggctct 187 6 0.79 KCAA058 (CAA)5AA(ACA)6A Compound Imperfect ggcgcaaggaatttgatagt cctgctccttctccatcaag 166 4 0.63 KCAA063 (CAA)9 Simple Perfect tccgatgatgaagaggagga gatttgcaaaccgctcattt 180 3 0.35
KCAA065
(CAA)2CAT(CAA)5AGC(AAC)2CACACCGAC(AAC)3 AATAGT(AAC)2CAC(AAC)2ATGTTGCTATAGCCCT ATTTTGTTGTAGTG(ACA)3TCA(GCA)2(ACA)6ACC (ACA)5A
Compound Imperfect gccatcctagttggcgttt tctgtccattatcaacttcacca 281 8 0.80
KCAA066 (GTT)9ACGGAATTC(GTT)5GAC(GTT)4GGTTTT(GTT)2 (CTT)3(CAT)2(CCT)3(CAT)2 Compound Imperfect aaaccgctcatttgctcact ggcacgttcccaagtcttat 211 2 0.38
KCAA067 (CCA)3(ACA)8AGGATCACGGCA(ACA)5(TCA)2ACTC GACTACCA(ACA)2AA Compound Imperfect atgagggcacagaggatgag gagaggtgttgatgggaaaca 187 3 0.54
KCAA068 (CAA)4AGATAGCAACAGATTCATCAACGCCAGAACC AT(CAA)2CAG(CTG)2ACCAG(AAC)3(AGC)2AACAGC (ACA)2GACCAGCCAACATTA(ACA)7CA
Compound Imperfect cagcaactgaaaccagcaa gcagctgctgttgctaaatac 186 10 0.79
KCAA069 (CAA)9TGCAT(CAA)2 Simple Imperfect tggtggtggagaggaagaac tcatgtgctccatttgcttt 181 3 0.54 KCAA071 (GGT)2(TGT)7TGGTGTCG(TCT)4TCCA(TGT)10T Compound Imperfect tccctgccatatcttgttga acatagcggtggatttggag 191 4 0.56 KCAA078 (CAA)3AAA(CAA)9CATCAC(CAA)3 Simple Imperfect aggcgaggataacatgatcg aagaagccatacctccctcac 170 3 0.51
KCAA083 (GTT)7(AGTT)4ATT(GTT)3(AGTT)4ATT(GTT)3AAGTT TATTT(GTT)3AATTTGTAT(TTG)15TTATTG(TTA)2TG GTTA(TTG)5TTATAATAG(TAT)6
Compound Imperfect tgttgttgttaagtttatttgttgttg ccagaaccctcgatctacataaa 194 2 0.13
KCAA084 (CAA)3AAA(CAA)9GAA(CAA)2TAA(CAA)3CAT (CAA)2CAT(CAA)3 Simple Imperfect gcggaatgcttggaatgtat atgctcaagtctgctcatgc 196 4 0.58
KCAA086 (CAA)4CT(ACA)2C(CAA)3 Compound Imperfect ccctgcgtaaattctctcca gggagctagcatatgggtga 191 3 0.65 KCAA088 (GTT)10CAC(CAT)4 Compound Imperfect tgtgcttgcaaagcctctaa gatgctccgaatgtttggtt 161 5 0.77 KCAA091 (GTT)5(ATT)4GTT(GTTATT)2ATG(GTTATT)2 Compound Imperfect tttgttgttgtcgttgttgttg atattgcatgtcgagcacca 186 4 0.72 KCAA093 (GTT)3GTAGATGTTGAT(GTT)2CTTATAGGT(GTT)7 Simple Imperfect tgctgatgttgttgcagatg acctttcggctgctcagata 179 2 0.43 KCAA095 (GTTGGT)2(GTT)2 Compound Perfect gctggtggagtcgaattgat agccacttccccttctcact 150 4 0.71

34
Table 1. Continued.
Marker name Primary motif Complexity Type Forward primer (5'-3') Reverse primer (5'-3') PRO ONA H
KCAA101 (CAA)7G(GAA)2GG(CAA)4(CAT)2 Compound Imperfect gccatgagagtgtggaggat gggaagcaaacataccttgc 165 4 0.69 KCAA104 (CAA)12CTACTACAACTA(CAA)5 Simple Imperfect caacaacaagtacaacaacatcca cggaaatttcaggcagatgt 232 4 0.73 KCAA105 (CAA)10 Simple Perfect cgaacagcagcaacaataaca cctttagacgccaccgtact 199 2 0.38 KCAA106 (CAA)20CAGCAA(CAT)2 Compound Imperfect atatggaagtcggccaacag gcatgctcatcatttgttgc 153 10 0.83 KCAA107 (CAA)2TAACTAA(CAA)2TAACTAA(CAA)2TAA(CAA)18 Simple Imperfect caccagaaccctcgatctaca tggttactgttgttgttgttaatttg 271 4 0.64 KCAA111 (CAA)2TAA(CAA)4CAC(CAA)6 Simple Imperfect ctcacattgagcccaacaaa ctccaacgggtgcataaatc 156 2 0.45 KCAA112 (CAA)8 Simple Perfect cgttgtcaagtgattcaagacc aaagattggaggctttgaagtaaa 190 3 0.61 KCAA117 (GTT)9 Simple Perfect ccgtggttcctctagagtcg cctccaacaacctttctctcc 154 11 0.72 KCAA118 (GTT)2ACGATT(GTT)7 Simple Imperfect gctgtgtttgacccatgttg caaccacagcaaaggtgtga 159 4 0.45 KCAA120 (GTT)11TTTGTG(GTT)2 Simple Imperfect ccaccaggagagctaggttg cgacgtaccttcccttaaaca 153 2 0.42 KCAA125 (GTT)5(GTC)2TTA(TTC)2CATGTTTTTAT(TG)2(GTT)9 Compound Imperfect ttgcatgctctccatttaagc ggtgcatgaggaggatgact 184 3 0.09 KCAA126 (GTT)8TT(TGT)24(TATTGT)2TGTT Compound Imperfect catattggtgatgttgctcttga cgccctccctactatgatga 166 3 0.52 KCAA130 (GTT)7GT Simple Imperfect gggaagcaaacataccttgc atgagggcacagaggatgag 165 2 0.50
KCAA132 (CAA)2CAT(CAA)5AAG(CAA)2CC(ACA)4TCAG(CAA)5 CC(ACA)3ACCA(CAA)3CATCAGCAA(CAG)3(CAA)5 CC(ACA)4ACCAGGTCCA
Compound Imperfect caaactgcaggcaccaca caacttcaccatacgcattca 220 3 0.64
KCAA133 (CAG)4(CAA)2CAG(CAA)3CAG(CAA)3(CAG)2GAGGA ACAACAG(CAA)4(CAG)3(CAA)2GTTC(AGG)2(ACC)4 AA
Compound Imperfect gcctttagctgttgaaggtgt tgttgttgttgttcctcctga 165 5 0.66
KCAA136 (GTT)5GC(CTT)2TCTT(GTT)6 Compound Imperfect catttgggctctcattgctt ttcgggtgtccttcctaatg 181 6 0.70 KCAA137 (CAA)16AA(ACA)6AAA(ACA)2A Compound Imperfect caatgatgtgctacccaacg ttgctcaaggctactcatgc 178 4 0.71 KCAA139 (CAA)3CG(ACA)6A Compound Imperfect gaacacccaacctgcaaact caacttcaccatacgcattca 180 4 0.59 KCAA141 (CAA)19 Simple Perfect gacgagtggatgtggtgatg accgttgtcattgtcttggtt 171 4 0.51 KCAA143 (GAA)2GG(AGA)4A Compound Imperfect ccagggtgaatcagggaata gggcattaattactctctctctctct 150 2 0.30
KCAA152
(CAA)2(CAC)2ACCAGCCA(CAA)ACACAGCAA(CAG)5 AG(CAA)2CAT(CAA)5AAGAAA(CAA)CCA(CAA)4CAT (CAA)TAAAAA(CAA)CCA(CAA)2CCA(CAA)3C(CAC)3 AACTA(CAA)
Compound Imperfect aacataaagcgccaacctg tcaccatacgcattcattcttt 285 3 0.59
KCAA153 TT(GTT)GATTTT(GTT)5GTCTTCATCTTCCAT(GTT) GAT(GTT)5(GCT)2 Compound Imperfect tgttgggtggcgatcatac ggaagagttccctccgtttc 177 3 0.58
KGA002 (CT)6AT(CT) CC(CT)5 ATCCCC(CT)15 Simple Imperfect aaagaacgcatccttccaat aacctagccaacactccctaaa 193 5 0.51 KGA003 (GA)16 Simple Perfect attgccgacaatgaacgaat atgtaaatggcatgtcccaac 150 5 0.65 KGA006 (GA)16 Simple Perfect aaacaaattctatcattcggttagg gccaacgagcctgatgtaa 175 2 0.38 KGA008 (CT)13 Simple Perfect ctcaaatttctgcctcctga aaatctctgcctctgtgcaa 179 3 0.64

35
Table 1. Continued.
Marker name Primary motif Complexity Type Forward primer (5'-3') Reverse primer (5'-3') PRO ONA H
KGA009 (CT)18AT(AC)4 Compound Imperfect tccaagaccaaaccctctct tgtgtgtatatgagagagagagagaca 154 4 0.66 KGA010 (TC)11 Simple Perfect tgtttcctgcgtccctattc gctgaaggtgaaataggtgga 198 2 0.50 KGA014 (GA)15 Simple Perfect gaccacatgcataaattaatacgact tcgtaggtcgaggatcttgc 165 3 0.44 KGA015 (CT)3AA(CT)11CC(CT)10 Simple Imperfect accagcttgcttgtcttcct ggataaccgctccaatgcta 173 3 0.45 KGA016 (GA)22AA(GA)5 Simple Imperfect ccctgcttaatctccgtgaa ccgaaccaagactacgaaaca 174 3 0.57 KGA019 (GA)3G(GA)33 Simple Imperfect tcaccacctttgcaaacaac cacgagaccaagcctctctt 173 3 0.14 KGA020 (CT)22 Simple Perfect tcacctacctcggtaaaggaaa ggagcagatgatgaacatgg 177 2 0.44 KGA021 (CT)24(GT)(GC)(GT)10 Compound Perfect gacctattaaaggttccgcaca ggtccacacacacacagagc 195 4 0.73 KGA023 (CT)31C(CT)3C(CT)1 Simple Imperfect cacgagaccaagcctctctt tcaccacctttgcaaacaac 171 5 0.68 KGA024 (AG)31 Simple Perfect caagaaggtgttgggatgtgt tgtggaattgtgagcggata 165 3 0.41 KGA025 (CT)22 Simple Perfect gaggtcgtatcatcccgttt gcgagtacaggaggatttgc 170 8 0.54 KGA026 (CA)2CTA(CA)15 Simple Imperfect gtggttcatggctgatcctt caccacccttctggtgaact 250 2 0.39 KGA027 (GA)34 Simple Perfect ttgtacagaggaagtggcaaga catcttacagctctggctttcc 153 6 0.56 KGA030 (CT)14 Simple Perfect tcttgatcccatcttacccaac tcgtggagttgtggttcatc 175 5 0.53 KGA035 (CT)15 Simple Perfect cattgccggacttctgattt ccctgcattgacaagcatta 151 6 0.61 KGA036 (GA)26TA(GA)7 Simple Imperfect cccaaatgtgaggtttcatta ttgcccagaatatgacaagtt 174 3 0.45
KGA037 (GA)7GTAATCA(AG)2AATCTTGAT(GA)2 GTTGGTA(AG)15AT(AG)4A Compound Imperfect tcgaatatggctaggtgtttct cattcaccaattacaaccaattt 200 3 0.58
KGA038 (CT)8TCCCTTCTCGC(CT)3 Simple Imperfect atggacctccaataatcacca gagagagaaagaggagagagaaagtg 150 3 0.56
KGA039 (CT)14T(TC)6CCTCC(CT)7TCCTTTCCCG(CT)3 CAATCTATGT(CT)4 Compound Imperfect tgtttcaccttcccttagcttt tttggttcttaagagggatgc 260 4 0.23
KGA040 (CT)2(TC)14T Compound Imperfect accctcctcctttccacagt ggaacgtcgggtcgagtat 189 6 0.74 KGA041 (GA)20A(AG)11A Simple Imperfect tttggtgcaaatgttgttca ttccaagaccaaaccctctc 225 4 0.63 KGA042 (GA)2A(AG)27A Compound Imperfect ttggtagtgggtaagagaacctg ctccctccagccacataatc 185 4 0.55 KGA044 (GA)4AAG(TA)2CTTAGAT(AG)3C(GA)8 Compound Imperfect taacctgcacagggtgacaa gaaccaattacaacggaaagga 189 2 0.48 KGA046 (GA)23 Simple Perfect tccaacttcagatggatgaaga atcgttggcattctccaaat 187 5 0.70 KGA047 (CT)24 Simple Perfect gcagtgcatgaatttggaca gaagctggcaccttatacatgc 184 3 0.54 KGA048 GACA(GA)38 Simple Imperfect acgtcgaggatggctaggt ccaacaatcatcatcaataccc 199 5 0.74 KGA049 GAGGGAA(AG)17A Simple Imperfect cgagaaaggagccggatatag tttcctcccaacctttctctc 173 4 0.52 KGA050 CTCC(CT)14ATCTAGCTT(TC)4(TA)2CTTCT Compound Imperfect tgctcaaattactaaactaccgaca tcctgagtattgatcgcaagg 157 2 0.39 KGA051 GAA(AG)2A(GA)2GG(GA)22 Compound Imperfect gtgaggaatcagtccggtaca ccaatctggtcaagcacctc 200 4 0.51 KGA052 (CT)14CGTGATGGACTATTT(CT)3 Simple Imperfect tttcttggtgttgattcatttatgtt catctccttctcaaccacagc 175 3 0.56

36
Table 1. Continued.
Marker name Primary motif Complexity Type Forward primer (5'-3') Reverse primer (5'-3') PRO ONA H
KGA053 (GA)13 Simple Perfect aaatttctgcctctgtgcaa ctcaaacttctgcctcctga 182 3 0.48 KGA054 (GA)18 Simple Perfect tgttgattgataatatgtaatggtgga cattcataacagcgagagatgg 193 3 0.33 KGA055 (CT)8T(TC)2GCCC(CT)3 Compound Imperfect cccaacccaccaaacttaca gaaaggaaagtgattgcaaagaa 162 2 0.49 KGA056 (GA)12 Simple Perfect gactaacggtgtccaaactgc ccttctgcattacaccgtca 176 2 0.31 KGA059 (GA)3ATA(AG)7AC(AG)19A Compound Imperfect ataaccactccgatggcaaa cagccacctggcagttaga 195 3 0.61
KGA060 (GA)4GGGA(AG)12GGTAGGCTA(AG)3(GA)2 TATGGAAA(AG)7AA(AG)9A Compound Imperfect agtggagagaacgctggaa tctctcctctcctaggatgctc 177 2 0.36
KGA065 (GA)2AA(AG)31A Compound Imperfect tatatccgacaaggcgacaa tgtaatgttacgagtacatgttcagtt 167 4 0.73 KGA066 (CT)2TCCC(CT)6ATCTCC(CT)6ATCTCC(CT)15 Simple Imperfect aaagaacgcatccttccaat aacctagccaacactccctaaa 195 3 0.38 KGA068 (CT)13 Simple Perfect tcccgctggaattattgtaag aaacgagcttgcatcagaca 200 3 0.56 KGA069 (CT)13TCT Simple Imperfect ggatggtctcttggcacaaa cccgaaagcatattaaccagaa 186 4 0.70 KGA070 (GA)2(AG)2A(AG)11A Compound Imperfect aggttcttggacaaagggaaa tgaaataaatggccgagagg 165 5 0.70 KGA071 (CT)13CA(CT)6CC(CT)10ATTT(CT)4 Simple Imperfect agcatttattacacacacacacaca aatccgggtttaaccattcc 170 3 0.59
KGA073
(GA)2(AG)AT(GA)A(AG)2A(AG)3AA(AG)2ATA AAGAAC(GA)4ACA(AG)2(GA)2ACGACA(GA)2 ACGA(AG)2GA(AAG)2GAAAAC(GA)4(AG)2GA AAGAC(AG)3A
Compound Imperfect tcaatgttggtggtgctgtt aaaccctaagacacgtacaactcc 280 2 0.50
KGA074 (GA)21 Simple Perfect tatatgccaccggaatgtca tgtatccctttgcattctttga 151 2 0.39 KGA079 (TC)19 Simple Perfect gccaacgagcctgatgtaa aaattctatcattcggttaggtaatca 177 3 0.43 KGA080 (AG)14 Simple Perfect ccagggtgaatcagggaata ctggcaggtgggtcttctat 200 2 0.50 KGA082 (CT)12 Simple Perfect cccaccaaattcattcttga aagagggagagggaagaagc 158 3 0.53 KGA083 (AG)28 Simple Perfect aagatggtttgaggtgtgtttc ataaaggcacccgtgataaa 177 4 0.73 KGA086 (AG)2A(AG)7AA(AG)12 Simple Imperfect ccactccgatggtaaagtcaa gtggacaccaaccactagca 193 3 0.55 KGA088 (TC)14 Simple Perfect tgtaaatggcatgtcccaac ttattgccatttcagggattt 198 4 0.53 KGA091 (CT)14C Simple Imperfect tagcaaccagcagaggtcaa tccaaaccaactcacaaacact 153 4 0.54 KGA092 (AG)18A Simple Imperfect agagcagggataaggctgtg gtggtacgtagccatcagca 158 4 0.57 KGA093 (TC)3T(TC)13T Simple Imperfect cctccaagcccaaatcttta tccggatgaagataaagaagga 195 3 0.66 KGA094 (CT)12CC(CT)T(TC)10C(CT)6 Compound Imperfect gacttggtgcctagggtttg ggaaggagagagtgccatga 177 6 0.77 KGA097 (GA)8A(AG)5A Compound Imperfect acgacgctgacatttgtagg tcgtccctctctctctctcc 198 3 0.56 KGA098 (GA)14G Simple Imperfect tctgggaataaccgctctga gcaccagcttggttaccttc 195 2 0.35 KGA100 (AG)12 Simple Perfect tgcaatgtcgagaatggcta ccaacaatcatcatcgtcaca 174 2 0.48 KGA101 (CT)25 Simple Perfect tgacaatgtaaagttcatgacaaa gatacttccttgatttaaagacaacc 152 3 0.48 KGA107 (GA)13 Simple Perfect ccagggtgaatcagggaata ctggcaggtgggtcttctat 200 3 0.54

37
Table 1. Continued.
Marker name Primary motif Complexity Type Forward primer (5'-3') Reverse primer (5'-3') PRO ONA H
KGA109 (GA)10 Simple Perfect accttgaaccacaccgaaac tcgctgctcatcaccatatt 150 3 0.58 KGA111 (GA)19 Simple Perfect aatggtaaacagaccagactagca tgggttcatttagtagaatcaagg 161 8 0.72 KGA114 (GA)14 Simple Perfect tgttgagtgcgctttaatgg aataggtgtagccgcgtagg 173 3 0.55 KGA116 (CT)12 Simple Perfect ccttccttctctacgctctcc tgggacccaaatctttcatag 199 4 0.75 KGA117 (CT)29 Simple Perfect gctttgtagacacctgtcatgg ccactccgatgataaagttagaatg 197 6 0.74 KGA118 (CT)20 Simple Perfect attcccatccacacccatt tgtcggttcaaacttggtca 187 4 0.56 KGA119 (GA)6A(GA)10 Simple Imperfect gggataaccgctatgatgct ggtggcaccagcttgattat 166 6 0.73 KGA120 (CT)19 Simple Perfect tttgcatgccatgtagcc tgaccactccgatgacaaag 193 7 0.78 KGA121 (GA)17 Simple Perfect ttaggaaggcaagtgtttaggg tgccacgacaatttctatcg 197 2 0.47 KGA124 (GA)18 Simple Perfect gggaccaaaccctcagaaat gatttccttaatccttcattcacc 166 2 0.43 KGA125 (GA)2G(GA)4 Simple Imperfect ggtcgttgatgacagtggtg tcgatctcctctcctcctctc 188 5 0.72 KGA127 (CT)5C(CT)7C(CT)4 Simple Imperfect gtgaatcacgcttcgggtat gctcgtgatcctcttggttt 163 3 0.54 KGA128 (CT)14 Simple Perfect tgctagggctctactgaactcaa ctggctgcacttcctcttct 174 2 0.44 KGA129 (CT)23 Simple Perfect aactctccctacaccgtcacc ttcctttctcaagtttggcatt 151 2 0.35 KGA130 (CT)20 Simple Perfect ccatgaggttctatggatctgg acggttgtagcaggatgagc 172 2 0.38 KGA131 (GA)19 Simple Perfect acggttgtagcaggatgagc ccatgaggttctatggatctgg 171 2 0.28 KGA133 (CT)20 Simple Perfect cagaaccatcatccctctctct ctagggtgaaggcaacttcg 163 6 0.79 KGA134 (GA)18 Simple Perfect gcggctctgataccaatgat tgtcagctgtcaagaggtttg 172 2 0.24 KGA135 (CT)17 Simple Perfect tctcgccttcattaccctctt caaataatcggtgggtttgg 196 3 0.62 KGA136 (CT)17 Simple Perfect ccgacatttataaaggaagagaca ccgcacctatcatcaagttaga 183 3 0.54 KGA138 (CT)3CA(CT)20 Simple Imperfect cgaaaccacccttctcaaac taacaaacaaccgaccacca 159 5 0.70 KGA143 (CT)24 Simple Perfect gacagtgacaactacctctgtttca gcgagtcacgagagagagaga 175 2 0.43 KGA145 (AG)12 Simple Perfect ccagggtgaatcagggaata ctggcaggtgggtcttctat 196 2 0.32 KGA148 (CT)12 Simple Perfect acttggcgtgggatagtttg ccactccgatgacaaagtga 159 3 0.66 KGA153 (CT)18 Simple Perfect tgttattcctcctcaagacctca gatgatccgccatttctgtt 193 4 0.56
KGA155 (TG)11(AG)16(TG)9(AG)9(TG)8(AG)9(TC) (TG)5(AG)12(TG)7 Compound Imperfect ctctgttgacaatctaatttcagttct tgatctgctgcaattctaaacc 156 4 0.66
KGA156 (GA)(AG)3AA(AG)AA(AG)3GT(AG)22 Compound Imperfect ggcacaccgagagagaagag agggctcggacaatgagtta 234 4 0.56 KGA157 CTA(TC)9TT(TC)9ATTC Simple Imperfect agtttgaccgagggaggatt gagccctattggaaggacaa 183 4 0.58 KGA158 (TC)14 Simple Imperfect ccttcaataaccaattatcagcaa ctttcacgtctagggcgaag 179 3 0.43 KGA159 (TC)14T Simple Imperfect tcaaatatgccctcttctcca cctgagtgtggaggttgtca 163 4 0.58 KGA160 CT(ACT)4AT(TC)17T Compound Imperfect ggtccatggagcaaacaaa aagctgaccaacatcgacaa 157 4 0.68

38
Table 1. Continued.
Marker name Primary motif Complexity Type Forward primer (5'-3') Reverse primer (5'-3') PRO ONA H
KGA165 (TG)19(AG)19 Compound Imperfect caagcatatacctccatgtgc gaagatatgctgccttgtaatca 274 4 0.71 KGA170 (CT)14 Simple Perfect ctggcaggtgggtcttctat gaagaaggagaagaagaagaagaga 147 2 0.30 KGA171 (CT)12 Simple Perfect ttcctctgttcccttaatattgc tagggatccatgtgatgagg 125 2 0.39 KGA173 (CT)17GT(CT)4 Simple Imperfect cccttatcttatgtgaatcaggaaa cactattgtttggatagaaagatttgg 120 3 0.44 KGA174 (GA)27 Simple Perfect aagatgtcccggttgaagg aaataggcaagttaatccttcattg 150 3 0.66 KGA175 (CT)21 Simple Perfect ttcaatcatcaacaactattaagtttc tctagatcttgtgaatacggaattt 143 3 0.53 KGA177 (CT)32 Simple Perfect ctgcttctcatgtgttgatgg caacaggctgattatgggtgt 125 4 0.67 KGA179 (GA)15 Simple Perfect tttcagaaatttgaagtcaagaaaga gcttactttgactcattcccttct 130 2 0.40 KGA180 (CT)15T(TC)6T Compound Imperfect atctcagcgagttggaatgg ggatggtcctcctgaaatagc 149 3 0.52 KGA181 (AG)39 Simple Perfect aagttctttaaattgcaacatgg atcacatggacaagtgtgtga 149 3 0.47 KGA182 (GA)11 Simple Perfect tttgttatcgcgcggtgt ttgtgaagcaagcaaccaaa 173 2 0.34 KGA186 (CT)15 Simple Perfect ggaaaccaatggctgatgat gacggatccatctgttgtca 178 3 0.63 KGA188 (AG)16A Simple Imperfect ttcagctttcaataccctcaca gcatttaaagaatcagtgacatgg 177 2 0.50 KGA189 CT(TC)26 Simple Imperfect cataaatttgaacccaaacttgc gggtgcgtgcctgtattact 197 3 0.59 KGA192 (GGA)2GAA(GGA)2(GA)8AAGAAAGA Compound Imperfect cccaatgaccgttattctcg tgccaatggttaggttgtca 296 2 0.50 KGA193 (TC)4TT(TC)24T Simple Imperfect tggagccagtagttcatgttgt ggacgcttgtggattctcat 297 2 0.40 KGA199 G(GA)2G(GA)A(GA)4 Simple Imperfect gtggtcaggtgggtcagtct caccgtcaactccaaagaca 195 3 0.27 BAAT051 aatgatgtcagcggttgct aaacaagagttaaatgctaaattgct NA BAAT052 aaggtggttactttcaaataggg agttaagtggtggtgaaaccaa 0.53 BAT002 cgagcatgtgcacctatcaa ggcggtatttaacaacccaat NA BAT003 aacttatgcatttgcgacct tctccgtattatatatgcgtgtgt NA BAT004 ttacagaaatgtaccaatcctacaaa ggaacaacgcaacaagctaa NA BGA200 accagccactttgtcattagg gccatggttgatgaatgaga 0.71

39
Figure 1. Number of clones sequenced (A) and primers developed (B) for each library. (A) Total number of sequenced clones, including those containing unique microsatellites, redundant sequences, and those not used for primer design. (B) Total number of primers designed, including polymorphic and monomorphic primers, polymorphic primers with high molecular weight amplicons, those polymorphic only between C. berlandieri and quinoa, and primers with poor or no amplification. A.
0
100
200
300
400
500
600
GA AAT CAA
Library
Num
ber
of C
lone
s Not used
Redundant
Uniquemicrosatellites
B.
020406080
100120140160180200
GA AAT CAA
Library
Num
ber o
f Prim
ers
High molecular weightpolymorphicNo amplification
Poor amplification
Polym.C.berlandieri
Monomorphic
Polymorphic

40
Figure 2. Histogram showing number and heterozygosity (H) values of polymorphic markers by repeat length.
H Value of Polymorphic Markers by Repeat Length
0
5
10
15
20
25
30
35
40
45
5010
-19
20-2
9
30-3
9
40-4
9
50-5
9
60-6
9
70-7
9
80-8
9
90-9
9
> 1
00
Length in Base Pairs
Cou
nt
0.70 - 0.900.50 - 0.690.30 - 0.490.10 - 0.29

41
Table 2. Significant database sequence homologies to microsatellite-containing clones for which primers were designed, including E-value, nucleotide and/or protein homology match, organism match, and GenBank accession number, as identified through BLASTN and BLASTX searches.
Marker name E-value Nucleotide homology E-value Protein homology Organism matched GenBank accession #
KAAT007 2.00E-39 Mitochondrial DNA Beta vulgaris BA000009 GI:47118321
KAAT032 2.00E-06 DNA microsatellite locus mm17 Sus scrofa AB206674 GI:78483939
KAAT040 3.00E-09 Putative C2H2 type zinc finger protein Arabidopsis thaliana AAL91203
GI:19698935
KCAA010 1.00E-06 Hypothetical protein MmC1DRAFT_0268 Magnetococcus sp. EAN27141
GI:68245001
KCAA016 3.00E-10 F4N2-12 Arabidopsis thaliana AAF27057 GI:6730636
KCAA022 4.00E-11 SSR clone PPA3C05R Pinus pinaster CR377726 GI:45724167
KCAA025 2.00E-14 Similarity to ARI, Ring finger protein Drosophila melanogaster AAC27149
GI:3335347
KCAA026 2.00E-10 SSR clone PPB3DO7 Pinus pinaster CR377898 GI:45724338
KCAA028 3.00E-07 Putative protein Oryza sativa AC136522.3 GI:55168098
KCAA060 2.00E-08 T-DNA flanking sequence clone 045H04 7.00E-19 Arabidopsis thaliana AJ834625
AF263243
KCAA074 4.00E-18 SocE Mixococcus xanthus AAF91388 GI:9652070
KCAA084 8.00E-07 SotA gene for sugar export transporter 2.00E-08 Putative reverse transcriptase Erwinia Chrysanthemi
Cicer arietinum AJ249180 CAD59768
KCAA086 1.00E-08 ZV5 scaffold protein Danio rerio CT483277 GI:82591609
KCAA111 2.00E-42 Non-inducible immunity 1-like Oryza sativa BAD87216 GI:57900322

42
Table 2. Continued
Marker name E-value Nucleotide homology E-value Protein homology Organism matched GenBank accession #
KCAA112 3.00E-09 Uncharacterized protein family. Putative protein Oryza sativa ABA95862
GI:77553066
KCAA116 4.00E-17 Putative 22 KDa Kafirin cluster Oryza sativa NP_920981
KCAA118 2.00E-14 Putative polyprotein F4N2.12 Oryza sativa NP_909548 GI:34896408
KCAA120 1.00E-07 Unknown protein Arabidopsis thaliana NP_199616 GI:15238877
KCAA121 8.00E-15 Putative retrotransposon Oryza sativa ABA93560 KCAA127 4.00E-09 Catalase Campilobacter jejuni CAA59444
KCAA128 1.00E-06 Clone 045H04 6.00E-08 Catalase CAT2 Arabidopsis thaliana Zea Mays
AJ834625 A55092
KCAA142 9.00E-50 Glutamate/malate translocator Spinacia oleracea AAM89396 GI:22121980
KGA024 2.00E-33 Hypothetical protein PC403819.00.0 Plasmodium chabaudi XP_731877
GI:70914552
KGA025 2.00E-09 Putative retroelement Oryza sativa NP_921184 GI:37533764
KGA026 2.00E-21 Isocitrate dehydrogenase Allophyllum glutinosum AAY58195 GI:66932577
KGA042 7.00E-04 Unknown protein Arabidopsis thaliana NP_178206 GI:6503303
KGA053 4.00E-06 Beta Amylase Arabidopsis thaliana NP_568829 GI:79537398
KGA055 1.00E-05 Leucin Rich Repeat (LRR) protein Lycopersicum esculentum CAA64565 GI:1619300
KGA068 3.00E-13 STT3A Staurosporin and temperature sensitive 3-like oligosaccharyl transferase
Arabidopsis thaliana NP_568380 GI:18419993
KGA075 1.00E-21 Alpha zein gene Zea mays X61085 GI:22178

43
Table 2. Continued
Marker name E-value Nucleotide homology E-value Protein homology Organism matched GenBank accession #
KGA079 1.00E-43 Circadian clock Associated protein Mesembryanthemum crystallinum AAQ73524 GI:34499877
KGA101 2.00E-10 Sucrose transporter Plantago major CAD58887 GI:31455370
KGA129 4.00E-09 SJCHGC09318 protein Schistosoma japonicum AAX25872 GI:76154385
KGA135 8.00E-04 Putative DNA replication licensing factor Arabidopsis thaliana AAD19787
GI:4388832
KGA142 3.00E-10 Putative polycomb protein E21 Oryza sativa BAD69169 GI:55296025
KGA160 8.00E-33 Hypothetical protein Arabidopsis thaliana AAD21704 GI:20198037
KGA171 1.00E-10 Putative Syccinyl CoA ligase – Alpha subunit Oryza sativa XP_478842
GI:50938629
KGA177 6.00E-05 Putative protein Oryza sativa CAC39056 GI:14140139
KGA184 3.00E-21 Catalytic protein Arabidopsis thaliana NP_566539 GI:18401044
KGA186 1.00E-06 At5g09860 – MYH9-7 protein Arabidopsis thaliana AAN33204 GI:23463079
KGA024 1.00E-28 Phosphoenolpyruvate carboxylase kinase 2 Clusia minor AAR3183
GI:39842453

44
Figure 3. Linkage maps of Population 1 (A), Population 40 (B), and the integrated map (C). Distances in centiMorgans are indicated on the left side of each linkage group. All SSR markers begin with Q or K; newly developed SSR markers reported herein begin with K. BES-SSR markers begin with B. AFLP markers begin with e. Markers skewed at P<0.05 and P<0.01 are indicated with * and **, respectively. A. Population 1 linkage map.

45
B. Population 40 linkage map.

46
C. Integrated map

47
Table 3. Skewed markers scored (A) and mapped (B) in Populations 1 and 40. SSR markers begin with Q or K. AFLP markers begin with e. Markers skewed at P<0.05 and P<0.01 are indicated with * and **, respectively. (A) Name and parental direction of skewed markers scored in Populations 1 and 40. (B) Number, linkage group location, and parental direction of skewed markers for Population 1 and Population 40 . A.
Population 1 Population 40 Marker Direction Marker Direction eAACmCAC-245** 0654 KAAT007** NL-6 eAACmCAC-310** 0654 KAAT031** NL-6 eAACmCAG-118** Ku-2 KAAT050** Chucapaca eAACmCAG-128** 0654 KCAA011-B* NL-6 eAAGmCAC-201* Ku-2 KCAA063** Chucapaca eAAGmCTG-450* 0654 KCAA065* Chucapaca eACAmCAG-200* 0654 KCAA069** Chucapaca eACAmCTA-194** 0654 KCAA078* Chucapaca eACAmCTA-195* 0654 KCAA118** NL-6 eACAmCTG-112* Ku-2 KCAA139** Chucapaca eACCmCAA-185* 0654 KGA019** Chucapaca eACCmCAG-265* 0654 KGA086** Chucapaca eACGmCAA-165* 0654 KGA088** NL-6 eACGmCAT-167** Ku-2 KGA109** Chucapaca eACTmCTG-125** Ku-2 KGA182** NL-6 KCAA005* Ku-2 KGA186** NL-6 KCAA112** Ku-2 QAAT022* Chucapaca KGA014* Ku-2 QAAT027** Chucapaca KGA136* Ku-2 QAAT070** Chucapaca KGA138** Ku-2 QAAT074** NL-6 KGA165** Ku-2 QATG052** NL-6 KGA199** Ku-2 QATG056** NL-6 QAAT024** Ku-2 QCA018** Chucapaca QAAT050* Ku-2 QCA038** NL-6 QAAT097* Ku-2 QCA071** NL-6 QAAT108** Ku-2 QCA078* NL-6 QATG019* Ku-2 QCA124* NL-6 QCA027** Ku-2 QCA053** Ku-2 QCA058* Ku-2 QCA093* 0654

48
B.
Population 1 LG # Ku-2 0654
1 11 7 48 1 1 0
12 1 0 113 6 6 015 2 1 134 1 0 1
Total 22 15 7% 68.2 31.8
Population 40 LG # Chucapaca NL-6
1 3 3 02 1 1 03 3 0 35 1 0 16 1 0 17 3 2 18 3 0 3
10 2 2 011 1 0 112 1 1 013 1 0 116 1 0 117 1 0 118 1 1 0
Total 23 10 13% 43.5 56.5

49
Figure 4. Comparison of loci linked to the BSP locus (BSPL) (Ricks 2005) in LG 11 of the Maughan et al (2004) map and linkage group (LG) 1 of the integrated map reported herein. Distances in centiMorgans are reported on the left side of the linkage groups. SSR markers begin with Q or K. AFLP markers begin with e.

50
Table 4. Potentially homoeologous loci and linkage groups (LG) in the Population 1, Population 40 and inegrated map, as indicated by a single primer set amplifying two segregating loci.
Population 1 Marker LG LG KCAA011 9 19 KCAA120 3 17 KGA119 2 25 KGA177 9 41 QAAT064 2 21 QATG087 18 18 QCA073 2 11 QCA082 9 41 11S 29 36
Population 40 KCAA011 6 9
Integrated KCAA011 7 10 QCA073 3 4

51
Chapter 3: LITERATURE REVIEW

52
Introduction
Quinoa (Chenopodium quinoa Willd.) is an important South American cereal crop that
has only recently gained international attention for its high nutritional value. Grown
primarily in the highland regions of Bolivia, Ecuador, Chile, and Peru, quinoa has served
as an important staple crop for subsistence farmers for thousands of years. It is well-
suited as a staple crop due to its high protein content. In fact, quinoa seeds contain more
protein (14-18%) than the other major cereal crops (10-12%) (Risi and Galwey 1989).
Indeed, quinoa comes closer to providing all the necessary nutrients for human life than
any other food (Chauhan et al. 1999; Cusack 1984).
In addition to its high nutritional value, quinoa has many other desirable traits.
For example, quinoa is well-suited to grow in elevations ranging from sea level up to
4000 meters, well beyond the limit of most cereal crops. Moreover, quinoa is able to
withstand extreme environmental conditions such as frost, flooding, drought, salty soils,
acidic soils, and high UV irradiation (Risi and Galwey 1984; Galwey et al. 1990; Jensen
et al. 2000).
Despite the many desirable characteristics of quinoa, however, it has many
limitations. Low yields force subsistence farmers to turn to less nutritious crops for
sustenance and limit their ability to profit from increased demand for quinoa by
international health food markets. Furthermore, quinoa is plagued by diseases such as
downy mildew as well as avian and arthropod pests. Unlike the other major cereal crops
which have benefited greatly from genetic research and improvement, little has been
invested into increasing quinoa yields or improving its resistance to diseases and pests.

53
This is in large part due to the fact that quinoa is not commercially grown to any
appreciable extent anywhere outside of Latin America.
DNA markers are an essential stepping stone to improving quinoa for the benefit
of subsistence farmers in the highland regions of South America. Marker-assisted
selection, or MAS, is now dramatically reducing (by years) the amount of time required
for breeders of major crops to develop new, high-yielding varieties. The relative value of
SSR (simple-sequence repeat) markers is that they are potentially applicable to any
genetic population of quinoa, whereas other markers such as AFLPs and RAPDs are not
likely to be transferable across populations.
History
The domestication of quinoa took place thousands of years ago, as evidenced by
archeological remains that date back to 5,000 BC (Tapia 1979). The Altiplano region of
Bolivia and Peru contains the greatest number of quinoa landraces, indicating this area as
the probable domestication site (Gandarillas 1968).
Along with potatoes and maize, quinoa was an important staple crop of the Inca
Empire, which dominated much of the Andean Mountains (Galwey1995, Cusack 1984,
Risi and Galwey 1984). Indeed, quinoa played such an important role in Inca culture that
it was known as the “Mother Grain” (Fleming and Galwey 1995). The crop was
harvested primarily for its seed—which was used in a variety of different ways—but the
leaves were also important and were used as a potherb. However, quinoa cultivation
sharply declined after the Spanish conquered the Inca Empire in 1532, not only because
the Spanish favored other food crops, but also because they actively sought to eradicate

54
Inca culture, in which quinoa played such an important role (Cusack 1984). Over time,
quinoa cultivation continued to decline, and the crop soon came to be known as “poor
man’s food” (Cusack 1984, Koziol 1992). By 1975, only 39,000 hectares of quinoa were
in cultivation (Galwey 1995).
Recently, however, quinoa production has been on the rise, due in part to its
increased use as an organic health food. Nevertheless, many obstacles still prevent
quinoa from being grown on an even larger scale. For example, the crop suffers from
low yields. In addition, processing the seed is relatively expensive due to the necessary
removal of bitter saponins from the seed coat (Cusack 1984).
Taxonomy
Quinoa belongs to the family Amaranthaceae (formerly known as Chenopodiaceae
(Angiosperm Phylogeny Group 1998)). The genus Chenopodium contains two principal
subsections of cultivated species: Cellulata, to which quinoa and huazontle (C.
berlandieri ssp. nuttalliae) belong, and Leiosperma, to which cañihua (C. pallidicaule)
and C. album species belong. Chenopodium berlandieri ssp. nuttalliae is a tetraploid that
is morphologically similar to quinoa. It is grown in Mesoamerica as a vegetable and seed
crop (Wilson and Heiser 1979). Chenopodium pallidicaule is an important diploid plant
cultivated as a seed, forage, and vegetable crop in the Andes (Fleming and Galwey 1995).
The species belonging to the C. album group are primarily from Eurasia (Partap and
Kapoor 1985), although the group is poorly classified, partly because it has become a
receptacle for other plants that are not easily characterized (Wilson 1980, Risi and

55
Galwey 1984). Chenopodium giganteum, a hexaploid, is another important relative of
quinoa that is cultivated in South and East Asia (Partap et al. 1998).
Quinoa is morphologically diverse. For example, seed colors vary from coffee,
black, white, red, yellow, cream, and several shades of white. Many different
classifications have been established to categorize the various quinoa varieties.
Subspecies based on cultivated varieties have been created, and include C. quinoa, C.
quinoa ssp. milleanum Aellen, C. quinoa ssp. melanospermum Hunziker, C. quinoa ssp.
rubbescens, and C. quinoa ssp. lutescens (Bonifacio 1995). Quinoa has also been divided
according to ecotypes. These classes include Nivel del Mar/Coastal/Chilean (sea level),
Yungas/Subtropical (1,800-2,300m), Valle (2,400-3,600m), Altiplano (>3,600m), and
Salares (salt flats) (Bonifacio 1995, Risi and Galwey 1984, Wilson 1988a).
Genetically, quinoa seems to be an allotetraploid, although it follows simple
disomic inheritance patterns (Maughan et al. 2004, Ward 2000, 2001, Bonifacio 1990,
Simmonds 1971, Gandarillas 1968). Like most other Chenopodium species, quinoa has a
base chromosome number of x = 9 (2n = 4x = 36). Quinoa has a relatively small haploid
genome of only approximately 967 million nucleotide pairs (Maughan et al. 2004).
Breeding
Quinoa is primarily a self-pollinating crop, and thus most cultivated and landrace types
are pure-line homozygous. A vast amount of genetic diversity is available as potential
sources of genes, both from cultivated and other non-cultivated quinoa, as well as from
other Chenopodium species (Bonifacio 1995).

56
Several different interspecific crosses have been attempted with quinoa. Hybrids
formed from crossing with C. berlandieri and C. berlandieri ssp. nuttalliae showed
limited fertility (Wilson and Heiser 1979). Fully fertile hybrids have been created by
crossing quinoa with C. hircinum (Risi and Galwey 1984). Hybrids between quinoa and
other Cellulata species are partially fertile, but backcrossing the hybrid to quinoa has
been shown to produce fruits (Wilson 1980). Many other interspecific crosses have been
attempted, but all with limited or no fertility (Wilson 1980). Intergeneric crosses have
even been attempted by crossing quinoa with Atriplex hortensis, although these hybrids
were fully sterile (Bonifacio 1995). In order to make use of the valuable genetic
resources available, techniques such as chromosome doubling and embryo rescue may
need to be used in order to form viable hybrids of quinoa and other important species.
Breeding objectives in quinoa aim to increase yield as well as resistance to
diseases and pests. At about 1 metric ton per hectare, quinoa yields are much lower than
those of other commercial grains. Creating higher-yielding varieties is, therefore, a major
objective of breeding programs. Indeed, improved varieties of quinoa are capable of
doubling yields.
One reason yields are low is that quinoa crops often suffer heavy damage from
downy mildew (Peronospora farinose) (Ochoa et al. 1999), cutworms and armyworms
(Feltia spp., Agrotis spp. and Spodoptera spp.), and the quinoa moth (Eurysacca
melanocampta). The development of quinoa varieties that are resistant to such disease
and predation could greatly increase yield.
Quinoa crops are also often damaged by avian pests. Bitter saponins in the seed
coat of quinoa help protect the crop from birds, and are thus often desirable. However,

57
these saponins must be washed off the seed prior to human consumption, and is thus an
added expense of harvesting and processing the seed. Thus, the development of saponin-
free lines is also desirable. Such lines have actually been developed and have been
shown to be controlled by a recessive allele at a single locus (Ward 2001).
Biotic and Abiotic Stresses
Quinoa is grown in some of the harshest abiotic environments on earth (Bonifacio 1995)
and, as mentioned, also suffers from many biotic stresses. While resistance to many of
these biotic stresses is limited (for example, while the presence of saponins helps deter
avian predation, quinoa has only limited resistance to downy mildew and other fungal
diseases), quinoa is well-adapted to overcome many of the abiotic stresses it encounters.
Quinoa is grown in elevations ranging from sea level up to 4000 meters. It is able
to grown in a wide array of poor soils, including stony, sandy, salty, acidic, and alkaline
soils. For example, quinoa has been shown to grow in soils ranging in pH values from
4.8 (Risi and Galwey 1984) to 8.5 (Wilson 1988a). The deep, wide taproot of quinoa
plants is able to extract moisture and nutrients far below the surface (Fleming and
Galwey 1995). Quinoa plants have also shown resistance to logding, hail, and flooding
(Risi and Galwey 1984). In general, variations in quinoa are according to ecotype. For
example, plants grown in the high elevations of the Altiplano are adapted to short
growing seasons as well as frequent and severe frost (as low as -4ºC) (Risi and Galwey
1984). On the other hand, plants growing near salt flats are well adapted to salty, alkaline
soils and high UV irradiation (Wilson 1988a).

58
Molecular Studies in Quinoa
Few molecular studies have been conducted in quinoa, although increased international
interest has prompted more recent studies. Initial molecular studies in quinoa sought to
elucidate the genetic relationships between several Chenopodium species. Wilson
(1988a) used allozyme data to construct a phylogenetic tree of Chenopodium species
which distinguished coastal and Altiplano ecotypes. The data also supported the
hypothesis of the Altiplano being the center of origin for quinoa. Similar studies were
conducted using seed protein variation and morphological markers (Wilson 1988b,
Fairbanks et al. 1990).
Fairbanks et al. (1993) were the first to use molecular markers in quinoa. They
used RAPD (random amplified polymorphic DNA) primers to detect polymorphisms
among different quinoa accessions. Bonifacio (1995) also used RAPDs as a way to
identify true hybrids from intergeneric crosses. Ruas et al. (1999) used RAPDs to
investigate the relationship among 19 Chenopodium species, and found that accessions
clustered according to their species classifications.
More recent studies have utilized markers other than RAPDs. For example,
Mason et al. (2005) developed SSR (simple-sequence repeat or microsatellite) markers
for use in quinoa by sequencing 1276 clones from enriched CA, ATT, and ATG repeat
DNA libraries. They found that of 397 potential SSRs, 208 were polymorphic on a panel
of 31 quinoa accessions. In addition, the markers were tested on three different
Chenopodium species (C. pallidicaule, C. giganteum, and C. berlandieri ssp. nuttalliae).
Sixty-seven percent of the SSRs amplified in all species, while 99.5% amplified in
nuttalliae, illustrating the close relationship between it and quinoa.

59
In addition to SSRs, SNP (single nucleotide polymorphism) markers have been
developed in quinoa. Coles et al. (2005) obtained and deposited 424 ESTs (expressed
sequence tags) into GenBank. Of these ESTs, 349 were found to have homology to
protein-encoding genes from other plants. Fifty-one SNPs were identified from 20 of
these ESTs, of which 38 were single-nucleotide changes and 13 were insertion/deletion
changes. In addition, 81 more SNPs were obtained when quinoa was compared to C.
berlandieri ssp. nuttalliae.
Maughan et al. (2004) used some of the above-mentioned SSRs to produce the
first genetic linkage map of quinoa. The map was based on 80 F2 individuals from a
cross between Ku-2 (a Chilean lowland type) and 0654 (an Altiplano type) and consisted
of 230 AFLP (amplified fragment length polymorphism), 19 SSR, and 6 RAPD markers.
The map spanned 1,020 cM and contained 35 linkage groups, giving an average of 4.0
cM per marker. Using the method of Hulbert et al. (1988), the total genome length was
predicted to be 1,700 cM.
Stevens et al. (2006) developed a BAC library of quinoa in conjunction with the
Arizona Genomics Institute at the University of Arizona. The library, which was
estimated to represent approximately nine times coverage of the haploid quinoa genome,
contains 26,880 clones from BamHI digests and 48,000 clones from EcoRI digests.
Maughan et al (2006) sequenced the nucleolus organizing region (NOR)
intergenic spacers (IGS) and 5S rDNA non-transcribed spacers (NTS) from five quinoa
and one C. berlandieri accession. IGS sequences revealed length differences due to
insertion/deletions (indels), differing numbers of repeat copies, and other rearrangements

60
among the accessions. NTS sequencing revealed two sequence classes, likely
representing one locus from each of the genomes in allotetraploid quinoa.
Few cytogenetic studies have been conducted in quinoa. Gill et al. (1991) used C-
banding to show that quinoa chromosomes primarily consist of pericentric
heterochromatin surrounded by regions of euchramatin. Kolano et al. (2001) and Kolano
(2004) studied the 45S (NOR) and 5S rRNA genes in quinoa and 23 related species.
Their results revealed two 5S loci, but only one NOR, suggesting that one was lost during
the evolution of quinoa. These results also support the hypothesis that quinoa is an
allotetraploid. Another cytogenetic study conducted by Gardunia et al. (2006) used FISH
to study chromosomal locations of four repetitive sequences from a quinoa genomic
library.
Molecular Markers
Molecular markers are important tools in the investigation and improvement of plants.
For example, marker-assisted selection (MAS) has greatly improved the efficiency and
effectiveness of breeding programs. While traditional breeding programs base selection
on phenotype, MAS is based on genotype. Thus, in MAS, selection is not influenced by
the environment. In addition, MAS is much faster because selection can be done as soon
as the plant is old enough to provide DNA for examination, therefore significantly
reducing the number of generations required to produce new varieties of crops (Yousef
and Juvik 2001). MAS is also more cost effective than traditional breeding.
Markers can also be used to assess genetic diversity (Diwan et al. 1995; Tanksley
and McCouch 1997). This is important for many reasons. For example, fingerprinting

61
and identifying different species and cultivars can aid in assigning taxonomic
designations and can also allow breeders to know where to go for sources of important
genes. In addition, assessing genetic diversity aides in the maintenance of genetic
diversity and helps prevent genetic erosion (Wilkes 1989).
Markers commonly used in plant studies include restriction fragment length
polymorphisms (RFLPs), random amplified DNA polymorphisms (RAPDs), amplified
fragment length polymorphisms (AFLPs), single-nucleotide polymorphisms (SNPs), and
simple-sequence repeats (SSRs, which will be discussed in more detail later).
RFLPs were first developed for use in the production of genetic maps in humans
(Botstein et al. 1980), but were quickly used in plants to assess genetic diversity
(Helentjaris et al. 1985) and produce genetic maps (Helentjaris et al. 1986). RFLPs are
codominant markers and can therefore identify heterozygotes. They require large
amounts of DNA and prior sequence knowledge as well as being technically demanding,
slow, and relatively expensive.
RAPDs were introduced in 1990 (Williams et al. 1990) as a quick way of
detecting genetic markers that can easily be mapped. RAPDs are PCR-based and are
much quicker, easier, and cheaper than RFLPs. They employ random primers that do not
require prior sequence knowledge. However, RAPDs are not highly reproducible due to
sensitivity to changes in tissue source, DNA extractions protocol, and/or PCR conditions
(Staub et al. 1996a). In addition, RAPDs are generally dominant markers, meaning they
do not allow discrimination between heterozygotes and homozygotes.
AFLPs were introduced in 1995 as a new fingerprinting technique (Vos et al.
1995) and were quickly put to use in mapping and other applications in plants (Haanstra

62
et al. 1999; Mank et al. 1999). AFLPs require small amounts of high quality DNA. The
technique is very demanding and expensive, but results in a large amount of data
(generally 100-200 bands per marker). AFLPs are PCR-based and require no sequence
knowledge. As with RAPDs, AFLPs are generally dominant markers.
SNPs are a fairly new, high-throughput marker that is quickly becoming the
system of choice because they are easily developed and highly reproducible (Rafalski
2002). SNPs are based on sequence info and identify alleles by single-nucleotide
differences between them. It has been shown that SNPs are much more frequent than
SSRs (Batley et al. 2003).
Simple Sequence Repeats
Simple sequence repeats (SSRs or microsatellites) are based on differences in repeat
number of simple sequences. These simple sequences generally consist of one- to four-
nucleotide sequences that are repeated in tandem and are surrounded by conserved
sequences. These conserved regions are sequenced, and PCR primers are subsequently
designed to amplify the repeat region within the flanking conserved sequences.
Polymorphisms in repeat number are caused by slippage during DNA replication and/or
by unequal crossing over (Levinson and Gutman 1987; Schlotterer and Tautz 1992
(Brian)). These polymorphisms can be detected by running the PCR products on either
agarose or polyacrylamide gels and visualizing using eithidium bromide or radioisotopes,
respectively. Because SSRs require sequencing, they are relatively expensive; however,
operating costs are low after sequencing is accomplished. Primers can easily be
developed from published sequences and are therefore easily transferable to other

63
laboratories. In addition, because the sequences surrounding the repeat regions are highly
conserved, SSRs are easily transferable to other species with relatively high success.
Thus, because they are highly reproducible, polymorphic, codominant markers, SSRs are
an excellent choice for use in any plant system. Indeed, plant studies employing SSRs
are abundant. SSRs have been used in mapping and genetic diversity studies in
numerous minor crops as well as all the major crops including rice (McCouch et al. 1995
(Brian)), corn (Taramino and Tingey 1996 (Brian)), soybeans (Maughan et al. 1995), and
wheat (Cuadrado and Schwarzacher 1998).
Mapping
One of the most important applications of molecular markers is in the production of
genetic linkage maps (Staub et al. 1996b). Linkage maps are an essential tool of MAS
because they allow for the discovery of molecular markers tightly linked to genes
governing agronomically-important traits. For example, breeders can map important
genes onto existing linkage maps and identify markers that are closely linked to alleles of
those genes. The DNA markers, then, provide an indirect way of detecting the presence
or absence of desirable alleles, and thus speed the process of developing new and better
plant varieties. This process has been done extensively with maps containing SSRs. The
first linkage map in quinoa, while consisting primarily of AFLP markers, contained some
SSR markers (Maughan et al. 2004).
Maps can also be used as a tool in gene cloning. Map-based cloning techniques
such as chromosome walking and chromosome jumping are common methods that

64
involve using a DNA marker as a starting point to identify and clone important linked
genes.
Conclusion
Quinoa is a staple cereal crop in many regions of South America, particularly in the
Altiplano region of Bolivia and Peru. While it is highly nutritious and has many
desirable characteristics such as the ability to grow in environments not suitable to other
crops, it nevertheless suffers from low yields and susceptibility to many disease as well
as avian and arthropod pests.
Molecular markers—particularly SSRs—and genetic linkage maps are important
tools in any breeding program and will certainly aide in the improvement of cultivated
quinoa through applications such as marker-assisted selection.

65
References
Angiosperm Phylogeny Group (1998) An ordinal classification for the families of
flowering plants. Ann Missouri Bot Gard 85:531–553
Batley J, Barker G, O'Sullivan H, Edwards K, Edwards D (2003) Mining for single
nucleotide polymorphisms and insertions/deletions in maize expressed sequence tag data.
Plant Physiol 132:84-91
Bonifacio A (1990) Caracteres hereditarios y ligamiento factorial en la quinua. Tésis Ing
Agr Universidad Mayor de San Simón, Cochamamba, Bolivia
Bonifacio A (1995) Interspecific and intergeneric hybridization in chenopod species.
Thesis. Brigham Young University, Provo, UT
Botstein D, White RL, Skolnick M, Davis RW (1980) Construction of a genetic linkage
map in man using restriction fragment length polymorphisms. Am J Hum Genet 32:314-
331
Chauhan GS, Eskin NAM, Tkachuk R (1999) Effect of saponin extraction on the
nutritional quality of quinoa (Chenopodium quinoa Willd.). J Food Sci Technol 36:123-
126

66
Coles ND, Coleman CE, Christensen SA, Jellen EN, Stevens MR, Bonifacio A, Rojas-
Beltran JA, Fairbanks DJ, Maughan PJ (2005) Development and use of an
expressed sequenced tag library in quinoa (Chenopodium quinoa Willd.) for the
discovery of single nucleotide polymorphisms. Plant Sci 168:439-447
Cuadrado A, Schwarzacher T (1998) The chromosomal organization of simple sequence
repeats in wheat and rye genomes. Chromosoma 107:587-594
Cusack DF (1984) Quinua: grain of the Incas. Ecologist 14:21-31
Diwan N, McIntosh MS, Bauchan GR (1995) Methods of developing a core collection of
annual Medicago species. Theor Appl Genet 90:775–761
Fairbanks DJ, Burgener KW, Robison LR, Andersen WR, Ballón E (1990)
Electrophoretic characterization of quinoa seed proteins. Plant Breeding 104:190-195
Fairbanks DJ, Waldrigues DF, Ruas CF, Ruas RM, Maughan PJ, Robison LR, Andersen
WR, Riede CR, Panley CS, Caetano LG, Arantes, OMN, Fungaro MH, Vidotto MC,
Jankevicius SE (1993) Efficient characterization of biological diversity using field DNA
extraction and RAPD markers. Brazil J of Genetics 16: 11-33
Fleming JE, Galwey NW (1995) Quinoa (Chenopodium quinoa). In: Williams JT (ed.)
Cereals and Pseudocereals. Chapman & Hall, London, 2-83

67
Galwey NW, Leakey CLA, Price KR, Fenwick GR (1990) Chemical composition and
nutritional characteristics of quinoa (Chenopodium quinoa Willd.). Food Sci Nutr
42:245-261
Galwey NW (1995) Quinoa and relatives. In Smartt J, Simmonds NW (eds) Evolution of
Crop Plants, 2nd Ed. Longman Scientific & Tecnical, Essex, UK, pp 41–46
Gandarillas H (1968) Razas de quinua La Paz, Bolivia, MACA, División de
Investigaciones Agrícolas. Universo, Boletín Experimental No. 34
Gardunia BW, Stevens MR, Jonson LA, Coleman CE, Bonifacio A, Fairbanks DJ,
Kolano B, MAlusynska J, Jellen EN (2006) Phylogenetic análisis and chromsomal
localization of miscellaneous sequences from a Chenopodium quinoa cv. ‘Real’ DNA
library. Genome, in press
Gill BS, Friebe B, Endo TR (1991) Standard karyotype and nomenclature system for
description of chromosome bands and structural aberrations in wheat (Triticum
aestivum). Genome 34:830-839
Haanstra J, Wye C, Verbakel H, Dekens F, Berg P, Odinot P, van Huesden A, Tanksley
S, Lindhout P, Pelesman J (1999) An integrated high-density RFLP-AFLP map of tomato
based on two Lycopersicon esculentum x L. pennelli F2 populations. Theor Appl Genet
99:254-271

68
Helentjaris T, King G, Slocum M, Siedenstrang C, Wegman S (1985) Restriction
fragment polymorphisms as probes for plant diversity and their development as tools for
applied plant breeding. Plant Molecular Biology 5:109-118
Helentjaris T, Slocum M, Wright S, Shefer A, Nienbuis J (1986) Construction of genetic
linkage maps in maize and tomato using restriction fragment length polymorphisms.
Theor Appl Genet 72:761-769
Hulbert SH, Ilott TW, Legg EJ, Lincoln SE, Lander ES, Michelmore RW (1988) Genetic
analysis of the fungus, Bremia lactucae, using restriction fragment length
polymorphisms. Genetics 120:947-958
Jensen CR, Jacobsen SE, Andersen MN, Núñez N, Andersen SD, Rasmussen L,
Mogensen VO (2000) Leaf gas exchange and water relation characteristics of field
quinoa (Chenopodium quinoa Willd.) during soil drying. Eur J Agron 13:11-25
Kolano B, Pando LG, Maluszynska J (2001) Molecular cytogenetic studies in
Chenopodium quinoa and Amaranthus caudatus. Acta Societ Botan Polon 70:85-90
Kolano BA (2004) Genome analysis of a few Chenopodium species. Ph.D. Thesis,
Silesian University.

69
Koziol MJ (1992) Chemical and nutritional evaluation of quinoa (Chenopodium quinoa
Willd). J Food Comp Anal 5:35-68
Levinson G, Gutman GA (1987) Slipped-strand mispairing: A major mechanism for
DNA sequence evolution. Mol Biol Evol 4:203-221
Mank M, Anonise R, Bastiaans E, Senior M, Stuber C, Melchinger A, Lubberstedt T, Xia
X, Stam P, Zabeau M, Kuiper M (1999) Two high-density AFLP linkage maps of Zea
mays L.: analysis of distribution of AFLP markers. Theor Appl Genet 99:921-935
Mason SL, Stevens MR, Jellen EN, Bonifacio A, Fairbanks DJ, Coleman CE, McCarty
RR, Rasmussen AG, Maughan PJ (2005) Development and use of microsatellite markers
for germplasm characterization in quinoa (Chenopodium quinoa Willd.). Crop Sci
45:1618-1630
Maughan PJ, Saghai Maroof MA, Buss GR (1995) Microsatellite and amplified sequence
length polymorphisms in cultivated and wild soybean. Genome 38:715-723
Maughan PJ, Bonifacio A, Jellen EN, Stevens MR, Coleman CE, Ricks M, Mason SL,
Jarvis DE, Gardunia BW, Fairbanks DJ (2004) A genetic linkage map of quinoa
(Chenopodium quinoa) based on AFLP, RAPD, and SSR markers. Theor Appl Genet
109:1188–1195

70
Maughan PJ, Kolano B, Maluszynska J, Coles ND, Bonifacio A, Rojas Beltran J,
Coleman CE, Stevens MR, Fairbanks DJ, Parkinson SE, Jellen EN (2006) Molecular and
cytological characterization of ribosomal DNAs in Chenopodium quinoa and
Chenopodium berlandieri. Genome, in press
McCouch SR, Chen X, Panaud O, Temnykh S, Xu Y, Cho YG, Huang N, Ishii T, Blair
M (1997) Microsatellite marker development, mapping and applications in rice genetics
and breeding. Plant Mol Biol 35:89-99
Ochoa J, Frinking HD, Jacobs TH (1999) Postulation of virulence groups and resistance
factors in the quinoa/downy mildew pathosystem using material from Ecuador. Plant
Pathol 48:425-430
Partap T, Kapoor P (1985) The Himalayan grain chenopods I. Distribution and
ethnobotany. Agriculture, Ecosystems and Environment 14:185–199
Partap T, Joshi BD, Galwey NW (1998) Chenopods. Chenopodium spp. Promoting the
conservation and use of underutilized and neglected crops. 22. Institute of Plant
Genetics and Crop Plant Research, Gatersleben/International Plant Genetic Resources
Institute, Rome, Italy
Risi J, Galwey NW (1984) The Chenopodium grains of the Andes: Inca crops for modern
agriculture. Adv Appl Biol 10:145-216

71
Rafalski A (2002) Applications of single nucleotide polymorphisms in crop genetics.
Cur. Opin. Plant Biol. 5:94-100
Risi J, Galwey NW (1989) The pattern of genetic diversity in the Andean grain crop
quinoa (Chenopodium quinoa Willd). I. Associations between characteristics. Euphytica
41:147-162
Ruas PM, Bonifacio A, Ruas CF, Fairbanks D, Anderson WR (1999) Genetic relationship
among 19 accessions of six species of Chenopodium L. by random amplified
polymorphic DNA fragments (RAPD). Euphytica 105:25-32
Schlotterer C, Tautz D (1992) Slippage synthesis of simple sequence DNA. Nucleic
Acids Res 20:211-215
Simmonds NW (1971) The breeding system of Chenopodium quinoa. I. Male sterility.
Heredity 27:73-82
Staub JE, Bacher J, Poetter K (1996a) Sources of Potential Errrors in the application of
random amplified polymorphic DNAs in cucumber. Hort Science 31:262-266
Staub JE, Serquen FC, Gupta M (1996b) Genetic markers, map construction, and their
application in plant breeding. HortScience 31:729–741

72
Stevens MR, Coleman CE, Parkinson SE, Maughan PJ, Zhang HB, Balzotti MR,
Kooyman DL, Arumuganathan K, Bonifacio A, Fairbanks DJ, Jellen EN, Stevens JJ
(2006) Construction of a quinoa (Chenopodium quinoa Willd.) BAC library and its use in
identifying genes encoding seed storage proteins. Theor Appl Genet 112:1593-1600
Tamarino G, Tingey S (1996) Simple sequence repeats for germplasm analysis and
mapping in maize. Genome 39:277-287
Tanksley SD, McCouch SR (1997) Seed bands and molecular maps: unlocking genetic
potential from the wild. Science 277:1063–1066
Tapia ME (1979) Historia y distribuición geográfica. In Tapia ME (ed) Quinua y
Kañihua. Cultivos Andinos. Serie Libros y Materiales Educativos No. 49. Instituto
Interamericano de Ciencias Agrícolas, Bogotá, Colombia, pp 11–15
Vos P, Hogers R, Bleeker M, Reijans M, Lee T, Hornes M, Frijters A, Pot J, Peleman J,
Zabeau M (1995) AFLP: a new technique for DNA fingerprinting. Nuclei Acids Res
23:4407-4414
Ward SM (2000) Allotetraploid segregation for single-gene morphological characters in
quinoa (Chenopodium quinoa Willd). Euphytica 116:11-16

73
Ward SM (2001) A recessive allele inhibiting saponin synthesis in two lines of Bolivian
quinoa (Chenopodium quinoa Willd.) J Hered 92:83–86
Wilkes G (1989) Germplasm preservation: objectives and needs. In: Knutson L, Stoner
AK (eds) Biotic diversity and germplasm preservation, global imperatives. Dluwer
Academic Publishers, Boston, Massachusets
Williams J, Kubelik A, Livak K, Ralski J, Tingey S (1990) DNA polymorphisms
amplified by arbitrary primers are useful as genetic markers. Acids Res 18:6531-6535
Wilson HD (1980) Artificial hybridization among species of Chenopodium sect.
Chenopodium. Syst Bot 5:252-263
Wilson HD (1988a) Quinoa biosystematics I: Domesticated populations. Econ Bot
42:461-477
Wilson HD (1988b) Quinoa biosystematics II: Free-living populations. Econ Bot 42:478-
494
Wilson HD, Heiser CB (1979) The origin and evolutionary relationships of ‘huauzontle’
(Chenopodium nuttaliae Safford), domesticated chenopod of Mexico. Am J Bot 66:198-
206

74
Yousef GG and Juvik JA (2001) Comparison of phenotypic and marker-assisted selection
for quantitative traits in sweet corn. Crop Sci 41:645-655

75
APPENDIX: SCORING DATA

76

77

78

79

80

81

82

83

84

85

86

87

88

89

90

91
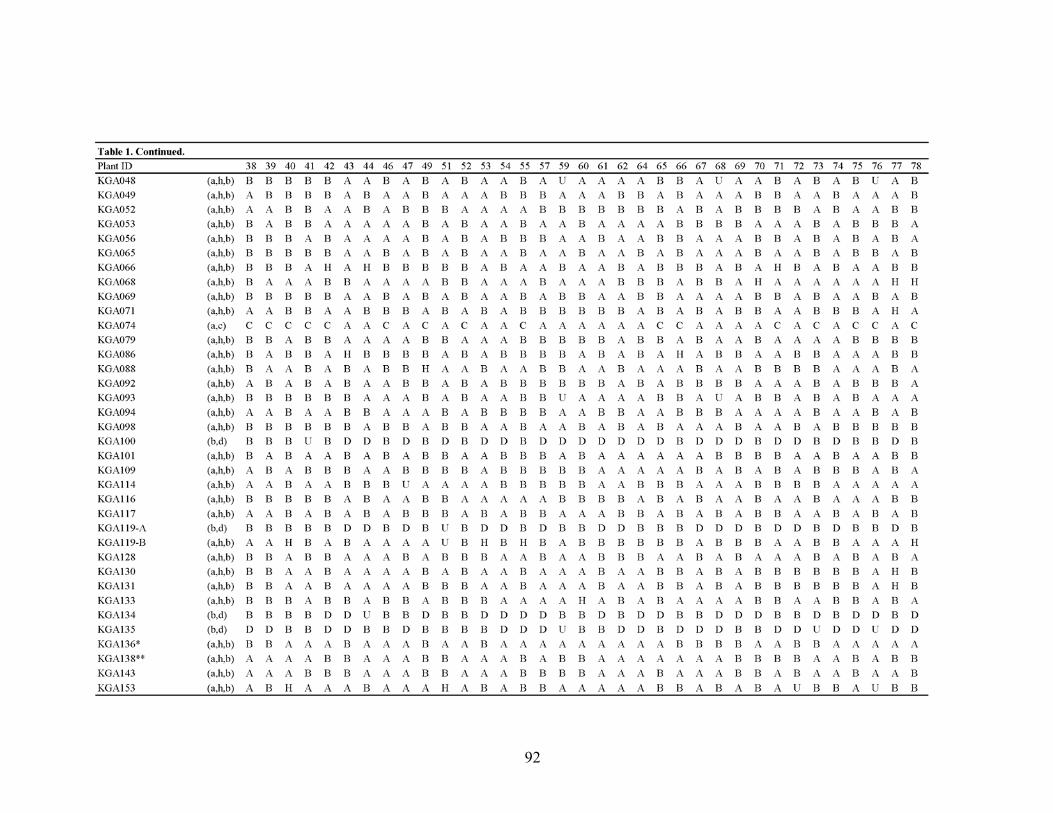
92

93

94

95

96

97

98

99

100

101

102

103

104

105

106

107

108

109

110

111

112

113

114
Related Documents