Similarity and Difference Pete Barnum January 25, 2006 Advanced Perception

Similarity and Difference Pete Barnum January 25, 2006 Advanced Perception.
Dec 11, 2015
Welcome message from author
This document is posted to help you gain knowledge. Please leave a comment to let me know what you think about it! Share it to your friends and learn new things together.
Transcript

Similarity and Difference
Pete Barnum
January 25, 2006
Advanced Perception
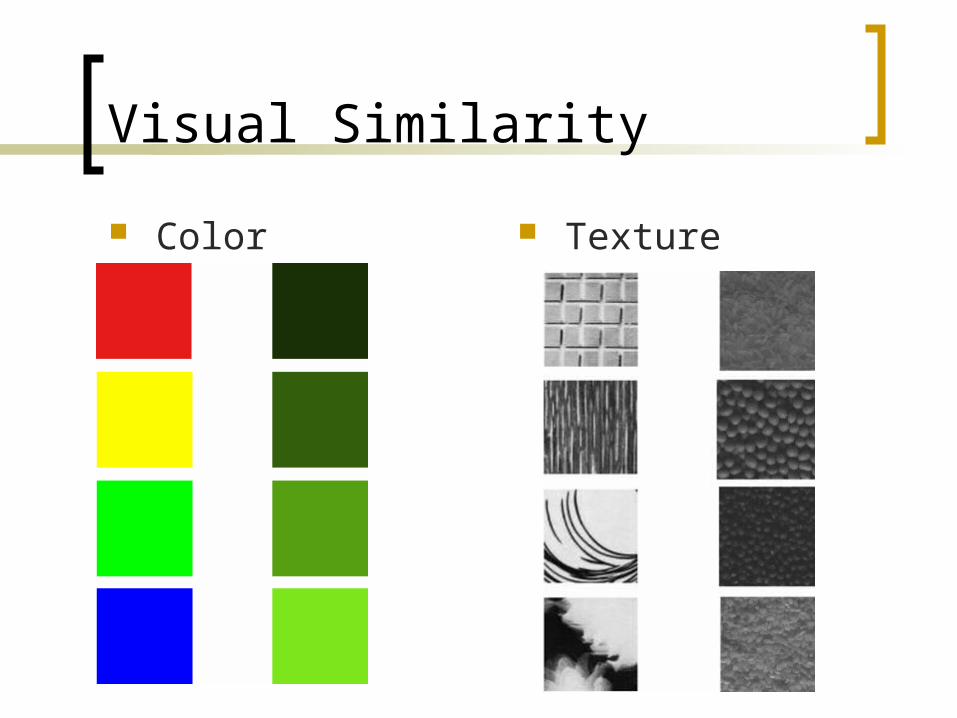
Visual Similarity
Color Texture
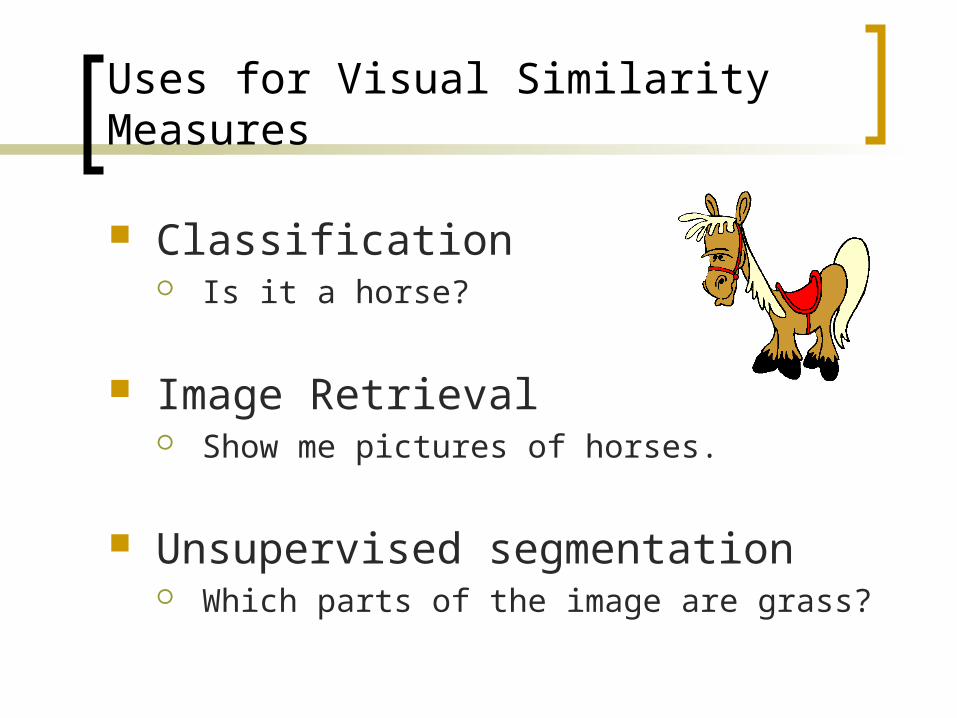
Uses for Visual Similarity Measures
Classification Is it a horse?
Image Retrieval Show me pictures of horses.
Unsupervised segmentation Which parts of the image are grass?
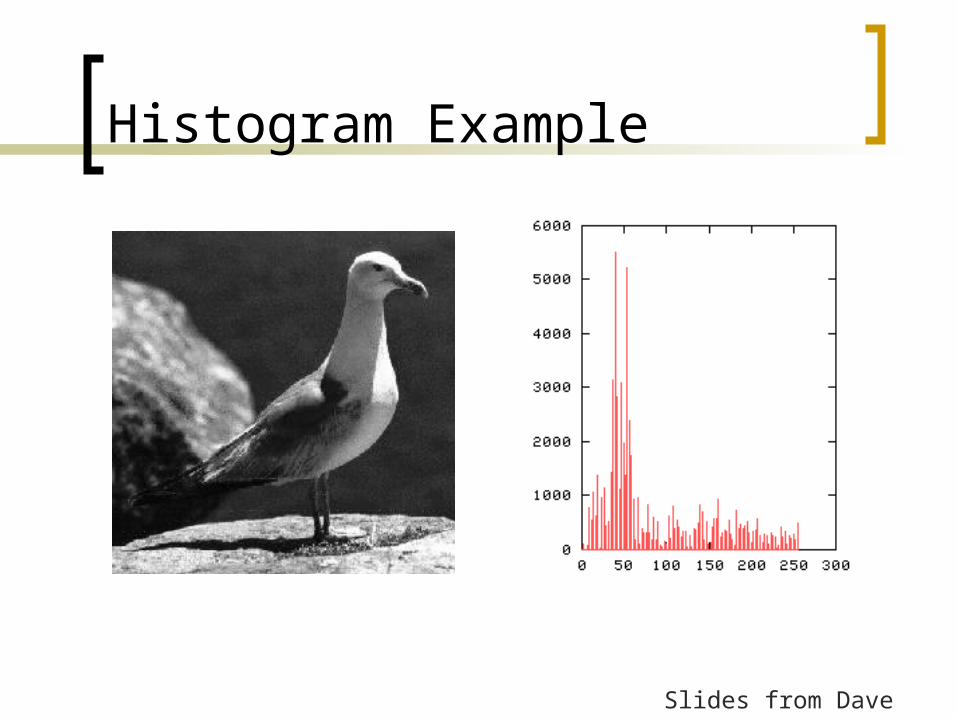
Histogram Example
Slides from Dave Kauchak
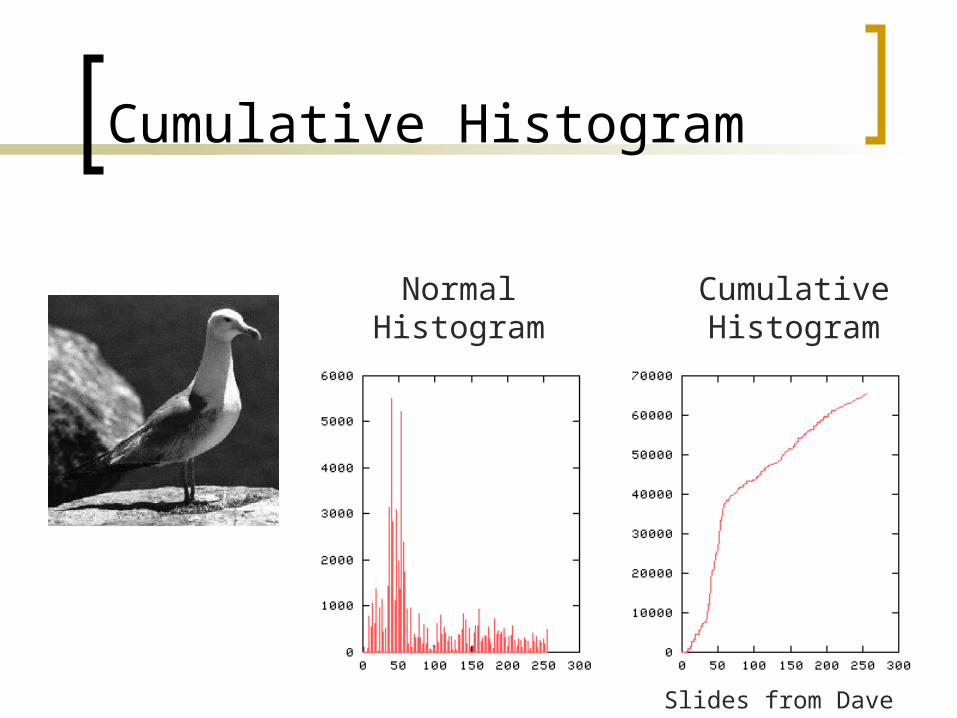
Cumulative Histogram
Normal Histogram
Cumulative Histogram
Slides from Dave Kauchak
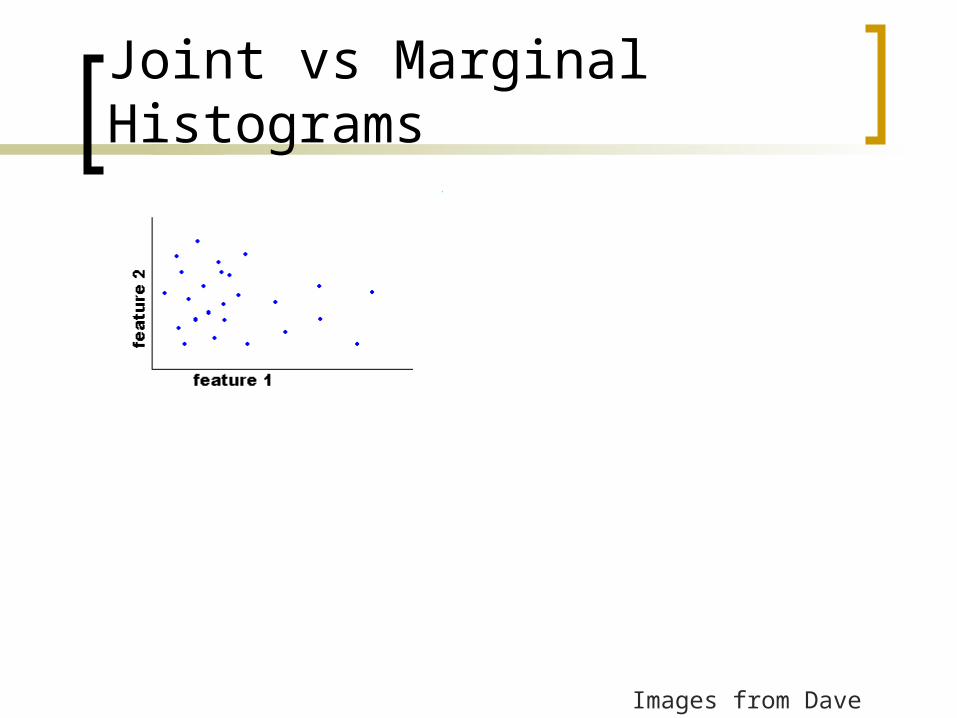
Joint vs Marginal Histograms
Images from Dave Kauchak

Joint vs Marginal Histograms
Images from Dave Kauchak
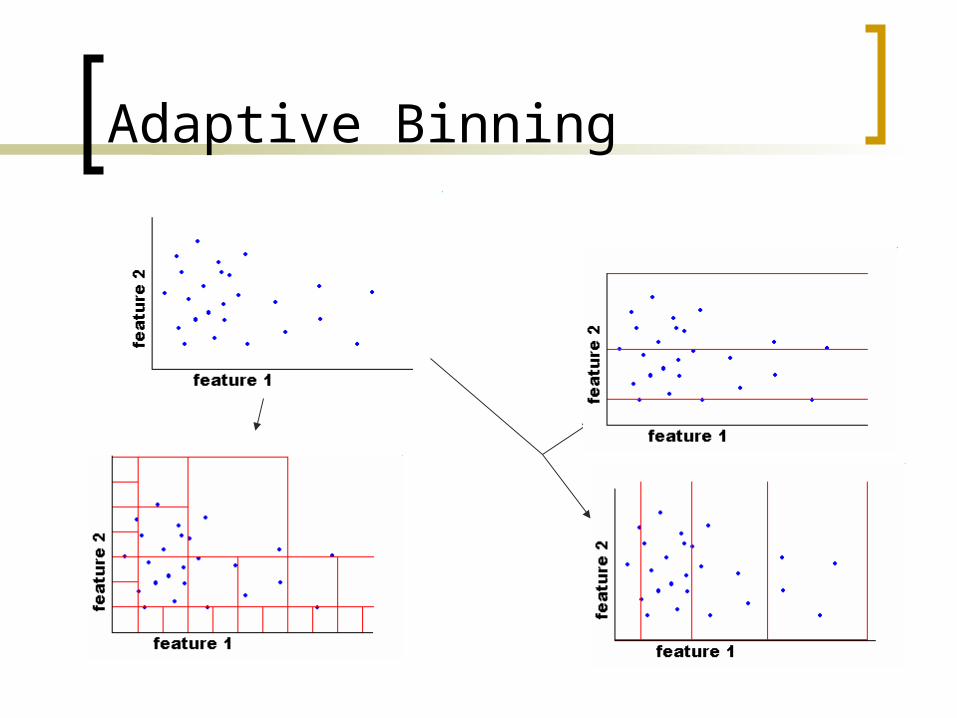
Adaptive Binning
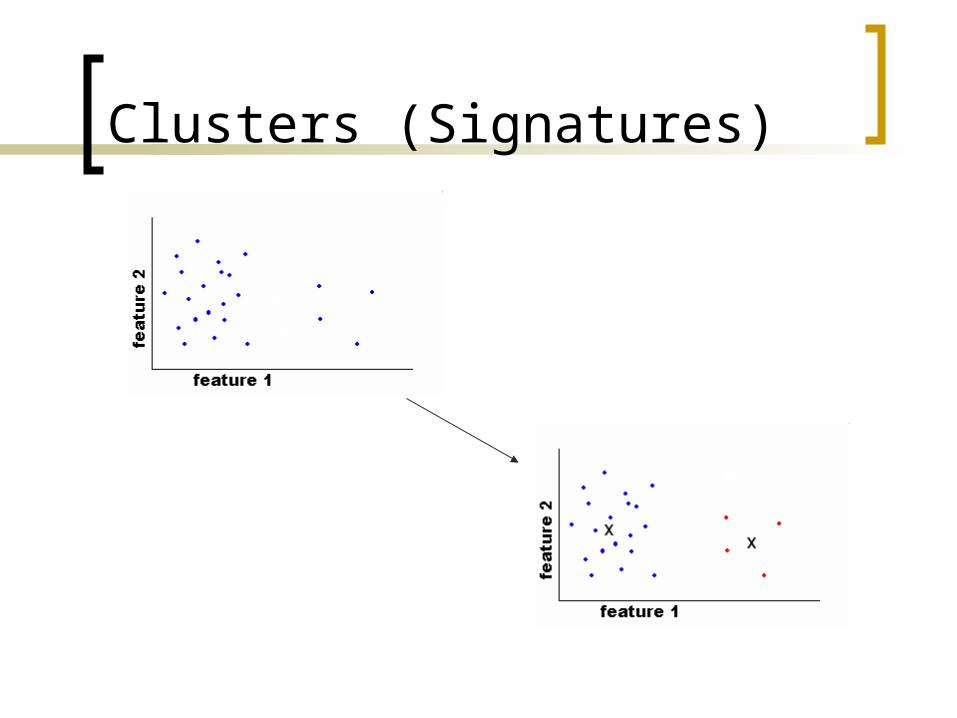
Clusters (Signatures)

Higher Dimensional Histograms
Histograms generalize to any number of features Colors Textures Gradient Depth
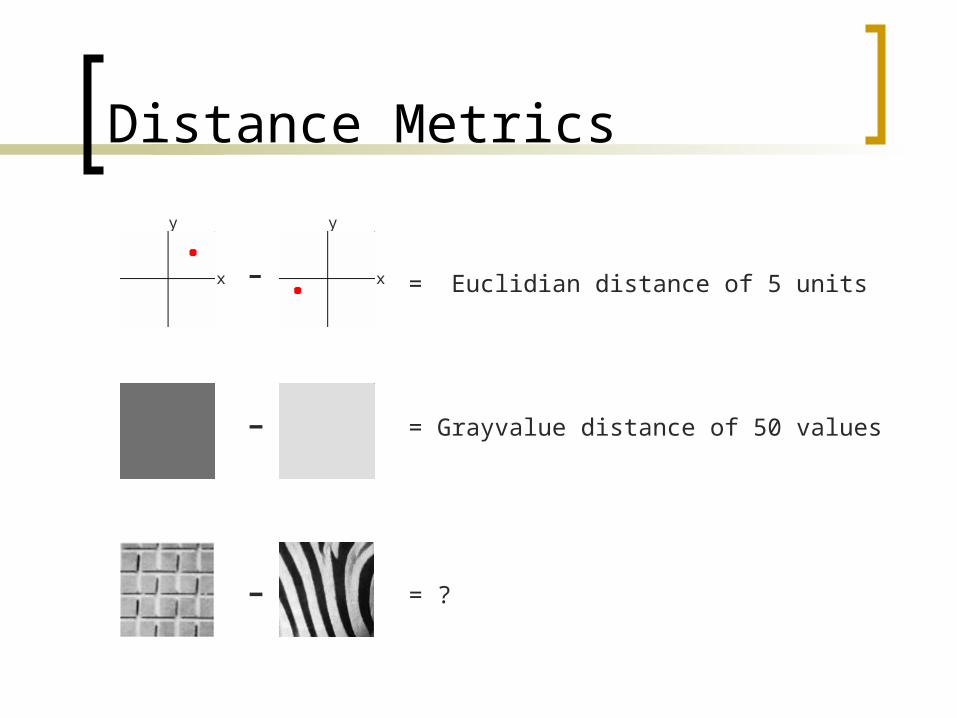
Distance Metrics
x
y
x
y
-
-
-
= Euclidian distance of 5 units
= Grayvalue distance of 50 values
= ?
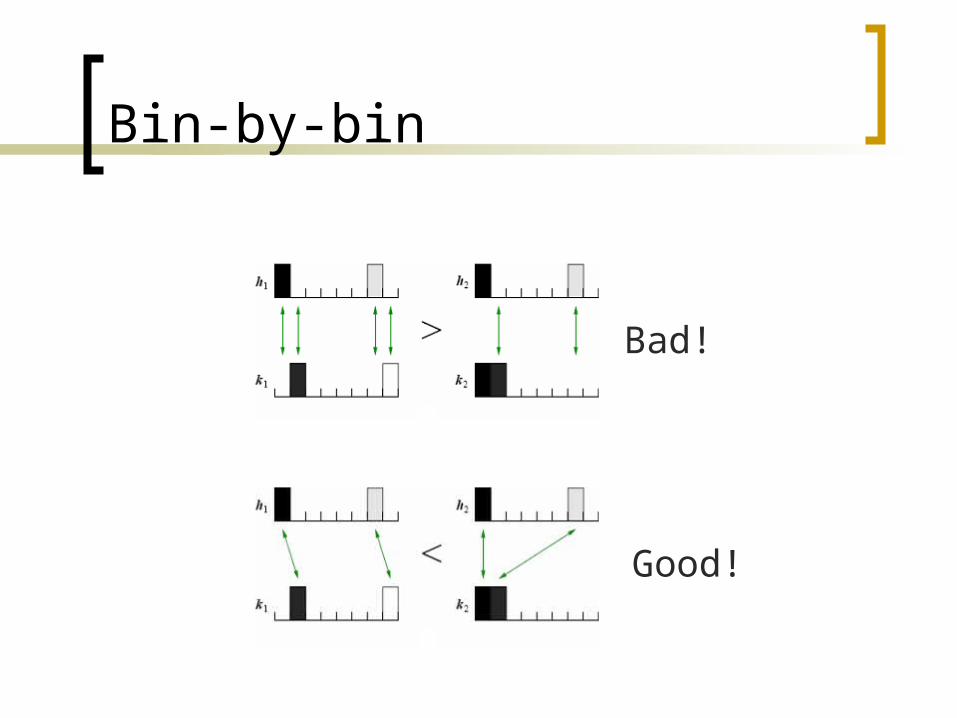
Bin-by-bin
Good!
Bad!
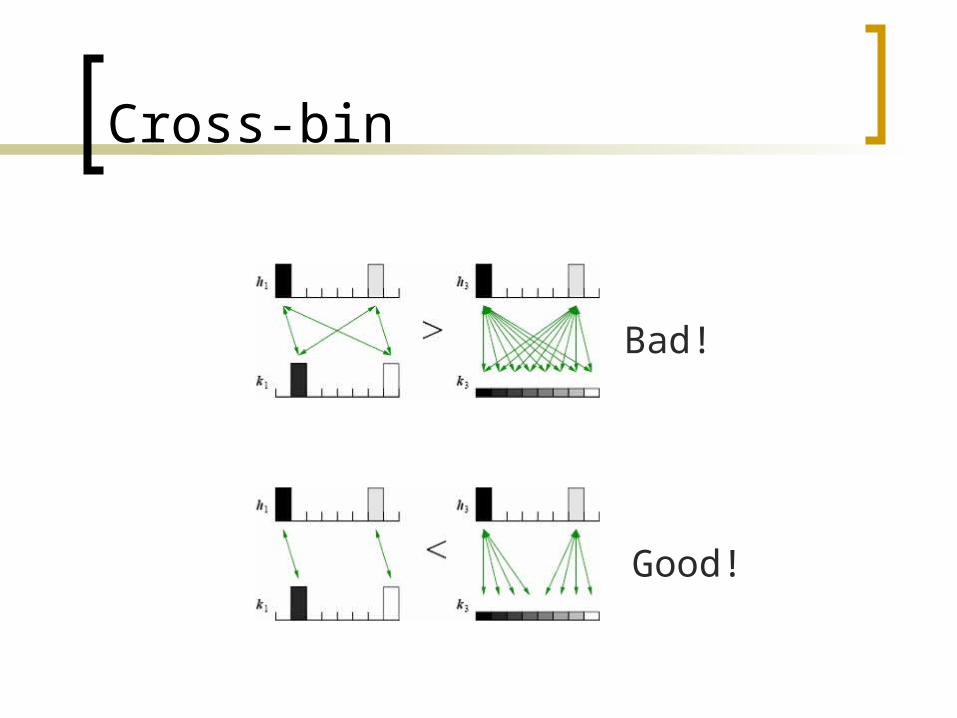
Cross-bin
Good!
Bad!
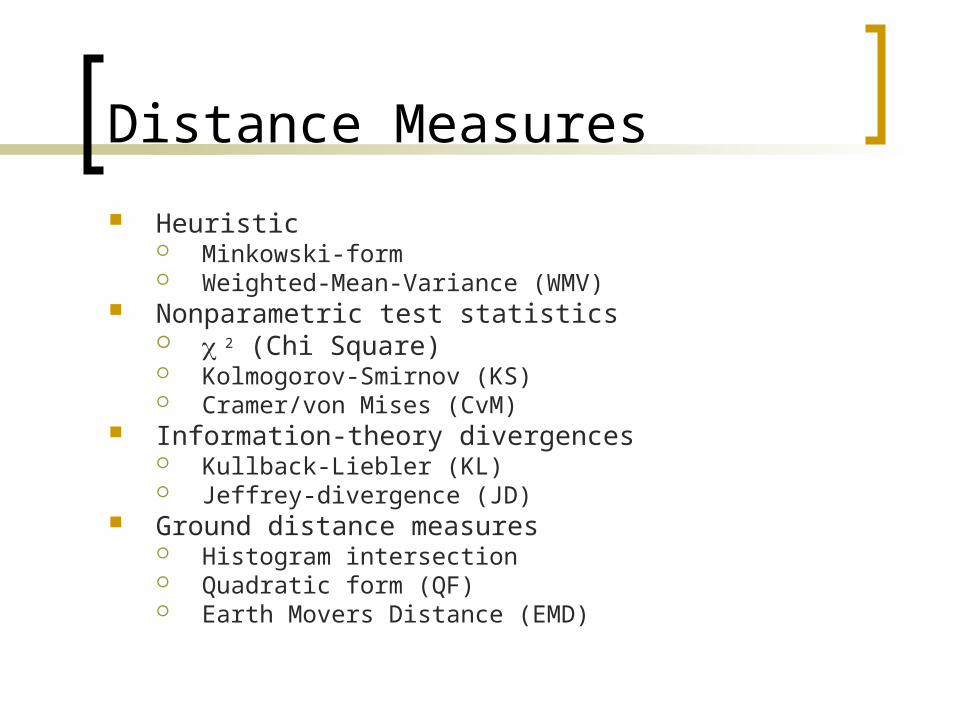
Distance Measures
Heuristic Minkowski-form Weighted-Mean-Variance (WMV)
Nonparametric test statistics 2 (Chi Square) Kolmogorov-Smirnov (KS) Cramer/von Mises (CvM)
Information-theory divergences Kullback-Liebler (KL) Jeffrey-divergence (JD)
Ground distance measures Histogram intersection Quadratic form (QF) Earth Movers Distance (EMD)
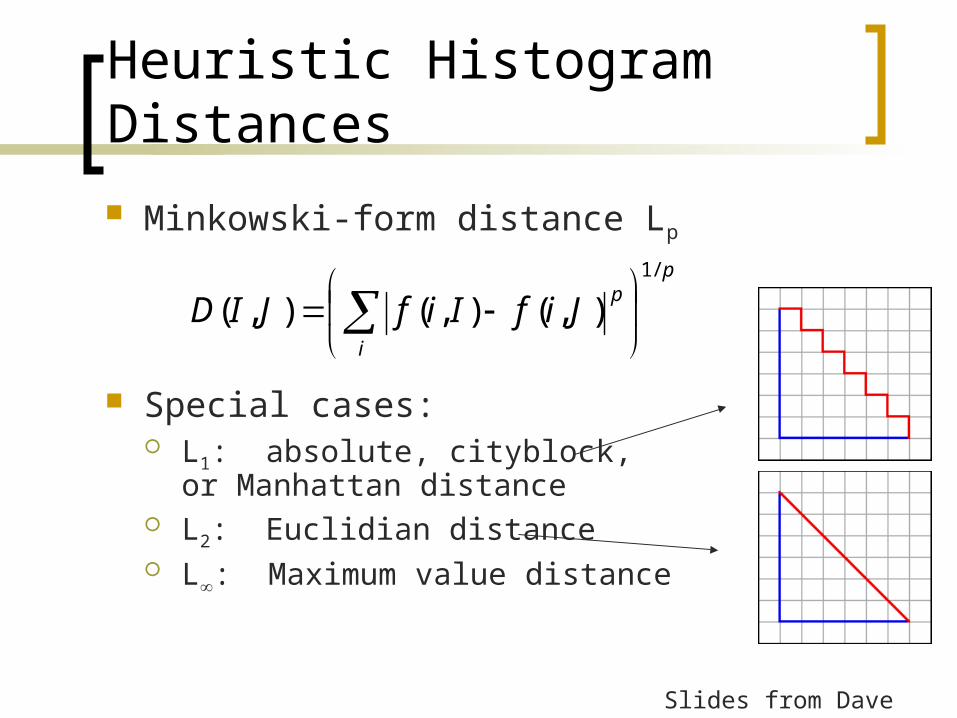
Heuristic Histogram Distances
Minkowski-form distance Lp
Special cases: L1: absolute, cityblock, or
Manhattan distance L2: Euclidian distance L: Maximum value distance
p
i
pJifIifJID
/1
),(),(),(
Slides from Dave Kauchak
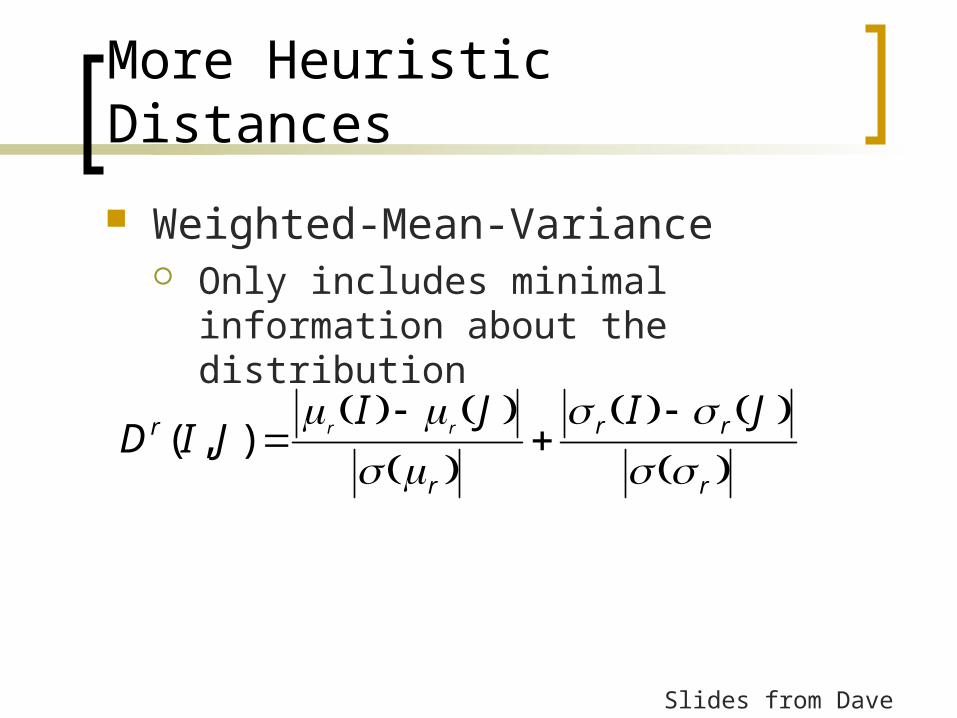
More Heuristic Distances
r
rr
r
r JIJIJID rr
),(
Slides from Dave Kauchak
Weighted-Mean-Variance Only includes minimal information about
the distribution
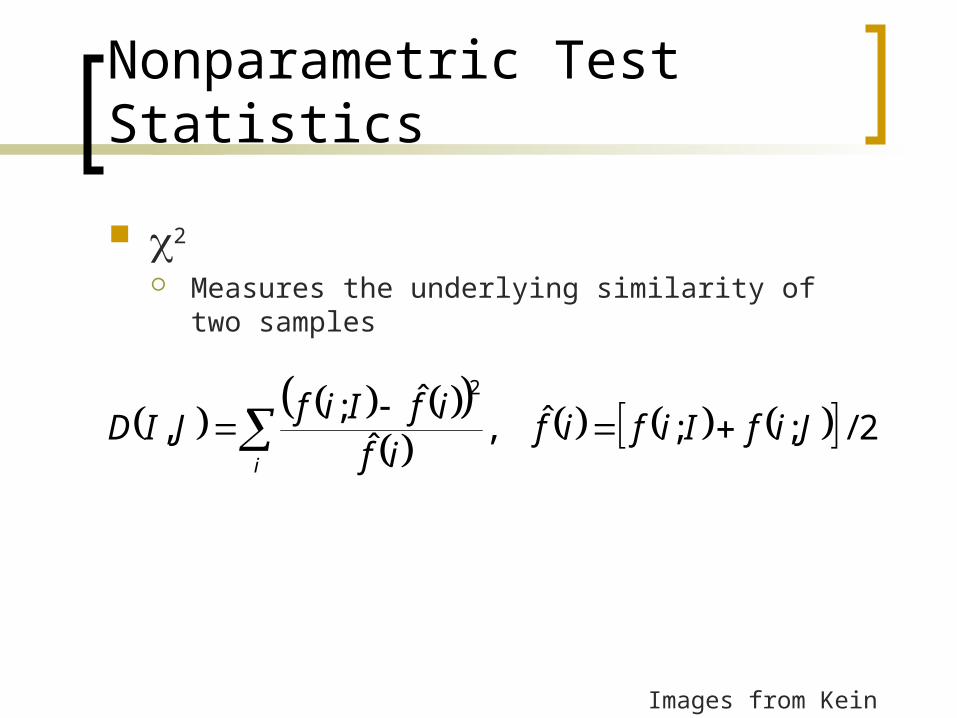
Nonparametric Test Statistics
2
Measures the underlying similarity of two samples
2/;;ˆ,
ˆ
ˆ;,
2
JifIififif
ifIifJID
i
Images from Kein Folientitel
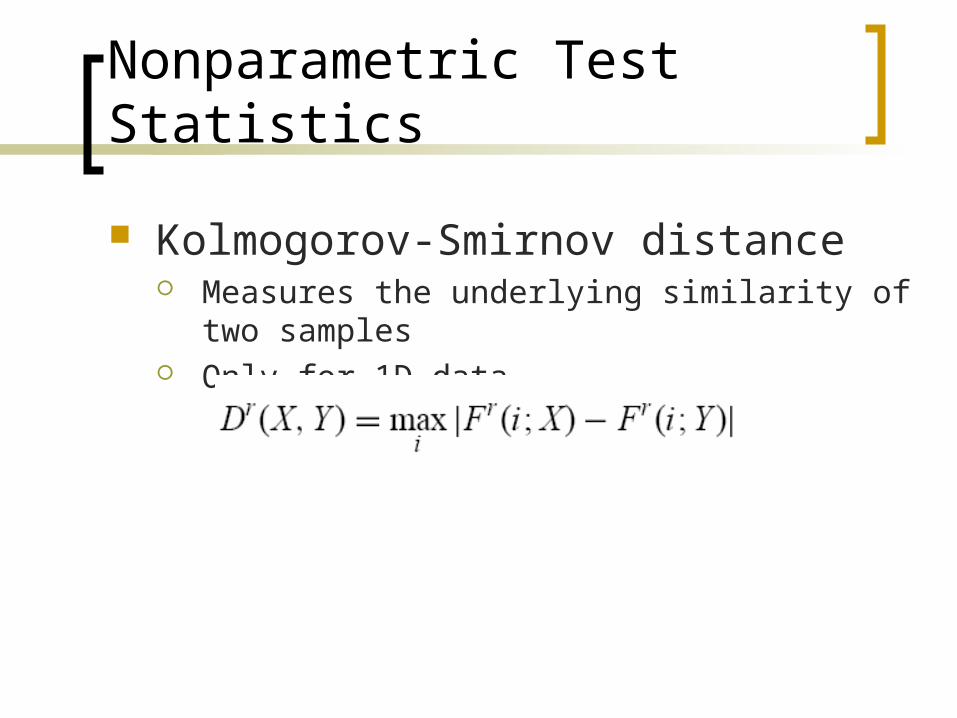
Nonparametric Test Statistics
Kolmogorov-Smirnov distance Measures the underlying similarity of two samples Only for 1D data
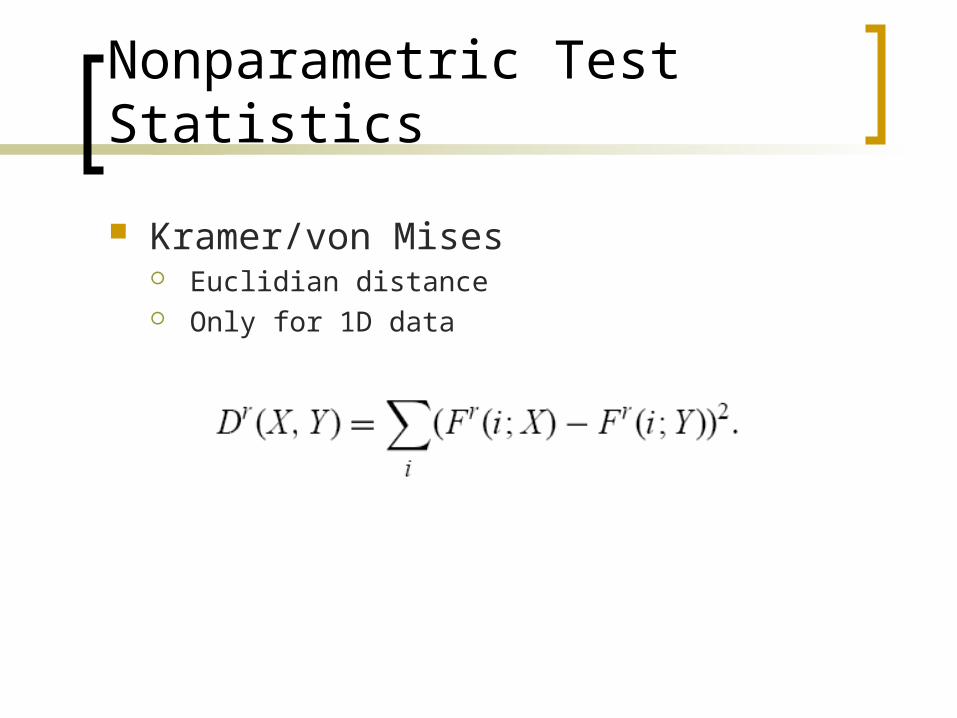
Nonparametric Test Statistics
Kramer/von Mises Euclidian distance Only for 1D data
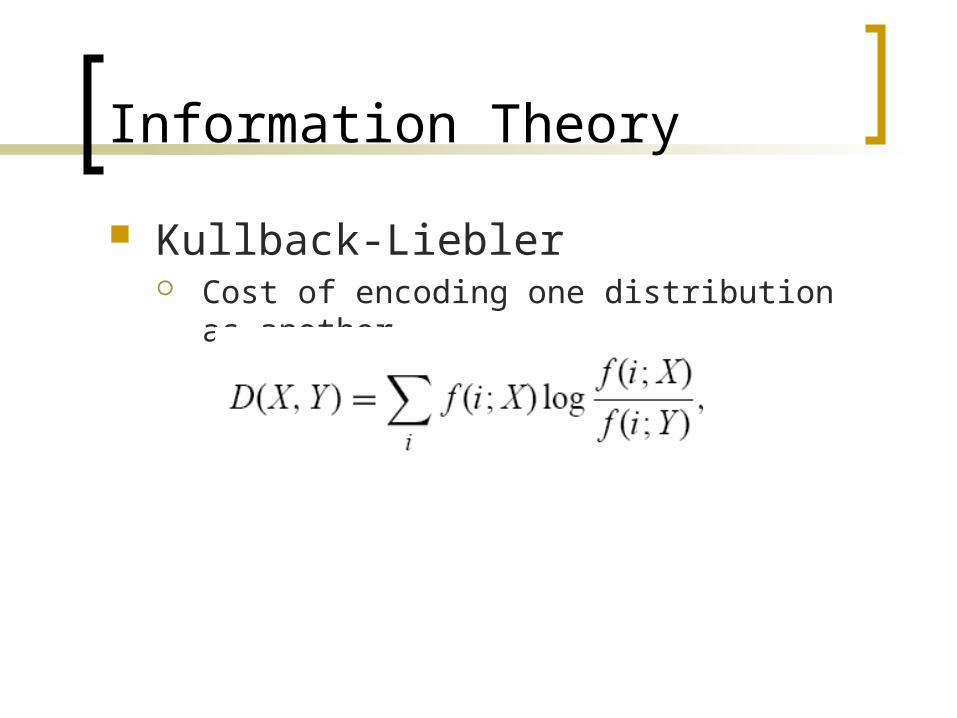
Information Theory
Kullback-Liebler Cost of encoding one distribution as another

Information Theory
Jeffrey divergence Just like KL, but more numerically stable
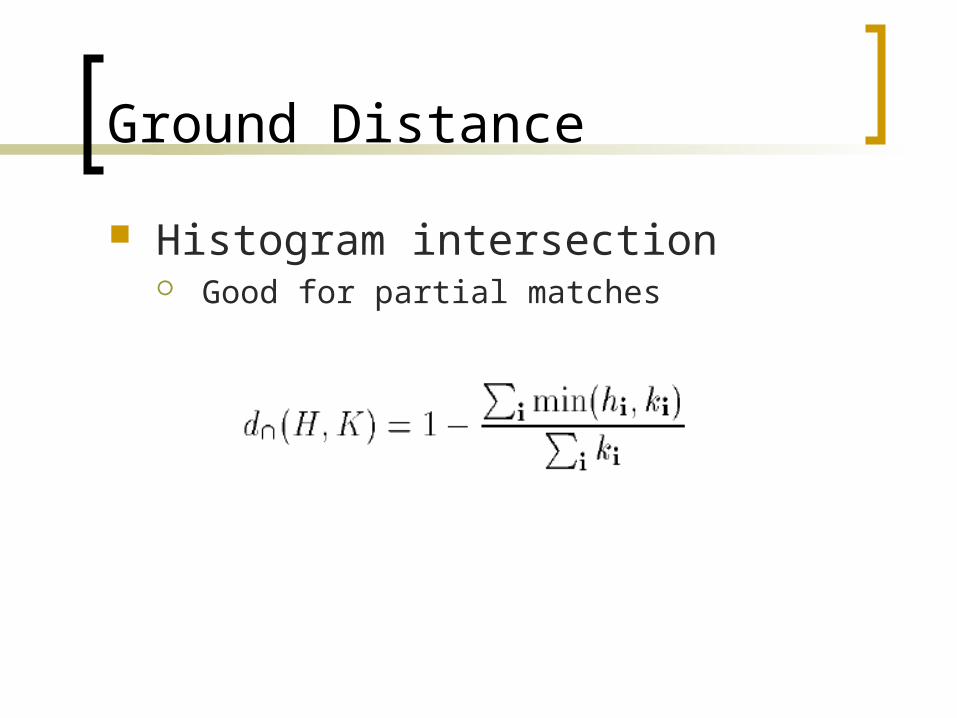
Ground Distance
Histogram intersection Good for partial matches

Ground Distance
Quadratic form Heuristic
JIt
JIJID ffAff,
Images from Kein Folientitel
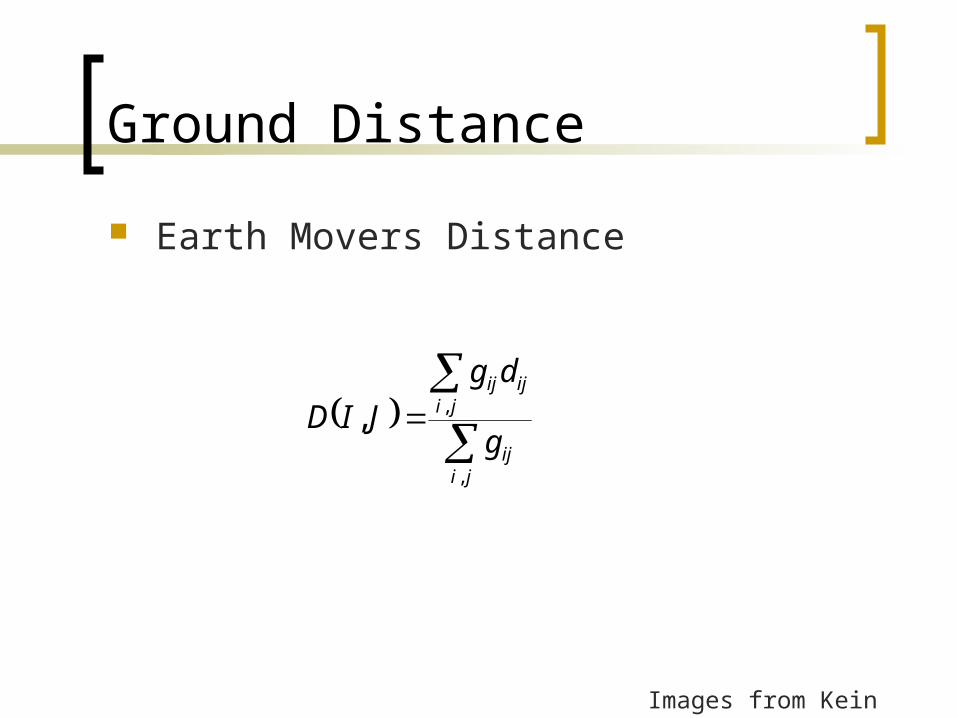
Ground Distance
Earth Movers Distance
Images from Kein Folientitel
jiij
jiijij
g
dg
JID
,
,,

Summary
Images from Kein Folientitel

Moving Earth
≠

Moving Earth
≠
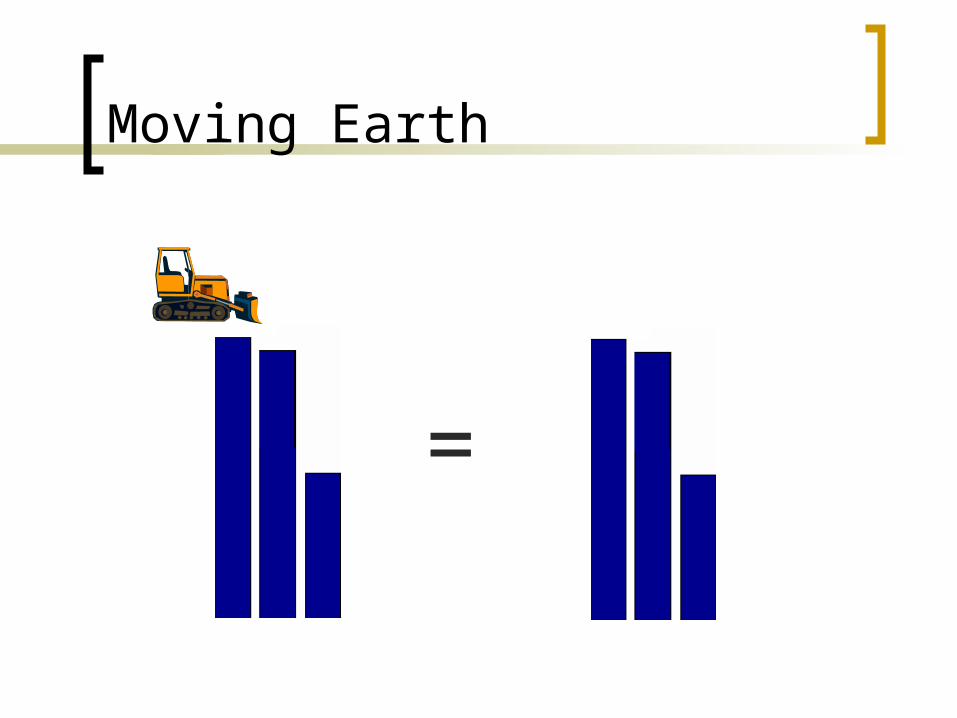
Moving Earth
=
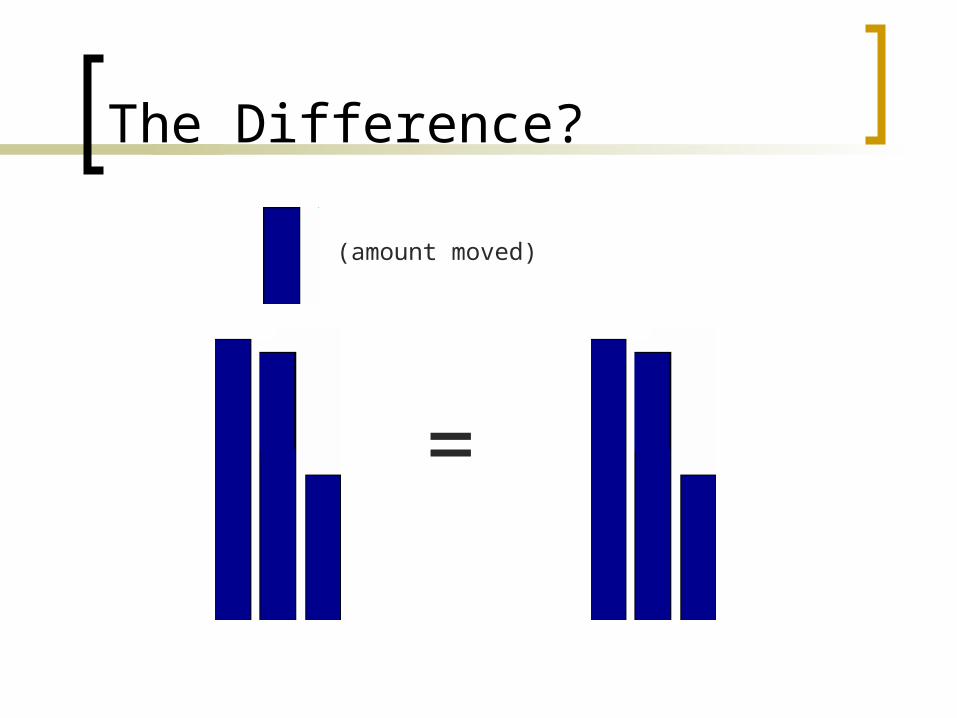
The Difference?
=
(amount moved)

The Difference?
=
(amount moved) * (distance moved)
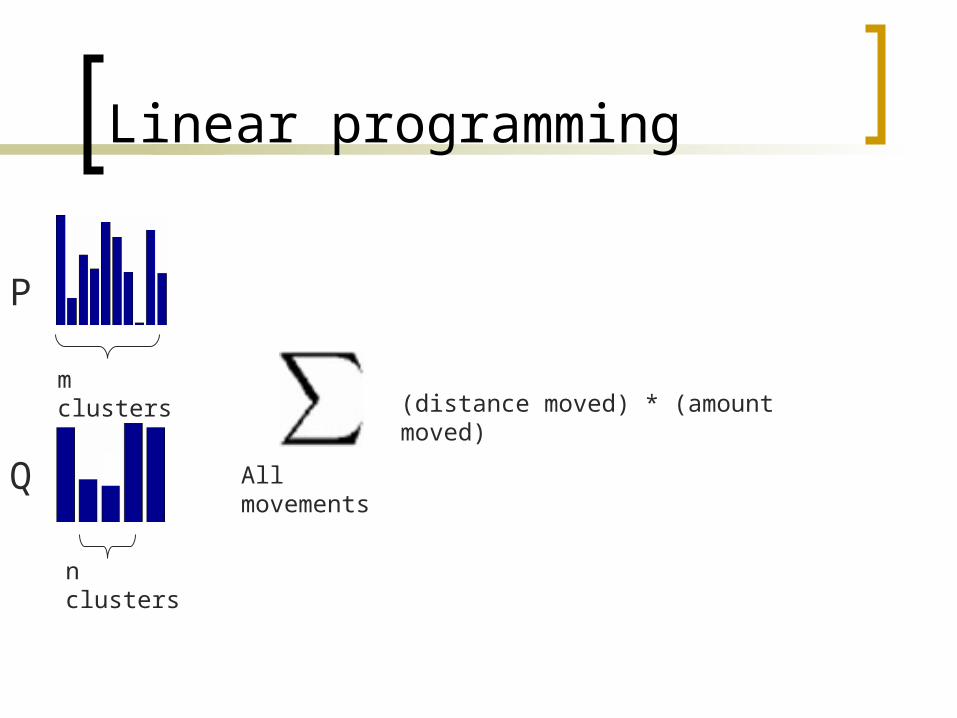
Linear programming
m clusters
n clusters
P
Q All movements
(distance moved) * (amount moved)

Linear programming
m clusters
n clusters
P
Q
(distance moved) * (amount moved)

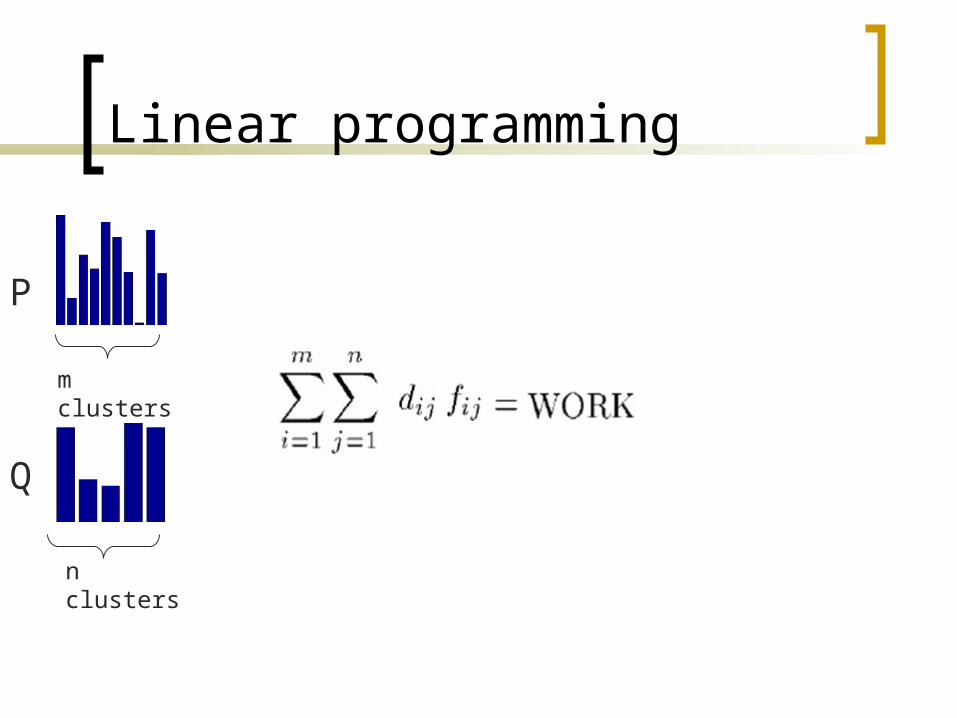
Linear programming
m clusters
n clusters
P
Q
* (amount moved)
Linear programming
m clusters
n clusters
P
Q
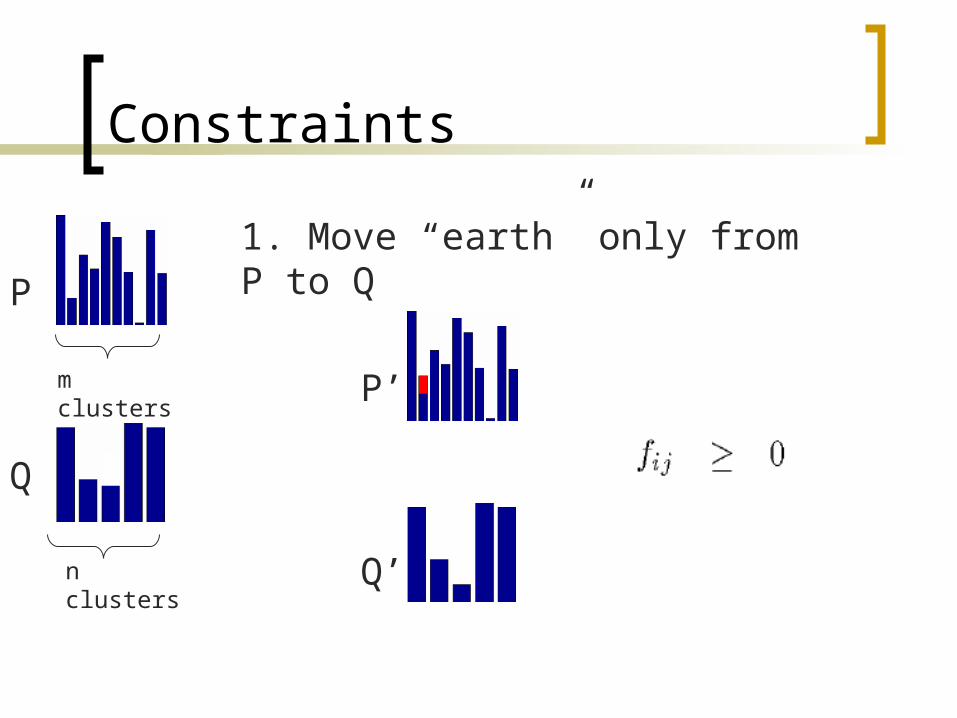
Constraints
m clusters
n clusters
P
Q
1. Move “earth” only from P to Q
P’
Q’
Constraints
m clusters
n clusters
P
Q
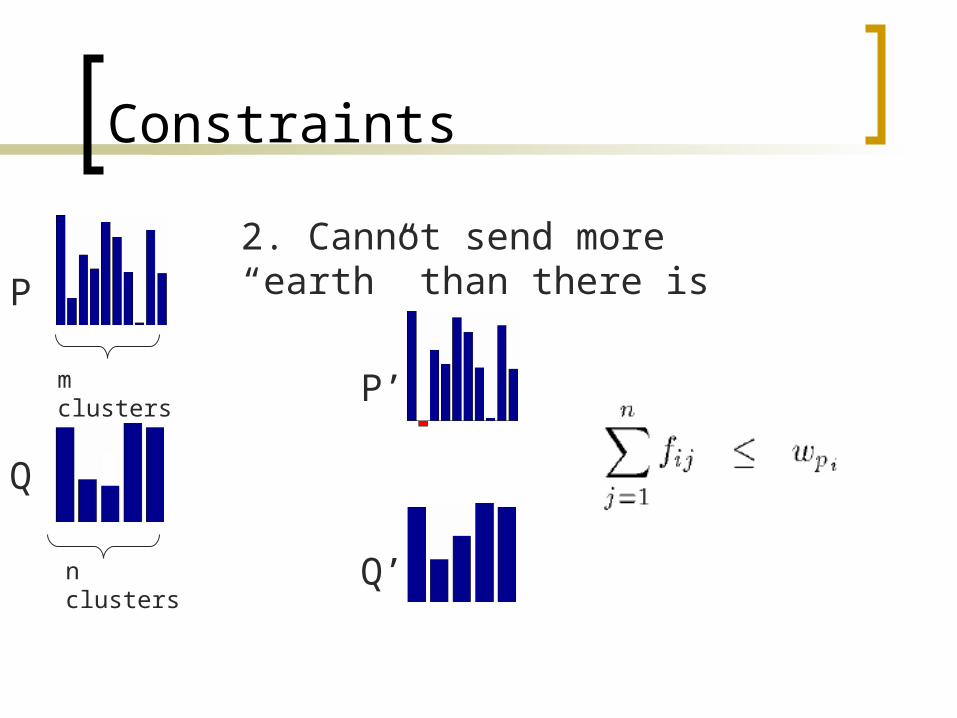
2. Cannot send more “earth” than there is
P’
Q’

Constraints
m clusters
n clusters
P
Q
3. Q cannot receive more “earth” than it can hold
P’
Q’
Constraints
m clusters
n clusters
P
Q
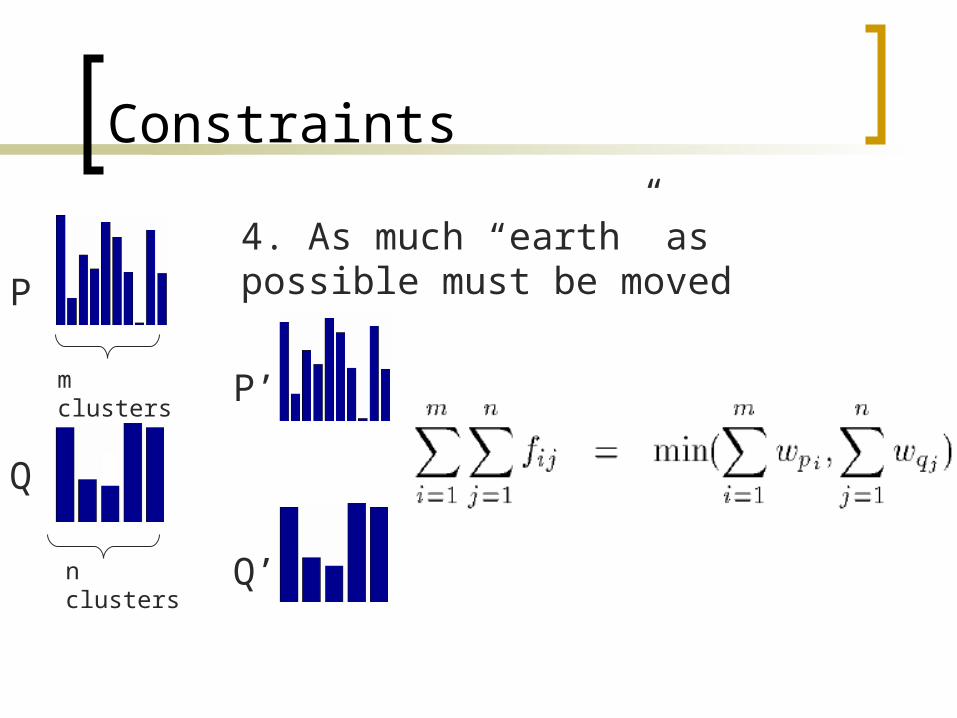
4. As much “earth” as possible must be moved
P’
Q’
Advantages
Uses signatures Nearness measure without
quantization Partial matching A true metric

Disadvantage
High computational cost Not effective for unsupervised
segmentation, etc.
Examples
Using Color (CIE Lab) Color + XY Texture (Gabor filter bank)
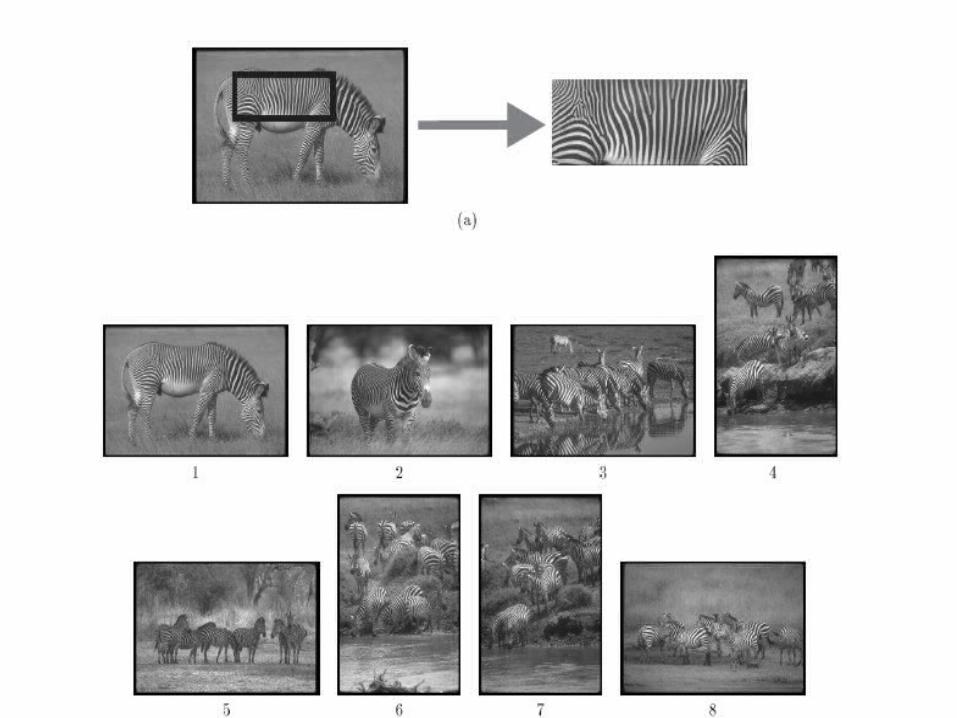
Image Lookup

Image LookupL1 distance
Jeffrey divergence
χ2 statistics
Quadratic form distance
Earth Mover Distance
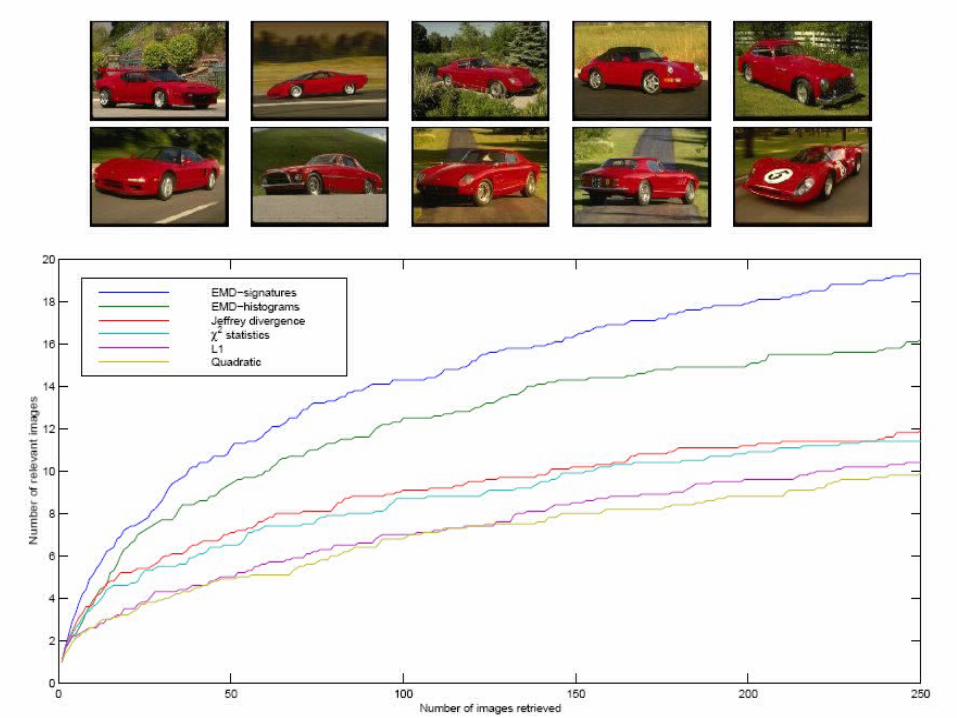
Image Lookup

Concluding thought
-
-
-
= it depends on the application
Related Documents