University of Nebraska - Lincoln DigitalCommons@University of Nebraska - Lincoln Publications from USDA-ARS / UNL Faculty U.S. Department of Agriculture: Agricultural Research Service, Lincoln, Nebraska 2012 Similar traits, different genes? Examining convergent evolution in related weedy rice populations Carrie S. urber University of Massachuses, [email protected] Melissa H. Jia USDA-ARS, [email protected] Yulin Jia USDA-ARS, [email protected] Ana L. Caicedo University of Massachuses, [email protected] Follow this and additional works at: hp://digitalcommons.unl.edu/usdaarsfacpub is Article is brought to you for free and open access by the U.S. Department of Agriculture: Agricultural Research Service, Lincoln, Nebraska at DigitalCommons@University of Nebraska - Lincoln. It has been accepted for inclusion in Publications from USDA-ARS / UNL Faculty by an authorized administrator of DigitalCommons@University of Nebraska - Lincoln. urber, Carrie S.; Jia, Melissa H.; Jia, Yulin; and Caicedo, Ana L., "Similar traits, different genes? Examining convergent evolution in related weedy rice populations" (2012). Publications om USDA-ARS / UNL Faculty. 1127. hp://digitalcommons.unl.edu/usdaarsfacpub/1127

Welcome message from author
This document is posted to help you gain knowledge. Please leave a comment to let me know what you think about it! Share it to your friends and learn new things together.
Transcript
University of Nebraska - LincolnDigitalCommons@University of Nebraska - Lincoln
Publications from USDA-ARS / UNL Faculty U.S. Department of Agriculture: AgriculturalResearch Service, Lincoln, Nebraska
2012
Similar traits, different genes? Examiningconvergent evolution in related weedy ricepopulationsCarrie S. ThurberUniversity of Massachusetts, [email protected]
Melissa H. JiaUSDA-ARS, [email protected]
Yulin JiaUSDA-ARS, [email protected]
Ana L. CaicedoUniversity of Massachusetts, [email protected]
Follow this and additional works at: http://digitalcommons.unl.edu/usdaarsfacpub
This Article is brought to you for free and open access by the U.S. Department of Agriculture: Agricultural Research Service, Lincoln, Nebraska atDigitalCommons@University of Nebraska - Lincoln. It has been accepted for inclusion in Publications from USDA-ARS / UNL Faculty by anauthorized administrator of DigitalCommons@University of Nebraska - Lincoln.
Thurber, Carrie S.; Jia, Melissa H.; Jia, Yulin; and Caicedo, Ana L., "Similar traits, different genes? Examining convergent evolution inrelated weedy rice populations" (2012). Publications from USDA-ARS / UNL Faculty. 1127.http://digitalcommons.unl.edu/usdaarsfacpub/1127
Similar traits, different genes? Examining convergentevolution in related weedy rice populations
CARRIE S. THURBER,* MELISSA H. J IA,† YULIN JIA† and ANA L. CAICEDO*
*Biology Department, University of Massachusetts, Amherst, MA 01003, USA, †USDA-ARS Dale Bumpers National Rice
Research Center, Stuttgart, AR 72160, USA
Abstract
Convergent phenotypic evolution may or may not be associated with convergent
genotypic evolution. Agricultural weeds have repeatedly been selected for weed-adaptive
traits such as rapid growth, increased seed dispersal and dormancy, thus providing an
ideal system for the study of convergent evolution. Here, we identify QTL underlying
weedy traits and compare their genetic architecture to assess the potential for conver-
gent genetic evolution in two distinct populations of weedy rice. F2 offspring from
crosses between an indica cultivar and two individuals from genetically differentiated
U.S. weedy rice populations were used to map QTL for four quantitative (heading
date, seed shattering, plant height and growth rate) and two qualitative traits. We iden-
tified QTL on nine of the twelve rice chromosomes, yet most QTL locations do not
overlap between the two populations. Shared QTL among weed groups were only seen
for heading date, a trait for which weedy groups have diverged from their cultivated
ancestors and from each other. Sharing of some QTL with wild rice also suggests a
possible role in weed evolution for genes under selection during domestication.
The lack of overlapping QTL for the remaining traits suggests that, despite a close
evolutionary relationship, weedy rice groups have adapted to the same agricultural
environment through different genetic mechanisms.
Keywords: flowering time, Oryza sativa, Quantitative trait loci, red rice, shattering
Received 14 March 2012; revision received 18 October 2012; accepted 21 October 2012
Introduction
The repeatability of adaptive evolution is an outstanding
question in biology. The presence of similar traits in
independently evolved lineages has often been docu-
mented (e.g. Schluter et al. 2004), and it has recently
become possible to determine the extent to which this is
a result of similar changes in shared genetic systems
(Stinchcombe & Hoekstra 2008). Shared genetic biases
among taxa that could result in disproportionate use of
the same genes are often invoked to explain the occur-
rence of trait convergence (e.g. Hodin 2000; Schluter
et al. 2004). These biases have been traditionally
believed to be more likely among closely related spe-
cies, suggesting that convergent phenotypic evolution
among relatives is more likely attributable to shared
genetic mechanisms (e.g. Arendt & Reznick 2007). To
date, however, studies that identify underlying genes
have revealed that convergent phenotypes can be due
to shared or distinct genes, as well as shared or distinct
mutations, both in closely and distantly related taxa (e.
g. Yoon & Baum 2004; Rompler et al. 2006; Steiner et al.
2008; Manceau et al. 2010; Powles & Yu 2010; Remige-
reau et al. 2011; Smith & Rausher 2011). Because pat-
terns have been slow to emerge, the extent to and
circumstances under which convergent phenotypic evo-
lution is due to shared genetic mechanisms is currently
an active area of inquiry.
Plants evolving in the agricultural environment offer
many examples of convergent phenotypic evolution.
For example, although domesticated in different world
regions, many cultivated grasses have experienced simi-
lar selective pressures by humans; crop grasses have
been selected for alterations in seed traits, annual life
cycles, increased selfing and decreased seed sheddingCorrespondence: Ana L. Caicedo, Fax: 413 545-3243;
E-mail: [email protected]
© 2012 Blackwell Publishing Ltd
Molecular Ecology (2012) doi: 10.1111/mec.12147
(Purugganan & Fuller 2009). Similarly, trait convergence
is often also evident in agricultural weeds – highly com-
petitive plants that repeatedly invade the disturbed
cropland soils (Basu et al. 2004). Despite sometimes
being unrelated, agricultural weeds often converge on
similar adaptive traits such as rapid growth, high seed
production, increased seed dispersal and deep roots
(Harlan & DeWet 1965; Ellstrand et al. 2010). Little is
currently known about the genetics underlying the evo-
lution of these so-called ‘weedy’ traits, but the prepon-
derance and diversity of agricultural weeds makes
these ideal systems for studies of the genetic basis of
convergent evolution.
Rice fields worldwide are often invaded by a weedy
type of rice known as weedy or red rice (Oryza sativa
L). Weedy rice is a major agricultural pest, as it is an
aggressive competitor that spreads rapidly and drives
down the quality of the rice harvest. Moreover, because
it is closely related to the crop it invades, weedy rice is
difficult to detect in its early growth stages and hard to
control with herbicides (Vaughan et al. 2001). While lim-
ited, studies of weedy rice in various world regions
suggest repeated origins of weedy populations (see
Olsen et al. 2007). The presence of multiple populations
of weedy rice around the world and their convergence
on some typical weed-adaptive traits offer a unique
opportunity to the study of convergent evolution at var-
ious geographic scales.
In the United States, where over 30% rice fields are
infested with weedy rice (Shivrain et al. 2009), two
major morphologically and genetically differentiated
populations of weedy rice co-occur. The Straw Hulled
(SH) group most closely resembles cultivated rice with
straw-coloured hulls and slightly larger grains; the
Black Hulled & Awned (BHA) group often resembles
wild rice, with black- or brown-coloured hulls, small
grains and long awns (Vaughan et al. 2001; Londo &
Schaal 2007; Reagon et al. 2010). Genome-wide assess-
ments of polymorphism indicate that SH and BHA
weedy populations are more closely related to indica
and aus variety groups of domesticated Asian rice,
respectively, than to other major cultivated or wild
Oryzas (Reagon et al. 2010). Although there is debate
over how many times Asian rice was domesticated, it is
well accepted that cultivated rice was domesticated
from Asian wild rice (Orzya rufipogon/Oryza nivara),
with subsequent diversification of variety groups. Culti-
vated rice varieties are thus genetically differentiated,
and the aus and indica putative ancestors of U.S. weedy
rice groups are more closely related to each other (and
more likely to share a domestication origin) than they
are to the japonica cultivars grown in the United States
(Garris et al. 2005; Caicedo et al. 2007). The origins of
U.S. weedy rice from crop ancestors suggest that the
evolution of weedy traits in these groups could be a
process of ‘de-domestication,’ whereby selection favours
reversions of domestication traits to forms characteriz-
ing wild species. This in turn suggests a different level
at which convergent genetic evolution could occur: con-
vergence of weedy and wild traits could be acquired
through mutations in the same genes that were targeted
during domestication.
U.S. weedy rice exhibits many traits that are associ-
ated with the persistence of weeds, such as increased
seed dormancy and seed shattering, faster growth, taller
plants and modified flowering times (Delouche et al.
2007; Shivrain et al. 2010). We have previously charac-
terized some of these weedy traits relative to the puta-
tive cultivated progenitors and have noted different
degrees of phenotypic convergence. For example,
weedy rice from both SH and BHA are highly prone to
shattering, a trait that is absent in the domesticated pro-
genitors (Noldin et al. 1999; Thurber et al. 2010) (Table
S1, Supporting information). Likewise, higher growth
rates have been observed for SH and a subpopulation of
BHA compared with their ancestors (Reagon et al. 2011).
In contrast, flowering time (i.e. heading date) is strongly
in differentiated in both weed groups compared with
their cultivated progenitors, but the shifts are in opposite
directions: under day neutral conditions (12 hours light),
SH flowers significantly earlier than indica, whereas BHA
groups flower significantly later than aus (Reagon et al.
2011) (Table S1, Supporting information). In field condi-
tions, blackhull weeds also typically flower later than
strawhull weeds (Shivrain et al. 2009). Thus, although the
same trait has been affected in the course of weed evolu-
tion, there has not been convergence on a single pheno-
typic value. A similar situation is seen for plant height.
Weedy rice shows a range of heights, but under-con-
trolled conditions, SH weeds are generally shorter than
their indica progenitors, and BHA weeds are generally
taller than the aus (Reagon et al. 2011) (Table S1, Support-
ing information). In the field, both weed groups tend to
be taller than the local japonica crop (Shivrain et al. 2009),
likely driven by the recent selection for semi-dwarf high-
yielding rice plants (see Asano et al. 2007). Remarkably,
these divergent weedy phenotypes have evolved under
near identical selective pressures, as weedy rice from
both populations is often found in the same rice fields
(Shivrain et al. 2010).
Given the convergence of phenotypic values for some
traits and divergent evolution for others, we are interested
in determining to what extent common loci underlie
weedy trait evolution in U.S. weedy rice groups. In par-
ticular, we would like to answer the following ques-
tions: (i) Do weedy rice populations share QTL
underlying convergent traits? (ii) Do weedy rice popula-
tions utilize different QTL for divergent phenotypes?
© 2012 Blackwell Publishing Ltd
2 C. S . THURBER ET AL.
(iii) Are QTL shared when weedy traits mimic those of
wild rice? We hypothesized that, given the weeds’ des-
cent from cultivated ancestors sharing a domestication
origin, U.S. weedy rice groups are likely to have shared
biases leading to use of the same genes in weedy trait
evolution. We conducted crosses of each US weed with
a putative progenitor or close relative to capture the
genetic differences that have accumulated since each
weed group diverged from a cultivated background.
Using F2 populations, we carried out QTL mapping of
four quantitative traits that have either converged or
diverged between weedy rice groups, as well as two
qualitative traits specific to the BHA group that have
converged on wild rice phenotypes. Our goal was not to
identify causal genes but to begin assessment of the
degree to which shared genomic regions underlie weedy
traits. We find that, in most cases, similar genomic
regions are not involved in traits characterizing weedy
rice groups; the exception to this is flowering time,
which, although divergent among groups, may involve
modification of alternative alleles at loci involved in the
Oryza flowering time pathway.
Methods
Plant materials
We created two mapping populations (S and B) by
crossing two weedy rice individuals (SH-RR09 and
BHA-RR20) with a single indica cultivar Dee Geo Woo
Gen (DGWG), which in both cases was the pollen
donor. The weedy rice parents are representatives of the
SH and BHA populations of U.S. weedy rice as deter-
mined by population structure assessments (Reagon
et al. 2010). The indica cultivar group was chosen as a
parent because this group is putatively ancestral to the
SH weed group and is closely related to the BHA
ancestor, aus (Caicedo & Purugganan 2005; Garris et al.
2005; Reagon et al. 2010); multiple attempts to cross-
BHA weeds with aus cultivars failed. Weed and crop
parents were selected to maximize phenotypic differ-
ences in potential weed-adaptive traits based on previ-
ous growth chamber data (Table 1). Reciprocal crosses
did not work for the BHA 9 indica cross, thus assess-
ment of maternal effects was not attempted. All parents
are inbred lines, self-fertilized multiple times prior to
acquisition from the International Rice Research Center
and the USDA, and further selfed 1–3 generations in
our laboratory prior to crossing. The resulting F1 plants
largely showed phenotypes intermediate between the
two parents; the single exception was the B population
F1, which produced seeds with black hulls and awns
suggesting that these traits are controlled by few genes
in which the BHA allele is dominant. F1 plants were
confirmed to be the result of crosses and were allowed
to self to create the F2 seeds used for mapping.
Approximately 250 F2 seeds per population, offspring
from a single F1 for each cross, were sown in a green-
house in Amherst, MA on 1 April 2010 in four-inch
pots set in two-inch trays of ten pots each. Seeds were
heat treated for twelve hours at 37oC, and the hulls
were partially or totally removed prior to planting to
eliminate dormancy. Approximately 25 trays per popu-
lation were interspersed randomly throughout the
greenhouse. Three replicate pots of each parental line
were also sown in a single tray in the greenhouse to
serve as phenotypic controls. Water was maintained at
a height of approximately one to two inches in trays to
keep soil moist, and fertilizer (NPK 15-16-17) was
applied weekly with an added iron application on
alternate weeks. Environmental conditions varied sea-
sonally, with day-length varying between approxi-
mately 10 and 15 h light and temperature varying
between 20 and 27°C. The emergence date of F2 seed-
lings was not uniform within each population despite
dormancy-releasing treatment. Due to inadequate F2germination, two additional waves of planting were
performed with approximately 100 seeds on 22 April
2010 and 13 May 2010. As different planting dates likely
put seedlings under different light and temperature
environments, we compared trait distributions and
averages for heading date, plant height and seed shat-
tering across planting waves. No differences were
observed for any trait (data not shown). Additionally,
no differences were observed in the QTL detected using
only the first wave individuals and the full data set;
thus, we used all three waves to increase our statistical
power. Final experimental plants were harvested on 20
January 2011. 184 S population and 159 B population
individuals were phenotyped and genotyped success-
fully and were usable for mapping.
Trait evaluation
Four quantitative traits, heading date, plant height,
growth rate and seed shattering, were evaluated in each
F2 population (Tables S2 and S3, Supporting informa-
tion). Additionally, two qualitative traits, hull colour
and awns, were evaluated in the B population, as these
traits did not differ between S population parents
(Table S3, Supporting information). Heading date was
measured in days from the date of seedling emergence
until the first panicle had emerged halfway from the
boot. Panicles were bagged at this stage to ensure sel-
fing and prevent loss of seeds. Plant height was mea-
sured in centimetres, at heading, from the base of the
plant at the soil to the tip of the tallest panicle exclud-
ing awns. Growth rate was calculated by dividing plant
© 2012 Blackwell Publishing Ltd
CONVERGENT EVOLUTION IN WEEDY RICE 3

height by heading date to get an average rate in cm/day.
Seed shattering was measured in grams of force
required to remove the seed from the panicle; measure-
ments were taken from 10 mature seeds collected
30 days after heading and averaged per individual as
described in Thurber et al. (2010). Hull colour was
scored as straw (0) and black (1) on seeds collected
thirty days after heading. A small number (<20) of indi-viduals showed brown or gold hull colours and were
not considered for analysis. Awns were recorded as
presence (1) vs. absence (0) at the same time hull colour
was scored. Pairwise Pearson’s correlation coefficients
were calculated in Excel for trait values in each map-
ping population.
Broad-sense heritability (H2) for each trait in each
population was calculated as in Xu et al. (2009).
Briefly, variance for each parental line was estimated
in the greenhouse environment, and the average of the
parental variances was used as the environmental vari-
ance (Ve) for each mapping population. Ve was sub-
tracted from the total phenotypic variance of the F2population (Vp) to obtain the genetic variance (Vg).
Because estimates from our parental lines likely under-
estimate Ve, a maximum H2 was calculated as Vg/Vp
for each trait.
Marker analysis
DNA was extracted from frozen tissue collected from
greenhouse grown F2 plants using a CTAB method
(Reagon et al. 2010). Over 188 microsatellite (SSR) mark-
ers from previously published studies (e.g. Chen et al.
1997; McCouch et al. 2002) were genotyped in the three
parental lines. SSR markers are identified as numbers
that correspond to the ‘RM’ markers from previous
studies. Additionally, two and six insertion–deletion
(indel) markers were adapted from Shen et al. (2004) for
the S and B populations, respectively. These were given
names R#M#. Lastly, five additional SNP markers
(labelled as c#p# corresponding to the chromosome and
physical position of the marker) and three additional
indel markers (labelled i#) were developed from whole-
genome sequence data (K. E. Hyma & A. L. Caicedo,
unpublished data).
Indel and SSR markers were PCR amplified similar to
Panaud et al. (1996) except that the reaction volume
was reduced to 15 ll and PCR cycling conditions were
as follows: 94°C for 5 min, followed by 35 cycles of
94°C for 30 s, 55°C for 30 s, and 68°C for 1 min; finished
by 5 min at 72°C. SNP markers were amplified as above
in two separate reactions (one with a forward primer
unique to the weedy allele and one unique to the culti-
vated allele), with the exception that a TouchDown
PCR was carried out starting 10 degrees above the
expected melting temperature (Tm) and decreasing 1°every cycle, followed by 25 cycles at the target Tm.
Indel and SNP marker genotypes were directly scored
from 2% agarose gels. Amplified SSR products were
run on an ABI 3130XL genetic analyzer at the Genomics
Resource Laboratory at the University of Massachusetts.
FSA files were analysed using the PeakScanner software
to determine the sizes of bands. All marker genotypes
were scored as 0, 1 or 2 depending on whether the
individual was homozygous for the cultivated allele,
heterozygous or homozygous for the weedy allele,
respectively.
Marker segregation analysis was carried out using
chi-square tests to detect significant distortion from
Mendelian inheritance. Linkage maps were created
using the Kosambi map function under default condi-
tions in R/qtl, resulting in maps of approximately 1550
–1700 cM. A ripple function was used to test alternative
marker order. Only three rearrangements were
suggested, and subsequent mapping did not lead to dif-
Table 1 Phenotypes of the parental lines crossed to create F2 mapping populations. Plants were initially chosen for their different
phenotypes in the growth chamber. Greenhouse measurements are averages of three plants. Growth chamber measurements
are averages of two plants, and have been reported in Thurber et al. (2010) and Reagon et al. (2011). Numbers in parentheses are
standard deviations
Parental line Plant height (cm) Heading date (days) Growth rate (cm/day) Seed shattering* (g) Hull color Awn
Greenhouse
Weedy-SH 76.8 (5.12) 107.3 (0.96) 0.716 (0.04) 0 (0) 0 0
Cultivated 42.7 (7.02) 101 (3.46) 0.423 (0.06) 28.4 (7.99) 0 0
Weedy-BHA 104.7 (3.79) 116 (1.73) 0.903 (0.04) 5.5 (1.84) 1 1
Growth Chamber
Weedy-SH 83 (3.54) 60 (4.95) 1.383 (0.04) 0.3 (0.06) 0 0
Cultivated 59 (9.19) 109 (23.33) 0.541 (0.19) 60.9 (23.02) 0 0
Weedy-BHA 67 (33.23) 116 (13.43) 0.578 (0.33) 7.2 (3.08) 1 1
*Seed shattering was measured as described in Thurber et al. 2010 using the Breaking Tensile Strength method.
© 2012 Blackwell Publishing Ltd
4 C. S . THURBER ET AL.
ferences in QTL detected, positions or LOD scores; we
thus kept the original marker order, which is consistent
physical marker location and previous rice maps. The
average interval size of our maps is approximately
29.8 cM for the S population and 24.1 cM for the B pop-
ulation, with a minimum of 1.4 cM and a maximum of
91.5 cM. Although some large gaps occur, marker posi-
tions were found to be in similar locations as previously
published maps and should be sufficient for detecting
most large-effect loci (e.g. Thomson et al. 2003; Lee et al.
2005).
QTL mapping
The normality of phenotypic data was checked using
Normal Quantile Plots (Tan et al. 2004). Non-normal
data were log transformed. If transformation was
unsuccessful, nonparametric analysis was performed
(Tilquin et al. 2001). For normalized traits, QTL were
identified first using single-marker analysis (SMA) as a
rough scan of the individual markers, and then using
Composite Interval Mapping (CIM) to get more accu-
rate positions and significance values. Both analyses
were run in WinQTL Cartographer (Wang et al. 2012).
SMA was run under default conditions; CIM was run
using forward–backward regression (Model 6; probabil-
ity of inclusion/exclusion of marker cofactors of 0.1;
window size 10 cM) and a walk speed of 8 cM. Non-
parametric analysis was performed on seed shattering
using a Kruskal–Wallis rank sum test (K–W test) in
R/qtl. Mapping of the hull colour and awns traits was
performed in R/qtl using the binary mode under
default conditions. LOD thresholds for normalized traits
were assessed via permutations with 1000 replicates,
with most values being close to 3.5 (Table 2). To make
sure as many biologically significant QTL as possible
were detected given the variety of mapping analyses
performed and the low marker density, we report all
QTL with LOD scores over 2.0. The locations of the
QTL identified in this study were compared to previ-
ously published QTL using the ‘QTL’ search feature on
Gramene (http://www.gramene.org/).
Results
Phenotypes
To see whether environment had an effect on trait
differentiation, we compared phenotypes of the par-
ents under greenhouse conditions with phenotypes
previously obtained in the growth chamber (Table 1).
Growth chamber phenotypes were originally used to
select mapping parents, and the greenhouse environ-
ment differed in having more variable temperatures
and seasonally variable day-length. Phenotypic differ-
ences among environments were seen for some traits.
Most strikingly, the weedy-SH parent had an increase
in over 47 days in heading date under the greenhouse
environment. This is consistent with the short day
flowering behaviour seen in many rice varieties (Yano
et al. 2000), given the differences in day-length
between the growth chamber (12 h) and greenhouse
(day-length often exceeds 12 h in the summer). In
contrast, heading date of the weedy-BHA and the cul-
tivated parent were consistent across environments,
suggesting limited photoperiod sensitivity. The culti-
vated parent showed nearly half as much seed shat-
tering resistance in the greenhouse, while there was
no sizable change in the weeds’ shattering abilities.
Plant height nearly doubled for the weedy-BHA par-
ent in the greenhouse, while the other two parents
remained close to growth chamber values. Growth
rate values changed for both weed parents in the
greenhouse, but consistently exceeded the crop parent.
Despite environmental influence, phenotypic differ-
ences between weed and crop parents were still evi-
dent for most traits under greenhouse conditions
(Table 1).
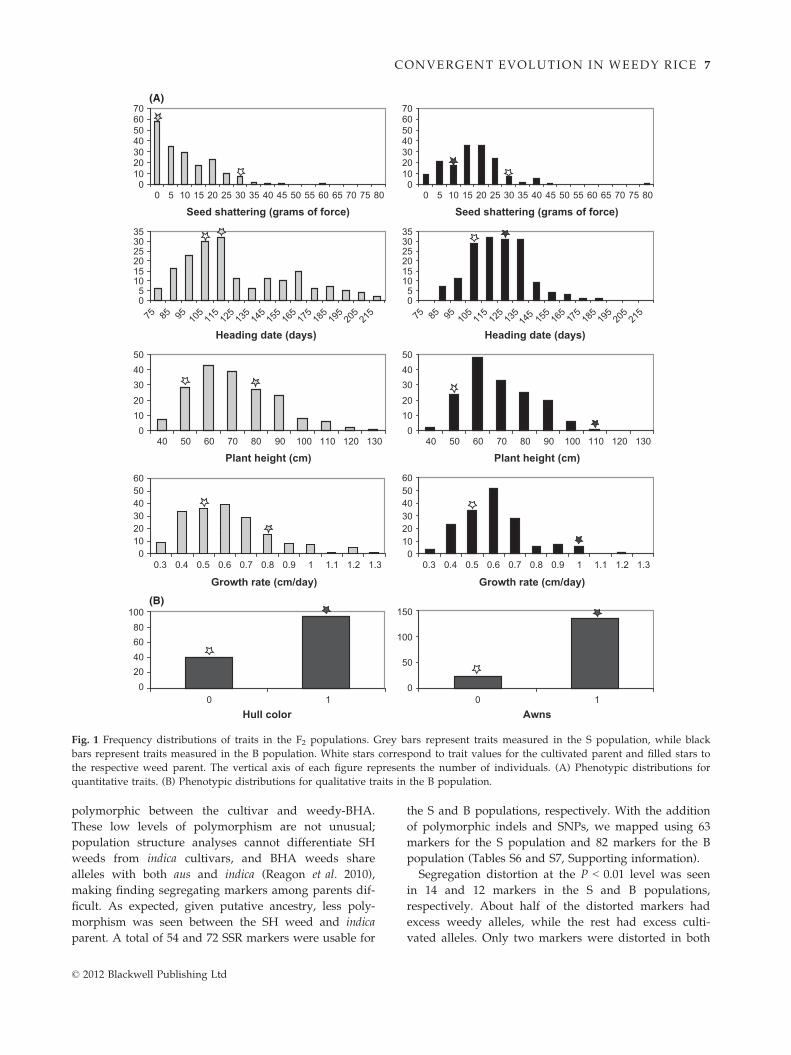
We examined the phenotypic distributions of all traits
in the F2 populations. For qualitative traits, segregation
of hull colour fits the 3:1 ratio expected for a trait con-
trolled by a single gene, while for awns, there is an
excess of weedy parent phenotypes suggesting the
involvement of more than one locus (v2 = 9.358,
P < 0.01) (Table 3; Fig. 1B). For quantitative traits, con-
tinuous, nearly normal distributions were observed for
plant height, heading date and growth rate, and nor-
mality could not be rejected for the log10 values of these
traits in either population (a = 0.01). In contrast, nor-
mality was rejected for seed shattering in both popula-
tions and attempts to normalize this trait failed.
Transgressive segregation was seen in all traits in both
populations yet was most noticeable for heading date
(Fig. 1A). Trait means were fairly similar between the
two populations for all quantitative traits. The distribu-
tions of plant height and growth rate were nearly iden-
tical between populations, suggesting similar genetic
architectures. For both heading date and seed shatter-
ing, multiple peaks were observed in the S population,
a distribution type often attributed to a locus of major
effect and a few of minor effect, while the B population
distributions suggested multiple weaker-effect loci
(Fig. 1A).
A weak but significant positive correlation was found
only between heading date and plant height in both
populations (r = 0.189–0.204) (Table S4, Supporting
information). Stronger positive correlations between
these traits (r = 0.467–0.76) have been reported in other
© 2012 Blackwell Publishing Ltd
CONVERGENT EVOLUTION IN WEEDY RICE 5
studies of greenhouse and field grown cultivated rice
(see Bres-Patry et al. 2001; Lee et al. 2005).
A maximum broad-sense heritability value was calcu-
lated for all quantitative traits in each population (Table S5,
Supporting information). Despite the evidence for environ-
mental effects on some of these traits in parents, heritabili-
ties in our greenhouse environment were fairly high,
ranging from approximately 67% for seed shattering to
nearly 100% for heading date. Although our heritability
values are likely to be overestimates, particularly in the
case of plant height (Table S5, Supporting information),
heritabilities were also remarkably similar for each trait
across mapping populations.
Marker linkage map
Of the 188 SSR tested, 31% were polymorphic between
the cultivar and weedy-SH parent and 45% were
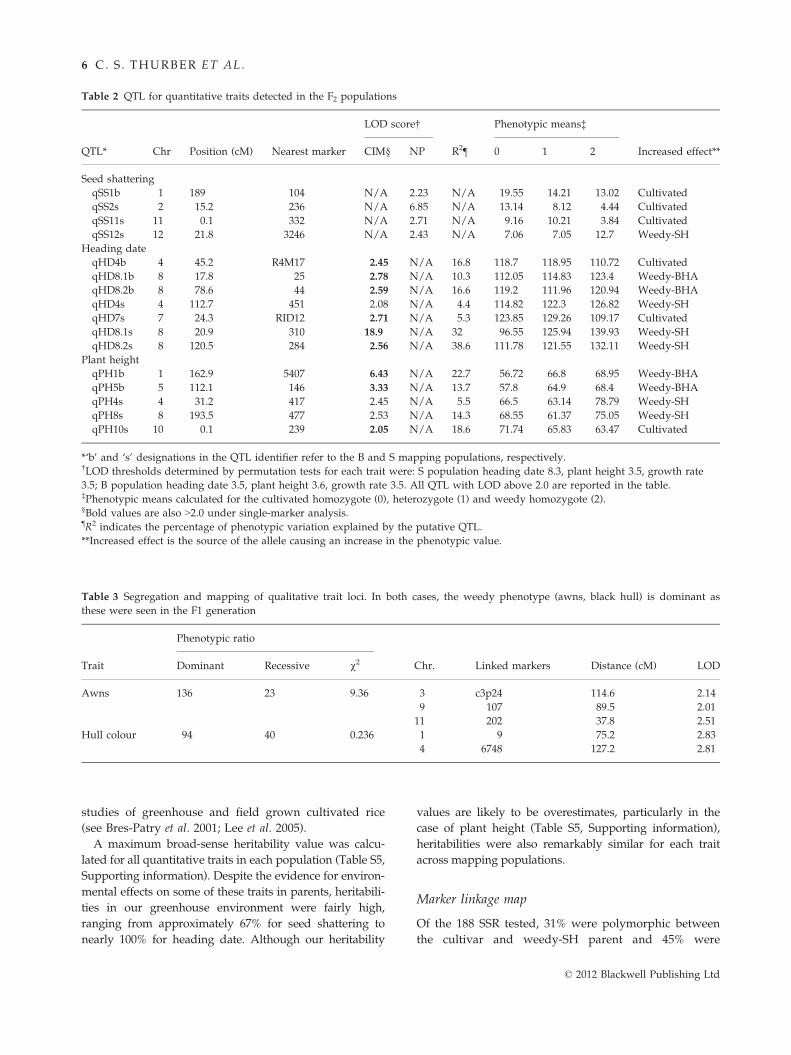
Table 2 QTL for quantitative traits detected in the F2 populations
QTL* Chr Position (cM) Nearest marker
LOD score†
R2¶
Phenotypic means‡
Increased effect**CIM§ NP 0 1 2
Seed shattering
qSS1b 1 189 104 N/A 2.23 N/A 19.55 14.21 13.02 Cultivated
qSS2s 2 15.2 236 N/A 6.85 N/A 13.14 8.12 4.44 Cultivated
qSS11s 11 0.1 332 N/A 2.71 N/A 9.16 10.21 3.84 Cultivated
qSS12s 12 21.8 3246 N/A 2.43 N/A 7.06 7.05 12.7 Weedy-SH
Heading date
qHD4b 4 45.2 R4M17 2.45 N/A 16.8 118.7 118.95 110.72 Cultivated
qHD8.1b 8 17.8 25 2.78 N/A 10.3 112.05 114.83 123.4 Weedy-BHA
qHD8.2b 8 78.6 44 2.59 N/A 16.6 119.2 111.96 120.94 Weedy-BHA
qHD4s 4 112.7 451 2.08 N/A 4.4 114.82 122.3 126.82 Weedy-SH
qHD7s 7 24.3 RID12 2.71 N/A 5.3 123.85 129.26 109.17 Cultivated
qHD8.1s 8 20.9 310 18.9 N/A 32 96.55 125.94 139.93 Weedy-SH
qHD8.2s 8 120.5 284 2.56 N/A 38.6 111.78 121.55 132.11 Weedy-SH
Plant height
qPH1b 1 162.9 5407 6.43 N/A 22.7 56.72 66.8 68.95 Weedy-BHA
qPH5b 5 112.1 146 3.33 N/A 13.7 57.8 64.9 68.4 Weedy-BHA
qPH4s 4 31.2 417 2.45 N/A 5.5 66.5 63.14 78.79 Weedy-SH
qPH8s 8 193.5 477 2.53 N/A 14.3 68.55 61.37 75.05 Weedy-SH
qPH10s 10 0.1 239 2.05 N/A 18.6 71.74 65.83 63.47 Cultivated
*‘b’ and ‘s’ designations in the QTL identifier refer to the B and S mapping populations, respectively.†LOD thresholds determined by permutation tests for each trait were: S population heading date 8.3, plant height 3.5, growth rate
3.5; B population heading date 3.5, plant height 3.6, growth rate 3.5. All QTL with LOD above 2.0 are reported in the table.‡Phenotypic means calculated for the cultivated homozygote (0), heterozygote (1) and weedy homozygote (2).§Bold values are also >2.0 under single-marker analysis.¶R2 indicates the percentage of phenotypic variation explained by the putative QTL.
**Increased effect is the source of the allele causing an increase in the phenotypic value.
Table 3 Segregation and mapping of qualitative trait loci. In both cases, the weedy phenotype (awns, black hull) is dominant as
these were seen in the F1 generation
Trait
Phenotypic ratio
Chr. Linked markers Distance (cM) LODDominant Recessive v2
Awns 136 23 9.36 3 c3p24 114.6 2.14
9 107 89.5 2.01
11 202 37.8 2.51
Hull colour 94 40 0.236 1 9 75.2 2.83
4 6748 127.2 2.81
© 2012 Blackwell Publishing Ltd
6 C. S . THURBER ET AL.
polymorphic between the cultivar and weedy-BHA.
These low levels of polymorphism are not unusual;
population structure analyses cannot differentiate SH
weeds from indica cultivars, and BHA weeds share
alleles with both aus and indica (Reagon et al. 2010),
making finding segregating markers among parents dif-
ficult. As expected, given putative ancestry, less poly-
morphism was seen between the SH weed and indica
parent. A total of 54 and 72 SSR markers were usable for
the S and B populations, respectively. With the addition
of polymorphic indels and SNPs, we mapped using 63
markers for the S population and 82 markers for the B
population (Tables S6 and S7, Supporting information).
Segregation distortion at the P < 0.01 level was seen
in 14 and 12 markers in the S and B populations,
respectively. About half of the distorted markers had
excess weedy alleles, while the rest had excess culti-
vated alleles. Only two markers were distorted in both
01020304050
Plant height (cm)
05
101520253035
75 85 95 105
115
125
135
145
155
165
175
185
195
205
215
Heading date (days)
010203040506070
Seed shattering (grams of force)
0
50
100
150
10Awns
020406080
100
10Hull color
05
101520253035
75 85 95 105
115
125
135
145 15
516
517
518
519
520
521
5
Heading date (days)
010203040506070
0 5 10 15 20 25 30 35 40 45 50 55 60 65 70 75 80 0 5 10 15 20 25 30 35 40 45 50 55 60 65 70 75 80
Seed shattering (grams of force)
01020304050
40 50 60 70 80 90 100 110 120 130 40 50 60 70 80 90 100 110 120 130
Plant height (cm)
0102030405060
Growth rate (cm/day)
0102030405060
0.3 0.4 0.5 0.6 0.7 0.8 0.9 1 1.1 1.2 1.30.3 0.4 0.5 0.6 0.7 0.8 0.9 1 1.1 1.2 1.3
Growth rate (cm/day)
(A)
(B)
Fig. 1 Frequency distributions of traits in the F2 populations. Grey bars represent traits measured in the S population, while black
bars represent traits measured in the B population. White stars correspond to trait values for the cultivated parent and filled stars to
the respective weed parent. The vertical axis of each figure represents the number of individuals. (A) Phenotypic distributions for
quantitative traits. (B) Phenotypic distributions for qualitative traits in the B population.
© 2012 Blackwell Publishing Ltd
CONVERGENT EVOLUTION IN WEEDY RICE 7

populations. The presence of QTL linked to distorted
markers can affect detection; yet, distorted markers do
not cause false-positive associations and are not a prob-
lem if randomly distributed across a genetic map
(Zhang et al. 2010). When distorted markers were
removed, we did not detect additional QTL for any
trait; loss of a hull colour QTL (chromosome 1) was
observed, as it is linked to a distorted marker (9), and
one QTL for heading date (chromosome 4) in the
S population dropped below the LOD 2.0 threshold.
Mapping quantitative traits
Seed shattering. Three shattering QTL were identified in
the S population (Fig. 2; Table 2; Fig. S1, Supporting
information). One is located on chromosome 2 near
position 15.2 cM (qSS2s), another is located on chromo-
some 11 near position 0.1 cM (qSS11s), and the third is
located on chromosome 12 near position 21.8 (qSS12s).
Weedy alleles at two QTL increase seed shattering abil-
ity as expected, given the weedy parent’s propensity for
shattering. Our QTL on chromosome 11 may be close or
overlapping with one found in a cross between wild
O. rufipogon and an indica cultivar, where the wild allele
increased seed shattering (Cai & Morishima 2000). In
the B population, one QTL was identified on chromo-
some 1 near position 189 cM (qSS1b) (Fig. 2; Table 2;
Fig. S1, Supporting information). Weedy alleles at this
QTL also work to increase seed shattering. This QTL is
linked to a shared marker with a shattering QTL from a
cross between O. rufipogon and a tropical japonica culti-
var, where the wild allele increased seed shattering
(Thomson et al. 2003). Additionally, a peak under the
LOD threshold in the B population corresponding to a
similar location as the S chromosome 11 QTL may indi-
cate sharing of a minor-effect QTL we did not have the
power to detect (Fig. S1, Supporting information).
Heading date. For the S population, four heading date
QTL were identified with LOD > 2.0 (Fig. 2; Table 2;
Fig. S1, Supporting information). One is located on
chromosome 4 (qHD4s, 112.7 cM), another on chromo-
Chr 10.1 i4
25.9 283
61.2 c1p15
80.1 i22
135.6 i23
170.9 104
Chr 100.1 239
63.9 304
96.6 228
0.1
49
Chr 11332
37.8 552202
52.5 53671.3 287
113.2 254
Chr 20.1 15415.2 23621.4 27927.1 42348.4 6911
77.6 341
113.1 R2M37
133.8 263
165 166181.2 208190.3 498
0.1Chr 3
22
24.8 c3p4
60.1 7
97.4 251
123.6 5626
155.5 15824
188.2 468195.3 422202.1 442
Chr 40.1 R4M3013.8 518
39.1 417
102.6 241111.7 451120.9 317
Chr 50.1 153
23.5 413
51.9 289
82.3 146
Chr 60.1 190
33.6 253
113.8 162
135.1 340
Chr 70.1 5711
22.6 rid1230.3 214
55.2 11
Chr 80.1 1148
34.3 310
74.9 284
196.7 477
Chr 90.1 296
75.1 434
105 245
0.1Chr 12
7003
21.8 3246
108.6 270
Chr 10.1 490
19.8 259
52.3 c1p15
73.7 976.1 5
111.9 403
132.8 212150 5407164.7 431
182.4 104
Chr 100.1 27113.7 c10p519.2 304
45.3 228
136.8 590
Chr 110.1 332
32.6 552
50.7 120
71.3 202
98.4 536110.8 287121.7 21
149.6 254
Chr 120.1 19
66.9 700383.9 osm9185.3 324687.1 6102
115.7 519
Chr 20.1 154
21.5 23632.7 423
56.1 R2M26
78.9 341
103.9 R2M37
123.5 263
146.1 450
176.9 482
197.1 498
Chr 30.1 545
36.7 232
55.2 767.2 251
114.6 c3p24
158.1 15824168.2 5992
194.9 468
213.3 422226.1 442
Chr 40.1 335
25.4 R4M17
98.3 241114.1 317127.2 6748
Chr 60.1 225
48.6 25365.1 4791
100.6 162109.2 528
133.3 340
Chr 70.1 481
27.9 rid1245.1 R7M758.3 11
98.6 234
Chr 80.1 25
52.1 31055.6 827161.2 R8M1075.9 4490.8 R8M33
Chr 90.1 296
23.3 434
45.5 257
67.2 c9p13
89.5 107
Chr 50.1 153
36.8 1338.9 413
64.8 289
100.1 146
140.2 421
cMcM
cMcM
cM
cM
cM
cMcM
cMcM
cM cMcM
cMcM
cMcMcMcMcMcMcM cM
qSS1bqPH1b
qPH5b
qSS2s
qPH10s
qHD7s
qSS11s
qPH4s qHD4b
qHD4s
qHD8.1s
qPH8s
qHD8.2s
qHD8.2b
qHD8.1b
qSS12s
Fig. 2 Molecular linkage maps with positions of QTL for quantitative traits in both the S (left) and B populations (right). Markers
with segregation distortion (P < 0.01) are circled in light grey. Black bars represent 1.5 LOD confidence intervals around QTL peaks,
which are labelled with a white triangle. Grey bars represent gaps over 45 cM. Marker names are on the right side of the chromo-
some; marker positions, drawn to scale, are on the left.
© 2012 Blackwell Publishing Ltd
8 C. S . THURBER ET AL.
some 7 (qHD7s, 24.3 cM) and two on chromosome 8
(qHD8.1s, 20.9 cM; qHD8.2s, 120.5 cM). Weedy alleles
at three of the QTL increase days to heading, consistent
with the later flowering seen in the weedy parent in the
greenhouse. The S population permutation LOD thresh-
old was surprisingly high compared with other traits
(Table 2); this may be a spurious effect of the bimodal
phenotype distribution, which persisted somewhat after
normalization of the trait (Manichaikul et al. 2007).
In the B population, three QTL were identified on
chromosomes 4 (qHD4b, 45.2 cM) and 8 (qHD8.1b,
17.8 cM; qHD8.2b, 78.6 cM) (Fig. 2; Table 2; Fig. S1,
Supporting information). Weedy alleles at two of the
QTL increase heading date, consistent with the weedy
parent’s phenotype. It is possible that qHD8.1s and
qHD8.1b share similar or linked causal genes as their
peaks overlap with the corresponding QTL’s 1.5 LOD
interval and both include marker 310. Additionally,
these QTL may be in a similar location as one identified
by Yano et al. (1997) and Xiao et al. (1998), in mapping
populations involving japonica by indica crosses (with
the japonica allele reducing flowering time), and O. ruf-
ipogon by cultivated crosses (with wild alleles increasing
flowering time). Recently, a candidate gene in this
region was cloned (Wei et al. 2010; Cai et al. 2012; Yan
et al. 2011). Additionally, qHD8.2s and qHD8.2b also
seem localized to similar genomic areas; however, lack
of shared markers in this region prevent us from deter-
mining whether these QTL overlap.
Plant height. Three QTL were detected for plant height
in the S population (Fig. 2; Table 2; Fig. S1, Supporting
information). Of these, qPH10s (chromosome 10,
0.1 cM) explains most of the variation followed by
qPH8s (chromosome 8, 193.5 cM) and qPH4s (chromo-
some 4, 31.2 cM). For qPH4s and qPH8s, the weedy
allele increases plant height, as expected, while for
qPH10s the cultivated allele increases plant height.
Although we do not share any neighbouring or linked
markers with Li et al.’s (2006a) map from an indica and
wild O. nivara cross, the markers associated with our
chromosome 4 QTL are in similar physical locations.
We do share a neighbouring marker with a QTL on
chromosome 8 from Thomson et al. (2003) and with a
QTL on chromosome 10 with Septiningsih et al. (2003),
from populations involving crosses between japonica or
indica cultivars with wild O. rufipogon; in all three stud-
ies, the wild allele increases plant height.
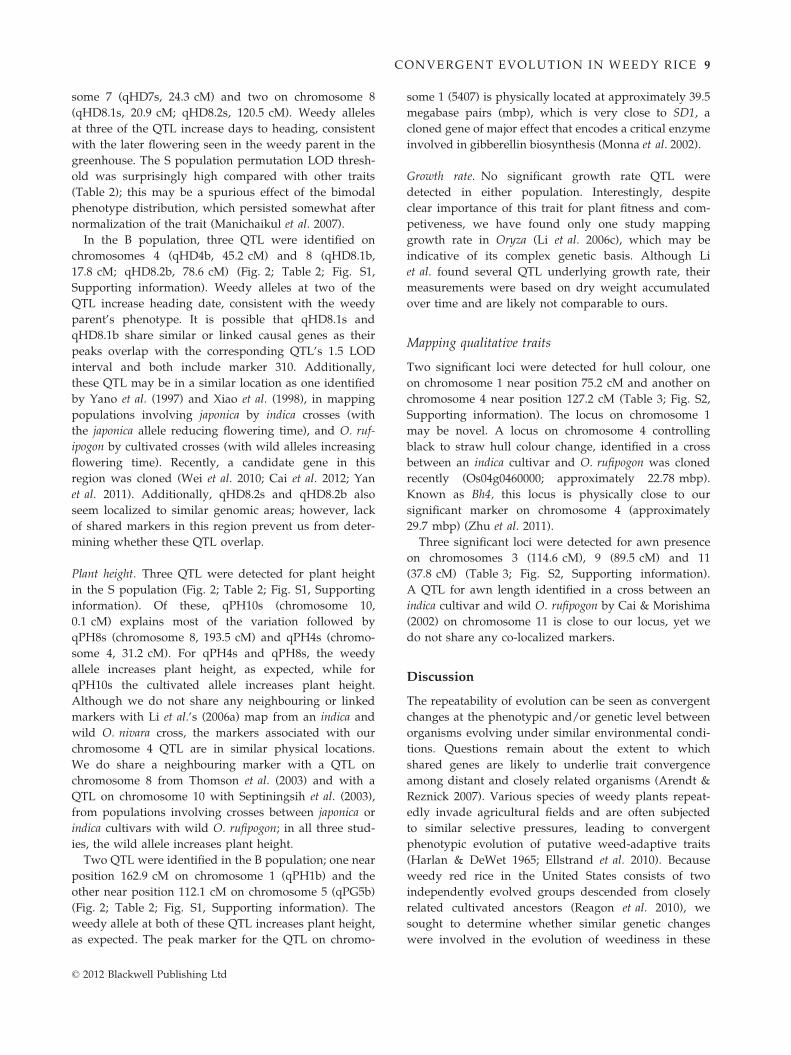
Two QTL were identified in the B population; one near
position 162.9 cM on chromosome 1 (qPH1b) and the
other near position 112.1 cM on chromosome 5 (qPG5b)
(Fig. 2; Table 2; Fig. S1, Supporting information). The
weedy allele at both of these QTL increases plant height,
as expected. The peak marker for the QTL on chromo-
some 1 (5407) is physically located at approximately 39.5
megabase pairs (mbp), which is very close to SD1, a
cloned gene of major effect that encodes a critical enzyme
involved in gibberellin biosynthesis (Monna et al. 2002).
Growth rate. No significant growth rate QTL were
detected in either population. Interestingly, despite
clear importance of this trait for plant fitness and com-
petiveness, we have found only one study mapping
growth rate in Oryza (Li et al. 2006c), which may be
indicative of its complex genetic basis. Although Li
et al. found several QTL underlying growth rate, their
measurements were based on dry weight accumulated
over time and are likely not comparable to ours.
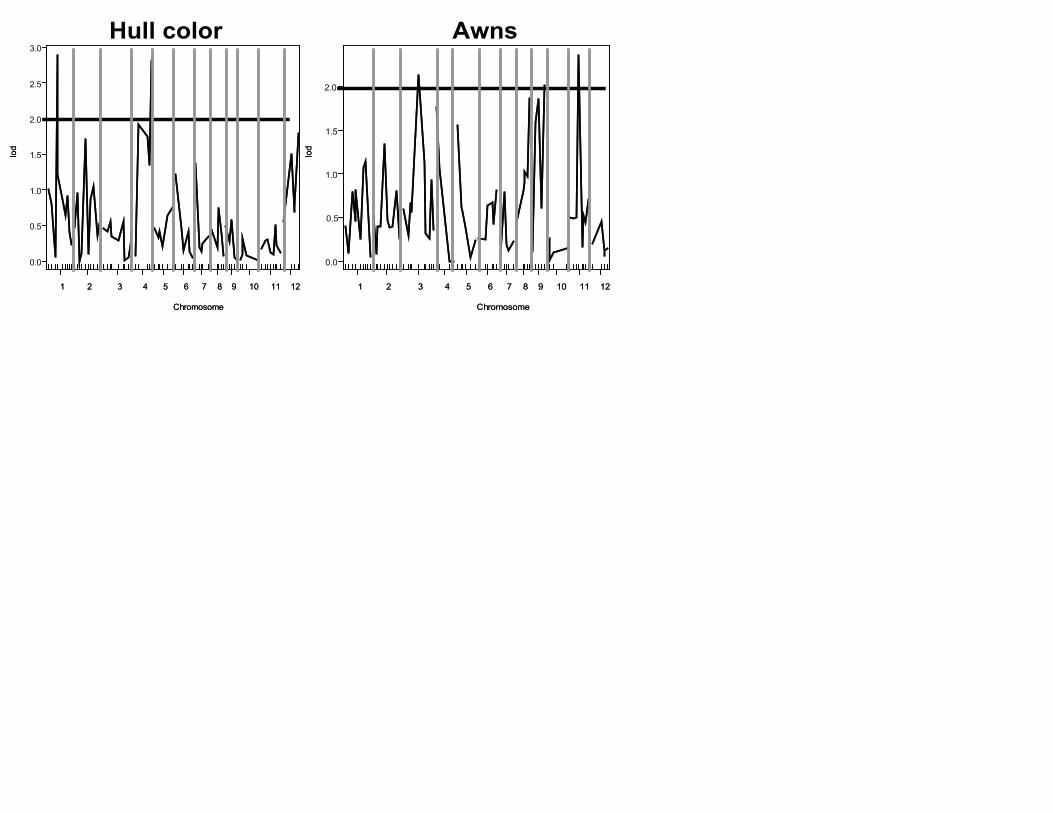
Mapping qualitative traits
Two significant loci were detected for hull colour, one
on chromosome 1 near position 75.2 cM and another on
chromosome 4 near position 127.2 cM (Table 3; Fig. S2,
Supporting information). The locus on chromosome 1
may be novel. A locus on chromosome 4 controlling
black to straw hull colour change, identified in a cross
between an indica cultivar and O. rufipogon was cloned
recently (Os04g0460000; approximately 22.78 mbp).
Known as Bh4, this locus is physically close to our
significant marker on chromosome 4 (approximately
29.7 mbp) (Zhu et al. 2011).
Three significant loci were detected for awn presence
on chromosomes 3 (114.6 cM), 9 (89.5 cM) and 11
(37.8 cM) (Table 3; Fig. S2, Supporting information).
A QTL for awn length identified in a cross between an
indica cultivar and wild O. rufipogon by Cai & Morishima
(2002) on chromosome 11 is close to our locus, yet we
do not share any co-localized markers.
Discussion
The repeatability of evolution can be seen as convergent
changes at the phenotypic and/or genetic level between
organisms evolving under similar environmental condi-
tions. Questions remain about the extent to which
shared genes are likely to underlie trait convergence
among distant and closely related organisms (Arendt &
Reznick 2007). Various species of weedy plants repeat-
edly invade agricultural fields and are often subjected
to similar selective pressures, leading to convergent
phenotypic evolution of putative weed-adaptive traits
(Harlan & DeWet 1965; Ellstrand et al. 2010). Because
weedy red rice in the United States consists of two
independently evolved groups descended from closely
related cultivated ancestors (Reagon et al. 2010), we
sought to determine whether similar genetic changes
were involved in the evolution of weediness in these
© 2012 Blackwell Publishing Ltd
CONVERGENT EVOLUTION IN WEEDY RICE 9
groups, and whether weedy traits could be attributed to
variation present in wild and/or cultivated rice.
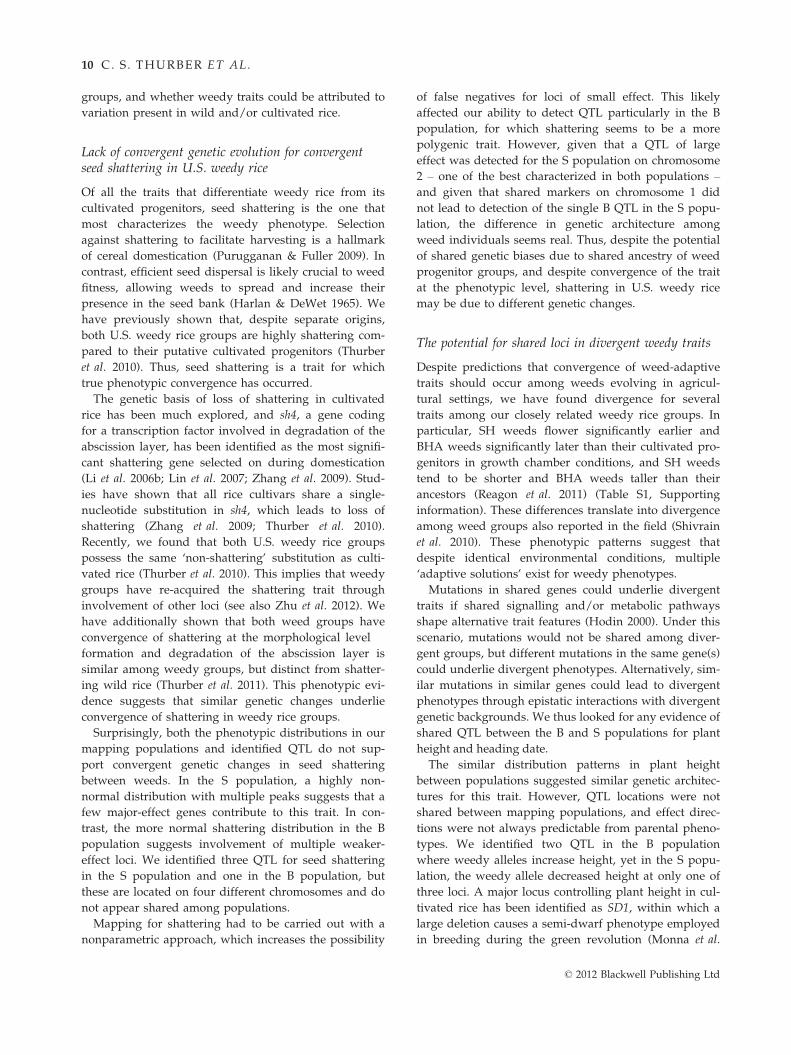
Lack of convergent genetic evolution for convergentseed shattering in U.S. weedy rice
Of all the traits that differentiate weedy rice from its
cultivated progenitors, seed shattering is the one that
most characterizes the weedy phenotype. Selection
against shattering to facilitate harvesting is a hallmark
of cereal domestication (Purugganan & Fuller 2009). In
contrast, efficient seed dispersal is likely crucial to weed
fitness, allowing weeds to spread and increase their
presence in the seed bank (Harlan & DeWet 1965). We
have previously shown that, despite separate origins,
both U.S. weedy rice groups are highly shattering com-
pared to their putative cultivated progenitors (Thurber
et al. 2010). Thus, seed shattering is a trait for which
true phenotypic convergence has occurred.
The genetic basis of loss of shattering in cultivated
rice has been much explored, and sh4, a gene coding
for a transcription factor involved in degradation of the
abscission layer, has been identified as the most signifi-
cant shattering gene selected on during domestication
(Li et al. 2006b; Lin et al. 2007; Zhang et al. 2009). Stud-
ies have shown that all rice cultivars share a single-
nucleotide substitution in sh4, which leads to loss of
shattering (Zhang et al. 2009; Thurber et al. 2010).
Recently, we found that both U.S. weedy rice groups
possess the same ‘non-shattering’ substitution as culti-
vated rice (Thurber et al. 2010). This implies that weedy
groups have re-acquired the shattering trait through
involvement of other loci (see also Zhu et al. 2012). We
have additionally shown that both weed groups have
convergence of shattering at the morphological level �formation and degradation of the abscission layer is
similar among weedy groups, but distinct from shatter-
ing wild rice (Thurber et al. 2011). This phenotypic evi-
dence suggests that similar genetic changes underlie
convergence of shattering in weedy rice groups.
Surprisingly, both the phenotypic distributions in our
mapping populations and identified QTL do not sup-
port convergent genetic changes in seed shattering
between weeds. In the S population, a highly non-
normal distribution with multiple peaks suggests that a
few major-effect genes contribute to this trait. In con-
trast, the more normal shattering distribution in the B
population suggests involvement of multiple weaker-
effect loci. We identified three QTL for seed shattering
in the S population and one in the B population, but
these are located on four different chromosomes and do
not appear shared among populations.
Mapping for shattering had to be carried out with a
nonparametric approach, which increases the possibility
of false negatives for loci of small effect. This likely
affected our ability to detect QTL particularly in the B
population, for which shattering seems to be a more
polygenic trait. However, given that a QTL of large
effect was detected for the S population on chromosome
2 – one of the best characterized in both populations –
and given that shared markers on chromosome 1 did
not lead to detection of the single B QTL in the S popu-
lation, the difference in genetic architecture among
weed individuals seems real. Thus, despite the potential
of shared genetic biases due to shared ancestry of weed
progenitor groups, and despite convergence of the trait
at the phenotypic level, shattering in U.S. weedy rice
may be due to different genetic changes.
The potential for shared loci in divergent weedy traits
Despite predictions that convergence of weed-adaptive
traits should occur among weeds evolving in agricul-
tural settings, we have found divergence for several
traits among our closely related weedy rice groups. In
particular, SH weeds flower significantly earlier and
BHA weeds significantly later than their cultivated pro-
genitors in growth chamber conditions, and SH weeds
tend to be shorter and BHA weeds taller than their
ancestors (Reagon et al. 2011) (Table S1, Supporting
information). These differences translate into divergence
among weed groups also reported in the field (Shivrain
et al. 2010). These phenotypic patterns suggest that
despite identical environmental conditions, multiple
‘adaptive solutions’ exist for weedy phenotypes.
Mutations in shared genes could underlie divergent
traits if shared signalling and/or metabolic pathways
shape alternative trait features (Hodin 2000). Under this
scenario, mutations would not be shared among diver-
gent groups, but different mutations in the same gene(s)
could underlie divergent phenotypes. Alternatively, sim-
ilar mutations in similar genes could lead to divergent
phenotypes through epistatic interactions with divergent
genetic backgrounds. We thus looked for any evidence of
shared QTL between the B and S populations for plant
height and heading date.
The similar distribution patterns in plant height
between populations suggested similar genetic architec-
tures for this trait. However, QTL locations were not
shared between mapping populations, and effect direc-
tions were not always predictable from parental pheno-
types. We identified two QTL in the B population
where weedy alleles increase height, yet in the S popu-
lation, the weedy allele decreased height at only one of
three loci. A major locus controlling plant height in cul-
tivated rice has been identified as SD1, within which a
large deletion causes a semi-dwarf phenotype employed
in breeding during the green revolution (Monna et al.
© 2012 Blackwell Publishing Ltd
10 C. S . THURBER ET AL.

2002). We expected to detect this QTL in both popula-
tions, as our cultivated parent contains this deletion
(Reagon et al. 2011). One of the QTL identified in the B
population is physically close to SD1, indicating that it
may not be specific to evolution of plant height in the
BHA lineage. In contrast, the three QTL in the S popu-
lation may have contributed to evolution of plant height
in the SH lineage. These QTL may come from standing
variation in the crop or wild rice, as previously
reported height QTL appear to be near these.
Among growth-related traits, phenotypic divergence
between weedy groups and between weeds and their
cultivated ancestors is most apparent for flowering time
(Reagon et al. 2011). Our two mapping populations do
not share similar phenotypic distributions for this trait,
with the involvement of a single major-effect locus and
a few minor-effect loci suggested for the S population,
and multiple weaker-effect loci suggested for the B pop-
ulation. Surprisingly, our results indicate that heading
date is the trait with most potential for similar genes
underlying evolutionary changes in both weed groups.
Two of the QTL identified in the S population and two
in the B, are located on chromosome 8, and one set of
QTL shares a neighbouring marker across populations.
Consistent with the switch to later flowering exhibited
by the SH parent in the greenhouse, in three of the four
cases the weedy allele increases days to heading.
Flowering in rice is controlled by several genes that
interact to create a wide range in heading dates across
different environments (Takahashi et al. 2009). In partic-
ular, variations in Hd1, which encodes a zinc-finger
domain protein (Yano et al. 2000), have been implicated
as major regulators of flowering time (Takahashi et al.
2009). A cursory look at Hd1 coding region alleles in
weedy rice suggests the involvement of Hd1 in weed
flowering. Our BHA and cultivated parents have
haplotypes containing deletions known to result in
nonfunctional haplotypes and photoperiod insensitivity
(Takahashi et al. 2009; C. S. Thurber & A. L. Caicedo,
unpublished data). In contrast, our SH parent has an
intact haplotype common in cultivated rice (C. S. Thur-
ber & A. L. Caicedo, unpublished data), and known to
cause photoperiod sensitivity and short day flowering in
cultivated rice (Yano et al. 2000; Takahashi et al. 2009).
Our mapping results suggest that Hd1 does not mediate
differences in flowering time between weed parents and
between weeds and indica under the variable, primarily
long day conditions in our greenhouse. Given that our
planting time reflects the timing of planting in Southern
U.S. rice fields, our results also suggest that a novel
locus or set of loci on chromosome 8 underlie flowering
time differences between weed groups in the field and
are likely responsible for divergence of weed groups
from their cultivated ancestors. These heading dates,
QTL may also be involved in variation in flowering time
in cultivated and wild rice, given previously identified
QTL and a cloned candidate gene in the region.
The potential for shared loci involved in reversals towild phenotypes
Three of our traits show a clear reversal of cultivated
phenotypes (non-shattering, straw coloured hulls, no
awns) to wild phenotypes (shattering, black hulls,
long awns). Due to the diversity of the cultivated
ancestral gene pool, as seen by the wide range of hull
and awn morphologies in our collection of aus/indica
cultivars, it is possible that genes involved in some
weedy traits could have arisen from standing ancestral
variation. Alternatively, although lack of a role for
wild rice sh4 alleles in shattering of weedy rice has
been demonstrated, genes underlying hull colour and
awn presence in the wild ancestor of rice could be
involved in weedy phenotypes through introgression
or compensatory mutations that reverse the phenotype
in weeds. Thus, weedy convergent genetic evolution
can be envisioned at another level: weeds may also
share genes underlying weedy traits with wild or cul-
tivated rice.
We checked for evidence of shared genetic changes
by examining published QTL from studies involving
crosses of wild and cultivated Oryza groups. Seed shat-
tering QTL have been mapped to nearly every rice
chromosome, yet only two of our four QTL potentially
overlap previously published QTL, both identified in
wild by cultivated rice crosses. The potential sharing of
some QTL with wild rice suggests that the transition
from non-shattering to shattering during weed
de-domestication may involve some similar genes as
the loss of shattering during domestication.
Although our QTL for awns did not overlap with any
other published QTL, our hull colour QTL on chromo-
some 4 may be the recently cloned Bh4 locus (Zhu et al.
2011). Hull colour in Oryza can vary from light (nearly
white and straw) to medium (gold furrowed or brown)
to dark (black); this trait may be important for seed dor-
mancy, camouflage and seed dispersal (Zhu et al. 2011).
Bh4 encodes an amino acid transporter, and multiple
deletions and SNPs seem to be involved in the transition
from black hulls in wild rice to straw hulls in cultivated
rice (Zhu et al. 2011). Our results suggest that for this
weedy trait, causal alleles could be shared with wild rice.
Convergent evolution among global populations ofweedy rice
A few other studies have involved mapping weed
adaptive traits in crosses between non-U.S. weedy rice
© 2012 Blackwell Publishing Ltd
CONVERGENT EVOLUTION IN WEEDY RICE 11
and cultivated rice, although with no knowledge of the
evolutionary relationship between parents. One such
study mapped several traits (e.g. seed shattering, head-
ing date, plant height and yield components) in a
weedy rice from France crossed to a japonica cultivar
(Bres-Patry et al. 2001), while another set of studies
examined seed dormancy, shattering, awns and hull
colour in a weedy rice from Thailand crossed to an
indica (Gu et al. 2005). We do not share any QTL for
overlapping traits with either study, suggesting that
convergent genetic evolution may not be the norm
among worldwide weedy rice populations.
Caveats and future directions
Low marker density was apparent in each of our crop-
weed crosses, consistent with the recent divergence of
parental groups (Reagon et al. 2010). Although low mar-
ker density decreases statistical power and can lead to
difficulties detecting QTL, especially those of small
effect, we discovered QTL for most of our weedy traits.
Moreover, since divergence time between weeds and
their crop ancestors is likely only a few hundred to a
few thousand years old (Reagon et al. 2010), it is reason-
able to expect a limited number of genes involved in
trait divergence among crops and weeds, with most of
these having moderate to large effects. Thus, despite
the biological constraints leading to low power in our
study, and the likelihood that some QTL were not
detected, the QTLs discovered here are likely informa-
tive about weedy rice evolution.
To determine whether genetic convergence has
occurred among weedy groups as a whole, alleles
underlying weedy traits must be shown to be shared or
present as fixed differences at the population level.
Because polymorphism detected between parents may
not necessarily represent fixed differences among popu-
lations, our study constitutes an initial approach at
characterizing the extent of convergent evolution
between weed groups. However, the fact that both
weed groups have undergone population bottlenecks
and have low levels of genetic diversity (Reagon et al.
2010), increases the chances that QTL detected in our
crosses may represent true cases of convergent or diver-
gent evolution among populations.
The QTL we detected give us a starting point for
identifying genes involved in weed-adaptive traits.
A caveat to consider in our study is the lack of a cross
between a BHA weed and its putative aus progenitor.
Due to the relationship among cultivated and weed
groups, QTL detected from the BHA-indica cross could
include genomic regions that differ between BHA and
aus and regions that differ between indica and aus.
Fortunately, this does not hurt our ability to detect QTL
relevant to weed evolution, and ongoing attempts to
create a BHA-aus cross will help us determine which
QTL are specific to BHA weeds.
This study represents a first step towards dissecting
the extent of convergent evolution in weed adaptive
traits of a potent agricultural weed. Our finding of
predominant lack of convergent genetic evolution for
shattering, one of the most characteristic traits of
weedy rice, joins others in showing that close evolu-
tionary relationships do not imply use of the same
genes in adaptation (Arendt & Reznick 2007). Con-
versely, shared genetic pathways can be implicated in
the evolution of divergent phenotypes, as is likely for
flowering time in weeds. Further fine mapping of
genes underlying adaptive traits in weedy rice
groups, characterization of weed allele frequencies in
weedy populations, and search for weed alleles in
wild and cultivated ancestors, will contribute to our
eventual understanding of the circumstances under
which convergent genetic evolution occurs across mul-
tiple taxa.
Acknowledgements
We thank C. Albertson and S. Hazen for help with QTL map-
ping questions, and S. Perera and R. Dos Santos for help with
genotyping and/or phenotyping. This project was funded in
part by a grant from the U.S. National Science Foundation
Plant Genome Research Program (IOS-1032023) to A.L.C.,
Kenneth M. Olsen and Y.J.
References
Arendt J, Reznick D (2007) Convergence and parallelism recon-
sidered: what have we learned about the genetics of adapta-
tion? Trends in Ecology & Evolution, 23, 26–32.Asano K, Takashi T, Miura K et al. (2007) Genetic and Molecu-
lar Analysis of Utility of sd1 Alleles in Rice Breeding. Breed-
ing Science, 57, 53–58.
Basu C, Halfhill MD, Mueller TC, Stewart CN Jr (2004) Weed
genomics: new tools to understand weed biology. Trends in
Plant Science, 9, 391–398.Bres-Patry C, Lorieuz M, Clement G, Bangratz M, Ghesquiere
A (2001) Heredity and genetic mapping of domestication-
related traits in a temperate japonica weedy rice. Theoretical
and Applied Genetics, 102, 118–126.Cai HW, Morishima H (2000) Genomic regions affecting seed
shattering and seed dormancy in rice. Theoretical and Applied
Genetics, 100, 840–846.Cai HW, Morishima H (2002) QTL clusters reflect character
associations in wild cultivated rice. Theoretical and Applied
Genetics, 104, 1217–1228.
Cai H-Y, Diao S, He Y-G et al. (2012) Genetic and physical
mapping of qHY-8, a pleiotropic QTL for heading date and
yield-related traits in rice. Euphytica, 184, 109–118.Caicedo AL, Purugganan MD (2005) Comparative plant ge-
nomics. Frontiers and prospects. Plant Physiology, 138,
545–547.
© 2012 Blackwell Publishing Ltd
12 C. S . THURBER ET AL.
Caicedo AL, Williamson SH, Hernandez RD et al. (2007)
Genome-wide patterns of nucleotide polymorphism in
domesticated rice. PLoS Genetics, 3, e163.
Chen X, Temnykh S, Xu Y, Cho YG, McCouch SR (1997) Devel-
opment of a microsatellite framework map providing gen-
ome-wide coverage in rice (Oryza sativa L.). Theoretical and
Applied Genetics, 95, 553–567.
Delouche JC, Burgos NR, Gealy DR et al. (2007) Weedy rices- ori-
gin, biology, ecology and control (ed. FAO). FAO, Rome, Italy.
Ellstrand NC, Heredia SM, Leak-Garcia JA et al. (2010) Crops
gone wild: evolution of weeds and invasives from domes-
ticated ancestors. Evolutionary Applications, 3, 494–504.Garris AJ, Tai TH, Coburn J, Kresovich S, McCouch S (2005)
Genetic structure and diversity in Oryza sativa L. Genetics,
169, 1631–1638.
Gu X-Y, Kianian SF, Hareland GA, Hoffer BL, Foley ME (2005)
Genetic analysis of adaptive syndromes interrelated with
seed dormancy in weedy rice (Oryza sativa). Theoretical and
Applied Genetics, 110, 1108–1118.
Harlan JR, DeWet JM (1965) Some thoughts about weeds.
Economic Botany, 19, 16–24.
Hodin J (2000) Plasticity and constraints in development and
evolution. Journal of Experimental Zoology, 288, 1–20.
Lee S-J, Oh C-S, Suh J-P, McCouch SR, Ahn S-N (2005) Identifi-
cation of QTLs for domestication-related and agronomic
traits in an Oryza sativa 9 O. rufipogon BC1F7 population.
Plant Breeding, 124, 209–219.
Li C, Zhou A, Sang T (2006a) Genetic analysis of rice domesti-
cation syndrome with the wild annual species, Oryza nivara.
New Phytologist, 170, 185–194.
Li C, Zhou A, Sang T (2006b) Rice domestication by reducing
shattering. Science, 311, 1936–1939.
Li S-B, Zhang Z-H, Hu Y et al. (2006c) Genetic dissection of
developmental behavior of crop growth rate and its relation-
ships with yield and yield related traits in rice. Plant Science,
170, 911–917.
Lin Z, Griffith ME, Li X et al. (2007) Origin of seed shattering
in rice (Oryza sativa L.). Planta, 226, 11–20.
Londo JP, Schaal BA (2007) Origins and population genetics
of weedy red rice in the USA. Molecular Ecology, 16, 4523–
4535.
Manceau M, Domingues VS, Linnen CR, Rosenblum EB, Hoek-
stra HE (2010) Convergence in pigmentation at multiple lev-
els: mutations, genes and function. Philosophical Transactions
of the Royal Society of London. Series B, Biological Sciences, 365,
2439–2450.
Manichaikul A, Palmer AA, Sen S, Broman KW (2007) Signifi-
cance threshold for quantitative trait locus mapping under
selective genotyping. Genetics, 177, 1963–1966.McCouch SR, Teytelman L, Xu Y et al. (2002) Development and
mapping of 2240 new SSR markers for rice (Oryza sativa L.).
DNA Research, 9, 199–207.
Monna L, Kitazawa N, Yoshino R et al. (2002) Positional clon-
ing of rice semidwarfing gene, sd-1: rice “green revolution
gene” encodes a mutant enzyme involved in gibberellin
synthesis. DNA Research, 9, 11–17.
Noldin JA, Chandler JM, McCauley GN (1999) Red rice (Oryza
sativa) biology. I. Characterization of red rice ecotypes. Weed
Technology, 13, 12–18.
Olsen KM, Caicedo AL, Jia Y (2007) Evolutionary genomics of
weedy rice in the USA. Journal of Integrative Plant Biology, 49,
811–816.
Panaud O, Chen X, McCouch SR (1996) Development of micro-
satellite markers and characterization of simple sequence
length polymorphism (SSLP) in rice (Oryza sativa L.). Molecular
and General Genetics, 252, 597–607.
Powles SB, Yu Q (2010) Evolution in action: plants resistant to
herbicides. Annual Review of Plant Biology, 61, 317–347.
Purugganan MD, Fuller DQ (2009) The nature of selection
during plant domestication. Nature, 457, 843–848.
Reagon M, Thurber CS, Gross BL et al. (2010) Genomic patterns
of nucleotide diversity in parallel populations of U.S. weedy
rice. BMC Evolutionary Biology, 10, 180.
Reagon M, Thurber CS, Olsen KM, Jia Y, Caicedo AL (2011)
The long and the short of it: SD1 polymorphism and the
evolution of growth trait divergence in U.S. weedy rice.
Molecular Ecology, 20, 3743–3756.Remigereau M-S, Lakis G, Rekima S et al. (2011) Cereal domes-
tication and evolution of branching: evidence for soft selec-
tion in the Tb1 orthologue of Pearl Millet (Pennisetum
glaucum [L.] R. Br.). PLoS ONE, 6, e22404.
Rompler H, Rohland N, Lalueza-Fox C et al. (2006) Nuclear
gene indicates coat-color polymorphism in Mammoths.
Science, 313, 62.
Schluter D, Clifford EA, Nemethy M, McKinnon JS (2004) Par-
allel evolution and inheritance of quantitative traits. American
Naturalist, 163, 809–822.
Septiningsih EM, Prasetiyono J, Lubis E et al. (2003) Identifi-
cation of quantitative trait loci for yield and yield compo-
nents in an advanced backcross population derived from
the Oryza sativa variety IR64 and the wild relative O. ruf-
ipogon. Theoretical and Applied Genetics, 107, 1419–1432.Shen Y-J, Jiang H, Jin J-P et al. (2004) Development of genome-
wide DNA polymorphism database for map-based cloning
of rice genes. Plant Physiology, 135, 1198–1205.
Shivrain VK, Burgos NR, Gealy DR, Sales MA, Smith KL
(2009) Gene flow from weedy red rice (Oryza sativa L.) to
cultivated rice and fitness of hybrids. Pest Management
Science, 65, 1124–1129.
Shivrain VK, Burgos NR, Agrama HA et al. (2010) Genetic
diversity of weedy red rice (Oryza sativa) in Arkansas, USA.
Weed Research, 50, 289–302.Smith SD, Rausher MD (2011) Gene loss and parallel evolution
contribute to species difference in flower color. Molecular
Biology and Evolution, 28, 2799–2810.
Steiner CC, Rompler H, Boettger LM, Shoneberg T, Hoekstra
HE (2008) The genetic basis of phenotypic convergence in
beach mice: similar pigment patterns but different genes.
Molecular Biology and Evolution, 26, 35–45.
Stinchcombe JR, Hoekstra HE (2008) Combining population
genomics and quantitative genetics: finding the genes
underlying ecologically important traits. Heredity, 100, 158–170.
Takahashi Y, Teshima KM, Yokoi S, Innan H, Shimamoto K
(2009) Variations in Hd1 proteins, Hd3a promoters, and
Ehd1 expression levels contribute to diversity of flowering
time in cultivated rice. Proceedings of the National Academy
Sciences, USA, 106, 4555–4560.
© 2012 Blackwell Publishing Ltd
CONVERGENT EVOLUTION IN WEEDY RICE 13
Tan WD, Gan FF, Chang TC (2004) Using normal quantile plot
to select an appropriate transformation to achieve normality.
Computational Statistics and Data Analysis, 45, 609–619.
Thomson MJ, Tai TH, McClung AM et al. (2003) Mapping
quantitative trait loci for yield, yield components and mor-
phological traits in an advanced backcross population
between Oryza rufipogon and the Oryza sativa cultivar Jeffer-
son. Theoretical and Applied Genetics, 107, 479–493.Thurber CS, Reagon M, Gross BL et al. (2010) Molecular evolu-
tion of shattering loci in U.S. weedy rice. Molecular Ecology,
19, 3271–3284.
Thurber CS, Hepler P, Caicedo AL (2011) Timing is every-
thing: early degradation of abscission layer may lead to
increased shattering in U.S. weedy rice. BMC Plant Biology,
11, 14.
Tilquin P, Coppieters W, Elsen JM et al. (2001) Statistical power
of QTL mapping methods applied to bacteria counts. Geneti-
cal Research, 78, 303–316.Vaughan LK, Ottis BV, Prazak-Havey AM et al. (2001) Is all
red rice found in commercial rice really Oryza sativa? Weed
Science, 49, 468–476.
Wang S, Basten CJ, Zeng Z-B (2012) Windows QTL Cartographer
2.5. Department of Statistics, North Carolina State Univer-
sity, Raleigh, NC. (http://statgen.ncsu.edu/qtlcart/WQTL
Cart.htm)
Wei X, Xu J, Guo H et al. (2010) DTH8 suppresses flowering in
rice, influencing plant height and yield potential simulta-
neously. Plant Physiology, 153, 1747–1758.
Xiao JH, Li J, Grandillo S et al. (1998) Identification of trait-
improving quantitative trait loci alleles from a wild rice
relative, Oryza rufipogon. Genetics, 150, 899–909.Xu NW, Xu S, Ehlers J (2009) Estimating the broad-sense heri-
tability of early growth cowpea. International Journal of Plant
Genomics, doi:10.1155/2009/984521.
Yan W-H, Wang P, Chen H-X et al. (2011) A major QTL,
Ghd8, plays pleiotropic roles in regulating grain productiv-
ity, plant height, and heading date in rice. Molecular Plant,
4, 319–330.
Yano M, Harushima Y, Nagamura Y et al. (1997) Identification
of quantitative trait loci controlling heading date in rice
using a high-density linkage map. Theoretical and Applied
Genetics, 95, 1025–1032.
Yano M, Katayose Y, Ashikari M et al. (2000) Hd1, a major
photoperiod sensitivity quantitative trait locus in rice, is
closely related to the Arabidopsis flowering time gene
CONSTANS. The Plant Cell, 12, 2473–2483.
Yoon H-S, Baum DA (2004) Transgenic study of parallelism in
plant morphological evolution. Proceedings of the National
Academy of Sciences, USA, 101, 6524–6529.Zhang L-B, Zhu Q, Wu Z-Q et al. (2009) Selection on grain
shattering genes and rates of rice domestication. New Phytol-
ogist, 184, 708–720.
Zhang L, Wang S, Li H et al. (2010) Effects of missing marker
and segregation distortion on QTL mapping in F2 popula-
tions. Theoretical and Applied Genetics, 121, 1071–1082.
Zhu B-F, Si L, Wang Z et al. (2011) Genetic control of a transi-
tion from black to straw-white seed hull in rice domestica-
tion. Plant Physiology, 155, 1301–1311.
Zhu Y, Ellstrand NC, Lu B-R (2012) Sequence polymorphism
in wild, weedy, and cultivated rice suggest seed-shattering
locus sh4 played a minor role in Asian rice domestication.
Ecology and Evolution, 2, 2106–2113.
A.L.C. and C.S.T. designed the research. C.S.T. performed the
research. M.H.J. and Y.J. contributed reagents and data collec-
tion. A.L.C. and C.S.T. analysed the data. A.L.C. and C.S.T.
wrote the article.
Data accessibility
Phenotype and genotype data for all individuals are
included in the Supplemental Data files.
Supporting information
Additional supporting information may be found in the online
version of this article.
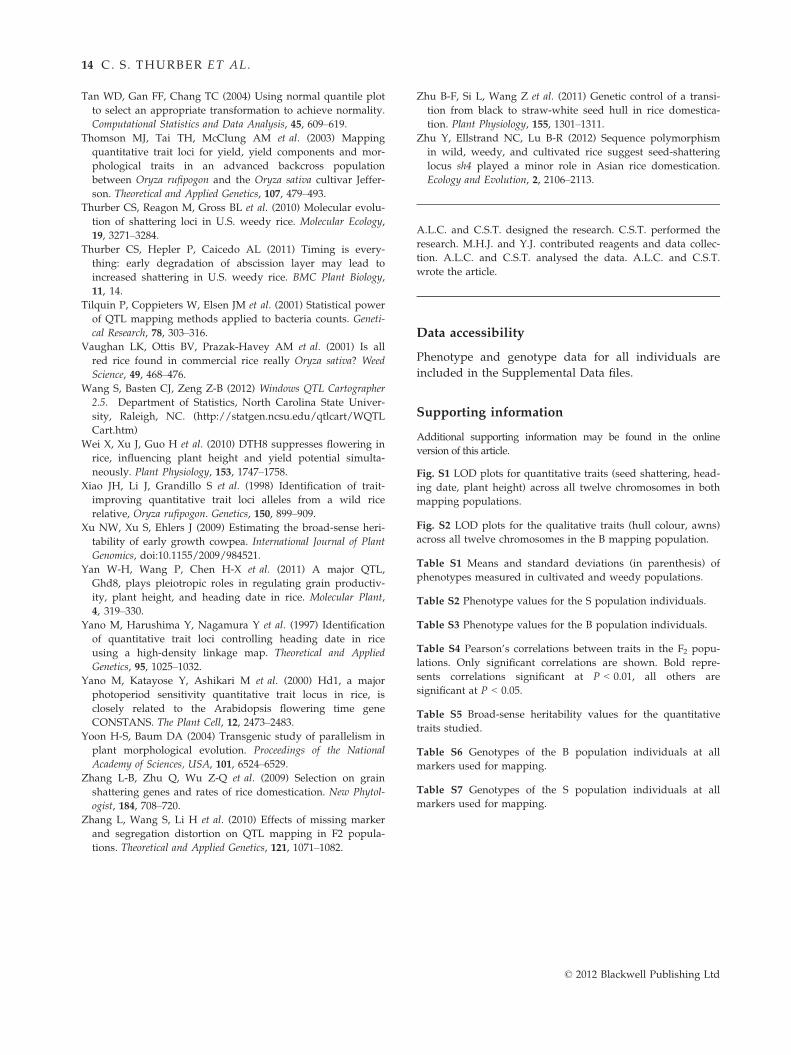
Fig. S1 LOD plots for quantitative traits (seed shattering, head-
ing date, plant height) across all twelve chromosomes in both
mapping populations.
Fig. S2 LOD plots for the qualitative traits (hull colour, awns)
across all twelve chromosomes in the B mapping population.
Table S1 Means and standard deviations (in parenthesis) of
phenotypes measured in cultivated and weedy populations.
Table S2 Phenotype values for the S population individuals.
Table S3 Phenotype values for the B population individuals.
Table S4 Pearson’s correlations between traits in the F2 popu-
lations. Only significant correlations are shown. Bold repre-
sents correlations significant at P < 0.01, all others are
significant at P < 0.05.
Table S5 Broad-sense heritability values for the quantitative
traits studied.
Table S6 Genotypes of the B population individuals at all
markers used for mapping.
Table S7 Genotypes of the S population individuals at all
markers used for mapping.
© 2012 Blackwell Publishing Ltd
14 C. S . THURBER ET AL.

S population B population
Heading Date
Plant Height
0.0
0.5
1.0
1.5
2.0
1 2 3 4 5 6 7 8 9 10 11 12
0
1
2
3
4
5
6
7
lod
1 2 3 4 5 6 7 8 9 10 11 12 1 2 3 4 5 6 7 8 9 10 11 12
0
1
2
3
4
5
6
7
Chromosome
lod
1 2 3 4 5 6 7 8 9 10 11 12
Seed Shattering
1 2 3 4 5 6 7 8 9 10 11 12 1 2 3 4 5 6 7 8 9 10 11 12
1 2 3 4 5 6 7 8 9 10 11 12 1 2 3 4 5 6 7 8 9 10 11 12
lod
lod
Chromosome Chromosome
0.0
0.5
1.0
1.5
2.0
2.5
3.0
Chromosome
lod
1 2 3 4 5 6 7 8 9 10 11 12
0.0
0.5
1.0
1.5
2.0
Chromosomelo
d
1 2 3 4 5 6 7 8 9 10 11 12
Chromosome
lod
1 2 3 4 5 6 7 8 9 10 11 12
Chromosomelo
d
1 2 3 4 5 6 7 8 9 10 11 12
Hull color Awns
Related Documents

![Personality Antecedents of Online Buying Impulsiveness · for examining human behavior [4] ... traits delineate the programs of behavior that individuals run ... Value consciousness](https://static.cupdf.com/doc/110x72/5af67d777f8b9a4d4d9087e3/personality-antecedents-of-online-buying-examining-human-behavior-4-traits.jpg)