SILSOE RESEARCH INSTITUTE Using the wavelet transform to elucidate complex spatial covariation of environmental variables Murray Lark

SILSOE RESEARCH INSTITUTE Using the wavelet transform to elucidate complex spatial covariation of environmental variables Murray Lark.
Dec 22, 2015
Welcome message from author
This document is posted to help you gain knowledge. Please leave a comment to let me know what you think about it! Share it to your friends and learn new things together.
Transcript

SILSOE RESEARCH INSTITUTE
Using the wavelet transform to elucidate complex spatial
covariation of environmental variables
Murray Lark

SILSOE RESEARCH INSTITUTE
Geostatistical analysis:
Our data are realizations of coregionalized random variables, Zu(x) and Zv(x) with auto– and cross–variograms:

SILSOE RESEARCH INSTITUTE
0.50 1.00 1.50 2.00 2.50 3.00 3.50 4.00 4.50
1.00
1.50
2.00
2.50
3.00
3.50
4.00
4.50
5.00
5.50
From Atteia et al. (1984)

SILSOE RESEARCH INSTITUTE
0
400
800
1200
0 0.5 1 1.5 2
Zn-Zn
0
40
80
120
0 0.5 1 1.5 2
Ni-Ni
0
0.4
0.8
1.2
Sem
ivari
ance
0 0.5 1 1.5 2
Cd-Cd
0
1
2
3
4
5
6
Cro
ss-s
em
ivari
ance
0 0.5 1 1.5 2
Cd-Ni
0
5
10
15
20
25
0 0.5 1 1.5 2
Cd-Zn
0
50
100
150
200
250
0 0.5 1 1.5 2
Ni-Zn
Lag distance /km

SILSOE RESEARCH INSTITUTE

SILSOE RESEARCH INSTITUTE
Assumptions
intrinsic stationarity, including the requirement that the variogram may be defined as a function of lag only:
A motivation for considering the wavelet transform.

SILSOE RESEARCH INSTITUTE
The wavelet transform.
The basis functions (wavelets) have a narrow support and so provide a local analysis

SILSOE RESEARCH INSTITUTE
A complete analysis is obtained by translation and dilation of a basic (mother) wavelet
The wavelet transform.

SILSOE RESEARCH INSTITUTE
The wavelet transform.

SILSOE RESEARCH INSTITUTE

SILSOE RESEARCH INSTITUTE
Using the Adapted Maximal Overlap DiscreteWavelet Transform (Lark and Webster, 2001).

SILSOE RESEARCH INSTITUTE

SILSOE RESEARCH INSTITUTE
AMODWT partitions variance andcovariance by scale.
SILSOE RESEARCH INSTITUTE

SILSOE RESEARCH INSTITUTE
-1.0
-0.5
0.0
0.5
1.0
Wav
ele
t co
rrela
tio
n
0 50 100 150 200 250 Scale parameter /m
Wavelet correlations of N2O emissions andsoil organic carbon content

SILSOE RESEARCH INSTITUTE
-1.0
-0.5
0.0
0.5
1.0
Wav
ele
t co
rrela
tio
n
0 50 100 150 200 250 Scale parameter /m
Wavelet correlations of N2O emissions andsoil pH
SILSOE RESEARCH INSTITUTE
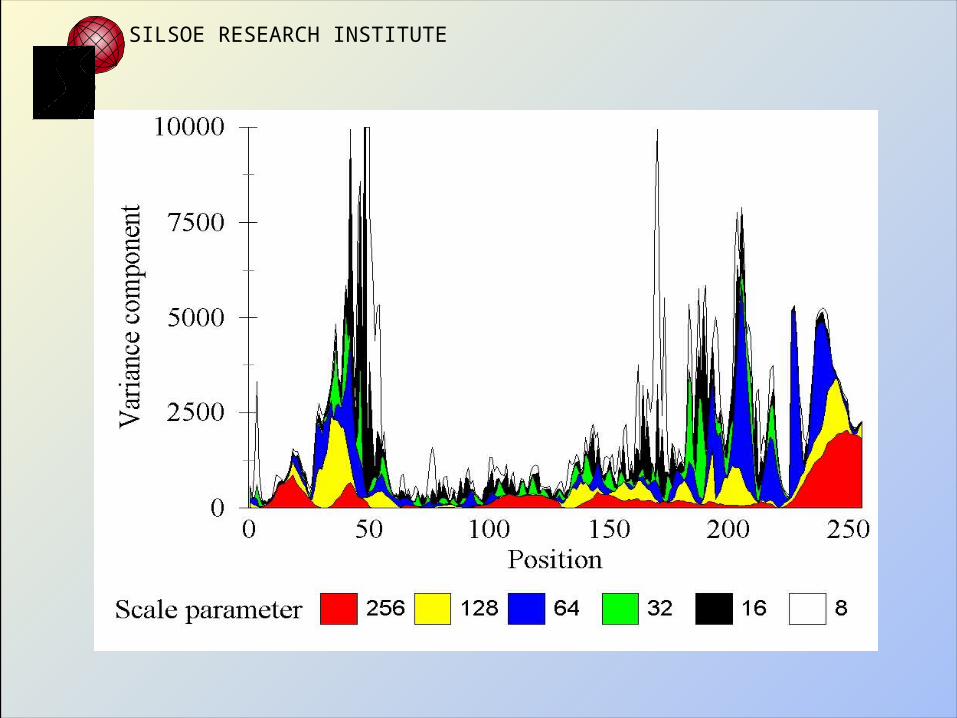
0 50 100 150 200 250 Position
256 m
128 m
64 m
32 m
16 m
8 m
N2O emission rate
Soil OC content

SILSOE RESEARCH INSTITUTE
0 50 100 150 200 250 Position
256 m
128 m
64 m
32 m
16 m
8 m
N2O emission rate as measured
N2O emission rate predicted by a mechanistic model

SILSOE RESEARCH INSTITUTE
Conclusions.
1. The wavelet transform allows us to identify scale- and location-dependency in the relationships between variables.
2. No assumptions of stationarity are invoked.
3. The analysis can give insight into spatially complex relationships and into the performance of process models.
Related Documents