HAL Id: hal-00691500 https://hal.archives-ouvertes.fr/hal-00691500 Submitted on 28 Sep 2015 HAL is a multi-disciplinary open access archive for the deposit and dissemination of sci- entific research documents, whether they are pub- lished or not. The documents may come from teaching and research institutions in France or abroad, or from public or private research centers. L’archive ouverte pluridisciplinaire HAL, est destinée au dépôt et à la diffusion de documents scientifiques de niveau recherche, publiés ou non, émanant des établissements d’enseignement et de recherche français ou étrangers, des laboratoires publics ou privés. Distributed under a Creative Commons Attribution| 4.0 International License Silicon pool dynamics and biogenic silica export in the Southern Ocean inferred from Si-isotopes François Fripiat, Anne-Julie Cavagna, Frank Dehairs, Sabrina Speich, Luc André, Damien Cardinal To cite this version: François Fripiat, Anne-Julie Cavagna, Frank Dehairs, Sabrina Speich, Luc André, et al.. Silicon pool dynamics and biogenic silica export in the Southern Ocean inferred from Si-isotopes. Ocean Science, European Geosciences Union, 2011, 7 (5), pp.533-547. 10.5194/os-7-533-2011. hal-00691500

Welcome message from author
This document is posted to help you gain knowledge. Please leave a comment to let me know what you think about it! Share it to your friends and learn new things together.
Transcript

HAL Id: hal-00691500https://hal.archives-ouvertes.fr/hal-00691500
Submitted on 28 Sep 2015
HAL is a multi-disciplinary open accessarchive for the deposit and dissemination of sci-entific research documents, whether they are pub-lished or not. The documents may come fromteaching and research institutions in France orabroad, or from public or private research centers.
L’archive ouverte pluridisciplinaire HAL, estdestinée au dépôt et à la diffusion de documentsscientifiques de niveau recherche, publiés ou non,émanant des établissements d’enseignement et derecherche français ou étrangers, des laboratoirespublics ou privés.
Distributed under a Creative Commons Attribution| 4.0 International License
Silicon pool dynamics and biogenic silica export in theSouthern Ocean inferred from Si-isotopes
François Fripiat, Anne-Julie Cavagna, Frank Dehairs, Sabrina Speich, LucAndré, Damien Cardinal
To cite this version:François Fripiat, Anne-Julie Cavagna, Frank Dehairs, Sabrina Speich, Luc André, et al.. Silicon pooldynamics and biogenic silica export in the Southern Ocean inferred from Si-isotopes. Ocean Science,European Geosciences Union, 2011, 7 (5), pp.533-547. �10.5194/os-7-533-2011�. �hal-00691500�

Ocean Sci., 7, 533–547, 2011www.ocean-sci.net/7/533/2011/doi:10.5194/os-7-533-2011© Author(s) 2011. CC Attribution 3.0 License.
Ocean Science
Silicon pool dynamics and biogenic silica export inthe Southern Ocean inferred from Si-isotopes
F. Fripiat 1,2, A.-J. Cavagna3, F. Dehairs3, S. Speich4, L. Andr e1, and D. Cardinal1,*
1Section of Mineralogy and Petrography, Royal Museum for Central Africa, Tervuren, Belgium2Department of Earth and Environmental Sciences, Universite Libre de Bruxelles, Bruxelles, Belgium3Analytical and Environmental Chemistry & Earth System Sciences, Vrije Universiteit Brussel, Brussels, Belgium4Laboratoire de Physique des Oceans, UMR6523, IFREMER, CNRS, IRD, UBO, Plouzane, France* now at: Laboratoire d’Oceanographie et du Climat: Experimentations et Approches Numeriques,Universite Pierre & Marie Curie, Paris, France
Received: 8 March 2011 – Published in Ocean Sci. Discuss.: 30 March 2011Revised: 18 August 2011 – Accepted: 19 August 2011 – Published: 6 September 2011
Abstract. Silicon isotopic signatures (δ30Si) of water col-umn silicic acid (Si(OH)4) were measured in the SouthernOcean, along a meridional transect from South Africa (Sub-tropical Zone) down to 57◦ S (northern Weddell Gyre). Thisprovides the first reported data of a summer transect acrossthe whole Antarctic Circumpolar Current (ACC).δ30Si vari-ations are large in the upper 1000 m, reflecting the effect ofthe silica pump superimposed upon meridional water trans-fer across the ACC: the transport of Antarctic surface watersnorthward by a net Ekman drift and their convergence andmixing with warmer upper-ocean Si-depleted waters to thenorth. Using Si isotopic signatures, we determine differentmixing interfaces: the Antarctic Surface Water (AASW), theAntarctic Intermediate Water (AAIW), and thermoclines inthe low latitude areas. The residual silicic acid concentra-tions of end-members control theδ30Si alteration of the mix-ing products and with the exception of AASW, all mixing in-terfaces have a highly Si-depleted mixed layer end-member.These processes deplete the silicic acid AASW concentra-tion northward, across the different interfaces, without sig-nificantly changing the AASWδ30Si composition. By com-paring our new results with a previous study in the Australiansector we show that during the circumpolar transport of theACC eastward, theδ30Si composition of the silicic acid poolsis getting slightly, but significantly lighter from the Atlanticto the Australian sectors. This results either from the disso-lution of biogenic silica in the deeper layers and/or from anisopycnal mixing with the deep water masses in the different
Correspondence to:F. Fripiat([email protected])
oceanic basins: North Atlantic Deep Water in the Atlantic,and Indian Ocean deep water in the Indo-Australian sector.This isotopic trend is further transmitted to the subsurfacewaters, representing mixing interfaces between the surfaceand deeper layers.
Through the use ofδ30Si constraints, net biogenic sil-ica production (representative of annual export), at theGreenwich Meridian is estimated to be 5.2±1.3 and 1.1±
0.3 mol Si m−2 for the Antarctic Zone and Polar Front Zone,respectively. This is in good agreement with previous esti-mations. Furthermore, summertime Si-supply into the mixedlayer of both zones, via vertical mixing, is estimated to be1.6±0.4 and 0.1±0.5 mol Si m−2, respectively.
1 Introduction
In the Southern Ocean, deep nutrient-rich waters ascendinto the surface layer and are returned equatorward as sub-surface waters, before the available nitrogen pool is fullyused by phytoplankton. This contrasts with silicon (in theform of silicic acid, Si(OH)4), which is much more depletedby diatom growth and exported along the same pathway(Sarmiento et al., 2004). The Southern Ocean redistributesnutrients at a global scale, thus representing the largest un-used nutrient reservoir of the ocean interior and bearing mostof the potential to increase the efficiency of the marine bio-logical carbon pump (Sigman et al., 2010). The strong de-coupling between nitrogen (N) and silicon (Si) impacts ma-rine productivity at lower latitudes and is due to a complexinterplay between, (i) different diatom morphological typespresenting varying cellular silicification (Baines et al., 2010),
Published by Copernicus Publications on behalf of the European Geosciences Union.

534 F. Fripiat et al.: Southern Ocean silicic acidδ30Si composition
(ii) iron and light limitation favouring heavily silicified di-atoms (Takeda, 1998; Franck et al., 2003), (iii) the “sili-cate pump” reflecting the deeper remineralization of Si com-pared to N (Dugdale et al., 1995; Brzezinski et al., 2003a)and (iv) grazing-induced changes in cell wall silicificationas an inducible defence against herbivory (Smetacek et al.,2004; Pondaven et al., 2007; Schultes et al., 2010). Thezonal silicic acid gradient is thus controlled by surface waterSi uptake by phytoplankton (e.g. diatoms) to form opalinecell walls (referred to as biogenic silica, bSiO2; Pondavenet al., 2000; Brzezinski et al., 2001). At the same time, itis affected by remineralization and physical processes suchas vertical mixing, lateral advection and subsequent interme-diate water mass formation (Sarmiento et al., 2004, 2007).Deciphering the relative importance of these different pro-cesses, which control the nutrient distribution in the SouthernOcean, and understanding how they affect nutrient export tothe lower latitudes is necessary to better constrain the role ofthe Southern Ocean in global biogeochemical cycles of thepast, present, and future (Sarmiento et al., 2004; Sigman etal., 2010).
The isotopic composition of silicon (δ30Si) is a valu-able tool to help address this point: (i) it integrates longertimescales and larger spatial scales compared to direct fluxmeasurements (e.g. isotope dilution experiments; sedimenttraps), (ii) it does not manipulate micro-organisms whichcan induce artefacts, and (iii) the different sensitivities of themass and isotopic balances in marine systems mean sourcescan be identified as well as the discrimination between dif-ferent processes, e.g. bSiO2 production (De La Rocha et al.,1997), bSiO2 dissolution (Demarest et al., 2009), and mixing(Fripiat et al., 2011a). Si(OH)4 uptake by diatoms leaves aclear imprint on the isotopic compositions of both Si(OH)4and bSiO2. The fractionation factor (30ε = −1.1± 0.4 ‰)reported by De La Rocha et al. (1997) seems independentof temperature, species (De La Rocha et al., 1997), cell size(Cardinal et al., 2007) and appears relatively constant acrosscontrasted hydrological environments including fresh watersystems (Alleman et al., 2005). By compiling existing data,Fripiat et al. (2011a) estimate an average30ε for the AntarcticCircumpolar Current (ACC) of−1.2±0.2 ‰, a value indis-tinguishable from in vitro estimates. Biogenic silica disso-lution preferentially releases the light Si isotope,28Si, witha fractionation factor of−0.55 ‰ (Demarest et al., 2009).This fractionation is opposite to that occurring during Si-uptake, by about half the absolute magnitude. By increas-ing the bSiO2 dissolution over production (D:P ) ratio, theoverall fractionation factor would be dampened (Demarest etal., 2009). Currently, spatial and seasonal coverage ofδ30Simeasurements in the global ocean are limited and additionalmeasurements, controlled experiments and modelling effortsare required to better constrain the origin and fate of the iso-topic composition, as well as to better assess modern andpast distributions. Indeed, an important application of natu-ral Si-isotopic variability is to track past silicon supply: con-
sumption ratios by measuringδ30Si of opal accumulating insediments (De La Rocha et al., 1998; Brzezinski et al., 2002;Beucher et al., 2007).
In this study we present the first complete summer transectof δ30SiSi(OH)4 (surface to seafloor) in the different fronts andzones of the Antarctic Circumpolar Current (ACC) and itsadjacent subsystems (the SubTropical Zone and the north-ern part of the Weddell Gyre). The results are discussed interms of source, pathway, and fate of silicon across the differ-ent Southern Ocean water masses and the interaction of thelatter with the water masses from other oceanic basins. Re-sults are compared with a similar transect sampled in springand located in the Australian sector of the Southern Ocean(CLIVAR-SR3; Cardinal et al., 2005). The isotopic con-straints allow us to quantify the annual net bSiO2 productionand the vertical summertime Si-supply into the mixed layer,both in the Antarctic Zone and Polar Front Zone, using theapproach described in Fripiat et al. (2011a). A companionstudy, Fripiat et al. (2011c), is focused on the origin and fatesof δ30SibSiO2 across the whole water column.
2 Materials and methods
Between 7 February and 24 March 2008, the InternationalPolar Year (IPY) BONUS-GoodHope (BGH) cruise aboardthe R/VMarion Dufresnecovered a transect from Cape Town(South Africa) up to 58◦ S in the Southern Ocean roughlycentred on the 0◦ meridian (Fig. 1a). The general aim ofBGH, a GEOTRACES-IPY endorsed project, is to under-stand the interactions between the physics and biogeochem-istry in the Atlantic sector of the Southern Ocean and its ex-changes with the Indo-Atlantic connection in the wake ofthe Agulhas system. Eleven stations were sampled for Si-isotopes which were distributed across the different subsys-tems (Fig. 1a); complete water column profiles (∼13 depthsper station) were obtained.
Seawater was collected using a CTD (conductivity-temperature-depth) rosette equipped with 12 l Niskin bot-tles. Water samples (0.25 to 10 l) were immediately filteredon Nuclepore polycarbonate membranes (0.4 µm porosity)using Perspex filtration units under the pressure of filteredair (<2 bar). Filtered water samples for silicic acid analy-sis were stored in acid-cleaned polypropylene (PP) bottlesat room temperature in the dark. Potential temperature (2,sd =± 0.0017◦C), salinity (S, sd =± 0.0016) and dissolvedoxygen (O2, sd =± 2.1 µmol kg−1) were recorded using aSBE 911+ Seabird® 216 probe, with respectively, SBE3+,SBE4 and SBE43 sensors (Branellec et al., 2010). Datarecording and validation of potential temperature, salinityand oxygen are described by Branellec et al. (2010).
Ocean Sci., 7, 533–547, 2011 www.ocean-sci.net/7/533/2011/
F. Fripiat et al.: Southern Ocean silicic acidδ30Si composition 535
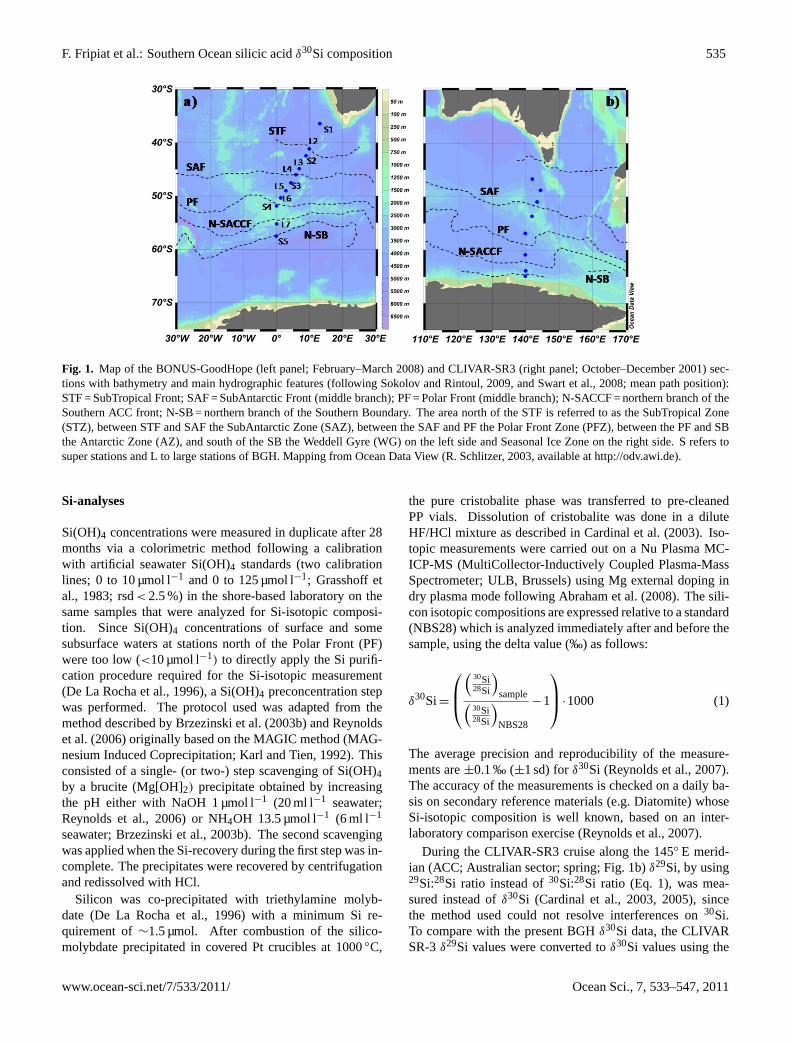
Fig. 1. Map of the BONUS-GoodHope (left panel; February–March 2008) and CLIVAR-SR3 (right panel; October–December 2001) sec-tions with bathymetry and main hydrographic features (following Sokolov and Rintoul, 2009, and Swart et al., 2008; mean path position):STF = SubTropical Front; SAF = SubAntarctic Front (middle branch); PF = Polar Front (middle branch); N-SACCF = northern branch of theSouthern ACC front; N-SB = northern branch of the Southern Boundary. The area north of the STF is referred to as the SubTropical Zone(STZ), between STF and SAF the SubAntarctic Zone (SAZ), between the SAF and PF the Polar Front Zone (PFZ), between the PF and SBthe Antarctic Zone (AZ), and south of the SB the Weddell Gyre (WG) on the left side and Seasonal Ice Zone on the right side. S refers tosuper stations and L to large stations of BGH. Mapping from Ocean Data View (R. Schlitzer, 2003, available athttp://odv.awi.de).
Si-analyses
Si(OH)4 concentrations were measured in duplicate after 28months via a colorimetric method following a calibrationwith artificial seawater Si(OH)4 standards (two calibrationlines; 0 to 10 µmol l−1 and 0 to 125 µmol l−1; Grasshoff etal., 1983; rsd< 2.5 %) in the shore-based laboratory on thesame samples that were analyzed for Si-isotopic composi-tion. Since Si(OH)4 concentrations of surface and somesubsurface waters at stations north of the Polar Front (PF)were too low (<10 µmol l−1) to directly apply the Si purifi-cation procedure required for the Si-isotopic measurement(De La Rocha et al., 1996), a Si(OH)4 preconcentration stepwas performed. The protocol used was adapted from themethod described by Brzezinski et al. (2003b) and Reynoldset al. (2006) originally based on the MAGIC method (MAG-nesium Induced Coprecipitation; Karl and Tien, 1992). Thisconsisted of a single- (or two-) step scavenging of Si(OH)4by a brucite (Mg[OH]2) precipitate obtained by increasingthe pH either with NaOH 1 µmol l−1 (20 ml l−1 seawater;Reynolds et al., 2006) or NH4OH 13.5 µmol l−1 (6 ml l−1
seawater; Brzezinski et al., 2003b). The second scavengingwas applied when the Si-recovery during the first step was in-complete. The precipitates were recovered by centrifugationand redissolved with HCl.
Silicon was co-precipitated with triethylamine molyb-date (De La Rocha et al., 1996) with a minimum Si re-quirement of∼1.5 µmol. After combustion of the silico-molybdate precipitated in covered Pt crucibles at 1000◦C,
the pure cristobalite phase was transferred to pre-cleanedPP vials. Dissolution of cristobalite was done in a diluteHF/HCl mixture as described in Cardinal et al. (2003). Iso-topic measurements were carried out on a Nu Plasma MC-ICP-MS (MultiCollector-Inductively Coupled Plasma-MassSpectrometer; ULB, Brussels) using Mg external doping indry plasma mode following Abraham et al. (2008). The sili-con isotopic compositions are expressed relative to a standard(NBS28) which is analyzed immediately after and before thesample, using the delta value (‰) as follows:
δ30Si=
(
30Si28Si
)sample(
30Si28Si
)NBS28
−1
·1000 (1)
The average precision and reproducibility of the measure-ments are±0.1 ‰ (±1 sd) forδ30Si (Reynolds et al., 2007).The accuracy of the measurements is checked on a daily ba-sis on secondary reference materials (e.g. Diatomite) whoseSi-isotopic composition is well known, based on an inter-laboratory comparison exercise (Reynolds et al., 2007).
During the CLIVAR-SR3 cruise along the 145◦ E merid-ian (ACC; Australian sector; spring; Fig. 1b)δ29Si, by using29Si:28Si ratio instead of30Si:28Si ratio (Eq. 1), was mea-sured instead ofδ30Si (Cardinal et al., 2003, 2005), sincethe method used could not resolve interferences on30Si.To compare with the present BGHδ30Si data, the CLIVARSR-3δ29Si values were converted toδ30Si values using the
www.ocean-sci.net/7/533/2011/ Ocean Sci., 7, 533–547, 2011

536 F. Fripiat et al.: Southern Ocean silicic acidδ30Si composition
Fig. 2. Interpolation of2 (◦C, a), salinity (b), both with oxygen contours (µmol kg−1; white lines) distributions during BONUS-Goodhope(adapted from Speich et al., 2011).
theoretical conversion factor of 1.96 calculated from the ki-netic fractionation law (Young et al., 2002).
3 Results
In the following discussion, the different water massesare defined by their potential temperature, salinity, andO2 properties (Fig. 2): Upper Circumpolar Deep Water(UCDW; oxygen minimum), Lower Circumpolar Deep Wa-ter (LCDW; deep salinity maximum), Antarctic Intermediate
Water (AAIW; subsurface salinity minimum), Winter Wa-ter (WW, subsurface temperature minimum), SAZ-STZ ther-moclines (between AAIW and the mixed layer, ML), andAntarctic Bottom Water (AABW; bottom increases in O2content, decreases in temperature and salinity). As somewater masses presented asymmetric distribution in both con-centration and isotopic composition, the median and the in-terquartile range (· 2/3, similar to 1 sd) has been chosen asmetric for the “central values” and dispersion for the differ-ent water masses.
Ocean Sci., 7, 533–547, 2011 www.ocean-sci.net/7/533/2011/

F. Fripiat et al.: Southern Ocean silicic acidδ30Si composition 537
Table 1. Si(OH)4 concentration and isotopic composition. Only thestandard deviations of samples replicated are provided. The solidlines represent the mixed layer depth.
Station Depth Si(OH)4 δ30SiSi(OH)4 sdm µmol l−1 ‰ ‰
Super 5 29 65.2 1.85 0.0016 March 2008 88 64.2 2.00
00.02◦ E–57.32◦ S 151 84.1 1.50 0.03199 96.2 1.35 0.01251 101.5 1.37 0.05299 104.2 1.41 0.05400 110.5 1.44 0.36499 117.2 1.47700 116.5 1.44 0.201003 120.0 1.271499 119.1 1.131999 116.6 1.12 0.062500 119.7 1.433000 117.2 1.11 0.083979 118.8 1.08
Large 7 4 50.7 1.9514 March 2008 80 50.0 1.78 0.07
00.03◦ E–55.14◦ S 100 58.9 1.77 0.11149 74.4 1.54199 79.7 1.53 0.17300 86.5 1.61600 93.9 1.25 0.081002 103.5 1.342096 122.7 1.382768 129.2 1.43 0.03
Super 4 11 22.2 2.4211 March 2008 79 22.3 2.37 0.0600.00◦ E–51.87◦ S 100 21.9 2.16 0.08
149 30.5 2.03199 63.2 1.48 0.00300 86.0 1.41 0.09398 87.6 1.58 0.17553 88.9 1.37 0.16704 90.1 1.531201 101.9 1.351601 109.5 1.472001 121.6 1.302551 131.2 1.13
In the mixed layer,δ30SiSi(OH)4 and Si(OH)4 concentra-tions displayed an inverse pattern with latitude (Table 1;Fig. 3a, b).30Si enrichment was associated with a decrease inSi(OH)4 concentration from south to north, as also reportedin earlier studies (Varela et al., 2004; Cardinal et al., 2005).This condition is mainly driven by the preferential uptakeof 28Si by diatoms (De La Rocha et al., 1997) along thenorthward advection of surface waters (Varela et al., 2004)followed by diatom export out of the mixed layer. This
Table 1. Continued.
Station Depth Si(OH)4 δ30SiSi(OH)4 sdm µmol l−1 ‰ ‰
Large 6 3 4.0 2.478 March 2008 48 4.0 2.4801.18◦ E–50.22◦ S 98 5.1 2.47
129 20.1 2.03200 41.3 2.04251 48.2 1.57 0.15401 64.4 1.42 0.13602 75.7 1.39801 79.3 1.46999 79.1 1.37 0.151501 78.4 1.442002 93.1 1.282500 115.4 1.362998 124.7 1.383596 125.9 1.62
Large 5 9 1.8 2.777 March 2008 70 1.9 2.84 0.08
02.50◦ E–49.02◦ S 100 2.0 1.99 0.03151 7.2 2.07200 13.8 1.92300 22.4 1.36402 30.9 1.99 0.28600 44.6 1.63799 65.6 1.53 0.011000 68.2 1.582001 76.2 1.413001 105.7 1.374080 128.6 1.44
Super 3 5 2.1 3.24 0.016 March 2008 41 2.1 2.8504.23◦ E–47.33◦ S 79 2.2 2.36
100 4.2 2.57 0.19
149 9.2 2.30200 10.4 2.42401 25.3 1.93 0.35600 42.5 1.671002 67.8 1.431403 70.0 1.422000 76.6 1.342301 85.6 1.26 0.012900 101.8 1.39 0.343500 116.0 1.164101 122.6 1.374532 132.1 1.28
study reveals heavier summer surfaceδ30SiSi(OH)4 signaturesin agreement with an increased seasonal Si(OH)4 depletion(Fig. 3) relative to spring results (Cardinal et al., 2005), fortwo different ACC transects (Australian and Atlantic sectors,respectively, Fig. 1).
www.ocean-sci.net/7/533/2011/ Ocean Sci., 7, 533–547, 2011

538 F. Fripiat et al.: Southern Ocean silicic acidδ30Si composition
Table 1. Continued.
Station Depth Si(OH)4 δ30SiSi(OH)4 sdm µmol l−1 ‰ ‰
Large 4 5 1.0 2.50 0.053 March 2008 32 1.2 3.0105.52◦ E–46.01◦ S 61 1.1 2.44
90 2.9 2.72151 6.9 2.41300 16.3 1.90501 29.5 1.70749 51.5 1.68 0.071000 68.3 1.451502 75.4 1.511999 73.3 1.36 0.092497 87.1 1.363001 104.4 1.433500 113.7 1.404148 126.0 1.47
Large 3 11 1.0 2.46 0.192 March 2008 28 0.9 2.78 0.23
06.53◦ E–44.54◦ S 101 4.4 2.32 0.12149 6.0 2.07298 11.1 2.06400 14.8 1.83 0.101251 66.8 1.541997 71.4 1.513001 95.8 1.363601 110.5 1.224371 125.9 1.24
Super 2 10 0.6 3.24 0.0527 February 2008 40 1.0
08.56◦ E–42.28◦ S 80 2.5 2.07 0.06100 3.2 1.89 0.08150 4.8 2.09300 9.5 2.01 0.14601 19.0 1.831001 46.9 1.50 0.011400 68.0 1.29 0.112000 71.6 1.282501 66.1 1.42 0.093500 87.1 1.304057 110.6 1.36
Most of the δ30SiSi(OH)4 variation across the BONUS-GoodHope transect was limited to the upper 1000 m, with aclear north-south gradient showing heavier Si-isotopic val-ues equatorward associated with a decrease in [Si(OH)4](Figs. 3 and 4). Although the isotopic variation below1000 m was small, there was still a slight decrease in valuesof δ30SiSi(OH)4 coincident with increasing Si(OH)4 concen-trations (Fig. 4), as reported also by Cardinal et al. (2005) andFripiat et al. (2011a). The Upper Circumpolar Deep Water(UCDW) had a slightly heavierδ30SiSi(OH)4 signature and a
Table 1. Continued.
Station Depth Si(OH)4 δ30SiSi(OH)4 sdm µmol l−1 ‰ ‰
Large 2 101 1.2 1.9625 February 2008 200 3.1 1.8913.10◦ E–36.45◦ S 504 14.4 1.77
600 18.9 1.731000 48.4 1.55 0.072001 64.0 1.482900 69.2 1.574200 114.9 1.444570 117.9 1.13 0.01
Super 1 4 2.2 3.04 0.2421 February 2008 25 2.3 2.89 0.07
13.10◦ E–36.45◦ S 75 4.5 2.07 0.01220 4.8 1.99420 9.7 1.79701 26.0 1.361002 51.4 1.641499 68.8 1.482001 60.0 1.372559 62.7 1.40 0.012900 65.9 1.183499 88.2 1.514199 112.2 1.30 0.144600 116.0 1.065000 115.6 1.05
lower Si(OH)4 concentration than Lower Circumpolar DeepWater (LCDW) and Antarctic Bottom Water (AABW).
4 Discussion
4.1 General considerations
In the following discussion, we will follow the silicon path-way and the transformations encountered along the merid-ional as well as the circumpolar circulations of the ACC.The ACC represents the largest mass transport of all oceancurrents, a slab of water more than 2000 m thick movingeastward (Tomczak and Godfrey, 2001), but mainly centeredin several jets along frontal systems: the inner ACC fronts(Sokolov and Rintoul, 2009); SubAntarctic Front, Antarc-tic Polar Front, Southern ACC Front. The ACC fronts rep-resent almost impermeable barriers, delimiting zones withrelatively constant hydrological and biogeochemical proper-ties (Sokolov and Rintoul, 2007) although cross frontal ex-changes do occur locally, associated with sharp topographicfeatures. This wind-driven meridional ACC circulation ischaracterised by: (1) the shoaling of deeper isopycnal sur-faces (UCDW and LCDW) in the Southern ACC towardsthe Antarctic divergence (Fig. 2; Pollard et al., 2002, 2006),
Ocean Sci., 7, 533–547, 2011 www.ocean-sci.net/7/533/2011/

F. Fripiat et al.: Southern Ocean silicic acidδ30Si composition 539
Fig. 3. Interpolation ofδ30Si (b, d) and [Si(OH)4] (a, c) distribu-tions in the upper 1000 m during BONUS-GoodHope (this study;a, b) and CLIVAR-SR3 (145◦ E; c, d; from Cardinal et al., 2005).Interpolation is from Ocean Data View (R. Schlitzer, 2003, avail-able athttp://odv.awi.de). The positions of the fronts from Speichet al. (2011) at the time of sampling are also shown (dashed whitelines).
(2) part of the upwelled CDW losing buoyancy near Antarc-tica to form AABW (Orsi et al., 1999) and the remaininggaining buoyancy and being advected northward (Antarc-tic Surface Water, AASW) via Ekman pumping (Fig. 2;Sloyan and Rintoul, 2001; Pollard et al., 2002), (3) the sub-sequent formation of intermediate water masses taking place(AAIW, and SubAntarctic Mode Water, SAMW), spreadingand deepening northward of the PF (Fig. 2: Sarmiento et al.,2004). The latitudinalδ30Si variation in the water columnfollows this meridional circulation (Figs. 3 and 4).
During the BGH which took place in late summer 2008,the measured silicon properties of the mixed layer can beconsidered as representative of final summer conditions.This is supported by (i) a Si-uptake in the mixed layer in thelower range of published values, 0.02±0.03 µmol Si l−1 d−1
(mean Si-uptake from30Si tracer incubations for the BGHtransect,n = 27 triplicates), accounting only for 0.6±0.9 %
Fig. 4. Interpolation ofδ30Si (a) and [Si(OH)4] (b) distributionsfor the complete water column during BONUS-GoodHope. Inter-polation is from Ocean Data View (R. Schlitzer, 2003, available athttp://odv.awi.de). The positions of the fronts at the time of sam-pling (Speich et al., 2011) are shown as dashed white lines.
of the available silicic acid concentration (Fripiat, 2010), and(ii) satellite Chl-a/POC data indicating that the main produc-tive period in the area occurred roughly in December (Mooreand Abbot, 2000; Allison et al., 2010).
4.2 Isotopic constraints on the silicic acid leakage fromthe Southern Ocean to the low latitude areas
4.2.1 Southern ACC
We define the southern ACC as the area south of the PolarFront where isopycnal surfaces shoal and UCDW and LCDWupwell near the surface (Fig. 2). From Fig. 5a, it is apparentthat the subsurface waters (WW and UCDW) in the southernACC are mixing interfaces between LCDW and AZ mixedlayers. Indeed, both AZ-PF Winter Water (WW) and UCDWfit well on a mixing curve with the AZ-PF mixed layer andthe LCDW as end-members, in agreement with our obser-vations for the Indian sector of the Southern Ocean (Fripiatet al., 2011a). The UCDW and AZ-PF mixed layers gener-ate a homogeneous deep mixed layer at the onset of winterconvective mixing: Antarctic Surface Water (AASW; Park etal., 1998). Due to surface warming in the summer, AntarcticSurface Water stratifies into an upper ML and a lower WW,with the latter maintaining the original AASW characteristics(Pondaven et al., 2000a; Altabet and Francois, 2001; Fripiatet al., 2011a; Cavagna et al., 2011).
Using the mixing curve with the UCDW and AZ-PF MLmedian values (Fig. 5a) and the following equation:
fUCDW =δ30SiAASW −δ30SiML
δ30SiUCDW−δ30SiML(2)
www.ocean-sci.net/7/533/2011/ Ocean Sci., 7, 533–547, 2011

540 F. Fripiat et al.: Southern Ocean silicic acidδ30Si composition
S
i Si(
OH
)4 (‰
)
1
1
1
1
2
2
2
2
2
?
0 20 40
1.2
1.4
1.6
1.8
2.0
2.2
2.4
2.6
2.8
SAF
ML
Thermocline3 ± 1 µmol l-1
1.99 ± 0.10‰ 15 ±1.91
1 ± 1 µmol l-1
2.9 ± 0.17‰
Si-depleSurface w
?
? = Subtropical
a)
c)Si(OH)4 (µmol l-1)
60 80
AZ-PF LCDWUCDWAAIWAZ-PF PFZ MLPF WW
F PF
ML ML
WW
UCDW
AAIW59 ±1.57
69 ±1.47
± 11 µmol l-1
1 ± 0.24‰
22 ±2.40
2 ± 1 µmol l-1
2.77 ± 0.23‰
eted waters
Partly Surf
input
100 120
WW
W
MLL
W
ML
Th4 ± 11.65
SB
W
W
± 22 µmol l-1
7 ± 0.33‰
± 8 µmol l-1
7 ± 0.09‰
± 16 µmol l-1
0 ± 0.24‰
Si-depleted face waters
0
1.8
2.0
2.2
2.4
2.6
2.8
3.0
b)
d)
SAF
L ML
AAIhermocline µmol l-1
± 0.07‰ 23 ± 12 µm1.64 ± 0.31‰
11 ±2.05
3 ± 2 µmol l-1
1.94 ± 0.15‰
Si(OH)4 (µ
2 4 6 8
PF
L ML
WW
UCDW
IW58 ± 26 µm1.59 ± 0.18
78 ± 13 µm1.23 ± 0.10‰
ol l-1
‰
28 ± 10 µm1.90 ± 0.10
0 µmol l-1
± 0.03‰
µmol l-1)
10 12 14
AAIWSAZ-STZ Thermocline SAF-SAZ-STZ ML
SB
mol l-1
‰
ol l-1
‰
mol l-1
‰
16
Fig. 5. (a) and (b): δ30Si and Si concentration values for different water masses across the BONUS-GoodHope transect (this study).Some mixing curve are also shown: between LCDW and AZ-PF mixed layer (blue line), between PF-AZ AASW and PFZ mixed layer(dashed red line), between PF AASW and PFZ mixed layer (dotted-dashed red line), and between AAIW and SAZ-STZ mixed layer (greenline). When there is no indication of zone, it refers to the median of the whole BGH transect.(c): schematic view of the processesresponsible for the observedδ30Si distribution in subsurface waters across BONUS-GoodHope north of the Southern Boundary, representingthe mixing interfaces between surface and deeper waters. Identified mixing interfaces are the AASW = WW, the AAIW, and the low latitudethermoclines. The arrows represent the mixing end-members keeping the same colors than in(a) and(b). (d): schematic view of the mixinginterfaces across the CLIVAR-SR3 transect north of the Southern Boundary (Cardinal et al., 2005). Median and interquartile range· 2/3represent the “central value” and dispersion for the water masses. The number of computed data for BONUS Goodhope, respectively forSi(OH)4 andδ30SiSi(OH)4, is for UCDW (24:24), WW (11:11), AAIW (11:11); STZ-SAZ thermocline (7:7); AZ-PF ML (8:8); PFZ ML(9:9); SAF-SAZ-STZ ML (6:5). For CLIVAR SR3, it is for UCDW (41:17), WW (12:8), AAIW (18:8), SAMW (11:3), AZ-PF ML (8:7);PFZ ML (4:2); SAF-SAZ-STZ ML (10:6).
we estimate the mean UCDW Si mass fraction contribution(fUCDW) to AASW in the AZ (represented by the mean ofAZ-PF WW) to be 0.89. This value is close to the val-ues reported for: (1) the HNLC area east of the Kergue-len plateau with the same methodology (i.e. 0.78, Fripiatet al., 2011a); and (2) also at the 0◦ Meridian between theSB and SACCF with a model using concentrations of ni-trate and phosphates in winter (i.e. 0.90, Hoppema et al.,2000). By integrating the WW Si(OH)4 concentration overthe water column between the surface and bottom waters
of the WW layer (i.e. the 300± 50 m deep AASW) andmultiplying that amount with the UCDW contribution, wecalculate that UCDW contributes 15.7± 2.6 mol Si m−2 toAASW. Standard errors for the mass balance estimationswere obtained from Montecarlo simulations (normal dis-tribution, n = 1000). The 100± 25 m deep summer MLwill thus inherit (100/300)· (15.7±2.6 mol Si m−2) or 5.2±
1.3 mol Si m−2 which becomes available at the start of thegrowth season. The main assumptions behind these estima-tions are: (1) the UCDW Si-supply to the AASW mainly
Ocean Sci., 7, 533–547, 2011 www.ocean-sci.net/7/533/2011/
F. Fripiat et al.: Southern Ocean silicic acidδ30Si composition 541
occurs during winter when the AASW is generated by deepconvective mixing (Fig. 5a), and (2) the WW compositionat the end of summer is still representative of the originalAASW which represents the Si-source for the summer mixedlayer (Pondaven et al., 2000a; Altabet and Francois, 2001;Fripiat et al., 2011a).
Assuming that steady state conditions apply (i.e. sup-ply equals export at the annual scale), the effective an-nual net bSiO2 production should be equal to the an-nual vertical UCDW Si-supply of 5.2 ± 1.1 mol Si m−2,which is again similar to the value of 4.0±0.7 mol Si m−2
we reported earlier for the Indian sector (Fripiat et al.,2011a). This value exceeds the seasonal depletion esti-mated from a simple mixed layer mass balance which is3.6±0.9 mol Si m−2 yr−1 (i.e. difference between WW andML Si(OH)4 concentration). Such imbalance indicates thatsome 1.6± 0.4 mol Si m−2 yr−1 are being supplied to themixed layer during the summer stratification period. Thisflux is indistinguishable from the one observed in the Indiansector (Fripiat et al., 2011a). Sokolov and Rintoul (2007)stress the homogenous character of biogeochemical proper-ties within the different ACC zones. Therefore, the discrep-ancy between net bSiO2 production and seasonal Si(OH)4depletion is likely matched by a vertical supply of Si, ratherthan a horizontal supply, which would advect waters withsimilar Si-conditions. Note that Hoppema et al. (2000) esti-mate also at 0◦ meridian a seasonal silicic acid depletion, be-tween the SACCF and SB, at 4.5±0.7 mol Si m−2 yr−1. Theslightly higher value from the latter study is probably due tothe fact that this estimation has been done in the SouthernAZ instead of the whole AZ.
Jin et al. (2006) estimated opal export out of the eu-photic layer in the Southern Ocean in the range of 1 to9 mol Si m−2 yr−1, which encompasses our estimate of netbSiO2 production. Integrating our estimation over the wholeAZ area (14.106 km2, JGOFS synthesis report, 2001), netbSiO2 production is 73± 18 Tmol Si yr−1 including 22±5 Tmol Si yr−1 originating from silicon supply during sum-mer months. Considering a global net biogenic silica pro-duction of 171±35 Tmol Si yr−1 (mean from Nelson et al.,1995; Usbeck, 1999; Heinze et al., 2003; Jin et al., 2006), theAZ therefore contributes 42±13 % to this net production.
4.2.2 Northern ACC and STZ
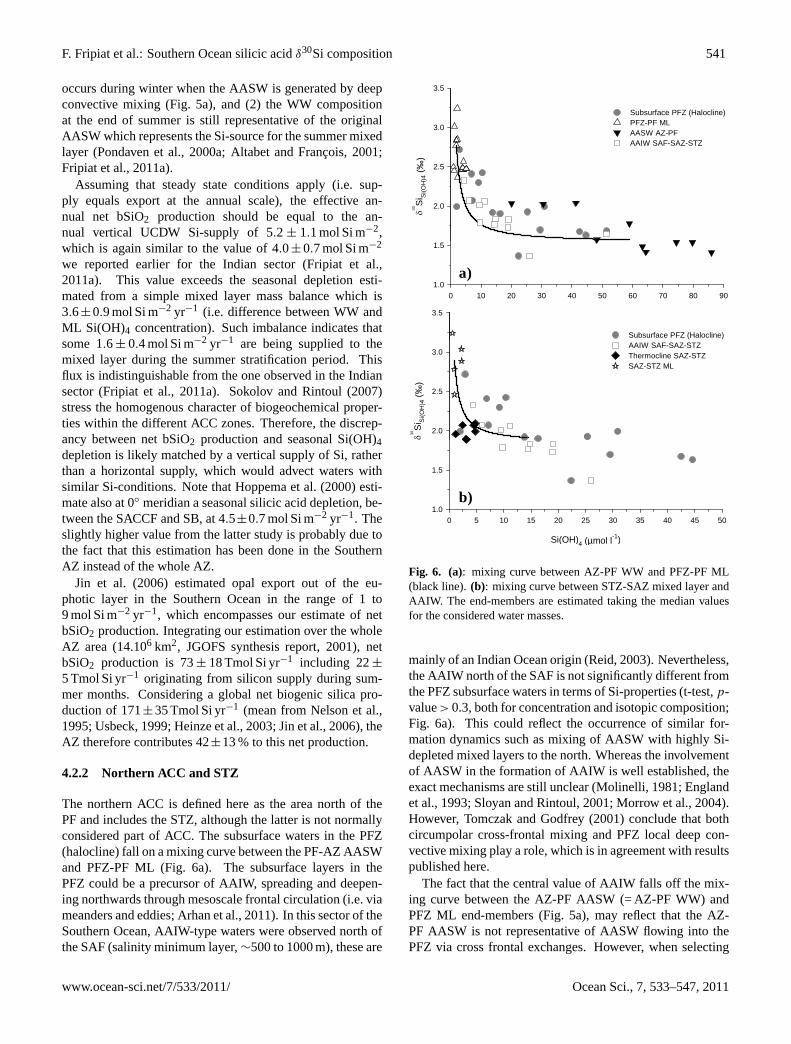
The northern ACC is defined here as the area north of thePF and includes the STZ, although the latter is not normallyconsidered part of ACC. The subsurface waters in the PFZ(halocline) fall on a mixing curve between the PF-AZ AASWand PFZ-PF ML (Fig. 6a). The subsurface layers in thePFZ could be a precursor of AAIW, spreading and deepen-ing northwards through mesoscale frontal circulation (i.e. viameanders and eddies; Arhan et al., 2011). In this sector of theSouthern Ocean, AAIW-type waters were observed north ofthe SAF (salinity minimum layer,∼500 to 1000 m), these are
3.0
3.5
Subsurface PFZ (Halocline)PFZ-PF MLAASW AZ-PFAAIW SAF SAZ STZ
30
Si S
i(O
H)4
(‰
)
2.0
2.5
AAIW SAF-SAZ-STZ
0 10 20 30 40 50 60 70 80 90
1.0
1.5
3.5
Subsurface PFZ (Halocline)
a)
30
Si S
i(O
H)4
(‰
)2.0
2.5
3.0AAIW SAF-SAZ-STZThermocline SAZ-STZSAZ-STZ ML
Si(OH) (µmol l-1)
0 5 10 15 20 25 30 35 40 45 50
1.0
1.5
b)
Si(OH)4 (µmol l )
Fig. 6. (a): mixing curve between AZ-PF WW and PFZ-PF ML(black line).(b): mixing curve between STZ-SAZ mixed layer andAAIW. The end-members are estimated taking the median valuesfor the considered water masses.
mainly of an Indian Ocean origin (Reid, 2003). Nevertheless,the AAIW north of the SAF is not significantly different fromthe PFZ subsurface waters in terms of Si-properties (t-test,p-value> 0.3, both for concentration and isotopic composition;Fig. 6a). This could reflect the occurrence of similar for-mation dynamics such as mixing of AASW with highly Si-depleted mixed layers to the north. Whereas the involvementof AASW in the formation of AAIW is well established, theexact mechanisms are still unclear (Molinelli, 1981; Englandet al., 1993; Sloyan and Rintoul, 2001; Morrow et al., 2004).However, Tomczak and Godfrey (2001) conclude that bothcircumpolar cross-frontal mixing and PFZ local deep con-vective mixing play a role, which is in agreement with resultspublished here.
The fact that the central value of AAIW falls off the mix-ing curve between the AZ-PF AASW (= AZ-PF WW) andPFZ ML end-members (Fig. 5a), may reflect that the AZ-PF AASW is not representative of AASW flowing into thePFZ via cross frontal exchanges. However, when selecting
www.ocean-sci.net/7/533/2011/ Ocean Sci., 7, 533–547, 2011

542 F. Fripiat et al.: Southern Ocean silicic acidδ30Si composition
strictly the AASW (= PF WW), with Si-properties at the PFas end-member conditions, AAIW does fall on the mixingcurve with PFZ-ML. Therefore PF AASW is a better end-member representative of the cross frontal exchange process.
We estimate the AASW Si mass fraction contribution toAAIW to reach 0.97 (adapted Eq. 2). Such a high valuehighlights that almost all the Si in the AAIW originatesfrom the AASW layer with only a very low residual Si-contribution from the summer PFZ mixed layers. Assum-ing steady state conditions once more, the annual AASW Si-supply into the AAIW must be balanced by the net bSiO2production. Considering that the thickness of the AAIW andthe ML layers are 750±250 m and 80±20 m (based on T-Swater properties), respectively, we calculate the net bSiO2production at 1.1± 0.4 mol Si m−2 yr−1. The seasonal Si-depletion (from the difference between AAIW and PFZ MLSi(OH)4 concentrations) is 1.0±0.3 mol Si m−2 yr−1. Thisvalue is close to the net bSiO2 production estimate imply-ing the summer Si-supply to be small and poorly constrained(0.1±0.5 mol Si m−2 yr−1). Based on the compilation of Si-uptake and bSiO2 dissolution rates from tracer incubationexperiments, Fripiat et al. (2011b) noted that the mean netbSiO2 production in the PFZ was 1.2 mol Si m−2 yr−1, in ac-cordance with results published here. Integrating our esti-mation, 1.1±0.4 mol Si m−2 yr−1, over the whole PFZ area(3.106 km2, JGOFS synthesis report, 2001), the net bSiO2production is 3±1 Tmol Si m−2 yr−1 representing 2±1 % ofthe global net biogenic silica production (Nelson et al., 1995;Usbeck, 1999; Heinze et al., 2003; Jin et al., 2006). Thus di-atom activity in the PFZ removes only a small fraction of theSi supplied to this area. The lower Si(OH)4 concentrationof AAIW mainly reflect the highly Si(OH)4 depleted PF andPFZ surface water, imposing low Si(OH)4 contents on the re-sulting mixing product (AAIW) without inducing changes inδ30Si (Figs. 5a, c, 6).
Analysing the nitrate isotopic distribution, Sigman etal. (1999) suggested that the main source for nitrate in thePFZ was AASW advected northwards by Ekman drift. Theyreport the AAIW to be only slightly different from AASWin terms of NO3 concentration and isotopic composition,which contrasts with our observations for Si, especially re-garding Si(OH)4 concentration, which is significantly lowerin AAIW than in AASW. The large decoupling between theseasonal depletion of Si(OH)4 and nitrate in the mixed layercould explain the difference between this study and Sigmanet al. (1999) regarding the degree of AASW alteration dur-ing formation of AAIW. Nitrate concentration is still high atthe PF and PFZ (30 to 20 µmol l−1) compared to [Si(OH)4](<5 µmol l−1), while Si and N contents of PF WW are both∼35 µmol l−1. As a result, nitrate biogeochemical propertiesof AAIW appear closer to those for AASW, leading Sigmanet al. (1999) to conclude that unaltered AASW is the mainsource for the AAIW nitrate pool.
The subsurface waters in SAZ and STZ are characterizedby a thermocline between the mixed layer and the AAIW be-
2 5
3.0
3.5 ACC south of PFACC north of PFEquatorial PacificNorth Pacific
30S
i Si(
OH
)4 (
‰)
1 0
1.5
2.0
2.5
Si(OH)4 (µmol l-1)
0 5 10 15 20 25 30 35 40 45 50 55 60
0.5
1.0
Fig. 7. δ30Si vs. Si(OH)4 for samples with Si< 60 µmol Si l−1 inthe ACC and the Pacific Ocean: ACC south of the PF are repre-sented by black dots (Varela et al., 2004; Cardinal et al., 2005; Frip-iat et al., 2011c; Cavagna et al., 2011; this study), ACC north ofthe PF by white dots (Cardinal et al., 2005; this study), the Equato-rial Pacific by crossed white squares (Beucher et al., 2008), and thenorth Pacific by white squares (De La Rocha et al., 2000; Reynoldset al., 2006).
low (salinity minimum layer). Despite the fact that valuesfall slightly below the mixing curve (Figs. 5b and 6b), theSi characteristics clearly identify the thermocline in the SAZand STZ as being a mixing interface between AAIW and theSAZ-STZ ML (Fig. 6b). The slight offset could be explainedby the fact that the entire subtropical region, just north of ourrepresentative SAZ station (S2; Fig. 1a), is impacted by theAgulhas Current. This is the western boundary current flow-ing southward along the Southern Eastern Africa continentalslope before retroflecting eastward and forming intense anti-cyclonic eddies (Agulhas rings), constituting the STF in theIndo-Atlantic sector and potentially crossing the STF into theSAZ region (Dencausse et al., 2011). These rings supply In-dian central waters and AAIW of Indian origin into this re-gion. Since the variety of the mixing end-members was notsampled here, it is not possible to estimate the net bSiO2 pro-duction and the summertime Si-supply as has been possiblefor the PFZ and the AZ.
The spreading and deepening northward of the SouthernOcean water masses (AAIW and SubAntarctic Mode Wa-ter (SAMW), the latter water mass was measured duringCLIVAR-SR3 although not BGH) is propagated towards theEquatorial Pacific, as clearly seen from their similarity withthe Si isotopic composition of subsurface waters in the Equa-torial Pacific (Beucher et al., 2008, Fig. 7). This indicatesthat AAIW-SAMW waters are the main Si-suppliers to thesurface waters at lower latitudes, as has also been shown bySarmiento et al. (2004).
Ocean Sci., 7, 533–547, 2011 www.ocean-sci.net/7/533/2011/

F. Fripiat et al.: Southern Ocean silicic acidδ30Si composition 543
4.2.3 Paleoceanographic implications
The fact that the mesopelagic layers (∼100–1000 m) withtheir Si content and isotopic characteristics are the sourceregion for Si to most of the surface waters, has significantimplications for the paleoceanographic interpretation of theδ30Si records preserved in the sediments. Different ACCmixing interfaces have been identified: AASW, AAIW, bothcharacterizing the halocline and the thermocline water north-wards. The residual silicic acid concentrations of the end-members control theδ30Si alteration of the mixing products.Except for AASW, all the mixing interfaces have a highly Si-depleted mixed layer as end-member. As a result, the silicicacid AASW concentration is diluted across the different in-terfaces without significantly changing the AASWδ30Si sig-nature (Figs. 5c, 7). Si-utilization in the northern ACC and atlower latitudes will thus yield a similar surface waterδ30Sirange as in the southern ACC, although with a lower silicicacid concentration (Figs. 5c, 7). The North Pacific Ocean hassignificantly lighterδ30Si values (Reynolds et al., 2006) andconsequently, for similar levels of Si-utilization, theδ30Si ofthe resulting surface water will be lighter. From a palaeo-ceanographic perspective, the mesopelagic variation inδ30Sirecorded in the Southern ACC (within and south of the PF)induces a complexity since glacial circulation and hydrol-ogy is expected to be different from today (Toggweiler et al.,2006; Watson and Naveira Garabato, 2006). It is probablethat different oceanic circulations altered the Si- propertiesof water masses and subsequently theδ30Si of the source re-gions feeding surface waters.δ30Si in the subsurface variesbetween +1.3 to +2.0 ‰ (Fig. 3b, d), a range which is sig-nificant with regard to the isotopic difference observed forSouthern Ocean sediments between glacial/interglacial pe-riods (∼+0.2 to +1.5 ‰ in the AZ, De La Rocha et al.,1998; Brzezinski et al., 2002, and∼+1 to +2 ‰ in the SAZ,Beucher et al., 2007). These dynamic effects must be as-sessed through, for example, a process-oriented modellingeffort.
4.3 Inter-oceanic leakage of Si-isotopes
Along the pathway of the global ocean overturning circula-tion (OC), silicic acid concentrations increase in North At-lantic Deep Waters (NADW) during the processes of the OCtowards the North Pacific and North Indian as the North Pa-cific Deep Water (NPDW) and the Indian Ocean Deep Wa-ter (IODW), respectively (Fig. 8a). This leads to a progres-sive accumulation of dissolved Si from bSiO2 dissolution(Sarmiento et al., 2004, 2007), which is supported by thediffering values of theδ30Si of silicic acid which decreasesfrom ∼+1.4 ‰ in NADW to∼+0.6 ‰ in NPDW (Fig. 8a; DeLa Rocha et al., 2000; Reynolds et al., 2006). Similar trendsare also observed forδ13CDIC due to the remineralization oforganic matter (Kroopnick, 1985). However, the lack of aδ30Si gradient between the NADW and Circumpolar Deep
Waters (CDW, Fig. 8a) probably results from an almost com-plete utilisation of silicic acid in most of the Atlantic Oceansurface waters (Conkright et al., 2002). As a result, the inte-gratedδ30Si of sinking biogenic silica converges to the oneof the source, i.e. silicic acid supply, so that theδ30Si of thebSiO2 rain-out from the surface is similar to that of silicicacid in subsurface waters (initially mostly AAIW), ultimatelysinking in the North Atlantic to form NADW (Sarmiento etal., 2004; Reynolds, 2009). The subsequent Si-isotopic light-ening from the CDW to the NPDW (Fig. 8a) can be attributedto the dissolution of settling diatoms in areas where silicicacid is only partly used (Pondaven et al., 2000b; Brzezin-ski et al., 2001). Consequently values integrateδ30Si sig-natures significantly lighter than the source, as is the casefor the Southern Ocean and North Pacific. In contrast withReynolds (2009) who, based on modelling approaches, re-ports that the Si isotopic gradient is centered in the South-ern Ocean deep waters, the measured isotopic gradient indeep waters (∼1.0 ‰) is in fact sharper along the deep Pa-cific basins, while the isotopic shift observed along the ACCpathway shows only a slight, though significant (t-test,p-value< 0.001)30Si depletion of∼0.2 ‰ (Fig. 8b).
Toggweiler et al. (2006) partitioned the global ocean’soverturning circulation in two cells, the northern and south-ern cells which occupy distinct domains in the ocean’s in-terior as detailed in the following. In the modern Oceanthese cells mix together to form CDW, which comes up tothe surface along the southern flank of the ACC. The mid-depth northern cell is the domain of North Atlantic Deep Wa-ter (NADW), presenting lower Si(OH)4 concentrations andheavierδ30Si values (Fig. 8a). The lower ventilated south-ern cell is the domain of the deep, bottom waters (AABW,IODW, and NPDW), characterised by higher Si(OH)4 con-centrations and lighterδ30Si values (Fig. 8a). This partion-ing could partly explain the isotopic gradient in the CDW viaisopycnal mixing from the Atlantic sector, where NADW en-ters the Southern Ocean, compared to the Australian sector,where waters are already potentially affected by the mixingwith the IODW (Reid, 2003), probably bearing a lighter Si-isotopic composition as for NPDW. Moreover, the partition-ing of the global ocean’s overturning circulation in two cells,with different ventilation rates (Toggweiler et al., 2006),could act as a positive feedback for the isotopic expressionof biogenic silica dissolution effects in the Pacific Ocean aslight silicic acid from bSiO2 dissolution is trapped in the Pa-cific Ocean, presenting lower ventilation (Sarmiento et al.,2007).
An unexpected feature is the much heavier isotopic com-position in the eastern Equatorial Pacific and in the Cascadiabasin (Beucher et al., 2008), compared to the western north-ern Pacific (Fig. 8a; De La Rocha et al., 2000; Reynolds,2009). It is evident that more data from the deep Pacific andIndian Oceans are required in order to resolve the deep Si-isotope distribution pattern and to identify the mechanismsdriving it.
www.ocean-sci.net/7/533/2011/ Ocean Sci., 7, 533–547, 2011
544 F. Fripiat et al.: Southern Ocean silicic acidδ30Si composition
2.4 AZ-PF WW= AASW1.6
1.2
1.4
1.6
1.8
2.0
2.2 AtlanticAustralian
y = -0.010 (±0.002) x + 2.28 (± 0.12) R2 = 0.77 - p value < 0.001
y = -0 010 (±0 002) x + 2 09 (± 0 14)
30
Si S
i(OH
)4 (
‰)
0.6
0.8
1.0
1.2
1.4
NADWCDWAABWNPDW (Equatorial Pacific)NPDW (North West Pacific) ) )
0 20 40 60 80 100
1.0
OH
)4 (
‰) 1.4
1.6
2 0
2.2
2.4
2.6
2.8
3.0
AtlanticAustralian
SAZ-STZ thermocline - AAIW - SAMW
y 0.010 (±0.002) x + 2.09 (± 0.14)R2 = 0.71 - p value < 0.001
0 40 80 120 160 200 240
0.4
NPDW (North-West Pacific) NPDW (North-East Pacific) a) c)
Si(OH)4 (µmol l-1)
20 40 60 80 100 120 140 160
30
Si S
i(O
0.8
1.0
1.2
UCDW AtlanticUCDW Australian LCDW AtlanticLCDW Australian
Si(OH)4 (µmol l-1)
0 10 20 30 40 50 60
1.0
1.2
1.4
1.6
1.8
2.0
b) d)
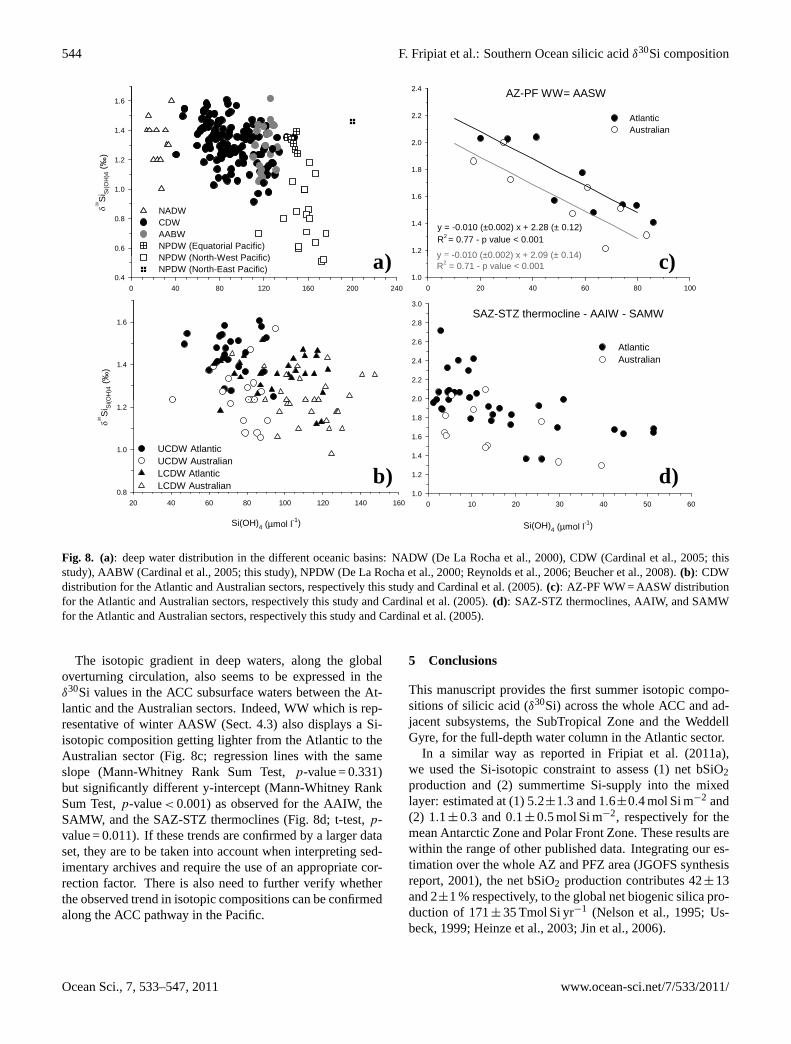
Fig. 8. (a): deep water distribution in the different oceanic basins: NADW (De La Rocha et al., 2000), CDW (Cardinal et al., 2005; thisstudy), AABW (Cardinal et al., 2005; this study), NPDW (De La Rocha et al., 2000; Reynolds et al., 2006; Beucher et al., 2008).(b): CDWdistribution for the Atlantic and Australian sectors, respectively this study and Cardinal et al. (2005).(c): AZ-PF WW = AASW distributionfor the Atlantic and Australian sectors, respectively this study and Cardinal et al. (2005).(d): SAZ-STZ thermoclines, AAIW, and SAMWfor the Atlantic and Australian sectors, respectively this study and Cardinal et al. (2005).
The isotopic gradient in deep waters, along the globaloverturning circulation, also seems to be expressed in theδ30Si values in the ACC subsurface waters between the At-lantic and the Australian sectors. Indeed, WW which is rep-resentative of winter AASW (Sect. 4.3) also displays a Si-isotopic composition getting lighter from the Atlantic to theAustralian sector (Fig. 8c; regression lines with the sameslope (Mann-Whitney Rank Sum Test,p-value = 0.331)but significantly different y-intercept (Mann-Whitney RankSum Test,p-value< 0.001) as observed for the AAIW, theSAMW, and the SAZ-STZ thermoclines (Fig. 8d; t-test,p-value = 0.011). If these trends are confirmed by a larger dataset, they are to be taken into account when interpreting sed-imentary archives and require the use of an appropriate cor-rection factor. There is also need to further verify whetherthe observed trend in isotopic compositions can be confirmedalong the ACC pathway in the Pacific.
5 Conclusions
This manuscript provides the first summer isotopic compo-sitions of silicic acid (δ30Si) across the whole ACC and ad-jacent subsystems, the SubTropical Zone and the WeddellGyre, for the full-depth water column in the Atlantic sector.
In a similar way as reported in Fripiat et al. (2011a),we used the Si-isotopic constraint to assess (1) net bSiO2production and (2) summertime Si-supply into the mixedlayer: estimated at (1) 5.2±1.3 and 1.6±0.4 mol Si m−2 and(2) 1.1±0.3 and 0.1±0.5 mol Si m−2, respectively for themean Antarctic Zone and Polar Front Zone. These results arewithin the range of other published data. Integrating our es-timation over the whole AZ and PFZ area (JGOFS synthesisreport, 2001), the net bSiO2 production contributes 42±13and 2±1 % respectively, to the global net biogenic silica pro-duction of 171±35 Tmol Si yr−1 (Nelson et al., 1995; Us-beck, 1999; Heinze et al., 2003; Jin et al., 2006).
Ocean Sci., 7, 533–547, 2011 www.ocean-sci.net/7/533/2011/

F. Fripiat et al.: Southern Ocean silicic acidδ30Si composition 545
δ30Si in the subsurface waters is mainly controlled bymixing processes, transmitting the isotopic imprint result-ing from surface water Si-uptake down to depth. Differentmixing interfaces have been determined: the Antarctic Sur-face Water, the Antarctic Intermediate Water, and the lowlatitude thermoclines. The level of Si-depletion is an impor-tant factor controlling the alteration ofδ30Si in the mixinginterface. Indeed, a highly Si-depleted water mass dilutesthe silicic acid concentration of the mixing product, withoutsignificantly affectingδ30Si. Except for the AASW, whichis the ultimate source for the subsurface waters in the ACC,each mixing interface has a highly depleted mixed layer asan end-member. Overall the AASW silicic acid concentra-tion strongly decreases northward across the different mixinginterfaces, keeping the initial AASWδ30Si signature (Car-dinal et al., 2005; Beucher et al., 2008; this study). Conse-quently, almost all surface waters in the modern ocean withinand north of the PF are characterised by similarδ30Si signa-tures, though silicic acid concentrations differ. Such observa-tions contrast significantly with the model outputs from Wis-chmeyer et al. (2003) or Reynolds (2009), and point out theabsence of knowledge of the processes involved in modernSi-isotopic distributions.
Ocean hydrology and circulation is thought to be differ-ent along glacial/interglacial timescales. Modification of theocean’s circulation could therefore significantly affect theδ30Si of subsurface waters. Through a process-oriented mod-elling effort, this mixing induced variability inδ30Si has tobe better constrained for the proper use of this proxy in pale-oceanography. Furthermore, as has been highlighted here, aprogressive decrease inδ30Si values is observed along theeastward ACC transport of water masses between the At-lantic (this study) and the Australian sector (Cardinal et al.,2005). This probably results from: (1) the progressive ac-cumulation of Si from dissolving biogenic silica along theeastward ACC transport and (2) isopycnal mixing betweendeep water masses in each of the oceanic basins. Should thisACC trend be further confirmed by new Pacific ACC tran-sects, this isotopic effect would then need to be correctedwhen the isotopic composition of sedimentary biogenic sil-ica is interpreted.
Acknowledgements.Our warm thanks go to the officers and crew ofthe R/VMarion Dufresneduring the BONUS-GoodHope programand the Institut Paul Emile Victor for inviting us on board. We arealso grateful to J. de Jong and N. Mattielli for the management of theMC-ICP-MS laboratory at ULB and to L. Monin and N. Dahkani(RMCA) for their help in sample processing and to Virginia Panizzo(ULB) for correction of English. This work was conducted withinthe BELCANTO III network (contracts SD/CA/03A of SPSDIII,Support Plan for Sustainable Development) funded by BELSPO,the Belgian Science Policy. Luc Andre thanks the FNRS for itsfinancial support (FRFC project 2.4512.00). F. Fripiat is a post-doctoral fellow funded by the FNRS.
Edited by: M. Hoppema
References
Abraham, K., Opfergelt, S., Fripiat, F., Cavagna, A.-J., de Jong, J.T. M., Foley, S. F., Andre, L., and Cardinal, D.:δ30Si andδ29Sideterminations on USGS BHVO-1 and BHVO-2 reference ma-terials with a new configuration on a Nu Plasma Multi-CollectorICP-MS, Geost. Geoanal. Res., 32(2), 193–202, 2008.
Alleman, L., Cardinal, D., Cocquyt, C., Plisnier, P. D., Descy, J.-P.,Kimirei, I., Sinyinza, D., and Andre, L.: Silicon isotopic frac-tionation in Lake Tanganyika and its main tributaries, J. GreatLakes Res. 31, 509–519, 2005.
Allison, D. B., Stramski, D., and Mitchell, B. G.: Seasonal andinterannual variability of particulate organic carbon within theSouthern Ocean from satellite ocean color observations, J. Geo-phys. Res. 115, C06002,doi:10.1029/2009JC005347, 2010.
Altabet, M. A. and Francois, R.: Nitrogen isotope biogeochem-istry of the Antarctic Polar Frontal Zone at 170◦ W, Deep-SeaRes. Pt. II, 48, 4247–4273, 2001.
Arhan, M., Speich, S., Messager, C., Dencausse, G., Fine, R., andBoye, M.: Anticyclonic and cyclonic eddies of subtropical ori-gin in the subantarctic zone south of Africa, J. Geophys. Res.,doi:10.1029/2011JC007140, in press, 2011.
Baines, S. B., Twining, B. S., Brzezinski, M. A., Nelson, D. M.,and Fisher, N. S.: Causes and biogeochemical implications of re-gional differences in silicification of marine diatoms, Global Bio-geochem. Cy., 24, GB4031,doi:10.1029/2010GB003856, 2010.
Beucher, C. P., Brzezinski, M. A., and Crosta, X.: Silicic acid dy-namics in the glacial sub-Antarctic: Implications for the silicicacid leakage hypothesis, Global Biogeochem. Cy., 21, GB3015,doi:10.1029/2006GB002746, 2007.
Beucher, C. P., Brzezinski, M. A., and Jones, J. L.: Sources and bio-logical fractionation of silicon isotopes in the Eastern EquatorialPacific, Geochim. Cosmochim. Ac., 72, 3063–3073, 2008.
Branellec, P., Arhan, M., and Speich, S.: Projet GoodHope, Cam-pagne BONUS-GoodHope, Rapport de donnees CTD-O2. Rap-port interne Ifremer, OPS/LPO/10-02, LPO-IFREMER, 2010.
Brzezinski, M. A., Nelson, D. M, Franck, V. M., and Sigmon, D. E.:Silicon dynamics within an intense open-ocean diatom bloom inthe Pacific sector of the Southern Ocean, Deep-Sea Res. Pt. II,48, 3997–4018, 2001.
Brzezinski, M. A., Pride, C. J., Franck, V. M., Sigman, D. M.,Sarmiento, J. L., Matsumoto, K., Gruber, N., Rau, G. H., andCoale, K. H.: A switch from Si(OH)4 to NO−
3 depletion inthe glacial Southern Ocean, Geophys. Res. Lett. 29(12), 1564,doi:10.1029/2001GL014349, 2002.
Brzezinski, M. A., Dickson, M.-L., Nelson, D. M., and Sambrotto,R.: Ratios of Si, C and N uptake by microplankton in the South-ern Ocean, Deep-Sea Res. Pt. II, 50, 619–633, 2003a.
Brzezinski, M. A., Jones, J. L., Bidle, K. D, and Azam, F.: The bal-ance between silica production and silica dissolution in the sea:Insights from Monteray Bay, California, applied to the globaldata set, Limnol. Oceanogr., 48(5), 1846–1854, 2003b.
Cardinal, D., Alleman, L. Y., de Jong, J., Ziegler, K., and Andre,L.: Isotopic composition of silicon measured by multicollectorplasma source mass spectrometry in dry plasma mode, J. Anal.Atom. Spectrom., 18, 213–218, 2003.
www.ocean-sci.net/7/533/2011/ Ocean Sci., 7, 533–547, 2011

546 F. Fripiat et al.: Southern Ocean silicic acidδ30Si composition
Cardinal, D., Alleman, L. Y., Dehairs, F., Savoye, N., Trull, T. W.,and Andre, L.: Relevance of silicon isotopes to Si-nutrient uti-lization and Si-source assessment in Antarctic waters, GlobalBiogeochem. Cy., 19, GB2007,doi:10.1029/2004GB002364,2005.
Cardinal, D., Savoye, N., Trull, T. W., Dehairs, F., Kopczynska, E.E., Fripiat, F., Tison, J.-L., and Andre, L.: Silicon isotopes inspring Southern Ocean diatoms: large zonal changes despite ho-mogeneity among size fractions, Mar. Chem., 106, 46–62, 2007.
Cavagna, A.-J., Fripiat, F., Dehairs, F., Wolf-Gladrow, D., Cisewski,B., Savoye, N., Andre, L., and Cardinal, D.: Silicon uptakeand supply during a Southern Ocean iron fertilization experiment(EIFEX) tracked by Si isotopes, Limnol. Oceanogr., 56(1), 147–160, 2011.
Conkright, M. E., Locarnini, R. A., Garcia, H. E., O’Brien, T. D.,Boyer, T. P., Stephens, C., and Antonov, J. I.: World Ocean Atlas2001; Ojective Anlyses, Data Statistics, and Figures, CD-ROMDocumentation, Natl. Oceanogr. Data Cent., Silver Spring, Md,2002.
De La Rocha, C. L., Brzezinski, M. A., and DeNiro, M. J.: Pu-rification recovery and laser-driven fluorination of silicon fromdissolved and particulate silica for the measurement of naturalstable isotope abundances, Anal. Chem., 68, 3746–3750, 1996.
De La Rocha, C. L., Brzezinski, M. A., and DeNiro, M. J.: Fraction-ation of silicon isotopes by marine diatoms during biogenic sil-ica formation, Geochim. Cosmochim. Ac., 61(23), 5051–5056,1997.
De La Rocha, C. L., Brzezinski, M. A., and DeNiro, M. J.: Silicon-isotope composition of diatoms as an indicator of past oceanicchange, Nature, 395, 680–683, 1998.
De La Rocha, C. L., Brzezinski, M. A., and DeNiro, M. J.: A firstlook at the distribution of the stable isotopes of silicon in naturalwaters, Geochim. Cosmochim. Ac., 64(14), 2467–2477, 2000.
Demarest, M. S., Brzezinski, M. A., and Beucher, C.P.: Fractionation of silicon isotopes during biogenic sil-ica dissolution, Geochim. Cosmochim. Ac., 73, 5572–5583,doi:10.1016/j.gca.2009.06.019, 2009.
Dencausse, G., Arhan, M., and Speich, S.: Is there a continu-ous Subtropical Front south of Africa?, J. Geophys. Res. 116,C02027,doi:10.1029/2010JC006587, 2011.
Dugdale, R. C., Wilkerson, F. P., and Minas, H. J: The role of asilicate pump in driving new production, Deep-Sea Res. Pt. I,42(5), 697–719, 1995.
England, M. H., Godfrey, J. S., Hirst, A. C., and Tomczak, M.: Themechanism for Antarctic Intermediate Water renewal in a worldOcean Model, J. Phys. Oceanogr., 23, 1553–1560, 1993.
Franck, V. M., Bruland, K. W., Hutchins, D. A., and Brzezinski,M. A.: Iron and zinc effects on silicic acid and nitrate uptakekinetics in three high-nutrient, low-chlorophyll (HNLC) regions,Mar. Ecol.-Prog. Ser., 252, 15–33, 2003.
Fripiat, F.: Isotopic approaches of the silicon cycle: The southernOcean case study, Ph.D. thesis, Universite Libre de Bruxelles,available at:http://theses.ulb.ac.be/ETD-db/collection/available/ULBetd-12142009-190405/, 2010.
Fripiat, F., Cavagna, A.-J., Savoye, N., Dehairs, F., Andre, L., andCardinal, D.: Isotopic constraints on the Si-biogeochemical cy-cle of the Antarctic Zone in the Kerguelen area (KEOPS), Mar.Chem., 123, 11–22, 2011a.
Fripiat, F., Leblanc, K., Elskens, M., Cavagna, A.-J., Armand, L.,
Andre, L., Dehairs, F., and Cardinal, D.: Summer efficient sili-con loop across the Polar Front and SubAntarctic Zones despitecontrasted diatom Si-affinity, Mar. Ecol.-Prog. Ser., 435, 47–61,, 2011b.
Fripiat, F., Cavagna, A.-J., Dehairs, F., Andre, L., and Cardinal, D.:Processes controlling Si-isotopic composition in the SouthernOcean for an application in paleoceanography, Biogeosciences,in preparation, 2011c.
Grasshof, K., Erhardt, M., and Kremling, K.: Methods of seawateranalysis, 2nd edn., Verlag Chemie, Weinheim, 1983.
Heinze, C., Hupe, A., Maier-Reimer, E., Dittert, N., and Rague-neau, O.: Sensitivity of the marine biospheric Si-cycle forbiogeochemical parameter variations, Global Biogeochem. Cy.,17(3), 1086,doi:10.1029/2002GB001943, 2003.
Hoppema, M., Fahrbach, E., and De Baar, H. J. W.: Surface layerbalance of the southern Antarctic Circumpolar Current (primemeridian) used to derive carbon and silicate consumptions andannual air-sea exchange for CO2 and oxygen, J. Geophys. Res.,105(C5), 11359–11371, doi:2000JC000257, 2000.
Jin, X., Gruber, N., Dunne, J. P., Sarmiento, J. L., and Am-strong, R. A.: Diagnosing the contribution of phytoplanktonfunctional groups to the production and export of particulateorganic carbon, CaCO3, and opal from global nutrient and al-kalinity distributions, Global Biogeochem. Cy., 20, GB2015,doi:10.1029/2005GB002532, 2006.
Karl, D. M. and Tien, G.: MAGIC: a sensitive and precise methodfor measuring dissolved phosphorus in aquatic environments,Limnol. Oceanogr., 37(1), 105–116, 1992.
Kroopnick, P. M.: The distribution of13C of TCO2 in the worldoceans, Deep-Sea Res., 32, 57–84, 1985.
Molinelli, E. T.: The Antarctic influence on Antarctic IntermediateWater, J. Mar. Res. 39, 267–293, 1981.
Moore, J. K. and Abbott, M. R.: Phytoplankton chlorophyll distri-butions and primary production in the Southern Ocean, J. Geo-phys. Res., 105(12), 28709–28722, 2000.
Morrow, R. A., Coleman, R., Church, J. A., and Chelton, D. B.: Sur-face eddy momentum flux and velocity variances in the SouthernOcean from geosat altimetry, J. Phys. Oceanogr., 24, 2050–2071,2004.
Nelson, D. M., Treguer, P., Brzezinski, M. A., Leynaert, A., andQueguiner, B.: Production and dissolution of biogenic silica inthe ocean: revised global estimates comparison with regionaldata and relationship to biogenic sedimentation, Global Bio-geochem. Cy., 9(3), 359–372, 1995.
Orsi, A. H., Johnson, G. C., and Bullister, J. L.: Circulation, mixing,and production of Antarctic Bottom Water, Prog. Oceanogr. 43,55–109, 1999.
Park, Y.-H., Charriaud, E., and Fieux, M.: Thermohaline structureof the Antarctic Surface Water/Winter Water in the Indian sectorof the Southern Ocean, J. Marine Syst., 17, 5–23, 1998.
Pollard, R. T., Lucas, M. I., and Read, J. F.: Physical controls onbiogeochemical zonation in the Southern Ocean, Deep-Sea Res.,49, 3289–3305, 2002.
Pollard, R. T., Treguer, P., and Read, J.: Quantifying nutrientsupply to the Southern Ocean, J. Geophys. Res., 111, C05011,doi:10.1029/2005JC003076, 2006.
Pondaven, P., Ragueneau, O., Treguer, P., Hauvespre, A., Dezileau,L., and Reyss, J. L.: Resolving the “opal paradoxe” in the South-ern Ocean, Nature, 466, 47–55, 2000a.
Ocean Sci., 7, 533–547, 2011 www.ocean-sci.net/7/533/2011/

F. Fripiat et al.: Southern Ocean silicic acidδ30Si composition 547
Pondaven, P., Ruiz-Pino, D., Fravalo, C., Treguer, P., and Jean-del, C.: Interannual variability of Si and N cycles at the time-series station KERFIX between 1990 and 1995 – a 1-D mod-elling study, Deep-Sea Res. Pt. I, 47, 223–257, 2000b.
Pondaven, P., Gallinari, M., Chollet, S., Bucciarelli, E., Sarthou, G.,Schultes, S., and Jean, F.: Grazing-induced changes in cell wallsilicification in a marine diatoms, Protist, 158, 21–28, 2007.
Reid, J. L.: On the total geostrophic circulation of the Indian Ocean:flow patterns, tracers, and transports, Prog. Oceanogr., 56, 137–186, 2003.
Reynolds, B. C., Frank, M., and Halliday, A. N.: Silicon iso-tope fractionation during nutrient utilization in the North Pacific,Earth Planet. Sc. Lett., 244, 431–443, 2006.
Reynolds, B. C., Aggarwal, J., Andre, L., Baxter, D., Beucher, C.,Brzezinski, M. A., Engstrom, E., Georg, R. B., Land, M., Leng,M. J., Opfergelt, S., Rodushkin, I., Sloane, H. J., van den Boorn,H. J. M., Vroon, P. Z., and Cardinal, D.: An inter-laboratory com-parison of Si isotope reference materials, J. Anal. Atom. Spec-trom., 22, 561–568,doi:10.1039/b616755a, 2007.
Reynolds, B. C.: Modeling the modern marineδ30Sidistribution, Global Biogeochem. Cy., 23, GB2015,doi:10.1029/2008GB003266, 2009.
Sarmiento, J. L., Gruber, N., Brzezinski, M. A., and Dunne, J. P.:High-latitude controls of thermocline nutrients and low latitudebiological productivity, Nature, 427, 56–60, 2004.
Sarmiento, J. L., Simeon, J., Gnanadesikan, A., Gruber, N., Key,R. M., and Schlitzer, R.: Deep ocean biogeochemistry of sili-cic acid and nitrate, Global Biogeochem. Cy., 21, GB1S90,doi:10.1029/2006GB002720, 2007.
Schultes, S., Lambert, C., Pondaven, P., Corvaisier, R., Jansen, S.,and Ragueneau, O.: Recycling and Uptake of Si(OH)4 when Pro-tozoan Grazers Feed on Diatoms, Protist, 161, 288–303, 2010.
Sigman, D. M., Altabet, M. A., McCorkle, D. C., Francois, R., andFischer, G.: Theδ15N of nitrate in the Southern Ocean: Con-sumption of nitrate in surface waters, Global Biogeochem. Cy.,13, 1149–1166, 1999.
Sigman, D. M., Hain, M. P., and Haug, G. H.: The polar ocean andglacial cycles in atmospheric CO2 concentration, Nature, 466,47–55,doi:10.1038/nature09149, 2010.
Sloyan, B. M. and Rintoul, S. R.: Circulation, renewal, and mod-ification of Antarctic mode and intermediate water, J. Phys.Oceanogr., 31, 1005–1030, 2001.
Smetacek, V., Assmy, P., and Henjes, J.: The role of grazing instructuring Southern Ocean pelagic ecosystems and biogeochem-ical cycles, Antarct. Sci., 16, 541–558, 2004.
Sokolov, S. and Rintoul, S. R.: On the relationship between frontsof the Antarctic Circumpolar Current and surface chlorophyllconcentration in the Southern Ocean, J. Geophys. Res., 112,C07030,doi:10.1029/2006JC004072, 2007.
Sokolov, S. and Rintoul, S. R.: Circumpolar structureand distribution of the Antarctic Circumpolar fronts: 1.Mean circumpolar path, J. Geophys. Res., 114, C11018,doi:10.1029/2008JC005108, 2009.
Speich, S., Arhan, M., Gladyshev, S., Rupolo, V., and Fine, R.:Structure and dynamics along the BONUS-GoodHope transect,Ocean Sci., in preparation, 2011.
Takeda, S.: Influence of iron availability on nutrient consumptionratio of diatoms in oceanic waters, Nature, 393, 774–777, 1998.
Toggweiler, J. R., Russell, J. L., and Carson, S. R.: Midlat-itudes westerlies, atmospheric CO2, and climate changeduring the ice ages, Paleoceanography, 21, PA2005,doi:10.1029/2005PA001154, 2006.
Tomczak, M. and Godfrey, J. S.: Regional Oceanography: An In-troduction, Pergamon, New York, 2001.
Usbeck, R.: Modeling of marine biogeochemical cycles with an em-phasis on vertical particle fluxes, Ph.D. thesis, Univ. of Bremen,Bremen, Germany, 105 pp., 1999.
Varela, D. E., Pride, C. J., and Brzezinski, M. A.: Bio-logical fractionation of silicon isotopes in Southern Oceansurface waters, Global Biogeochem. Cy., 18, GB1047,doi:10.1029/2003GB002140, 2004.
Watson, A. J. and Naveira Garabato, A. C.: The role of SouthernOcean mixing and upwelling in glacial-interglacial atmosphericCO2 change, Tellus, 58B, 73–87, 2006.
Wischmeyer, A. G., De La Rocha, C. L., Maier-Reimer, E., andWolf-Gladrow, D. A.: Control mechanisms for the oceanic distri-bution of silicon isotopes, Global Biogeochem. Cy., 17(3), 1083,doi:10.1029/2002GB002022, 2003.
Young, E. D., Galy, H., and Nagahara, H.: Kinetic and equilibriummass-dependent isotope fractionation laws in nature and theirgeochemical and cosmochemical significance, Geochim. Cos-mochim. Ac., 66(6), 1095–1104, 2002.
www.ocean-sci.net/7/533/2011/ Ocean Sci., 7, 533–547, 2011
Related Documents


