www.afm-journal.de FULL PAPER © 2012 WILEY-VCH Verlag GmbH & Co. KGaA, Weinheim 1291 www.MaterialsViews.com wileyonlinelibrary.com Adv. Funct. Mater. 2012, 22, 1291–1302 Stefan Haid, Magdalena Marszalek, Amaresh Mishra,* Mateusz Wielopolski, Joël Teuscher, Jacques-E. Moser, Robin Humphry-Baker, Shaik M. Zakeeruddin,* Michael Grätzel,* and Peter Bäuerle* DSSCs based on ruthenium complexes have broad absorption spectra extending into the near-IR region and produce solar- to-electrical energy conversion efficiencies of up to 11.7% under AM1.5 irradiation. [3–5] The photoconversion efficiencies (PCE) of metal-free organic dyes are somewhat lower (≤10%) in comparison to the ruthenium- based sensitizers, but they include advan- tageous features, such as lower material costs, better tunable absorptions, and band- gaps by variation of the molecular structure, which typically consists of a π-conjugated donor-acceptor (D-A) system. [6] In this respect, various D-π-A-substituted organic dyes have been prepared and used as sen- sitizers in DSSCs. [7–9] One of the drawbacks of organic dyes is their relatively narrow absorption spec- trum, whose maxima usually remain in the shorter wavelength region. The optimal organic sensitizer for solar cell applications should possess a broadly extended absorp- tion spectrum ranging to the near-IR regime in order to attain good overlap with the solar emission spectrum and to produce large photocurrent responses. In addition, suitable energy levels of the highest occupied molecular orbital (HOMO) and lowest unoccupied molecular orbital (LUMO) of the dye are required to match the iodide/triiodide redox potential and the conduction band edge level of the TiO 2 semiconductor electrode in order to assure efficient electron injection into the TiO 2 conduction band. For the latter process, the electron density distribution in the dye’s HOMO and LUMO is also of crucial importance. One way of extending the absorption range to enhance the photocur- rent response is to reduce the HOMO–LUMO energy gap of the sensitizer. For this purpose, various low bandgap sensitizers for DSSCs have been prepared by implementing, e.g., the electron- deficient benzothiadiazole (BTDA) unit into the bridging frame- work of D-π-A molecules. [10–16] In search of new metal-free sensitizers for DSSCs, we present new D-A sensitizers 1 and 2 that are built up by a triarylamine- bithiophene donor (D) and a BTDA-substituted cyanoacrylic Significant Improvement of Dye-Sensitized Solar Cell Performance by Small Structural Modification in π-Conjugated Donor–Acceptor Dyes Two donor- π-acceptor (D- π-A) dyes are synthesized for application in dye- sensitized solar cells (DSSC). These D- π-A sensitizers use triphenylamine as donor, oligothiophene as both donor and π-bridge, and benzothiadiazole (BTDA)/cyanoacrylic acid as acceptor that can be anchored to the TiO 2 sur- face. Tuning of the optical and electrochemical properties is observed by the insertion of a phenyl ring between the BTDA and cyanoacrylic acid acceptor units. Density functional theory (DFT) calculations of these sensitizers provide further insight into the molecular geometry and the impact of the additional phenyl group on the photophysical and photovoltaic performance. These dyes are investigated as sensitizers in liquid-electrolyte-based dye-sensitized solar cells. The insertion of an additional phenyl ring shows significant influence on the solar cells’ performance leading to an over 6.5 times higher efficiency ( η = 8.21%) in DSSCs compared to the sensitizer without phenyl unit ( η = 1.24%). Photophysical investigations reveal that the insertion of the phenyl ring blocks the back electron transfer of the charge separated state, thus slowing down recombination processes by over 5 times, while maintaining efficient electron injection from the excited dye into the TiO 2 -photoanode. DOI: 10.1002/adfm.201102519 S. Haid, Dr. A. Mishra, Prof. P. Bäuerle Institute of Organic Chemistry II and Advanced Materials University of Ulm Albert-Einstein-Allee 11, 89081 Ulm, Germany E-mail: [email protected]; [email protected] M. Marszalek, Dr. M. Wielopolski, Dr. J. Teuscher, Prof. J.-E. Moser, Dr. R. Humphry-Baker, Dr. S. M. Zakeeruddin, Prof. M. Grätzel Laboratory of Photonics and Interfaces Institute of Chemical Sciences and Engineering Ecole Polytechnique Fédérale de Lausanne (EPFL) Station 6, CH-1015 Lausanne, Switzerland Email: shaik.zakeer@epfl.ch; michael.graetzel@epfl.ch 1. Introduction Dye-sensitized solar cells (DSSCs) are one of the most promising environmentally friendly photovoltaic devices because of their low material costs, flexiblity, and easy manufacturing processes. [1,2]

Welcome message from author
This document is posted to help you gain knowledge. Please leave a comment to let me know what you think about it! Share it to your friends and learn new things together.
Transcript
www.afm-journal.de
FULL P
APER
www.MaterialsViews.com
Stefan Haid, Magdalena Marszalek, Amaresh Mishra,* Mateusz Wielopolski, Joël Teuscher, Jacques-E. Moser, Robin Humphry-Baker, Shaik M. Zakeeruddin,* Michael Grätzel,* and Peter Bäuerle*
Significant Improvement of Dye-Sensitized Solar Cell Performance by Small Structural Modification in π-Conjugated Donor–Acceptor Dyes
Two donor-π-acceptor (D-π-A) dyes are synthesized for application in dye-sensitized solar cells (DSSC). These D-π-A sensitizers use triphenylamine as donor, oligothiophene as both donor and π-bridge, and benzothiadiazole (BTDA)/cyanoacrylic acid as acceptor that can be anchored to the TiO2 sur-face. Tuning of the optical and electrochemical properties is observed by the insertion of a phenyl ring between the BTDA and cyanoacrylic acid acceptor units. Density functional theory (DFT) calculations of these sensitizers provide further insight into the molecular geometry and the impact of the additional phenyl group on the photophysical and photovoltaic performance. These dyes are investigated as sensitizers in liquid-electrolyte-based dye-sensitized solar cells. The insertion of an additional phenyl ring shows significant influence on the solar cells’ performance leading to an over 6.5 times higher efficiency (η = 8.21%) in DSSCs compared to the sensitizer without phenyl unit (η = 1.24%). Photophysical investigations reveal that the insertion of the phenyl ring blocks the back electron transfer of the charge separated state, thus slowing down recombination processes by over 5 times, while maintaining efficient electron injection from the excited dye into the TiO2-photoanode.
1. Introduction
Dye-sensitized solar cells (DSSCs) are one of the most promising environmentally friendly photovoltaic devices because of their low material costs, flexiblity, and easy manufacturing processes.[1,2]
© 2012 WILEY-VCH Verlag GmbH & Co. KGaA, WeinheimAdv. Funct. Mater. 2012, 22, 1291–1302
DOI: 10.1002/adfm.201102519
S. Haid, Dr. A. Mishra, Prof. P. BäuerleInstitute of Organic Chemistry II and Advanced Materials University of Ulm Albert-Einstein-Allee 11, 89081 Ulm, Germany E-mail: [email protected]; [email protected]. Marszalek, Dr. M. Wielopolski, Dr. J. Teuscher, Prof. J.-E. Moser, Dr. R. Humphry-Baker, Dr. S. M. Zakeeruddin, Prof. M. GrätzelLaboratory of Photonics and Interfaces Institute of Chemical Sciences and Engineering Ecole Polytechnique Fédérale de Lausanne (EPFL) Station 6, CH-1015 Lausanne, Switzerland Email: [email protected]; [email protected]
DSSCs based on ruthenium complexes have broad absorption spectra extending into the near-IR region and produce solar-to-electrical energy conversion efficiencies of up to 11.7% under AM1.5 irradiation.[3–5] The photoconversion efficiencies (PCE) of metal-free organic dyes are somewhat lower (≤10%) in comparison to the ruthenium-based sensitizers, but they include advan-tageous features, such as lower material costs, better tunable absorptions, and band-gaps by variation of the molecular structure, which typically consists of a π-conjugated donor-acceptor (D-A) system.[6] In this respect, various D-π-A-substituted organic dyes have been prepared and used as sen-sitizers in DSSCs.[7–9]
One of the drawbacks of organic dyes is their relatively narrow absorption spec-trum, whose maxima usually remain in the shorter wavelength region. The optimal organic sensitizer for solar cell applications should possess a broadly extended absorp-
tion spectrum ranging to the near-IR regime in order to attain good overlap with the solar emission spectrum and to produce large photocurrent responses. In addition, suitable energy levels of the highest occupied molecular orbital (HOMO) and lowest unoccupied molecular orbital (LUMO) of the dye are required to match the iodide/triiodide redox potential and the conduction band edge level of the TiO2 semiconductor electrode in order to assure efficient electron injection into the TiO2 conduction band. For the latter process, the electron density distribution in the dye’s HOMO and LUMO is also of crucial importance. One way of extending the absorption range to enhance the photocur-rent response is to reduce the HOMO–LUMO energy gap of the sensitizer. For this purpose, various low bandgap sensitizers for DSSCs have been prepared by implementing, e.g., the electron-deficient benzothiadiazole (BTDA) unit into the bridging frame-work of D-π-A molecules.[10–16]
In search of new metal-free sensitizers for DSSCs, we present new D-A sensitizers 1 and 2 that are built up by a triarylamine-bithiophene donor (D) and a BTDA-substituted cyanoacrylic
1291wileyonlinelibrary.com

FULL
PAPER
1292
www.afm-journal.dewww.MaterialsViews.com
acid as acceptor and anchoring group (A). Dye 1 contains the BTDA unit directly adjacent to the anchoring group, whereas dye 2 contains “only” an additional phenyl ring between both acceptor units. We investigate the influence of the structural modification of the sensitizer on optical, redox, and solar cell performance. This subtle structural change in the sensitizer induced a significant influence on the DSSCs performance.
2. Results and Discussion
2.1. Synthesis
D-A dyes 1 and 2 were synthesized as shown in Scheme 1. 4-Bromo-N,N-bis[4-(hexyloxy)phenyl]aniline 3 was coupled
wileyonlinelibrary.com © 2012 WILEY-VCH Verlag G
Scheme 1. Synthesis of dyes 1 and 2. a) Pd2(dba)3·CHCl3, HPtBu3 BF4, 2 m (ii) Bu3SnCl. c) K2CO3, 1,4-dioxane/water, reflux, 1 h. d) MnO2, CHCl3, re4.5 h. g) cyanoacetic acid, NH4OAc, CH2Cl2/CH3CN, reflux.
to bithiophene pinacol boronic ester 4 in a Suzuki–Miyaura cross-coupling reaction to obtain 5 in an excellent yield of 96%. Lithiation of 5 with n-butyl lithium (n-BuLi) and subse-quent quenching with tributyltin chloride (Bu3SnCl) afforded derivative 6 in quantitative yield. Hydrolysis of 4-bromo-7-(bromomethyl)benzo[c][1,2,5]-thiadiazole 7 using potassium carbonate in a dioxane/water mixture provided 4-bromo-7-(hydroxymethyl)benzo[c][1,2,5]thiadiazole 8 in 64% yield. Fur-ther oxidation of alcohol 8 with manganese dioxide (MnO2) in chloroform gave 7-bromobenzo[c][1,2,5]thiadiazole-4-carbaldehyde 9 in 89% yield. Stille-type coupling of 6 and bromo-derivative 9 or 4-(7-bromobenzo[c][1,2,5]thiadiazol-4-yl)benzaldehyde 10[17] gave intermediates 11 and 12 in yields of 86% and 92%, respectively. Final Knoevenagel condensation of 11 and 12 with cyanoacetic acid in the presence of ammonium
mbH & Co. KGaA, Weinheim Adv. Funct. Mater. 2012, 22, 1291–1302
aq. K3PO4 (4 eq.), THF, room temperature (r.t.). b) (i) n -BuLi, THF, –78 °C flux, 3 h. e) Pd(PPh3)2Cl2, THF, 70 °C, 15 h. f) Pd(PPh3)2Cl2, THF, 75 °C,

FULL P
APER
www.afm-journal.dewww.MaterialsViews.com
Figure 1. a) UV-vis and normalized emission spectra of dyes 1 and 2 in dichloromethane ([c] = 10−5 mol L−1). Emission spectra were meas-ured by excitation at 500 nm (1) and 460 nm (2) and were normalized to their respective CT bands. b) UV-vis spectra of dyes 1 and 2 on TiO2 film (5 μm).
acetate as catalyst gave dye 1 in 86% yield and dye 2 in 38% yield.
2.2. Spectroscopic Studies
The UV-vis absorption spectra of dyes 1 and 2 measured in dichloromethane exhibited two absorption bands over a range of
© 2012 WILEY-VCH Verlag GmAdv. Funct. Mater. 2012, 22, 1291–1302
Table 1. Optical and electrochemical data for dyes 1 and 2.
Compound λmax,abs [nm]
εmax [L mol−1 cm−1]
λmax,em [nm]
E0ox1
[V]E0
[V
1 395 26 400 681 0.20 0.
570 18 900
2 392 38 000 665 0.11 0.
515 29 400
a)set Fc+/Fc EHOMO = −5.1 eV; b)Calculated from the difference between the values dichloromethane.
350 to 800 nm (Figure 1a). All data are summarized in Table 1. The bands at 395 nm (dye 1) and 392 nm (dye 2) correspond to the π–π* transition of the conjugated system. The longest wave-length absorption of dye 2 (λmax = 515 nm) is assigned to a charge transfer (CT) transition and is significantly blue-shifted compared to the CT-band of dye 1 (λmax = 570 nm). Furthermore, the inten-sity and molar extinction coefficient for the CT transition of dye 2 (ε = 29,400 L mol−1 cm−1) is increased by a factor of 1.6 com-pared to dye 1 (ε = 18,900 L mol−1 cm−1). The emission maxima of dyes 1 and 2 can be found at 681 and 665 nm, respectively. Dye 2 showed a much larger Stokes shift (4379 cm−1) in comparison to 1 (2860 cm−1), which is an indication of significant structural reorganization of 2 upon photoexcitation. The UV-vis spectra of dyes 1 and 2 adsorbed on transparent TiO2 films (Figure 1b) showed a slight blue-shift of the CT band for dye 2 (λmax = 506 nm) compared to the solution spectra, while the shift is more pronounced for dye 1 (λmax = 540 nm). Hence, the steady-state results clearly hint to a reduction of the overall π-conjugation in 2 due to a possible torsion of the additional phenyl ring.
2.3. Electrochemical Characterization
Cyclic voltammograms (CV) measured in dichloromethane containing 0.1 m tetrabutylammonium hexafluorophosphate showed two reversible oxidation waves and one quasireversible reduction wave for both sensitizers (Figure 2). The data are pre-sented in Table 1. The first oxidation potential (E0
ox1) for 1 and 2 was found at 0.20 and 0.11 V, respectively, (vs. Fc+/Fc) and are assigned to the oxidation of the triphenylamine donor moiety. The easier oxidation of 2 when compared to 1 is a further sup-port for the weaker donor–acceptor interaction in dye 2 due to probable torsion of the phenyl ring. The second oxidation potential (E0
ox2) was observed at 0.60 V and 0.55 V for 1 and 2, respectively, and is assigned to the oxidation of the conjugated backbone. Due to the stronger acceptor character the reduction potential for dye 1 is more positively shifted compared to dye 2 (ΔEred = 0.19 V). The HOMO and LUMO energies determined from the onset of the first oxidation and reduction potential were –5.22 and –3.62 eV vs. vacuum for dye 1 and –5.14 and –3.47 eV for dye 2. Dyes 1 and 2 showed a bandgap (Eg
CV) of 1.60 and 1.67 eV, respectively, which are in good accordance to the bandgaps determined from the optical studies (Eg
opt). The calculated LUMO energy levels lie above the conduction band edge of TiO2 (≈ –4.0 eV vs. vacuum), which should ensure suf-ficient driving force for electron injection from the dye into the conduction band of the semiconductor.
1293wileyonlinelibrary.combH & Co. KGaA, Weinheim
ox2 ]
E0red
[V]HOMOa)
[eV]LUMOa)
[eV]Eg
CVb) [eV]
Egoptc)
[eV]
60 −1.56 −5.22 −3.62 1.60 1.67
55 −1.75 −5.14 −3.47 1.67 1.98
of Eonset, red1 and Eonset, ox1; c)Estimated using the onset of the UV-vis spectra in

FULL
PAPER
12
www.afm-journal.dewww.MaterialsViews.com
Figure 2. Cyclic voltammograms of 1 and 2 in DCM/TBAHFP (0.1 m), [c] = 5 × 10⁻⁴mol L−1, 295 K, scan rate = 100 mV s−1, vs. Fc+/Fc.
2.4. Quantum Chemical Calculations
In order to gain insight into the structural properties, the elec-tron density distribution of the frontier orbitals of both dyes was analyzed by density functional theory (DFT) using the B3LYP hybrid functional with 6–31G* basis set (see Experi-mental Section for details). First, the ground state geometries of 1 and 2 were optimized using restricted Hartree–Fock condi-tions. The calculations showed that the CT absorption bands of these dyes are due to the HOMO → LUMO transition. The cal-culated HOMO and LUMO energies were –4.96 and –3.36 eV, respectively, for 1 and –4.81 and –3.01 eV for 2. In the neutral form, both molecules do not exhibit significant differences in the electron density distribution of the orbitals (Figure 3).
In dye 1, the HOMO and LUMO orbitals are slightly more delocalized, giving rise to a better conjugation between the donor and acceptor moiety, which corroborates well with the outcome of the UV-vis studies. On the other hand, in dye 2 the additional phenyl ring induces an out-of-plane torsion of 18° with respect to the BTDA moiety. The electron den-
94 wileyonlinelibrary.com © 2012 WILEY-VCH Verlag G
Figure 3. HOMO and LUMO electron density distributions for frontier orb2 calculated using DFT methods (B3LYP/6-31G*).
sity distribution of the HOMO of both molecules is mainly located at the donor part (oligothiophene and triphenylamine), whereas the electron density of the LUMO is primarily located at the BTDA and cyanoacrylic acid acceptor units and to a small extent at the neighboring thiophene ring. Hence, both orbitals provide sufficient overlap between donor and acceptor to guarantee a fast charge transfer transition. Thus, excitation from the HOMO to the LUMO should lead to efficient photoin-duced electron transfer from the electron donating triarylamine moiety to the TiO2 film via the terminal cyanoacrylic acid. This nicely follows the trends of the almost identical charge sepa-ration rates for 1 and 2 as stated in the photophysical section (see below). Significant differences arise when considering the cationic form of 1 and 2, as calculated using the unrestricted Hartree–Fock method. The optimized cationic structure of 1 becomes completely planar with dihedral angles of ≈1° each (Figure S1, Supporting Information). In contrast, the BTDA unit and the adjacent phenyl rings in the radical cation of dye 2 are twisted out-of-plane by ≈48°. It should be noted that, in the cationic form, the phenyl ring is twisted by additional 30° com-pared to the neutral conformation (dihedral angle = 18°).
This deviation from planarity, as suggested by the large Stokes-shift of 2 as compared to 1, has also an impact on the orbital energies. In fact, the energies of the singly-occupied molecular orbital (SOMO) are lowered to a higher extent in 2 than in 1. The SOMO of 2 (–6.80 eV) is 0.2 eV lower in energy than the SOMO of 1 (–6.61 eV). This leads to the conclusion that releasing an electron leads to a more stable radical cation of 2 than that of 1. This finding corroborates well with the dif-ference in solar cell performance of devices with 1 vs. 2 as dis-cussed in the photovoltaic section. As shown below, the charge recombination rates in 2 are remarkably slower due to a better stabilization of its cationic form. Furthermore, the insertion of the phenyl ring in 2 causes out-of-plane torsion with the adja-cent units upon oxidation leading to an interruption of the π-conjugation between donor and anchoring group. On the contrary, the cationic form of 1 remains entirely planar and the π-conjugation is preserved as shown in Figure S1. This fact is clearly in favor of an intramolecular back-electron transfer process as the deactivation pathway of the charge separated state. In other words, the back-electron-transfer within the donor-acceptor moieties of 1 is energetically preferred over the
mbH & Co. KGaA, Wei
itals of dyes 1 and
charge recombination from TiO2 or a regen-erating electrolyte.
2.5. Application in Dye-Sensitized Solar Cells
The current–voltage (J–V) characteristics of solar cells sensitized with dyes 1 and 2 on 5 μm TiO2 films with the volatile electrolyte E1 measured under standard AM 1.5G con-ditions (100 mW cm−2) are shown in Figure S2 (Supporting Information). The electrolyte compositions are presented in Table 2. Dye 2 sensitized cells provided an overall power conversion efficiency (η) of 5.59% with a high short circuit current density (JSC) of 16.26 mA cm−2, while dye 1 sensitized cells
nheim Adv. Funct. Mater. 2012, 22, 1291–1302
FULL P
APER
www.afm-journal.dewww.MaterialsViews.com
Table 2. Composition of electrolytes used for optimization of the per-formance of the devices with dye 2. The components were dissolved in a solvent mixture of acetonitrile and valeronitrile (85:15, v/v). DMII: 1,3-dimethylimidazolium iodide; GuNCS: guanidinium thiocyanate; TBP: tert -butylpyridine; LiI: lithium iodide.
Code DMII [m] I2 [m] GuNCS [m] TBP [m] LiI [m]
E1 0 0.044 0 0.25 1
E2 1 0.03 0.1 0.5 0
E3 1 0.03 0.1 0.5 0.05
E4 1 0.03 0.1 0.5 0.1
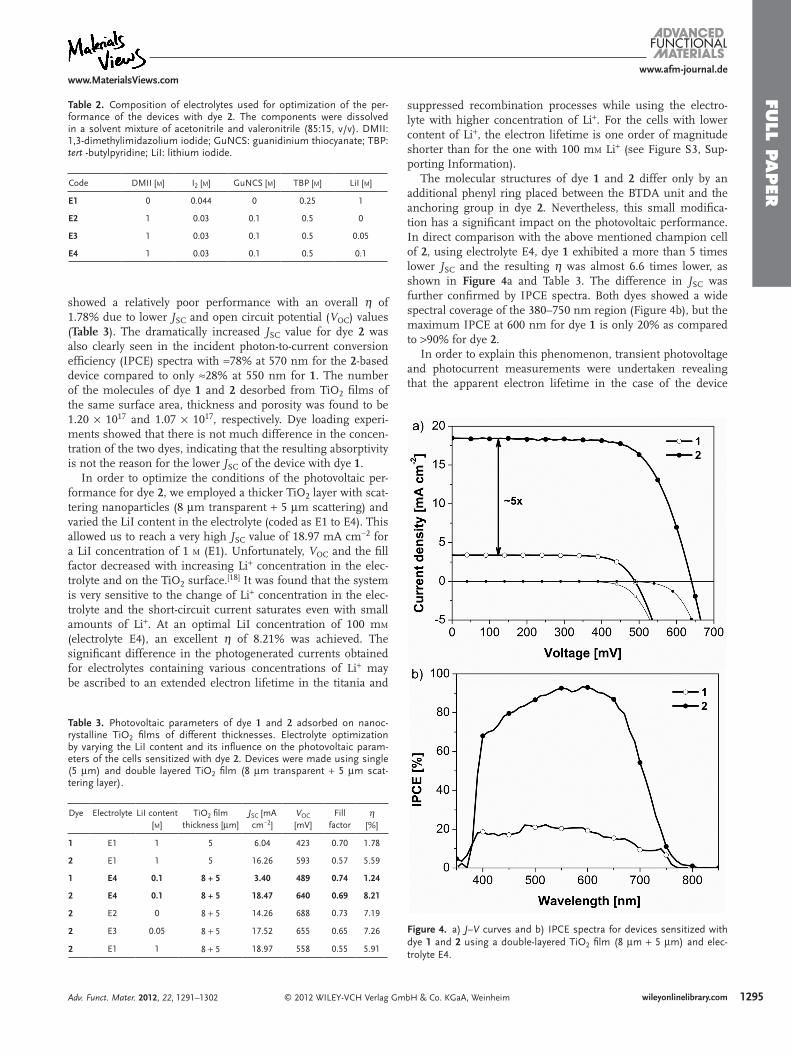
showed a relatively poor performance with an overall η of 1.78% due to lower JSC and open circuit potential (VOC) values (Table 3). The dramatically increased JSC value for dye 2 was also clearly seen in the incident photon-to-current conversion efficiency (IPCE) spectra with ≈78% at 570 nm for the 2-based device compared to only ≈28% at 550 nm for 1. The number of the molecules of dye 1 and 2 desorbed from TiO2 films of the same surface area, thickness and porosity was found to be 1.20 × 10¹⁷ and 1.07 × 10¹⁷, respectively. Dye loading experi-ments showed that there is not much difference in the concen-tration of the two dyes, indicating that the resulting absorptivity is not the reason for the lower JSC of the device with dye 1.
In order to optimize the conditions of the photovoltaic per-formance for dye 2, we employed a thicker TiO2 layer with scat-tering nanoparticles (8 μm transparent + 5 μm scattering) and varied the LiI content in the electrolyte (coded as E1 to E4). This allowed us to reach a very high JSC value of 18.97 mA cm−2 for a LiI concentration of 1 m (E1). Unfortunately, VOC and the fill factor decreased with increasing Li+ concentration in the elec-trolyte and on the TiO2 surface.[18] It was found that the system is very sensitive to the change of Li+ concentration in the elec-trolyte and the short-circuit current saturates even with small amounts of Li+. At an optimal LiI concentration of 100 mm (electrolyte E4), an excellent η of 8.21% was achieved. The significant difference in the photogenerated currents obtained for electrolytes containing various concentrations of Li+ may be ascribed to an extended electron lifetime in the titania and
© 2012 WILEY-VCH Verlag GmAdv. Funct. Mater. 2012, 22, 1291–1302
Table 3. Photovoltaic parameters of dye 1 and 2 adsorbed on nanoc-rystalline TiO2 films of different thicknesses. Electrolyte optimization by varying the LiI content and its influence on the photovoltaic param-eters of the cells sensitized with dye 2. Devices were made using single (5 μm) and double layered TiO2 film (8 μm transparent + 5 μm scat-tering layer).
Dye Electrolyte LiI content [m]
TiO2 film thickness [μm]
JSC [mA cm−2]
VOC [mV]
Fill factor
η [%]
1 E1 1 5 6.04 423 0.70 1.78
2 E1 1 5 16.26 593 0.57 5.59
1 E4 0.1 8 + 5 3.40 489 0.74 1.24
2 E4 0.1 8 + 5 18.47 640 0.69 8.21
2 E2 0 8 + 5 14.26 688 0.73 7.19
2 E3 0.05 8 + 5 17.52 655 0.65 7.26
2 E1 1 8 + 5 18.97 558 0.55 5.91
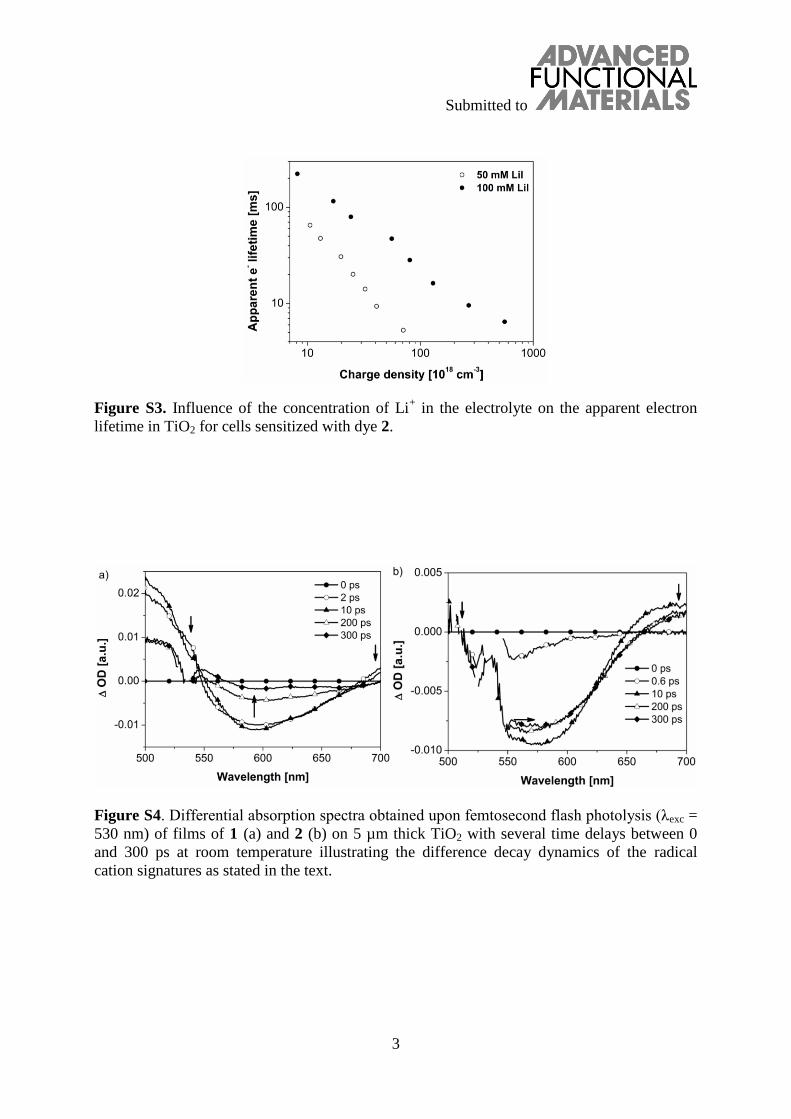
suppressed recombination processes while using the electro-lyte with higher concentration of Li+. For the cells with lower content of Li+, the electron lifetime is one order of magnitude shorter than for the one with 100 mm Li+ (see Figure S3, Sup-porting Information).
The molecular structures of dye 1 and 2 differ only by an additional phenyl ring placed between the BTDA unit and the anchoring group in dye 2. Nevertheless, this small modifica-tion has a significant impact on the photovoltaic performance. In direct comparison with the above mentioned champion cell of 2, using electrolyte E4, dye 1 exhibited a more than 5 times lower JSC and the resulting η was almost 6.6 times lower, as shown in Figure 4a and Table 3. The difference in JSC was further confirmed by IPCE spectra. Both dyes showed a wide spectral coverage of the 380–750 nm region (Figure 4b), but the maximum IPCE at 600 nm for dye 1 is only 20% as compared to >90% for dye 2.
In order to explain this phenomenon, transient photovoltage and photocurrent measurements were undertaken revealing that the apparent electron lifetime in the case of the device
1295wileyonlinelibrary.combH & Co. KGaA, Weinheim
Figure 4. a) J–V curves and b) IPCE spectra for devices sensitized with dye 1 and 2 using a double-layered TiO2 film (8 μm + 5 μm) and elec-trolyte E4.

FULL
PAPER
129
www.afm-journal.dewww.MaterialsViews.com
Figure 5. Apparent electron lifetimes of dye 1 and 2 measured with the transient photovoltage technique.
Figure 7. Transient absorption data following the decay of the oxidized state of dyes 1 and 2 adsorbed on a transparent TiO2 nanocrystalline film in presence and absence of redox couple.
with dye 2 exhibits typical exponential behavior when plotted against charge density in the film. It seems that for dye 1 an asymptotic-like saturation limit exists for the amount of charges injected into TiO2. Above this limit, the recombination proc-esses are vastly enhanced, thus reducing the lifetime of injected electrons (Figure 5).
The time-correlated single photon counting (TCSPC) tech-nique was used to study the excited state lifetimes of dyes 1 and 2 in solution and adsorbed on the TiO2 surface (Figure 6). Life-times of the species in solution are in the nanosecond range: 5.6 ns for dye 1 and 7 ns for dye 2. In the case of molecules adsorbed on the TiO2 layer, the lifetime decreased significantly as a result of the injection of the electron into the conduc-tion band of the semiconductor. Dye 1 adsorbed on the TiO2
6 wileyonlinelibrary.com © 2012 WILEY-VCH Verlag G
Figure 6. TCSPC fluorescence histograms of dyes 1 and 2 dissolved in acetonitrile and adsorbed on the surface of a TiO2 film. Faster exponential decays in case of dyes adsorbed on TiO2 are an indication of efficient elec-tron injection into the semiconductor. There is no significant difference between the injection yields of the two dyes.
substrate is characterized by an excited state lifetime, τTiO2 of 296 ps, whereas dye 2 is slightly longer lived (τTiO2 = 373 ps).
The estimated electron injection efficiencies for both dyes were found to be fairly similar (dye 1: 94.8%; dye 2: 94.7%) (Equation 1). The lack of a significant difference between elec-tron injection efficiencies, which cannot explain the difference in device performance of 1 and 2, may turn the focus on the charge collection efficiency or enhanced recombination proc-esses as main reasons for the dramatically different perform-ance of the two dyes in DSSCs.
ηinj = 1−τTiO2
τsolution (1)
Nanosecond laser photolysis experiments focusing on the decay of the oxidized state of the dye performed on TiO2 films covered with dye 1 and 2 in absence and presence of the redox electrolyte have confirmed 5 times faster recombination (half-reaction time τ½ = 12 μs) in the case of dye 1 (Figure 7). Spectra recorded in the presence of redox electrolyte exhibited a fast decay (9 μs) due to the efficient regeneration of the oxidized dye molecules by iodide. Nevertheless, in the absence of the redox couple, the dye radical cations can only be reduced by the dye-injected electrons from TiO2 (recombination). In order to ensure quantitative electron collection at the back contact of the cell, this process is expected to be rather slow and non-competing with the dye regeneration by I−. This requirement is fulfilled in case of dye 2 and allows for the generation of high current densities in the device. In contrast, dye 1 recombines with electrons from TiO2 in the absence of a redox couple at a time-scale comparable to that of the dye regeneration rate. This undesirable behavior may indicate a facilitated electron flow from the TiO2 back to the dye radical cation. Furthermore, this is in agreement with the planar molecular geometry of the radical cation of dye 1 as compared to the twisted structure of dye 2 radical cation as discussed above.
mbH & Co. KGaA, Weinheim Adv. Funct. Mater. 2012, 22, 1291–1302

FULL P
APER
www.afm-journal.dewww.MaterialsViews.com
Figure 9. First-order-fits of the time-absorption profiles obtained from the femtosecond pump-probe studies of 1 and 2 illustrating the dif-ferent charge recombination dynamics of the radical cation signatures at 700 nm (a) and the ground-state bleaching at 580 nm (b).
Figure 8. Differential absorption spectrum obtained upon femtosecond pump-probe spectroscopy (λexc = 530 nm) of a film of 1 on 5 μm thick TiO2 with several time delays between 0 and 0.6 ps at room temperature illustrating the radical cation formation with the ground-state transient bleaching between 555 and 590 nm and the triarylamine cation (TA•+) beyond 680 nm.
Apart from the TCSPC and nanosecond flash photolysis studies, further insight into the excited state deactivation proc-esses was provided by ultrafast transient absorption measure-ments. Dyes 1 and 2 were studied on TiO2 films in the absence of a redox electrolyte. This permits to focus particularly on the interactions between the dyes and TiO2. 530 nm laser excita-tion was used which directs the light energy mainly to the CT absorption band of both dyes. At this wavelength, both dyes exhibited similar extinction coefficients, which allows for a good comparison even at slight variations of film thickness on TiO2. Immediately after laser excitation, the instantaneous formation of the singlet excited states of the dyes was observed. Specifi-cally, the singlet excited states of 1 and 2 are characterized by a maximum at 501 nm and transient bleach between 535 and 598 nm. After only 0.6 ps singlet-excited features of both dyes transform into new bands (Figure 8).
This transduction of singlet-excited state energy is then iden-tified by the shift of the minimum of the transient bleach from 555 to 584 nm and a broadening of the signal. The bleaching is attributed to the ground-state bleaching due to the radical cation formation of the triarylamine (TA•+), which is repre-sented by the appearance of a new absorption beyond 680 nm (Figure 8). For both dyes, these features appear on a time-scale of less than 2 ps. Hence, after a rapid transfer of singlet-excited state energy, the formation of the charge separated state occurs with equal rate constants for both dyes. Averaging first-order fits of the time-absorption profiles leads to singlet-excited state lifetimes of 0.95 ps for 1 and 0.79 ps for 2. This supports com-parable charge-separation dynamics for both dyes and well complies with the fact that the charge-injection efficiencies will be equal when a redox electrolyte is present. The analysis of the decay dynamics revealed the key difference between both dyes (Figure S4, Supporting Information). For dye 1 the ground-state bleaching and the radical cation signature are vanished after 300 ps, whereas in 2 they remain visible beyond this time scale.
© 2012 WILEY-VCH Verlag GAdv. Funct. Mater. 2012, 22, 1291–1302
The results clearly revealed the faster recombination process in devices prepared using dye 1 compared to dye 2 devices.
In particular, in dye 1 the radical cation features decay with a lifetime of 18 ps. On the contrary, in dye 2 they are persistent on the time-scale of our experiment (1100 ps) and give rise to a much longer lifetime of 526 ps (Figure 9). Conclusively, charge recombination in 1 occurs almost 30 times faster than in 2, which is in line with the fact that in the radical cationic form of 1 the back-electron transfer is facilitated due to the pre-served planarity of the π-conjugated system. In other words, dye 1 recombines with electrons from TiO2 in the absence of a redox couple due to a facilitated electron flow from the TiO2 back to the dye radical cation. On the contrary, the back elec-tron transfer in 2 is hindered by the out-of-plane twist of the additional phenyl ring upon oxidation. This leads to longer life-times of the charge-separated state and thus may explain the improved device performances.
Importantly, in this context the charge recombination life-times do not match the lifetimes obtained by nanosecond laser photolysis. The reason for this is that the laser intensities used
1297wileyonlinelibrary.commbH & Co. KGaA, Weinheim

FULL
PAPER
129
www.afm-journal.dewww.MaterialsViews.com
Figure 10. Charge transfer resistance as a function of the corrected potential at the TiO2/electrolyte interface measured by EIS in the dark on the complete cells.
for the transient absorption studies exceed the laser power of the nanosecond experiment by 2 orders of magnitude. As a consequence, interfacial back electron flow is facilitated due to the high intensities and the generation of many more electrons per laser pulse. This, on the other hand, leads to much faster charge recombination dynamics as compared with the nano-second experiments.
Electrochemical impedance spectroscopy (EIS) measurements performed on complete cells in the dark revealed that the charge transfer resistance of the TiO2/electrolyte interface in the cell sensitized with dye 1 is lower than that with dye 2 (Figure 10). This may be the reason for faster recombination in the device with dye 1, which is in accordance with our above-mentioned results. Using Equation 2, where Rct stands for a charge transfer resistance and Rt is a transport resistance, the charge collection efficiency (ηcoll) for the best performing cell measured under 0.5 sun with dye 2 was found to be over 90% (Figure 11).
8 wileyonlinelibrary.com © 2012 WILEY-VCH Verlag G
Figure 11. Charge collection efficiency for a cell with dye 2 as a function of the corrected potential calculated from EIS measurement under 0.5 sun.
ηcoll =Rct
Rct + Rt (2)
The fitting of the EIS measurements could not provide the values required to calculate the charge collection efficiency for the cell with dye 1 because a Gerischer-type impedance was observed, where the transport resistance, Rt, and recombina-tion resistance cannot be resolved explicitly.[19] Nevertheless, the presence of Gerischer impedance confirms that the back electron transfer reaction is faster than the transport of charge carriers through the film, which explains the very low JSC meas-ured for the device with dye 1.
3. Conclusion
Two new thiophene-based D-π-A dyes incorporating a low bandgap electron withdrawing benzothiadiazole (BTDA) unit in the conjugated backbone were synthesized using Pd0-cata-lyzed cross-coupling and Knoevenagel condensation reactions. UV–vis spectroscopy, CV, and DFT calculations were performed to examine the photovoltaic performance of these dyes. Incor-poration of a BTDA unit close to the anchoring acceptor group in dye 1 led to a bathochromic shift of the CT bands in the UV-vis spectra in comparison to 2, in which the two acceptor units are decoupled by a phenyl ring. However, the promising capability of harvesting a broader range of photons by dye 1 did not translate into improved cell performance. Cells with dye 1 exhibited ample injection efficiencies, but suffered from unusu-ally fast recombination with the electrons from TiO2, which was reflected by the low PCEs. Insertion of a phenyl ring in order to electronically separate the anchoring group and the BTDA unit in 2 turned out to be a good solution to improve JSC. The additional phenyl ring in 2 seems to be twisted with respect to the π-conjugated donor and BTDA part. Theoretical studies revealed that upon formation of the radical cation of 2, the out-of-plane torsion of the adjacent BTDA and cyanoacrylic acid unit is enhanced leading to an interruption of the π-conjugation between donor and anchoring group. The results prompt to the conclusion that the formation of a stable dye 2 radical cation and the interruption of the π-conjugation between the donor and acceptor inhibit the back electron transfer. In particular, the electron injection rate was barely affected, but the recom-bination reaction was slowed down over 5 times. Thus, the effi-ciency of dye 2 (8.21%) was raised by a factor of 6.5 compared to dye 1 (1.24%). It is of crucial importance to understand the role of the dyes’ building blocks so as to improve the molecular design in the future. Blocking this electron leak by structural dye modification with a twisted and electronically decoupling unit may be a possible way to obtain high JSCs and efficiencies in DSSCs.
4. Experimental SectionInstruments and Measurements: NMR spectra were recorded on
a Bruker AMX 500 (1H NMR: 500 MHz, 13C NMR: 125 MHz) or an Avance400 spectrometer (1H NMR: 400 MHz, 13C NMR: 100 MHz), normally at 25 °C. Chemical shift values (δ) were expressed in parts
mbH & Co. KGaA, Weinheim Adv. Funct. Mater. 2012, 22, 1291–1302

FULL P
APER
www.afm-journal.dewww.MaterialsViews.com
per million using residual solvent protons (1H NMR, δH = 7.26 for CDCl3 and δH = 2.50 for DMSO-d6; 13C NMR, δC = 77.0 for CDCl3 and δC = 39.43 for DMSO-d6) as the internal standard. The splitting patterns were designated as follows: s (singlet), d (doublet), t (triplet), q (quartet), and m (multiplet). The assignments were Ph-H (phenyl protons), CHO (aldehyde protons), Th-H (thiophene protons), BTDA-H (benzothiadiazole protons), HexOPh-H (4-hexyloxyphenyl protons). Melting points were determined using a Büchi B-545 apparatus and were not corrected. Elemental analyses were performed on an Elementar VarioEL. Thin layer chromatography was carried out on aluminum plates, precoated with silica gel, Merck Si60 F254. Preparative column chromatography was performed on glass columns packed with silica gel, Merck Silica 60, particle size 40−63 μm. EI mass spectra were recorded on a Varian Saturn 2000 GC-MS, CI mass spectra on a Finnigan MAT SSQ-7000 and matrix-assisted laser desorption ionization time-of-flight (MALDI-TOF) mass spectra on a Bruker Daltonics Reflex III.
Materials: Tetrahydrofuran (THF) (Merck) was dried under reflux over sodium/benzophenone (Merck). dichloromethane (CH2Cl2), chloroform (CHCl3), n-hexane, ethyl acetate, acetonitrile (MeCN), dioxane, and methanol (MeOH) were purchased from Merck and distilled prior to use. All synthetic steps were carried out under an argon atmosphere (except Knoevenagel condensations). 2-Isopropoxy-4,4,5,5-tetramethyl-1,3,2-dioxaborolane was purchased from Aldrich and was dried over molecular sieve (4 Å) prior to use. Ammonium acetate (NH4OAc) and potassium carbonate were purchased from Merck, Pd2(dba)3·CHCl3, Pd(PPh3)2Cl2, HPtBu3BF4, n-BuLi (1.6 mol L−1 in hexane) were purchased from Acros, and cyanoacetic acid was purchased from ABCR. The potassium phosphate (K3PO4) solution was prepared by dissolving potassium phosphate (ABCR) in deionized water and was degassed prior to use. 4-Bromo-N,N-bis[4-(hexyloxy)phenyl]aniline 3,[20] 4-bromo-7-(bromomethyl)benzo[c][1,2,5]-thiadiazole 7,[21] 2,2′-bithiophene,[22] and 4-(7-bromobenzo[c][1,2,5]thiadiazol-4-yl)benzaldehyde 10[23] were prepared according to literature procedures.
2-(2,2′-Bithien-5-yl)-4,4,5,5-tetramethyl-1,3,2-dioxaborolane (4): 2,2′- Bithiophene (2.00 g, 12.0 mmol) was dissolved under argon in dry THF (30 mL). At –78 °C, n-butyllithium (1.6 m in hexane, 7.52 mL, 12.0 mmol) was added dropwise within 20 min. The greenish solution was allowed to warm to r.t. within 75 min. 2-Isopropoxy-4,4,5,5-tetramethyl-1,3,2-dioxaborolane (2.50 mL, 12.3 mmol) was slowly added at –78 °C, the solution was allowed to warm to r.t. within 2 h and was stirred at r.t. for 6 h. The reaction mixture was poured into a saturated NH4Cl solution (30 mL) and was extracted with diethyl ether (3 × 30 mL). The combined organic phases were washed with water, dried over Na2SO4, and the solvent was evaporated to provide boronic ester 4 as viscous oil (3.31 g, 94%). The product was dried in high vacuum and directly used in the next step without further purification. 1H NMR (400 MHz, CDCl3): δ = 7.55 (d, 3J = 3.6 Hz, 1H, Th-H), 7.28–7.24 (m, 3H, Th-H), 7.05–7.02 (m, 1H, Th-H), 1.38 (s, 12H, -CH3). 13C NMR (100 MHz, CDCl3): δ = 144.01, 137.88, 137.26, 127.86, 124.93, 124.91, 124.33, 124.31, 84.14, 24.74. MS (EI): m/z (%): 292 (M+, 100).
5-(N,N-Bis(4-hexyloxyphenyl)-4-aminophenyl)-2,2′-bithiophene (5): Trip-henylamine 3 (834 mg, 1.59 mmol) and boronic ester 4 (550 mg, 1.88 mmol) were dissolved under argon in dry THF (12 mL) and the solution was degassed. Pd2(dba)3 (29.8 mg, 32.5 μmol, 2 mol%) and HPtBu3BF4 (18.6 mg, 62.2 μmol, 4 mol%) were added, and the solution was degassed again. An aqueous solution of K3PO4 (2 m, 3.2 mL, 6.4 mmol) was added and the mixture turned from dark red to green. It was stirred at r.t. overnight. The reaction mixture was poured into a saturated NH4Cl solution (15 mL) and extracted with DCM (3 × 15 mL). The combined organic phases were dried over Na2SO4 and the solvent was removed in vacuo. The resulting brown oil was purified by column chromatography (silica; hexane/DCM 9:1 to 6:4). Bithiophene 5 (930 mg, 96%) was obtained as a greenish yellow solid. Melting point (Mp.) 61–64 °C.1H NMR (400 MHz, DMSO-d6): δ = 7.47 (dd, 3J = 5.2 Hz, 4J = 0.8 Hz, 1H, Th-H), 7.44 (m, 2H, Ph-H), 7.27 (dd, 3J = 3.6 Hz, 4J = 1.2 Hz, 1H, Th-H), 7.26 (d, 3J = 3.6 Hz, 1H, Th-H), 7.23 (d, 3J = 3.6 Hz, 1H, Th-H), 7.07 (dd, 3J = 5.2 Hz, 4J = 3.6 Hz, 1H, Th-H), 7.01 (m, 4H, HexOPh-H), 6.89 (m, 4H, HexOPh-H), 6.75 (m, 2H, Ph-H), 3.92 (t, 3J =
© 2012 WILEY-VCH Verlag GmAdv. Funct. Mater. 2012, 22, 1291–1302
6.6 Hz, 4H, -OCH2-), 1.72–1.65 (m, 4H, -OCH2CH2-), 1.44–1.36 (m, 4H, -OCH2CH2CH2-), 1.32–1.27 (m, 8H, -CH2CH2CH3), 0.87 (t, 3J = 7.0 Hz, 6H, -CH3).13C NMR (100 MHz, DMSO-d6): δ = 155.41, 148.10, 142.50, 139.52, 136.56, 134.22, 128.30, 126.84, 126.04, 125.05, 124.98, 124.79, 123.60, 122.84, 119.12, 115.48, 67.63, 30.98, 28.69, 25.19, 22.05, 13.88. MS (MALDI-TOF): m/z: [M+] 609.6 (calcd. for C38H43NO2S2 609.3). Elemental analysis: calc. (%) for C38H43NO2S2: C, 74.84; H, 7.11; N, 2.30; found: C, 74.70; H, 7.09; N, 2.27.
5-(N,N-Bis(4-hexyloxyphenyl)-4-aminophenyl)-5′-(tri-n-butylstannyl)-2,2′-bithiophene (6): Bithiophene 5 (601 mg, 0.99 mmol) was dissolved in dry THF (10 mL) and the solution was cooled to –78 °C. n-BuLi (1.6 m in hexane, 0.63 mL, 1.01 mmol) was added dropwise and the solution turned dark green. It was stirred for 1 h at this temperature, then tributyltin chloride (360 mg, 1.06 mmol) was added. The reaction mixture was allowed to slowly warm to r.t. and was stirred at r.t. overnight. Water (30 mL) was added and the mixture was extracted with dichloromethane (DCM) (2 × 30 mL). The combined organic layers were washed with water, dried over Na2SO4, and the solvent was removed. The crude stannyl compound 6 (943 mg, quant.) was obtained as a brownish oil. It was directly used in the next step without further purification. 1H NMR (400 MHz, CDCl3): δ = 7.39 (d, 3J = 8.8 Hz, 2H, Ph-H), 7.28 (d, 3J = 3.2 Hz, 1H, Th-H), 7.10 (d, 3J = 4.0 Hz, 1H, Th-H), 7.08–7.04 (m, 6H, HexOPh-H + ThH), 6.91 (d, 3J = 8.8 Hz, 2H, Ph-H), 6.85–6.81 (m, 4H, HexOPh-H), 3.94 (t, 3J = 6.4 Hz, 4H, -OCH2-), 1.82–1.75 (m, 4H, -OCH2CH2-), 1.63–1.55 (m, 6H, -CH2-), 1.51–1.45 (m, 4H, CH2-), 1.43–1.31 (m, 14H, -CH2-), 1.15–1.10 (m, 6H, -CH2-), 0.92 (t, 3J = 7.2 Hz, 6H, -CH3), 0.91 (t, 3J = 7.2 Hz, 9H, -CH3). 13C NMR (100 MHz, CDCl3): δ = 155.62, 148.30, 143.10, 143.08, 140.48, 136.30, 136.11, 135.60, 126.71, 126.60, 126.24, 126.18, 124.47, 124.30, 122.22, 120.46, 115.33, 68.31, 31.63, 29.36, 28.97, 27.27, 25.79, 22.63, 14.05, 13.67, 10.92. MS (MALDI-TOF): m/z: [M+] 899.5 (calcd. for C50H69NO2S2Sn 899.4).
4-Bromo-7-(hydroxymethyl)benzo[c][1,2,5]thiadiazole (8): 4-Bromo-7-(bromomethyl)-benzo[c][1,2,5]thiadiazole 7 (2.67 g, 8.67 mmol) and potassium carbonate (3.60 g, 26.0 mmol) were suspended in a dioxane/water mixture (50 mL, 1:1 v/v) and the mixture was refluxed for 1 h. The solvents were removed in vacuo and the residue was partitioned between 2 m hydrochloric acid (60 mL) and dichloromethane (60 mL). The aqueous phase was extracted with DCM (2 × 50 mL) and the combined organic phases were dried over Na2SO4. Removal of the solvent afforded 2.13 g of crude product. It was purified by column chromatography (silica; hexane/ethyl acetate 4:1). Product 8 was obtained as an off-white powder (1.36 g, 5.57 mmol, 64%). Mp. 139 °C. 1H NMR (400 MHz, CDCl3): δ = 7.82 (d, 3J = 7.2 Hz, 1H, BTDA-H-5), 7.47 (dt, 3J = 7.2 Hz, 4J = 1.0 Hz, 1H, BTDA-H-6), 5.13 (d, 4J = 1.0 Hz, 2H, CH2OH), 2.52 (s br, 1H, CH2OH). 13C NMR (100 MHz, CDCl3): δ = 153.47, 153.08, 133.27, 132.01, 126.94, 113.21, 61.82. MS (CI): m/z (%): 247 ([M+]+2, 94), 245 ([M+]+H, 100), 229 (87), 227(83), 217(18), 215(18). Elemental analysis: calc. (%) for C7H5BrN2OS: C, 34.30; H, 2.06; N, 11.43; found: C, 34.55; H, 2.22; N, 11.30.
7-Bromobenzo[c][1,2,5]thiadiazole-4-carbaldehyde (9): 4-Bromo-7-(hydroxy-methyl)benzo[c][1,2,5]thiadiazole 8 (1.00 g, 4.08 mmol) and manganese(IV) oxide (1.43 g, 16.4 mmol) were suspended in chloroform (40 mL) and the mixture was first stirred at r.t. for 16 h then refluxed for 3 h. The mixture was filtered, the filtrate was evaporated, and the residue was purified by column chromatography (silica; hexane/ethyl acetate 4:1). The pure aldehyde 9 (884 mg, 89%) was obtained as a slightly yellowish solid. Mp. 192 °C. 1H NMR (400 MHz, CDCl3): δ = 10.74 (s, 1H, CHO), 8.09 (d, 3J = 7.6 Hz, 1H, BTDA-H-5), 8.04 (d, 3J = 7.6 Hz, 1H, BTDA-H-6).13C NMR (100 MHz, CDCl3): δ = 188.34, 153.99, 152.28, 132.16, 131.68, 126.79, 121.89. MS (CI): m/z (%): 245 ([M+]+2, 100), 243 ([M+]+H, 99). Elemental analysis: calc. (%) for C7H3BrN2OS: C, 34.59; H, 1.24; N, 11.52; found: C, 34.40; H, 1.26; N, 11.39.
7-(5-(N,N-Bis(4-hexyloxyphenyl)-4-aminophenyl)-2,2′-bithien-5′-yl)benzo[c]-[1,2,5]thiadiazole-4-carbaldehyde (11): In a Schlenk tube, stannyl compound 6 (805 mg, 0.716 mmol) and 7-bromobenzo[c][1,2,5]thiadiazole-4-carbaldehyde 9 (148 mg, 0.609 mmol) were dissolved under argon in dry THF (15 mL) and the solution was degassed. Pd(PPh3)2Cl2 (13.0 mg, 18.5 μmol, 3 mol%) was added and the solution was degassed
1299wileyonlinelibrary.combH & Co. KGaA, Weinheim

FULL
PAPER
1300
www.afm-journal.dewww.MaterialsViews.com
again. It was stirred at 70 °C for 15 h. The reaction mixture was poured into water (30 mL) and extracted with DCM (3 × 30 mL). The combined organic layers were dried over Na2SO4 and the solvent was removed. The crude product was purified by column chromatography (silica; DCM:hexane 3:7 to 100:0, product eluted with DCM:EtOAc 9:1). Aldehyde 11 (406 mg, 86%) was obtained as a purple solid. 1H NMR (400 MHz, CDCl3): δ = 10.68 (s, 1H, CHO), 8.23–8.18 (m, 2H, BTDA-H + Th-H), 7.93 (dd, 3J = 7.6 Hz, 5J = 1.6 Hz, 1H, BTDA-H), 7.39 (d, 3J = 8.4 Hz, 2H, Ph-H), 7.26–7.25 (m, 2H, Th-H), 7.11 (d, 3J = 3.6 Hz, 1H, Th-H), 7.07 (d, 3J = 8.8 Hz, 4H, HexOPh-H), 6.91 (d, 3J = 8.4 Hz, 2H, Ph-H), 6.86–6.82 (m, 4H, HexOPh-H), 3.94 (t, 3J = 6.6 Hz, 4H, -OCH2-), 1.82–1.74 (m, 4H, -OCH2CH2-), 1.51–1.43 (m, 4H, -OCH2CH2CH2-), 1.37–1.32 (m, 8H, -CH2CH2CH3), 0.92 (t, 3J = 7.2 Hz, 6H, -CH3).13C NMR (100 MHz, CDCl3): δ = 188.42, 155.73, 153.72, 152.19, 148.71, 145.12, 142.26, 140.14, 136.35, 134.22, 132.79, 132.76, 131.20, 126.83, 126.27, 125.75, 125.32, 125.13, 124.26, 123.23, 122.42, 119.96, 115.29, 68.23, 31.59, 29.30, 25.75, 22.61, 14.05. MS (MALDI-TOF): m/z: [M+] 771.7 (calcd. for C45H45N3O3S3 771.3). Elemental analysis: calc. (%) for C45H45N3O3S3: C, 70.01; H, 5.87; N, 5.44; found: C, 69.87; H, 5.86; N, 5.34.
(E)-2-Cyano-3-(7-(5-(N,N-bis(4-hexyloxyphenyl)-4-aminophenyl)-2,2′-bithien-5′-yl)benzo[c][1,2,5]thiadiazol-4-yl)acrylic acid (1): Aldehyde 11 (165 mg, 0.214 mmol), cyanoacetic acid (363 mg, 4.27 mmol) and NH4OAc (14.7 mg, 0.191 mmol) were dissolved in a DCM/MeCN mixture (30 mL, 2:1 v/v) and the deeply purple solution was refluxed for 7 h. The almost black reaction mixture was poured into water (30 mL) and extracted with DCM. The combined organic phases were dried over Na2SO4. After removal of DCM a dark solid precipitated, which was collected and washed thoroughly with ethanol. The product contained some aldehyde, therefore it was further purified by column chromatography (silica; aldehyde eluted with DCM, product with DCM:MeOH 9:1 to 1:1). Dye 1 (155 mg, 86%) was obtained as a deeply purple solid. 1H NMR (400 MHz, DMSO-d6): δ = 8.84 (s, 1H, C=CH), 8.57 (d, 3J = 7.6 Hz, 1H, BTDA-H), 8.20 (d, 3J = 7.6 Hz, 1H, BTDA-H), 8.12 (d, 3J = 3.2 Hz, 1H, Th-H), 7.39 (d, 3J = 8.0 Hz, 2H, Ph-H), 7.35–7.32 (m, 2H, Th-H), 7.24 (d, 3J = 2.8 Hz, 1H, Th-H), 7.00 (d, 3J = 8.4 Hz, 4H, HexOPh-H), 6.88 (d, 3J = 8.4 Hz, 4H, HexOPh-H), 6.71 (d, 3J = 8.0 Hz, 2H, Ph-H), 3.91 (t, 3J = 6.0 Hz, 4H, -OCH2-), 1.72–1.65 (m, 4H, -OCH2CH2-), 1.44–1.35 (m, 4H, -OCH2CH2CH2-), 1.33–1.24 (m, 8H, -CH2CH2CH3), 0.87 (t, 3J = 7.2 Hz, 6H, -CH3). HRMS (MALDI-TOF) m/z: [M+] 838.26747 (calcd. For C48H46N4O4S3 838.26757).
4-(7-(5′-(4-(Bis(4-(hexyloxy)phenyl)amino)phenyl)-2,2′-bithien-5-yl)benzo[c][1,2,5]thiadiazol-4-yl)benzaldehyde (12): In a Schlenk tube, 4-(7-bromobenzo[c][1,2,5]thiadiazol-4-yl)benzaldehyde 10 (94.0 mg, 0.29 mmol) and stannylated bithiophene 6 were dissolved under argon in dry THF (10 mL) and the solution was degassed. Pd(PPh3)2Cl2 (6.60 mg, 9.40 μmol, 3 mol%) was added and the solution was degassed again. Afterwards, it was stirred at 75 °C for 4.5 h. The deeply red reaction mixture was poured into water (20 mL) and extracted three times with DCM. The combined organic layers were washed with water (20 mL), dried over Na2SO4 and the solvent was removed. The crude product was purified by column chromatography (flash silica; DCM:hexane gradient elution 1:1 to 100:0, product eluted with pure DCM). Aldehyde 12 (229 mg, 0.27 mmol, 92%) was obtained as a red solid. 1H NMR (400 MHz, CDCl3): δ = 10.10 (s, 1H, CHO), 8.15 (d, 3J = 8.4 Hz, 2H, Ph-H), 8.09 (d, 3J = 4.0 Hz, 1H, Th-H), 8.03 (d, 3J = 8.4 Hz, 2H, Ph-H), 7.91 (d, 3J = 7.5 Hz, 1H, BTDA-H), 7.79 (d, 3J = 7.5 Hz, 1H, BTDA-H), 7.40 (d, 3J = 8.7 Hz, 2H, HexOPh-H), 7.25 (d, 3J = 3.8 Hz, 1H, Th-H), 7.23 (d, 3J = 3.8 Hz, 1H, Th-H), 7.12–7.06 (m, 5H, Th-H + HexOPh-H), 6.91 (d, 3J = 7.9 Hz, 2H, HexOPh-H), 6.84 (d, 3J = 8.8 Hz, 4H, HexOPh-H), 3.94 (t, 3J = 6.6 Hz, 4H, -OCH2-), 1.82–1.75 (m, 4H, -OCH2CH2-), 1.51–1.43 (m, 4H, -OCH2CH2CH2-), 1.38–1.33 (m, 8H, -CH2CH2CH3), 0.92 (t, 3J = 7.0 Hz, 6H, -CH3). 13C NMR (100 MHz, CDCl3): δ = 191.73, 155.72, 153.65, 152.53, 148.59, 144.36, 143.09, 140.27, 139.77, 137.15, 135.72, 134.75, 130.72, 129.90, 129.66, 128.99, 128.85, 127.33, 126.78, 126.24, 125.64, 125.12, 124.74, 124.01, 122.35, 120.13, 115.33, 68.28, 31.60, 29.32, 25.75, 22.60, 14.02. MS (MALDI-TOF) m/z: [M+] 847.7 (calcd. for C51H49N3O3S3 847.3). Elemental analysis: calc. (%) for C51H49N3O3S3: C, 72.22; H, 5.82; N, 4.95; found C, 72.36; H, 5.84; N, 4.96.
wileyonlinelibrary.com © 2012 WILEY-VCH Verlag
(E)-3-(4-(7-(5′-(4-(bis(4-(hexyloxy)phenyl)amino)phenyl)-2,2′-bithien-5-yl)benzo[c][1,2,5]thiadiazol-4-yl)phenyl)-2-cyanoacrylic acid (2): Aldehyde 12 (150 mg, 0.18 mmol), cyanoacetic acid (302 mg, 3.55 mmol) and NH4OAc (13.2 mg, 0.17 mmol) were dissolved in a DCM/MeCN mixture (20 mL, 2:1 v/v) and the deeply red solution was refluxed for 45 h.The DCM was evaporated and a dark solid precipitated. It was filtered, washed with ethanol, and dried. It was further purified by column chromatography (silica; aldehyde eluted with DCM, product with DCM/MeOH 9:1). The product still contained some cyanoacetic acid, therefore it was washed thoroughly with ethanol and dried in high vacuum to obtain 62 mg (0.07 mmol, 38%) of dye 2 as deeply purple solid. 1H NMR (400 MHz, DMSO-d6): δ = 8.36 (s, 1H, C = CH), 8.24 (d, 3J = 8.2 Hz, 2H, Ph-H), 8.18–8.13 (m, 4H, Ph-H + Th-H + BTDA-H), 8.03 (d, 3J = 7.6 Hz, 1H, BTDA-H), 7.46 (d, 3J = 8.4 Hz, 2H, HexOPh-H), 7.42 (d, 3J = 3.7 Hz, 1H, Th-H), 7.38 (d, 3J = 3.5 Hz, 1H, Th-H), 7.31 (d, 3J = 3.5 Hz, 1H, Th-H), 7.02 (d, 3J = 8.6 Hz, 4H, HexOPh-H), 6.90 (d, 3J = 8.6 Hz, 4H, HexOPh-H), 6.75 (d, 3J = 8.4 Hz, 2H, HexOPh-H), 3.93 (t, 3J = 6.3 Hz, 4H, -OCH2-), 1.73–1.66 (m, 4H, -OCH2CH2-), 1.45–1.37 (m, 4H, -OCH2CH2CH2-), 1.35–1.26 (m, 8H, -CH2CH2CH3), 0.88 (t, 3J = 6.5 Hz, 6H, -CH3). HRMS (MALDI-TOF) m/z: [M+] 914.29877 (calcd. for C54H50N4O4S3 914.29887).
Optical and Cyclic Voltammetry Measurements: Optical measurements were carried out in 1 cm cuvettes with Merck Uvasol grade solvents and absorption spectra were recorded on a Perkin Elmer Lambda 19 spectrometer. Transparent TiO2 films (5 μm) screen printed onto a fluorine-doped tin oxide (FTO) substrate were immersed in the 0.3 mm dye solutions in chlorobenzene for 4 h. The UV-vis spectra were measured with a CARY 5 UV-Vis-NIR spectrophotometer (Varian, Inc.). Cyclic voltammetry experiments were performed with a computer-controlled Autolab PGSTAT30 potentiostat in a three-electrode single-compartment cell with a platinum working electrode, a platinum wire counter electrode and Ag/AgCl reference electrode. All potentials were internally referenced to the ferrocene/ferrocenium couple.
Computational Details: All molecular orbital calculations were carried out using the Gaussian 09 suite[24] of programs with the B3PW91[25] and B3LYP[26] hybrid functionals and the 6-31G*[27] basis set. First, the ground state geometries of 1 and 2 were optimized using the restricted Hartree–Fock method. To ensure that the resulting structures represented the global minimum on the potential energy surface the geometries were computed using the B3LYP functional and the semiempirical AM1* level[28] as implemented in the VAMP 10.0 software package.[29] The resulting deviation of the dihedral angles between the BTDA and phenyl ring was less than 1°, which assured the global minimum. The long hexyloxy chains, which have no significant impact on the frontier orbitals of the chromophores, were replaced with methoxy-substituents in order to accelerate the convergence of optimizations.
Device Fabrication: Screen-printed double layers of TiO2 particles were used as photoelectrodes in this study. For transparent films a 5 μm thick layer of 20 nm-sized TiO2 particles was printed on the fluorine doped SnO2 (FTO) conducting glass electrode. Double layered films consisted of a 8 μm thick transparent layer of 20 nm-sized TiO2 covered with a 5 μm thick scattering layer of 400 nm sized TiO2 particles. The porosity was evaluated as 67% for the 20 nm TiO2 transparent layer and 42% for the scattering layer, determined from BET measurements. After sintering at 500 °C and cooling to 80 °C, the sintered TiO2 electrodes were sensitized by dipping for 5 h in the respective dye solutions (0.3 mm of the dye with 2 mm of chenodeoxycholic acid, CDCA, in chlorobenzene), and then assembled using a thermally platinized FTO/glass counter electrode. The working and counter electrodes were separated by a 25 μm thick hot melt ring (Surlyn, DuPont) and sealed by heating. The cell’s internal space was filled with electrolyte using a vacuum pump. The composition of the electrolytes is given in the Table 2. The electrolyte-injecting hole on the thermally platinized FTO glass counter electrode was finally sealed with a Surlyn sheet and a thin glass cover by heating. Cells were equipped with self-adhesive antireflective foil that acted as well as UV cut-off filter.
Photovoltaic Characterization: A 450 W xenon light source (Oriel, USA) was used to characterize the solar cells. The spectral output of the lamp
GmbH & Co. KGaA, Weinheim Adv. Funct. Mater. 2012, 22, 1291–1302

FULL P
APER
www.afm-journal.dewww.MaterialsViews.com
was matched in the region of 350–750 nm with the aid of a Schott K113 Tempax sunlight filter (Präzisions Glas & Optik GmbH, Germany) so as to reduce the mismatch between the simulated and true solar spectra to less than 2%. The current–voltage characteristics of the cell under these conditions were obtained by applying external potential bias to the cell and measuring the generated photocurrent with a Keithley model 2400 digital source meter (Keithley, USA). A similar data acquisition system was used to control the incident photon-to-current conversion efficiency (IPCE) measurement. Under computer control, light from a 300 W xenon lamp (ILC Technology, USA) was focused through a Gemini-180 double monochromator (Jobin Yvon Ltd., UK) onto the photovoltaic cell under test. The devices were masked to attain an illuminated active area of 0.159 cm2.
Dye Loading: Transparent TiO2 films (4 μm) screen printed on a non-conducting microscope slide were immersed in the solutions identical to the ones used for cell preparation (0.3 mm dye powder + 2 mm of CDCA in chlorobenzene) and kept in the dark for 4 h. Then the films were rinsed with chlorobenzene and placed in a solution of tetrabutylammonium hydroxide (TBAOH) in DMF (0.5 g per 50 mL) for overnight desorption. The UV-vis spectra were measured using TBAOH/DMF solution as a blank on a CARY 5 UV-Vis-NIR spectrophotometer (Varian, Inc.).
Photocurrent and Photovoltage Transient Measurements: Transient decays were measured under white light bias with superimposed red light perturbation pulses (both light sources were light-emitting diodes (LEDs)). The voltage dynamics were recorded by using a Keithley 2400 source meter. Varying the intensity of white light bias allowed the estimate of recombination rate constant (and thus apparent electron lifetime) at different open-circuit potentials by controlling the concentration of the free charges in TiO2. Red perturbation pulses were adjusted to a very low level in order to maintain single-exponential voltage decay.
Time-Correlated Single Photon Counting: Steady-state excited state emission was measured with a FluoroLog-322 (Horiba) spectrometer equipped with a 450 W Xe arc lamp. Time-correlated single photon counting experiment was conducted using the above mentioned setup with additional FluoroHub (Horiba) unit with TBX-04 photomultiplier as a detector. For measurement a NanoLED pulsed laser-diode emitting at 406 nm was used. In case of measurement of the dye adsorbed on the TiO2 surface (transparent, 3 μm) the setup was switched to the front-face detection mode.
Electrochemical Impedance Spectroscopy: The electrochemical measurements were conducted on the complete devices in the dark at 20 °C. A sinusoidal potential perturbation of an amplitude of 10 mV was applied over a frequency range 1 MHz to 0.1 Hz (Autolab PG30) for a potential bias varying between 100 and 660 mV with a 20 mV step. Obtained spectra were resolved using the transmission model line.
Laser Studies: The nanosecond laser flash photolysis technique was applied to dye-sensitized, 8 μm-thick, transparent TiO2 mesoporous films deposited on normal flint glass. Pulsed excitation (λ = 505 nm, 7 ns pulse duration, 30 Hz repetition rate) was carried out by a Powerlite 7030 frequency-doubled Q-switched Nd:YAG laser (Continuum, Santa Clara, California, USA). The laser beam output was expanded by a planoconcave lens to irradiate a large cross-section of the sample, whose surface was kept at a 30° angle to the excitation beam. The laser fluence on the sample was kept at a low level (30 μJ cm−2 per pulse) to ensure that, on average, less than one electron was injected per nanocrystalline TiO2 particle on pulsed irradiation. The probe light, produced by a continuous wave xenon arc lamp, was first passed through a monochromator tuned at 650 nm, various optical elements, the sample, and then through a second monochromator, before being detected by a fast photomultiplier tube (Hamamatsu, R9110). Data waves were recorded on a DSA 602A digital signal analyser (Tektronix, Beaverton, Oregon, USA). Satisfactory signal-to-noise ratios were typically obtained by averaging over 1500 laser shots.
Femtosecond Transient Absorption: Time-resolved transient absorption measurements by the pump-probe technique used a compact CPA-2001, 1 kHz, Ti:sapphire-amplified femtosecond laser (Clark-MXR), with a pulse width of about 120 fs and a pulse energy of 1 mJ at a central wavelength of 775 nm. The output beam was split into two parts for pumping a
© 2012 WILEY-VCH Verlag GmAdv. Funct. Mater. 2012, 22, 1291–1302
double-stage noncollinear optical parametric amplifier (NOPA) and to produce a white light continuum in a sapphire plate or 387 nm UV light by second harmonic generation of the laser output in a thin β-barium borate (BBO) crystal. The NOPA was pumped by 200 μJ pulses at a central wavelength of 775 nm and the excitation wavelength was tuned to 530 nm to generate pulses of approximately 10 μJ. The output pulses of the NOPAs were compressed in a SF10-glass prism pair compressor down to a duration of less than 50 fs (full width at half maximum (fwhm)). Iris diaphragms were used to decrease the pulse energy down to a few microjoules for the pump and to less than 1 μJ for the probe beam. Transient spectra were measured using a white light continuum (WLC) for probing. The latter was generated from pulses (energy <10 μJ) focused into a 2 mm thick sapphire plate. The monofilament white beam was collimated using a 90° off-axis paraboloid mirror and steered to the sample using only reflective optics. A smooth monotonic spectral distribution between 480 and 720 nm was obtained by controlling the pump energy with an iris and a variable density filter. The polarization between the pump and probe beams was controlled using a coherent zero-order half waveplate and experiments were carried out in the magic angle (54.7°) configuration. Pump and probe beams were directed parallel to each other toward a 60° off-axis paraboloid mirror that focused them into the sample. A broadband membrane beam splitter was placed before the sample to split the probe beam into reference and signal arms. Both were collected by a lens system and directed into two Andor Shamrock 163 imaging spectrographs. The absorbance change was calculated using the ratio between data obtained with and without the pump pulses reaching the sample and corrected for fluctuations in the WLC intensity using the reference beam spectra.
Photoinduced Absorbance: The PIA spectra of the various cells were recorded over a wavelength range of approximately 500 to 1500 nm following an (on/off) photomodulation using a 9 Hz square wave emanating from a blue LED. White probe light from a halogen lamp was used as illumination source.
Supporting InformationSupporting Information is available from the Wiley Online Library or from the author.
AcknowledgementsS.H. and M.M. contributed equally to this work. A.M., S.H., and P.B. thank the German Ministry of Education and Research (BMBF) in the frame of project OPEG 2010. M.G. thanks the Swiss National Science Foundation for the financial support under the Indo-Swiss Joint Research Programme (ISJRP) grant. M.W. and J.E.M. gratefully acknowledge support from the NCCR MUST program of the Swiss NSF. The authors would like to thank Pascal Comte for providing TiO2 layers used for the study.
Received: October 19, 2011Published online: January 27, 2012
[1] M. Grätzel, Nature 2001, 414, 338. [2] B. O’Regan, M. Grätzel, Nature 1991, 353, 737. [3] M. Grätzel, Acc. Chem. Res. 2009, 42, 1788. [4] Q. Yu, Y. Wang, Z. Yi, N. Zu, J. Zhang, M. Zhang, P. Wang, ACS
Nano 2010, 4, 6032. [5] C.-Y. Chen, M. Wang, J.-Y. Li, N. Pootrakulchote, L. Alibabaei,
C.-H. Ngoc-le, J.-D. Decoppet, J.-H. Tsai, C. Grätzel, C.-G. Wu, S. M. Zakeeruddin, M. Grätzel, ACS Nano 2009, 3, 3103.
[6] H. Zollinger, Color Chemistry: Syntheses, Properties, and Applications of Organic Dyes and Pigments, 3rd ed., VHCA and Wiley-VCH, Zürich and Weinheim, 2003.
[7] A. Mishra, M. K. R. Fischer, P. Bäuerle, Angew. Chem. Int. Ed. 2009, 48, 2474.
1301wileyonlinelibrary.combH & Co. KGaA, Weinheim

FULL
PAPER
1302
www.afm-journal.dewww.MaterialsViews.com
[8] H. Imahori, T. Umeyama, S. Ito, Acc. Chem. Res. 2009, 42, 1809. [9] X.-F. Wang, H. Tamiaki, Energy Environ. Sci. 2010, 3, 94.[10] J.-J. Kim, H. Choi, J.-W. Lee, M.-S. Kang, K. Song, S. O. Kang, J. Ko,
J. Mater. Chem. 2008, 18, 5223.[11] J. A. Mikroyannidis, P. Suresh, M. S. Roy, G. D. Sharma, J. Power
Sources 2010, 195, 3002.[12] Z.-M. Tang, T. Lei, K.-J. Jiang, Y.-L. Song, J. Pei, Chem.–Asian J. 2010,
5, 1911.[13] M. Velusamy, K. R. Justin Thomas, J. T. Lin, Y. C. Hsu, K. C. Ho, Org.
Lett. 2005, 7, 1899.[14] W. Zhu, Y. Wu, S. Wang, W. Li, X. Li, J. Chen, Z.-s. Wang, H. Tian,
Adv. Funct. Mater. 2011, 21, 756.[15] S. Kim, H. Lim, K. Kim, C. Kim, T. Kang, M. Ko, N. Park, IEEE J. Sel.
Top. Quant. Electron. 2010, 16, 1627.[16] M. Marszalek, S. Haid, A. Mishra, J. Teuscher, J.-E. Moser,
R. Humphry-Baker, S. M. Zakeeruddin, M. Grätzel, P. Bäuerle, pres-entation at 3rd Hybrid and Organic Photovoltaic Conference, 15–18, May 2011, Valencia, Spain.
[17] A. S. D. Sandanayaka, Y. Taguri, Y. Araki, T. Ishi-i, S. Mataka, O. Ito, J. Phys. Chem. B 2005, 109, 22502.
[18] N. Kopidakis, K. D. Benkstein, J. van de Lagemaat, A. J. Frank, J. Phys. Chem. B 2003, 107, 11307.
[19] J. Bisquert, J. Phys. Chem. B 2002, 106, 325.[20] J.-H. Yum, D. P. Hagberg, S.-J. Moon, K. M. Karlsson, T. Marinado,
L. Sun, A. Hagfeldt, M. K. Nazeeruddin, M. Grätzel, Angew. Chem. Int. Ed. 2009, 48, 1576.
[21] J. U. Ju, S. O. Jung, Q. H. Zhao, Y. H. Kim, J. T. Je, S. K. Kwon, Bull. Korean Chem. Soc. 2008, 29, 335.
[22] J. Kagan, S. K. Arora, Heterocycles 1983, 20, 1937.[23] A. S. D. Sandanayaka, Y. Taguri, Y. Araki, T. Ishi-i, S. Mataka, O. Ito,
J. Phys. Chem. B 2005, 109, 22502.
wileyonlinelibrary.com © 2012 WILEY-VCH Verlag
[24] Gaussian 09, Revision B.03; M. J. Frisch, G. W. Trucks, H. B. Schlegel, G. E. Scuseria, M. A. Robb, J. R. Cheeseman, G. Scalmani, V. Barone, B. Mennucci, G. A. Petersson, H. Nakatsuji, M. Caricato, X. Li, H. P. Hratchian, A. F. Izmaylov, J. Bloino, G. Zheng, J. L. Sonnenberg, M. Hada, M. Ehara, K. Toyota, R. Fukuda, J. Hasegawa, M. Ishida, T. Nakajima, Y. Honda, O. Kitao, H. Nakai, T. Vreven, J. A. Montgomery Jr., J. E. Peralta, F. Ogliaro, M. Bearpark, J. J. Heyd, E. Brothers, K. N. Kudin, V. N. Staroverov, R. Kobayashi, J. Normand, K. Raghavachari, A. Rendell, J. C. Burant, S. S. Iyengar, J. Tomasi, M. Cossi, N. Rega, J. M. Millam, M. Klene, J. E. Knox, J. B. Cross, V. Bakken, C. Adamo, J. Jaramillo, R. Gomperts, R. E. Stratmann, O. Yazyev, A. J. Austin, R. Cammi, C. Pomelli, J. W. Ochterski, R. L. Martin, K. Morokuma, V. G. Zakrzewski, G. A. Voth, P. Salvador, J. J. Dannenberg, S. Dapprich, A. D. Daniels, O. Farkas, J. B. Foresman, J. V. Ortiz, J. Cioslowski, D. J. Fox, Gaussian, Inc., Wallingford, CT, 2009.
[25] a) A. D. Becke, J. Chem. Phys. 1993, 98, 5648; b) K. Burke, J. P. Perdew, Y. Wang, in Electronic Density Functional Theory: Recent Progress and New Directions, (Eds: J. F. Dobson, G. Vignale, M. P. Das), Plenum Press, New York 1998.
[26] P. J. Stephens, F. J. Devlin, C. F. Chablowski, M. Frisch, J. Phys. Chem. 1994, 98, 11623.
[27] a) R. Ditchfield, W. J. Hehre, J. A. Pople, J. Chem. Phys. 1971, 54, 724–728; b) V. A. Rassolov, J. A. Pople, M. A. Ratner, T. L. Windus, J. Chem. Phys. 1998, 109, 1223.
[28] a) P. Winget, A. H. C. Horn, C. Selcuki, B. Martin, T. Clark, J. Mol. Model. 2003, 9, 408; b) H. Kayi, T. Clark, J. Mol. Model. 2007, 13, 965.
[29] VAMP 10.0; T. Clark, A. Alex, B. Beck, F. Burkhardt, J. Chandrasekhar, P. Gedeck, A. Horn, M. Hutter, B. Martin, G. Rauhut, W. Sauer, T. Schindler, T. Steinke, Computer-Chemie-Centrum, Universität Erlangen-Nürnberg, Erlangen, 2003.
GmbH & Co. KGaA, Weinheim Adv. Funct. Mater. 2012, 22, 1291–1302

Copyright WILEY‐VCH Verlag GmbH & Co. KGaA, 69469 Weinheim, Germany, 2012.
Supporting Information for Adv. Funct. Mater., DOI: 10.1002/adfm. 201102519
Significant Improvement of Dye‐Sensitized Solar Cell Performance by Small Structural Modification in π ‐Conjugated Donor–Acceptor Dyes Stefan Haid, Magdalena Marszalek, Amaresh Mishra,* Mateusz Wielopolski, Joël Teusche, Jacques‐E. Moser, Robin Humphry‐Baker, Shaik M. Zakeeruddin,* Michael Grätzel , * and Peter Bäuerle *
Submitted to
1
DOI: 10.1002/adfm.201102519
Supporting Information
Significant Improvement of Dye-Sensitized Solar Cell Performance by
Small Structural Modification in π-Conjugated Donor-Acceptor Dyes
By Stefan Haid,‡Magdalena Marszalek,‡ Amaresh Mishra,* Mateusz Wielopolski, Joel Teuscher, Jacques-E. Moser, Robin Humphry-Baker, Shaik M. Zakeeruddin,* Michael Grätzel,* Peter Bäuerle*
[*] Dr. A. Mishra, S. Haid, Prof. P. Bäuerle
Institute of Organic Chemistry II and Advanced Materials, University of Ulm, Albert-
Einstein-Allee 11, 89081 Ulm (Germany)
E-mail: [email protected]; [email protected]
M. Marszalek, M. Wielopolski, J. Teuscher, Dr. J.-E. Moser, Dr. R. Humphry-Baker,
Dr. S. M. Zakeeruddin, Prof. M. Grätzel
Laboratory of Photonics and Interfaces, Institute of Chemical Sciences and Engineering,
Ecole Polytechnique Fédérale de Lausanne (EPFL), Station 6, CH-1015 Lausanne,
Switzerland, Email: [email protected], [email protected]
‡These authors contributed equally to this work.

Submitted to
2
Figure S1. Geometry optimized structures of the (a) neutral and (b) radical cationic species of
1 and 2 with the corresponding dihedral angles between each plain.
Figure S2: a) J-V curves of cells sensitized with dyes 1 and 2 using electrolyte E1 on 5 µm
TiO2 films. b) IPCE of the same devices.
a) b)
Submitted to
3
Figure S3. Influence of the concentration of Li+ in the electrolyte on the apparent electron
lifetime in TiO2 for cells sensitized with dye 2.
Figure S4. Differential absorption spectra obtained upon femtosecond flash photolysis (λexc =
530 nm) of films of 1 (a) and 2 (b) on 5 µm thick TiO2 with several time delays between 0
and 300 ps at room temperature illustrating the difference decay dynamics of the radical
cation signatures as stated in the text.
Related Documents