Significance of small strain damping and dilation parameters in numerical modeling of free-field lateral spreading centrifuge tests Camilo Phillips a,n , Youssef M.A. Hashash b , Scott M. Olson b , Mark R. Muszynski b a Ingetec, Carrera 6 No 30 A - 30, Bogota ´ D.C., Colombia b University of Illinois at Urbana Champaign, Civil and Environmental Engineering, 205 N Mathews Newmark Lab, Of 2220, Urbana, Illinois 61801, United States article info Article history: Received 7 September 2011 Received in revised form 12 May 2012 Accepted 3 June 2012 Available online 7 July 2012 abstract Lateral spreads are complex dynamic phenomena that are challenging to represent numerically. In this paper numerical models are developed and calibrated using the displacement, acceleration, and pore water pressure time histories recorded in a free-field lateral spreading centrifuge test. The calibrated numerical model then is used to predict another free-field lateral spreading centrifuge test using the same soil profile but different input acceleration time history. The computed response shows good agreement with the centrifuge test measurements. This paper demonstrates that even in a large strain problem, such as lateral spreading, small strain damping plays an important role in numerical simulation results; it also shows the need to have pressure dependent dilation parameters in the employed soil constitutive model implemented in order to simultaneously reproduce measurements of pore water pressure, acceleration and lateral displacement. & 2012 Elsevier Ltd. All rights reserved. 1. Introduction Lateral displacement of gently sloping ground triggered by seismic shaking—referred to as lateral spreading—can seriously damage lifelines, shoreline structures, and shallow and deep foundations. The design of such infrastructure requires not only predicting whether lateral spreads will occur for a given earthquake and soil conditions but also predicting the consequences of such an event. This involves quantifying lateral displacements and the generation of pore water pressures that result from the triggering of liquefaction. Many studies are available to evaluate triggering of lateral spreads and the resulting displacements, including empirical techniques, laboratory studies, centrifuge studies, and numerical techniques (Table 1). Several computational models to simulate lateral spreading have been developed in the last 15 years [7–9,38]. In these studies a number of parameters have been calibrated to represent the behavior of a soil experiencing lateral spreading. This paper presents the calibration of a soil constitu- tive model and the development of numerical analyses to repli- cate the key elements of behavior observed in centrifuge tests in terms of displacement, acceleration, and pore water pressure time histories. The calibration process highlights the importance of small-strain damping and the need for pressure-dependent dila- tion parameters to replicate accurately the measurements from free-field lateral spreading centrifuge test. The ability of the calibrated numerical model to reproduce the behavior of soils experiencing lateral spreading is evaluated using the same soil profile geometry and the input motion of a different centrifuge test. The second centrifuge test was performed as a part of the same overall project as described in the next section. 2. Centrifuge experiments of free field lateral spreading Two free-field lateral spreading centrifuge tests were con- structed and tested at the Rensselaer Polytechnic Institute (RPI) centrifuge facility in Troy, New York using a laminar box to allow for large unimpeded downslope soil displacements. The laminar box has internal dimensions of 71 cm long 35.5 cm in plan and a maximum of 26 cm of height (35.5 m 17.7 m 13 m in proto- type scale when spun at 50 g). The laminar box is inclined 21 to the horizontal using a stiff wedge at the base of the box. The soil slope is simulated by inclining the whole model 21 to replicate the boundary conditions of the centrifuge test. The soil profile consists of loose Nevada sand with a prototype thickness of 10 m underlain by 2 m of dense, lightly cemented sand (Fig. 1). The free-field lateral spreading centrifuge tests were performed as a part of an ongoing Network for Earthquake Engineering Simulation (NEES) research project. Instrumentation in these centrifuge models included pressure transducers and accelerometers to measure pore water pressure (PWP) and acceleration at numerous locations throughout the model, linear voltage differential transformers (LVDT) Contents lists available at SciVerse ScienceDirect journal homepage: www.elsevier.com/locate/soildyn Soil Dynamics and Earthquake Engineering 0267-7261/$ - see front matter & 2012 Elsevier Ltd. All rights reserved. http://dx.doi.org/10.1016/j.soildyn.2012.06.001 n Corresponding author. Tel.: þ57 (1) 3238250x245. E-mail address: [email protected] (C. Phillips). Soil Dynamics and Earthquake Engineering 42 (2012) 161–176

Welcome message from author
This document is posted to help you gain knowledge. Please leave a comment to let me know what you think about it! Share it to your friends and learn new things together.
Transcript
Soil Dynamics and Earthquake Engineering 42 (2012) 161–176
Contents lists available at SciVerse ScienceDirect
Soil Dynamics and Earthquake Engineering
0267-72
http://d
n Corr
E-m
journal homepage: www.elsevier.com/locate/soildyn
Significance of small strain damping and dilation parameters in numericalmodeling of free-field lateral spreading centrifuge tests
Camilo Phillips a,n, Youssef M.A. Hashash b, Scott M. Olson b, Mark R. Muszynskib
a Ingetec, Carrera 6 No 30 A - 30, Bogota D.C., Colombiab University of Illinois at Urbana Champaign, Civil and Environmental Engineering, 205 N Mathews Newmark Lab, Of 2220, Urbana, Illinois 61801, United States
a r t i c l e i n f o
Article history:
Received 7 September 2011
Received in revised form
12 May 2012
Accepted 3 June 2012Available online 7 July 2012
61/$ - see front matter & 2012 Elsevier Ltd. A
x.doi.org/10.1016/j.soildyn.2012.06.001
esponding author. Tel.: þ57 (1) 3238250x24
ail address: [email protected] (C
a b s t r a c t
Lateral spreads are complex dynamic phenomena that are challenging to represent numerically. In this
paper numerical models are developed and calibrated using the displacement, acceleration, and pore
water pressure time histories recorded in a free-field lateral spreading centrifuge test. The calibrated
numerical model then is used to predict another free-field lateral spreading centrifuge test using the
same soil profile but different input acceleration time history. The computed response shows good
agreement with the centrifuge test measurements. This paper demonstrates that even in a large strain
problem, such as lateral spreading, small strain damping plays an important role in numerical
simulation results; it also shows the need to have pressure dependent dilation parameters in the
employed soil constitutive model implemented in order to simultaneously reproduce measurements of
pore water pressure, acceleration and lateral displacement.
& 2012 Elsevier Ltd. All rights reserved.
1. Introduction
Lateral displacement of gently sloping ground triggered by seismicshaking—referred to as lateral spreading—can seriously damagelifelines, shoreline structures, and shallow and deep foundations.The design of such infrastructure requires not only predictingwhether lateral spreads will occur for a given earthquake and soilconditions but also predicting the consequences of such an event.This involves quantifying lateral displacements and the generation ofpore water pressures that result from the triggering of liquefaction.
Many studies are available to evaluate triggering of lateralspreads and the resulting displacements, including empiricaltechniques, laboratory studies, centrifuge studies, and numericaltechniques (Table 1). Several computational models to simulatelateral spreading have been developed in the last 15 years[7–9,38]. In these studies a number of parameters have beencalibrated to represent the behavior of a soil experiencing lateralspreading. This paper presents the calibration of a soil constitu-tive model and the development of numerical analyses to repli-cate the key elements of behavior observed in centrifuge tests interms of displacement, acceleration, and pore water pressure timehistories. The calibration process highlights the importance ofsmall-strain damping and the need for pressure-dependent dila-tion parameters to replicate accurately the measurements from
ll rights reserved.
5.
. Phillips).
free-field lateral spreading centrifuge test. The ability of thecalibrated numerical model to reproduce the behavior of soilsexperiencing lateral spreading is evaluated using the same soilprofile geometry and the input motion of a different centrifugetest. The second centrifuge test was performed as a part of thesame overall project as described in the next section.
2. Centrifuge experiments of free field lateral spreading
Two free-field lateral spreading centrifuge tests were con-structed and tested at the Rensselaer Polytechnic Institute (RPI)centrifuge facility in Troy, New York using a laminar box to allowfor large unimpeded downslope soil displacements. The laminarbox has internal dimensions of 71 cm long�35.5 cm in plan and amaximum of 26 cm of height (35.5 m�17.7 m�13 m in proto-type scale when spun at 50 g). The laminar box is inclined 21 tothe horizontal using a stiff wedge at the base of the box. The soilslope is simulated by inclining the whole model 21 to replicate theboundary conditions of the centrifuge test. The soil profileconsists of loose Nevada sand with a prototype thickness of10 m underlain by 2 m of dense, lightly cemented sand (Fig. 1).
The free-field lateral spreading centrifuge tests were performed asa part of an ongoing Network for Earthquake Engineering Simulation(NEES) research project. Instrumentation in these centrifuge modelsincluded pressure transducers and accelerometers to measure porewater pressure (PWP) and acceleration at numerous locationsthroughout the model, linear voltage differential transformers (LVDT)

C. Phillips et al. / Soil Dynamics and Earthquake Engineering 42 (2012) 161–176162
and lasers installed on the rings outside the laminar box to measurelateral displacement with depth, and subsurface sand grids andsurface tracking markers to measure lateral displacement at discretelocations and depths. Fig. 1 includes the instrument locations used inthe two centrifuge experiments discussed here.
The first free-field lateral spreading centrifuge experimentdescribed here (experiment I-02) was used to calibrate the soil-constitutive numerical model. This centrifuge test was subjected toa sinusoidal input acceleration motion with a prototype frequencyof 1 Hz and peak ground acceleration of 0.28 g (Fig. 2). The secondtest (experiment I-03) was used to evaluate the ability of thecalibrated model to compute the response of a similar modelsubject to a different input motion. The input motion applied at thebase of experiment I-03 had the same frequency (1 Hz) as inexperiment I-02 but lower peak ground acceleration (0.24 g)(Fig. 3). The two motions recorded at the cemented sand–loosesand interface are used as input motion in the numerical analysespresented in this paper, therefore, the cemented sand layer doesnot need to be included in the numerical model.
Fig. 2. Input acceleration time history applied at the base of experiment I-02.
3. Numerical simulation approachThe numerical simulations presented in this paper wereperformed using the finite element framework OpenSees [23].This numerical framework employs a two-phase fully-coupledfinite element formulation [29,40] based on Biot’s theory [3].In this framework, the saturated soil is modeled as a two-phasematerial implementing the u–p formulation [5] for two- andthree-dimensional analyses. In the u–p formulation, the displace-ment of the soil skeleton (u) and pore pressure (p) are the primaryunknowns. Although currently available soil finite elements in the
Table 1Brief list of recent lateral spreading studies.
Empirical techniques [42–44,11,1,32,25]
Laboratory studies [34,19,35,4]
Centrifuge studies [38,36,18]
Numerical techniques [15,6,2,8]
Fig. 1. Schematic centrifuge tests configuration and in
OpenSees framework do not implement a Total Langragian for-mulation to calculate large strains, the application to numericallysimulate lateral spreading problems has been successful as pre-sented by Yang [39], Elgamal et al. [8–10].
strument location. Dimensions in prototype scale.
Fig. 3. Input acceleration time history applied at the base of experiment I-03.

C. Phillips et al. / Soil Dynamics and Earthquake Engineering 42 (2012) 161–176 163
3.1. Description of the numerical model
Two different numerical models were developed to model thefree-field lateral spreading centrifuge tests; the first numericalmodel has 2680 nodes (each node with 4 degrees of freedom) and2133 BrickUP elements and models the behavior of the centrifugetest considering it as a fully 3D problem. The second modelassumed that the behavior of the centrifuge test can be modeledcorrectly assuming a shear beam behavior; 40 nodes and9 BrickUp elements were used in this model using a boundaryconditions of equal displacement constrains (x, y and z) for all thenodes located at the same depth. These two models providedalmost identical results for simulations of the free-field lateralspreading centrifuge tests, therefore, the shear beam model isused in this paper, Fig. 4, whereby a free field simulation iscompleted in 1 min or less compared to more than 4 h requiredfor the three dimensional model. In all simulations the inclinationof the box of 21 in prototype scale is modeled as proposed by Luet al. [13]. This assumption better represents the stress field andthe inertial conditions of the experiment than the alternativeproposed by Taboada [37] in which a 21 inclination in the smallscale centrifuge can be modeled as a 4–51 ground surfaceinclination in prototype scale.
3.2. Small strain (viscous) damping in dynamic simulations
For most soils, damping at small strain has a finite non-zerovalue. Fig. 5(a) presents the Menq [24] family of damping curvesfor sandy soils with the gradation and mechanical properties of
Fig. 4. Simplified one dimensional shear beam numerical model.
Fig. 5. Damping values for sands, (a) damping curves calculated for sands [24], (b) b
calculated viscous damping profile for Mississippi Embayment [28].
Nevada Sand at different confinement pressures. Small-straindamping values at these confinement pressures range from 0.9%to 2.6%. Fig. 5(b) presents damping ratios obtained by Kokushoet al. [16] for sandy soils by inverse analyses of vertical arrayrecords obtained during the 1995 Kobe earthquake at soft soilsites near the earthquake fault zone. These results exhibit thesame trend as the laboratory data in Fig. 5(a), although thedamping values are a few percent higher in the small strainrange. Fig. 5(c) presents the small-strain damping profileback-calculated by Park and Hashash [28] for the MississippiEmbayment. The back-calculated profile shows a decrease insmall-strain damping with depth, with small-strain dampingvalues of 3.5% for the upper 100 m. Given this information, arange of 1–4% small-strain damping was evaluated in the calibra-tion performed in this study.
Constitutive laws are nearly linear at small cyclic strainsresulting in negligible hysteretic damping at these strain levels,therefore viscous damping has to be added separately to simulatethe small-strain damping observed in soils from laboratory andfield studies (e.g., Fig. 5a). The damping predicted by the pressuredependent soil constitutive model implemented in Opensees [39]for small strains have been estimated using a single element test,obtaining a hysteretic damping of less than 0.04% for shear strainsranging between 0.01% and 0.02%, thus the need to introduceviscous damping (Rayleigh damping) in the numerical simulationin order to reproduce the energy dissipation for small strains.This issue was also reported for 1-D site response analyses[27,28,20,30]. The viscous damping formulation and selection isimportant even for higher levels of shakings and at large strains asthe error introduced by incorrect choice of viscous damping canbe large.
Most time-domain wave propagation codes include viscousdamping by implementing the original expression proposed byRayleigh and Lindsay [33] in which the damping matrix resultsfrom the addition of two matrices: one proportional to the massmatrix and the other proportional to the stiffness matrix asshown in the following equation:
C½ � ¼ a0 M½ �þa1 K½ � ð1Þ
where a0 and a1 are the scalar values selected to obtain givendamping values for two control frequencies. Viscous dampingcalculated using the Rayleigh and Lindsay [33] solution is fre-quency-dependent, a result that is inconsistent with most avail-able experimental data which indicate that material damping insoils is frequency-independent at very small strain levels withinthe seismic frequency band of 0.001–10 Hz [21].
Hudson et al. [12] and Park and Hashash [27] described theapplication of the full Rayleigh formulation in 2-D and 1-D siteresponse analysis respectively. For soil profiles with a constant
ack calculated damping curve for sands at four different sites [16] and (c) back-
Table 2Effective stress constitutive model parameters for Nevada Sand (Dr¼35–45%).
Variable Value Units
Mass density 1980 kg/m3
Ref. shear modulus 33,000 kPa
Ref. mean confinement 80 kPa
Confinement dependence coeff. 0.5 Dimensionless
Friction angle 31.4 deg.
Peak shear strain 10 %
Number of Yield surfaces 20 Dimensionless
Phase transformation angle 26.5 deg.
Contraction parameter, c1 0.11 Dimensionless
Dilation parameter 1, d1 0.30 Dimensionless
Dilation parameter 2, d2 1 Dimensionless
Liquefaction parameter (gy) 0.01 Dimensionless
Permeability coefficient 0.0033 m/s
C. Phillips et al. / Soil Dynamics and Earthquake Engineering 42 (2012) 161–176164
damping ratio, scalar values of a0 and a1 can be computed usingtwo significant natural modes i and j using the following equation:
xi
xj
" #¼
1
2
12pf i
2pf i
12pf j
2pf j
24
35 a0
a1
( )ð2Þ
where xi and xj are the damping ratios for the frequencies fi and fjof the system, respectively. For site response analysis the naturalfrequency of the selected mode is commonly calculated as [17]
f n ¼ 2n�1ð ÞVs
4Hð3Þ
where n is the mode number and fn is the natural frequency of thecorresponding mode, Vs is the average shear wave velocity of thesoil profile, and H is the total thickness of the soil column.
It is common practice to choose frequencies that correspond tothe first mode of the soil column and a higher mode thatcorresponds to the predominant frequency of the input motion.Kwok et al. [20] recommended a value equal to five times thenatural frequency. Park and Hashash [27] also provide recom-mendations to estimate these two frequencies. Equal values ofmodal damping ratios are specified at each of the two modes. Incontrast, Phillips and Hashash [30] proposed a frequency-inde-pendent solution using rational indices instead of integers tocalculate the viscous damping matrix [C]. The construction of afrequency-independent viscous damping matrix has only beenfully implemented for 1D site response analyses of level ground.The frequency independent viscous damping solution is compu-tationally expensive for 3D analyses, and has not been imple-mented in the OpenSees finite element framework and thereforemass matrix and initial stiffness matrix proportional Rayleighdamping is used in the analysis presented in this paper.
3.3. Constitutive modeling of soil behavior
The behavior of soils experiencing lateral spreading wasmodeled using the pressure-dependent soil constitutive modelproposed by Parra [29], Yang [39], Yang and Elgamal [40].The term pressure-dependent for this soil constitutive modelrefers to the change of the shear strength and stiffness with meaneffective stress in contrast to the overburden pressure-dependentsmall-strain damping described above. For clarity, we refer to theconstitutive model as an effective stress constitutive model.This effective stress constitutive model is developed based onthe original framework proposed by Prevost [31] and focuses onsimulating the liquefaction-induced shear strain accumulationmechanism [40,10] and the deviatoric-volumetric strain coupling,i.e., dilatancy, during cyclic loading. The main parameters of themodel include standard dynamic soil properties such as small-strain shear modulus and friction angle, as well as parameters tocontrol dilatancy (i.e., phase transformation angle, contractionparameter c1, and dilation parameters d1 and d2) and the para-meters controlling liquefaction-induced, perfectly-plastic shearstrain accumulation. The properties used for the effective stressconstitutive model are presented in Table 2. The numericalmodels developed for this paper use the values of friction angle,permeability and G0 determined for Nevada Sand as a part of theexperiments developed in the Verification of Liquefaction Analy-sis by Centrifuge Studies (VELACS) geotechnical investigationprogram and the value of phase transformation angle suggestedby Elgamal et al. [9] for Nevada sand with relative density (Dr)between 35% and 45% (which are close to the Dr values of 30–40%used in the centrifuge experiments). The other soil constitutiveparameters such as dilation parameters, number of yield surfaces,reference confinement pressure and peak shear strain have beenestimated following the recommendations presented in Elgamal
[9] for cohesionless soils with relative density between 35%and 45%.
As presented in Yang et al. [41], dilation parameter c1 is used inthe numerical model to represent the observation whereby the rateof contraction is dependent on the preceding dilation phase [26].Thus a higher value of dilation parameter c1 induces a highercontraction rate after a dilation phase. Dilation parameters d1 andd2 define the dilation tendency that increases with the accumula-tion of shear strain, a phenomenon that has been experimentallyobserved by Kabilamany and Ishihara [14]. Higher values ofdilation parameters d1 and d2 will induce a more pronounceddilation phase as shear strain is accumulated.
The permeability used in the simulations corresponds to thescaled value for a centrifuge test at 50 g using Nevada sand withwater as the pore fluid; in prototype scale the permeability isequal to 50 times the permeability of Nevada Sand measured inlaboratory tests.
3.4. Model calibration procedure
Two different sets of calibration analyses were performed toimprove the simulation of lateral spreading under free-fieldconditions using the measurements of experiment I-02. The firstcalibration focused on defining viscous damping in the numericalsimulation. The second calibration focused on defining the con-stitutive parameters required to define the yield function and thehardening and flow rules (contraction parameter c1 and dilationparameters d1 and d2). The second calibration did not includechanging the soil friction and phase transformation angle, itsdensity and its maximum shear modulus because these para-meters have been estimated using the results of laboratory test ornumerical back-calculations for Nevada Sand with the samerelative density as the one used in the centrifuge experiments.
4. Viscous damping calibration
In the viscous damping calibration exercise, the soil constitu-tive parameters listed in Table 2 were employed. In the first stageof calibration, the viscous damping target value was selected,while in the second stage, we evaluated the effect of varying thecontrol frequencies fi and fj.
4.1. Variation of the viscous damping target value for constant
control frequencies
Fig. 6 shows a schematic of the soil profile geometry and thefrequency dependent damping ratio for target values equal to 1%,

C. Phillips et al. / Soil Dynamics and Earthquake Engineering 42 (2012) 161–176 165
2%, 3% and 4% computed using Eq. (5). The control frequenciesfi and fj correspond to the natural frequency of the soil profile[Vs/4H¼2.5 Hz, assuming an average shear wave velocity (Vs) of100 m/s] and five times the natural frequency (12.5 Hz) respec-tively as recommended by Kwok et al. [20]. The selection offrequencies for Rayleigh Damping is model dependent, but motionindependent and is based on the work of Kwok et al [20]. If theinitial natural frequency of the model changes then the selectedfrequencies used in the numerical simulations have to be changedas suggested in Kwok et al. [20].
Fig. 7. Comparison of boundary displacements for numerical simulations and centrifug
1.25m, (c) Depth: 4.30m, (d) Depth: 5.70m, and (e) Depth: 7.50m.
Fig. 6. Wave propagation on saturated 2 degree sloping sand deposit (a) soil
profile geometry and (b) damping variation.
Fig. 7 compares the computed boundary lateral displacements(displacements measured at the laminar box rings) and thecorresponding centrifuge test measurements. Numerically-simu-lated permanent surface displacements differed by nearly 40%using 1% and 4% viscous damping values (4.16 m and 3.00 m,respectively). Higher viscous damping values result in greaterenergy dissipation and smaller lateral displacements. The impactof the viscous damping ratio on lateral displacements decreaseswith increasing depth. For example, at a depth of �7.5 m thedisplacement time histories calculated for different viscousdamping levels differ only slightly (Fig. 7e), and the simulateddisplacements at this depth systematically under-predict thelateral displacement measured in the centrifuge test.
The concordance correlation coefficient (CCC) proposed by Lin[22] is used to evaluate the agreement between the numericalsimulations and the centrifuge test measurements. The CCCcharacterizes the degree of concordance between computed andtarget and is scaled to range from �1 to 1, where 1 is perfectagreement between the two datasets, �1 is perfect reverseagreement, and zero is no agreement. The CCC is estimated usingthe mean (Yj), variance (Sj
2), and covariance (Sij2) of the measured
and computed time histories as follows:
CCC¼2S12
S21þS2
2þðY1�Y2Þ2
ð4Þ
where
Yj ¼1
n
Xn
i ¼ 1
Yij
S2j ¼
1
n
Xn
i ¼ 1
Yij�Yj
� �2,j¼ 1,2
e experiment I-02 using different viscous damping values. (a) Surface, (b) Depth:
C. Phillips et al. / Soil Dynamics and Earthquake Engineering 42 (2012) 161–176166
S12 ¼1
n
Xn
i ¼ 1
Yi1�Y1ð Þ Yi2�Y2ð Þ ð5Þ
Table 3 presents the CCC values for the lateral displacementtime histories at different depths. Based on these results thenumerical model with 3% viscous damping provides the bestoverall match for the lateral boundary displacements measured inexperiment I-02.
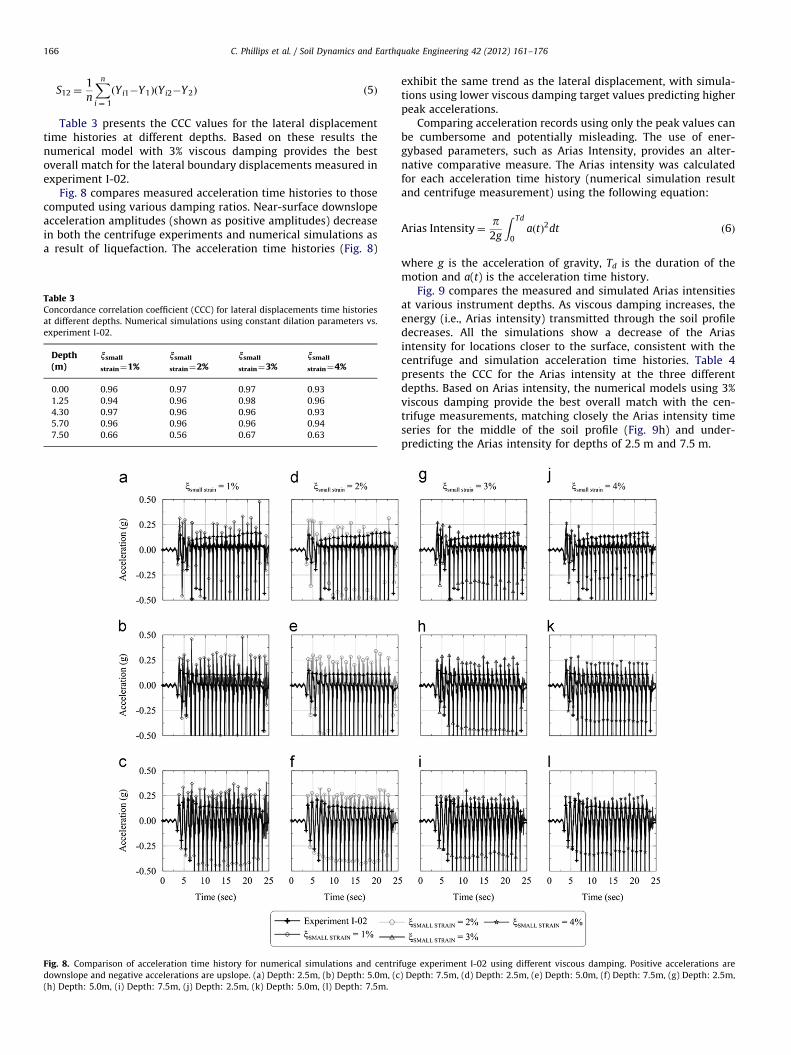
Fig. 8 compares measured acceleration time histories to thosecomputed using various damping ratios. Near-surface downslopeacceleration amplitudes (shown as positive amplitudes) decreasein both the centrifuge experiments and numerical simulations asa result of liquefaction. The acceleration time histories (Fig. 8)
Table 3Concordance correlation coefficient (CCC) for lateral displacements time histories
at different depths. Numerical simulations using constant dilation parameters vs.
experiment I-02.
Depth(m)
nsmall
strain¼1%nsmall
strain¼2%nsmall
strain¼3%nsmall
strain¼4%
0.00 0.96 0.97 0.97 0.93
1.25 0.94 0.96 0.98 0.96
4.30 0.97 0.96 0.96 0.93
5.70 0.96 0.96 0.96 0.94
7.50 0.66 0.56 0.67 0.63
Fig. 8. Comparison of acceleration time history for numerical simulations and centri
downslope and negative accelerations are upslope. (a) Depth: 2.5m, (b) Depth: 5.0m, (c
(h) Depth: 5.0m, (i) Depth: 7.5m, (j) Depth: 2.5m, (k) Depth: 5.0m, (l) Depth: 7.5m.
exhibit the same trend as the lateral displacement, with simula-tions using lower viscous damping target values predicting higherpeak accelerations.
Comparing acceleration records using only the peak values canbe cumbersome and potentially misleading. The use of ener-gybased parameters, such as Arias Intensity, provides an alter-native comparative measure. The Arias intensity was calculatedfor each acceleration time history (numerical simulation resultand centrifuge measurement) using the following equation:
Arias Intensity¼p2g
Z Td
0aðtÞ2dt ð6Þ
where g is the acceleration of gravity, Td is the duration of themotion and a(t) is the acceleration time history.
Fig. 9 compares the measured and simulated Arias intensitiesat various instrument depths. As viscous damping increases, theenergy (i.e., Arias intensity) transmitted through the soil profiledecreases. All the simulations show a decrease of the Ariasintensity for locations closer to the surface, consistent with thecentrifuge and simulation acceleration time histories. Table 4presents the CCC for the Arias intensity at the three differentdepths. Based on Arias intensity, the numerical models using 3%viscous damping provide the best overall match with the cen-trifuge measurements, matching closely the Arias intensity timeseries for the middle of the soil profile (Fig. 9h) and under-predicting the Arias intensity for depths of 2.5 m and 7.5 m.
fuge experiment I-02 using different viscous damping. Positive accelerations are
) Depth: 7.5m, (d) Depth: 2.5m, (e) Depth: 5.0m, (f) Depth: 7.5m, (g) Depth: 2.5m,

Fig. 9. Comparison of Arias Intensity time history for numerical simulations and centrifuge experiment I-02 using different viscous damping. (a) Depth: 2.5m, (b) Depth: 5.0m,
(c) Depth: 7.5m, (d) Depth: 2.5m, (e) Depth: 5.0m, (f) Depth: 7.5m, (g) Depth: 2.5m, (h) Depth: 5.0m, (i) Depth: 7.5m, (j) Depth: 2.5m, (k) Depth: 5.0m, (l) Depth: 7.5m.
Table 4Concordance correlation coefficient (CCC) for Arias intensity time histories at
different depths. Numerical simulations using constant dilation parameters vs.
experiment I-02.
Depth(m)
xsmall
strain¼1%xsmall
strain¼2%xsmall
strain¼3%xsmall
strain¼4%
2.50 0.77 0.88 0.90 0.83
5.00 0.75 0.87 0.99 0.99
7.50 0.98 1.00 0.97 0.96
C. Phillips et al. / Soil Dynamics and Earthquake Engineering 42 (2012) 161–176 167
Fig. 10 compares measured and simulated pore water pressuretime histories. The large downward spikes correspond to soildilation during each cycle. In the simulations, the size of thedownward spikes decreases as the viscous damping increases.Numerical models with 2% and 3% damping ratios reproducebetter the size of the downward spikes compared with thecentrifuge test measurements at the three different depths.Considering all centrifuge test measurements, 3% viscous dampingprovides the closest response to that measured in experimentI-02.
4.2. Variation of the control frequencies for constant viscous
damping value
A second set of simulations were conducted to evaluate controlfrequency selection on the computed response using the best-fit
target viscous damping equal to 3%. Frequency fi was set equal tothe natural frequency of the soil column (2.5 Hz), and fj was setequal to three, five or eight times the natural frequency of the soilcolumn (7.5 Hz, 12.5 Hz and 20.0 Hz respectively). Fig. 11 is aschematic of the soil profile geometry and the frequency depen-dent damping ratios for the different combinations of fi and fj.
Fig. 12 compares the lateral displacements measured incentrifuge experiment I-02 and the simulations. Only slightdifferences are observed for the three different combinations ofcontrol frequencies. Similarly, only slight differences wereobserved for acceleration and pore water pressure time histories(not shown). Arias intensity (Fig. 13) is higher for the case withfj¼20 Hz, which is due to the lower viscous damping at the highfrequencies.
This set of analyses show that although changing the controlfrequencies generates slight changes in the overall response of thesoil profile, the selection of the control frequencies is not assignificant as the selection of the viscous damping target value. Inthe following analyses, the control frequencies fi and fj were set equalto the natural frequency of the soil profile and five times the naturalfrequency, respectively, as recommended by Kwok et al. [20].
5. Soil constitutive model parameter with viscous dampingcalibration
The simulations described above showed that constant dila-tion parameters reasonably matched the measured soil response
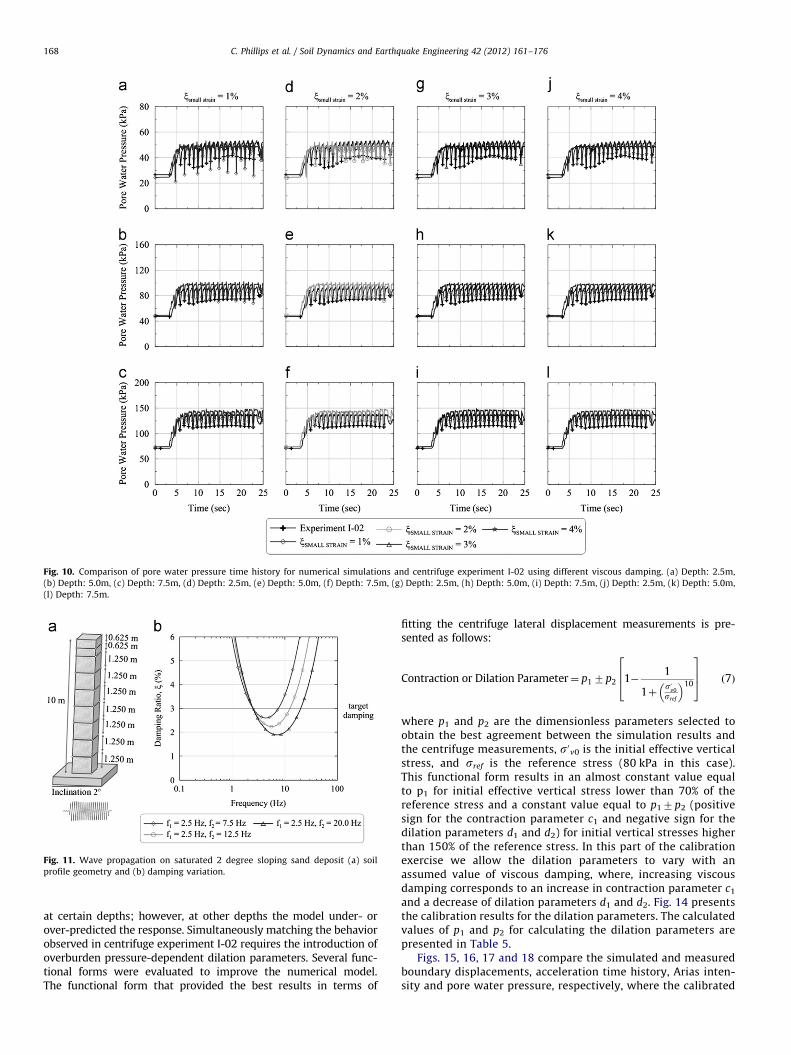
Fig. 10. Comparison of pore water pressure time history for numerical simulations and centrifuge experiment I-02 using different viscous damping. (a) Depth: 2.5m,
(b) Depth: 5.0m, (c) Depth: 7.5m, (d) Depth: 2.5m, (e) Depth: 5.0m, (f) Depth: 7.5m, (g) Depth: 2.5m, (h) Depth: 5.0m, (i) Depth: 7.5m, (j) Depth: 2.5m, (k) Depth: 5.0m,
(l) Depth: 7.5m.
Fig. 11. Wave propagation on saturated 2 degree sloping sand deposit (a) soil
profile geometry and (b) damping variation.
C. Phillips et al. / Soil Dynamics and Earthquake Engineering 42 (2012) 161–176168
at certain depths; however, at other depths the model under- orover-predicted the response. Simultaneously matching the behaviorobserved in centrifuge experiment I-02 requires the introduction ofoverburden pressure-dependent dilation parameters. Several func-tional forms were evaluated to improve the numerical model.The functional form that provided the best results in terms of
fitting the centrifuge lateral displacement measurements is pre-sented as follows:
Contraction or Dilation Parameter¼ p17p2 1�1
1þs0
v0sref
� �10
264
375 ð7Þ
where p1 and p2 are the dimensionless parameters selected toobtain the best agreement between the simulation results andthe centrifuge measurements, s0v0 is the initial effective verticalstress, and sref is the reference stress (80 kPa in this case).This functional form results in an almost constant value equalto p1 for initial effective vertical stress lower than 70% of thereference stress and a constant value equal to p17p2 (positivesign for the contraction parameter c1 and negative sign for thedilation parameters d1 and d2) for initial vertical stresses higherthan 150% of the reference stress. In this part of the calibrationexercise we allow the dilation parameters to vary with anassumed value of viscous damping, where, increasing viscousdamping corresponds to an increase in contraction parameter c1
and a decrease of dilation parameters d1 and d2. Fig. 14 presentsthe calibration results for the dilation parameters. The calculatedvalues of p1 and p2 for calculating the dilation parameters arepresented in Table 5.
Figs. 15, 16, 17 and 18 compare the simulated and measuredboundary displacements, acceleration time history, Arias inten-sity and pore water pressure, respectively, where the calibrated
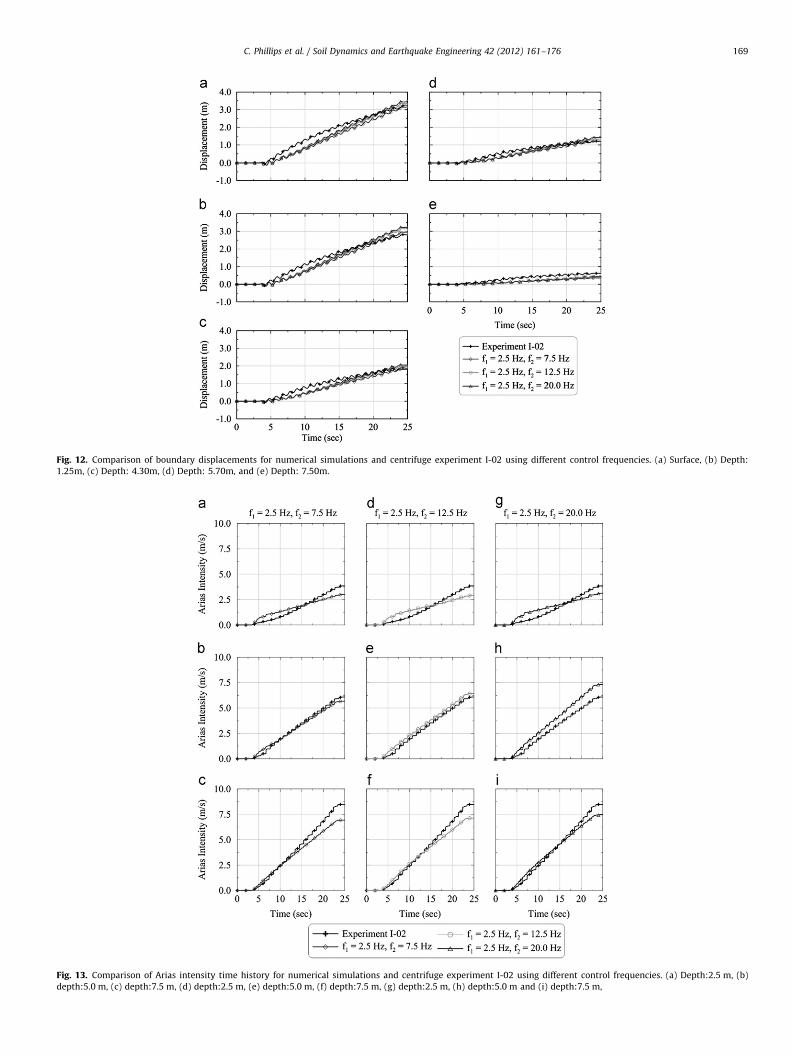
Fig. 12. Comparison of boundary displacements for numerical simulations and centrifuge experiment I-02 using different control frequencies. (a) Surface, (b) Depth:
1.25m, (c) Depth: 4.30m, (d) Depth: 5.70m, and (e) Depth: 7.50m.
Fig. 13. Comparison of Arias intensity time history for numerical simulations and centrifuge experiment I-02 using different control frequencies. (a) Depth:2.5 m, (b)
depth:5.0 m, (c) depth:7.5 m, (d) depth:2.5 m, (e) depth:5.0 m, (f) depth:7.5 m, (g) depth:2.5 m, (h) depth:5.0 m and (i) depth:7.5 m,
C. Phillips et al. / Soil Dynamics and Earthquake Engineering 42 (2012) 161–176 169
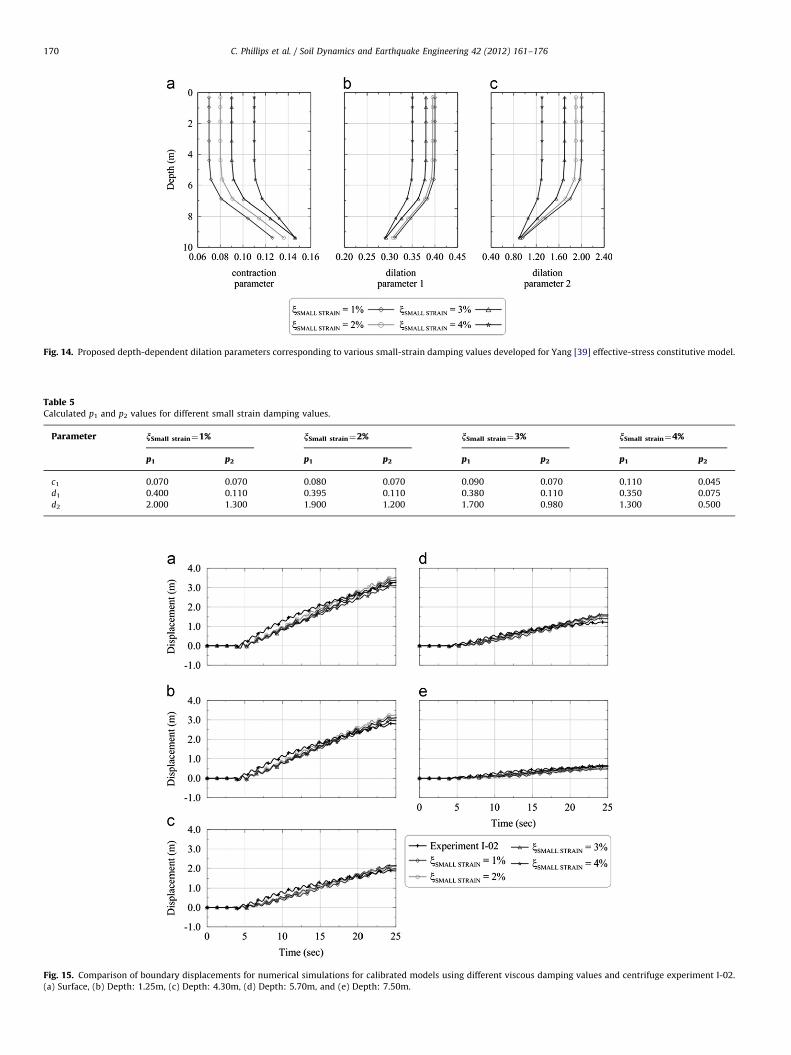
Fig. 14. Proposed depth-dependent dilation parameters corresponding to various small-strain damping values developed for Yang [39] effective-stress constitutive model.
Table 5Calculated p1 and p2 values for different small strain damping values.
Parameter nSmall strain¼1% nSmall strain¼2% nSmall strain¼3% nSmall strain¼4%
p1 p2 p1 p2 p1 p2 p1 p2
c1 0.070 0.070 0.080 0.070 0.090 0.070 0.110 0.045
d1 0.400 0.110 0.395 0.110 0.380 0.110 0.350 0.075
d2 2.000 1.300 1.900 1.200 1.700 0.980 1.300 0.500
Fig. 15. Comparison of boundary displacements for numerical simulations for calibrated models using different viscous damping values and centrifuge experiment I-02.
(a) Surface, (b) Depth: 1.25m, (c) Depth: 4.30m, (d) Depth: 5.70m, and (e) Depth: 7.50m.
C. Phillips et al. / Soil Dynamics and Earthquake Engineering 42 (2012) 161–176170
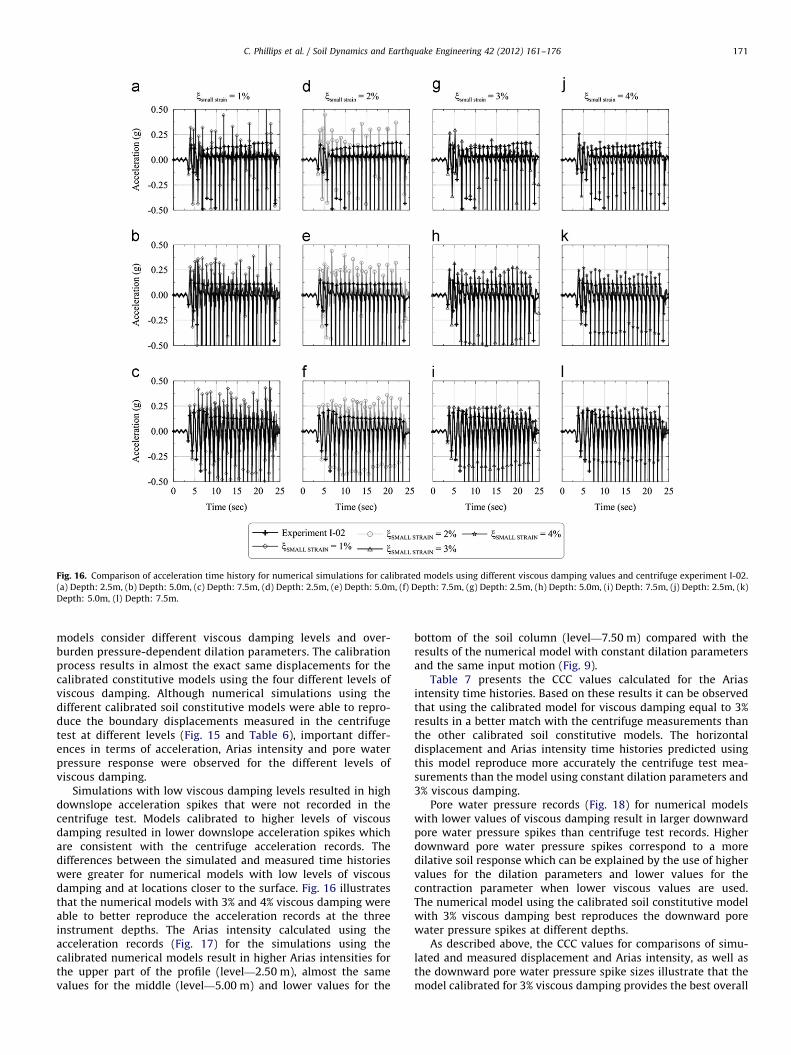
Fig. 16. Comparison of acceleration time history for numerical simulations for calibrated models using different viscous damping values and centrifuge experiment I-02.
(a) Depth: 2.5m, (b) Depth: 5.0m, (c) Depth: 7.5m, (d) Depth: 2.5m, (e) Depth: 5.0m, (f) Depth: 7.5m, (g) Depth: 2.5m, (h) Depth: 5.0m, (i) Depth: 7.5m, (j) Depth: 2.5m, (k)
Depth: 5.0m, (l) Depth: 7.5m.
C. Phillips et al. / Soil Dynamics and Earthquake Engineering 42 (2012) 161–176 171
models consider different viscous damping levels and over-burden pressure-dependent dilation parameters. The calibrationprocess results in almost the exact same displacements for thecalibrated constitutive models using the four different levels ofviscous damping. Although numerical simulations using thedifferent calibrated soil constitutive models were able to repro-duce the boundary displacements measured in the centrifugetest at different levels (Fig. 15 and Table 6), important differ-ences in terms of acceleration, Arias intensity and pore waterpressure response were observed for the different levels ofviscous damping.
Simulations with low viscous damping levels resulted in highdownslope acceleration spikes that were not recorded in thecentrifuge test. Models calibrated to higher levels of viscousdamping resulted in lower downslope acceleration spikes whichare consistent with the centrifuge acceleration records. Thedifferences between the simulated and measured time historieswere greater for numerical models with low levels of viscousdamping and at locations closer to the surface. Fig. 16 illustratesthat the numerical models with 3% and 4% viscous damping wereable to better reproduce the acceleration records at the threeinstrument depths. The Arias intensity calculated using theacceleration records (Fig. 17) for the simulations using thecalibrated numerical models result in higher Arias intensities forthe upper part of the profile (level—2.50 m), almost the samevalues for the middle (level—5.00 m) and lower values for the
bottom of the soil column (level—7.50 m) compared with theresults of the numerical model with constant dilation parametersand the same input motion (Fig. 9).
Table 7 presents the CCC values calculated for the Ariasintensity time histories. Based on these results it can be observedthat using the calibrated model for viscous damping equal to 3%results in a better match with the centrifuge measurements thanthe other calibrated soil constitutive models. The horizontaldisplacement and Arias intensity time histories predicted usingthis model reproduce more accurately the centrifuge test mea-surements than the model using constant dilation parameters and3% viscous damping.
Pore water pressure records (Fig. 18) for numerical modelswith lower values of viscous damping result in larger downwardpore water pressure spikes than centrifuge test records. Higherdownward pore water pressure spikes correspond to a moredilative soil response which can be explained by the use of highervalues for the dilation parameters and lower values for thecontraction parameter when lower viscous values are used.The numerical model using the calibrated soil constitutive modelwith 3% viscous damping best reproduces the downward porewater pressure spikes at different depths.
As described above, the CCC values for comparisons of simu-lated and measured displacement and Arias intensity, as well asthe downward pore water pressure spike sizes illustrate that themodel calibrated for 3% viscous damping provides the best overall

Fig. 17. Comparison of Arias intensity time history for numerical simulations for calibrated models using different viscous damping values and centrifuge experiment I-02.
(a) Depth: 2.5m, (b) Depth: 5.0m, (c) Depth: 7.5m, (d) Depth: 2.5m, (e) Depth: 5.0m, (f) Depth: 7.5m, (g) Depth: 2.5m, (h) Depth: 5.0m, (i) Depth: 7.5m, (j) Depth: 2.5m,
(k) Depth: 5.0m, (l) Depth: 7.5m.
C. Phillips et al. / Soil Dynamics and Earthquake Engineering 42 (2012) 161–176172
fit to the centrifuge results. Although a 3% viscous damping valueis greater than the maximum limit computed by the family ofcurves proposed by Menq [24] for a soil with mechanical andgradation properties similar to Nevada Sand (Fig. 5a), the value isconsistent with the viscous damping back-calculated by Kokushoet al. [16] and Park and Hashash [28] (Fig. 5b and c respectively),for sandy soils at depths less than 10 m.
6. Computed response of centrifuge lateral spreading testwith a different input motion
A numerical simulation of experiment I-03 was conducted usingthe model calibrated with experiment I-02. The input motion forexperiment I-03 had a lower acceleration than I-02. Figs. 19 and 20compare the simulated and measured lateral displacement, accel-eration, Arias intensity, and pore water pressure time histories.
The CCC statistic was calculated to determine the predictionquality for lateral displacements at different depths; these CCCvalues are present in Table 8. High CCC values were obtained fordisplacements predicted at the surface, and depths of 1.25 m,2.50 m and 5.70 m. The CCC values for a depth of 7.50 m wereconsiderably lower, as the numerical simulation systematicallyunder-predicted the displacement at a depth of 7.50 m. Never-theless, we consider the computed response to have satisfactorilycaptured the salient aspects of the soil response during lateralspreading.
Computed upslope and downslope peak accelerations valuesare in good agreement with measurements for the three differentdepths presented in Fig. 20. The Arias intensity showed goodagreement at the upper and lower locations (Fig. 20d and f).However, the calibrated model under-predicted Arias intensity inthe middle of the soil deposit (Fig. 20e). Table 9 presents the CCCvalues calculated for the Arias intensities at the three differentdepths. These CCC values demonstrate that the model is able topredict reasonably well the energy content of the accelerationstime histories for the three different depths.
Although the overall prediction of the numerical simulationclosely replicated the centrifuge measurements, important differ-ences were observed for the pore water pressure time historiesat a depth of 2.5 m (Fig. 20g). This difference was observed evenunder static conditions prior to shaking. This ‘‘offset’’ likelyresulted from the placement depth of the pressure transducer inthe centrifuge experiment being slightly different than reported,settlement of the pressure transducers within the loose sandstratum during spin up, or from a lower phreatic level. The phreaticlevel may change slightly during spin up in the centrifuge testsas the rubber membrane (used to prevent water leakage) con-forms more closely to the corners of the laminar container. Thisconformance results in a slight curvature of the water surface dueto the relatively small radius of the centrifuge (2.8 m). Unfortu-nately, the exact water level in the centrifuge test cannotbe accurately measured in-flight. Regardless of the source ofthe ‘‘offset’’ between the measured and simulated pore water

Fig. 18. Comparison of pore water pressure time history for numerical simulations for calibrated models using different viscous damping values and centrifuge
experiment I-02. (a) Depth: 2.5m, (b) Depth: 5.0m, (c) Depth: 7.5m, (d) Depth: 2.5m, (e) Depth: 5.0m, (f) Depth: 7.5m, (g) Depth: 2.5m, (h) Depth: 5.0m, (i) Depth: 7.5m, (j)
Depth: 2.5m, (k) Depth: 5.0m, (l) Depth: 7.5m.
Table 6Concordance correlation coefficient (CCC) for lateral displacements time histories at different depths. Numerical simulations using
calibrated dilation parameters vs. experiment I-02.
Depth (m) nsmall strain¼1% nsmall strain¼2% nsmall strain¼3% nsmall strain¼4%
0.00 0.98 0.98 0.97 0.96
1.25 0.98 0.98 0.98 0.98
4.30 0.95 0.97 0.97 0.98
5.70 0.95 0.96 0.96 0.95
7.50 0.80 0.82 0.90 0.95
Table 7Concordance correlation coefficient (CCC) for Arias intensity time histories at different depths. Numerical simulations using
calibrated dilation parameters vs. experiment I-02.
Depth (m) nsmall strain¼1% nsmall strain¼2% nsmall strain¼3% nsmall strain¼4%
2.50 0.51 0.72 0.94 0.78
5.00 0.76 0.85 0.99 0.96
7.50 0.98 0.99 0.97 0.90
C. Phillips et al. / Soil Dynamics and Earthquake Engineering 42 (2012) 161–176 173
pressures, the downward pore water pressure spikes predicted bythe simulation were in phase throughout shaking and have nearlythe same minimum values as the measured pore water pressurerecords at each depth.
7. Conclusions
A soil constitutive model including viscous damping wascalibrated using the displacement, acceleration, and pore water

Fig. 19. Comparison of boundary displacements for numerical simulations for calibrated models using 3% viscous damping values and centrifuge experiment I-03. (a)
Surface, (b) Depth: 1.25m, (c) Depth: 4.30m, (d) Depth: 5.70m, and (e) Depth: 7.50m.
Fig. 20. Comparison of acceleration, Arias intensity and pore water pressure time histories for numerical simulations for calibrated models using 3% viscous damping
values and centrifuge experiment I-03. (a) Depth: 2.5m, (b) Depth: 5.0m, (c) Depth: 7.5m, (d) Depth: 2.5m, (e) Depth: 5.0m, (f) Depth: 7.5m, (g) Depth: 2.5m, (h) Depth:
5.0m, (i) Depth: 7.5m.
C. Phillips et al. / Soil Dynamics and Earthquake Engineering 42 (2012) 161–176174
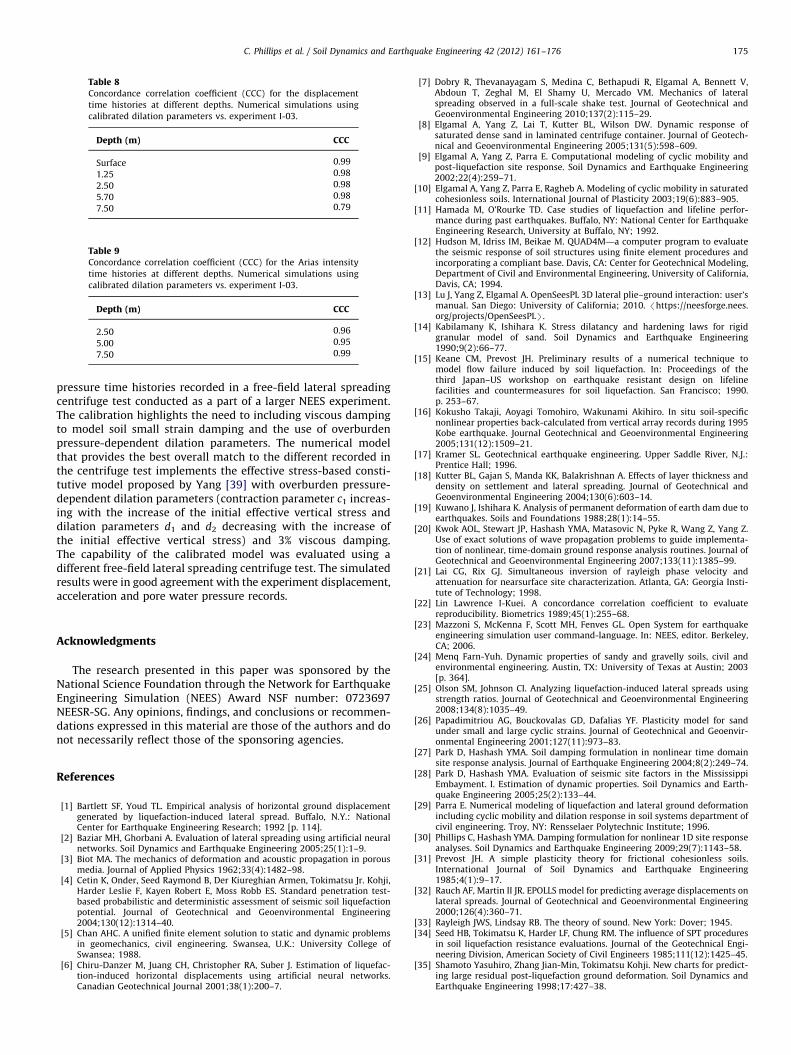
Table 8Concordance correlation coefficient (CCC) for the displacement
time histories at different depths. Numerical simulations using
calibrated dilation parameters vs. experiment I-03.
Depth (m) CCC
Surface 0.99
1.25 0.98
2.50 0.98
5.70 0.98
7.50 0.79
Table 9Concordance correlation coefficient (CCC) for the Arias intensity
time histories at different depths. Numerical simulations using
calibrated dilation parameters vs. experiment I-03.
Depth (m) CCC
2.50 0.96
5.00 0.95
7.50 0.99
C. Phillips et al. / Soil Dynamics and Earthquake Engineering 42 (2012) 161–176 175
pressure time histories recorded in a free-field lateral spreadingcentrifuge test conducted as a part of a larger NEES experiment.The calibration highlights the need to including viscous dampingto model soil small strain damping and the use of overburdenpressure-dependent dilation parameters. The numerical modelthat provides the best overall match to the different recorded inthe centrifuge test implements the effective stress-based consti-tutive model proposed by Yang [39] with overburden pressure-dependent dilation parameters (contraction parameter c1 increas-ing with the increase of the initial effective vertical stress anddilation parameters d1 and d2 decreasing with the increase ofthe initial effective vertical stress) and 3% viscous damping.The capability of the calibrated model was evaluated using adifferent free-field lateral spreading centrifuge test. The simulatedresults were in good agreement with the experiment displacement,acceleration and pore water pressure records.
Acknowledgments
The research presented in this paper was sponsored by theNational Science Foundation through the Network for EarthquakeEngineering Simulation (NEES) Award NSF number: 0723697NEESR-SG. Any opinions, findings, and conclusions or recommen-dations expressed in this material are those of the authors and donot necessarily reflect those of the sponsoring agencies.
References
[1] Bartlett SF, Youd TL. Empirical analysis of horizontal ground displacementgenerated by liquefaction-induced lateral spread. Buffalo, N.Y.: NationalCenter for Earthquake Engineering Research; 1992 [p. 114].
[2] Baziar MH, Ghorbani A. Evaluation of lateral spreading using artificial neuralnetworks. Soil Dynamics and Earthquake Engineering 2005;25(1):1–9.
[3] Biot MA. The mechanics of deformation and acoustic propagation in porousmedia. Journal of Applied Physics 1962;33(4):1482–98.
[4] Cetin K, Onder, Seed Raymond B, Der Kiureghian Armen, Tokimatsu Jr. Kohji,Harder Leslie F, Kayen Robert E, Moss Robb ES. Standard penetration test-based probabilistic and deterministic assessment of seismic soil liquefactionpotential. Journal of Geotechnical and Geoenvironmental Engineering2004;130(12):1314–40.
[5] Chan AHC. A unified finite element solution to static and dynamic problemsin geomechanics, civil engineering. Swansea, U.K.: University College ofSwansea; 1988.
[6] Chiru-Danzer M, Juang CH, Christopher RA, Suber J. Estimation of liquefac-tion-induced horizontal displacements using artificial neural networks.Canadian Geotechnical Journal 2001;38(1):200–7.
[7] Dobry R, Thevanayagam S, Medina C, Bethapudi R, Elgamal A, Bennett V,Abdoun T, Zeghal M, El Shamy U, Mercado VM. Mechanics of lateralspreading observed in a full-scale shake test. Journal of Geotechnical andGeoenvironmental Engineering 2010;137(2):115–29.
[8] Elgamal A, Yang Z, Lai T, Kutter BL, Wilson DW. Dynamic response ofsaturated dense sand in laminated centrifuge container. Journal of Geotech-nical and Geoenvironmental Engineering 2005;131(5):598–609.
[9] Elgamal A, Yang Z, Parra E. Computational modeling of cyclic mobility andpost-liquefaction site response. Soil Dynamics and Earthquake Engineering2002;22(4):259–71.
[10] Elgamal A, Yang Z, Parra E, Ragheb A. Modeling of cyclic mobility in saturatedcohesionless soils. International Journal of Plasticity 2003;19(6):883–905.
[11] Hamada M, O’Rourke TD. Case studies of liquefaction and lifeline perfor-mance during past earthquakes. Buffalo, NY: National Center for EarthquakeEngineering Research, University at Buffalo, NY; 1992.
[12] Hudson M, Idriss IM, Beikae M. QUAD4M—a computer program to evaluatethe seismic response of soil structures using finite element procedures andincorporating a compliant base. Davis, CA: Center for Geotechnical Modeling,Department of Civil and Environmental Engineering, University of California,Davis, CA; 1994.
[13] Lu J, Yang Z, Elgamal A. OpenSeesPL 3D lateral plie–ground interaction: user’smanual. San Diego: University of California; 2010. /https://neesforge.nees.org/projects/OpenSeesPLS.
[14] Kabilamany K, Ishihara K. Stress dilatancy and hardening laws for rigidgranular model of sand. Soil Dynamics and Earthquake Engineering1990;9(2):66–77.
[15] Keane CM, Prevost JH. Preliminary results of a numerical technique tomodel flow failure induced by soil liquefaction. In: Proceedings of thethird Japan–US workshop on earthquake resistant design on lifelinefacilities and countermeasures for soil liquefaction. San Francisco; 1990.p. 253–67.
[16] Kokusho Takaji, Aoyagi Tomohiro, Wakunami Akihiro. In situ soil-specificnonlinear properties back-calculated from vertical array records during 1995Kobe earthquake. Journal Geotechnical and Geoenvironmental Engineering2005;131(12):1509–21.
[17] Kramer SL. Geotechnical earthquake engineering. Upper Saddle River, N.J.:Prentice Hall; 1996.
[18] Kutter BL, Gajan S, Manda KK, Balakrishnan A. Effects of layer thickness anddensity on settlement and lateral spreading. Journal of Geotechnical andGeoenvironmental Engineering 2004;130(6):603–14.
[19] Kuwano J, Ishihara K. Analysis of permanent deformation of earth dam due toearthquakes. Soils and Foundations 1988;28(1):14–55.
[20] Kwok AOL, Stewart JP, Hashash YMA, Matasovic N, Pyke R, Wang Z, Yang Z.Use of exact solutions of wave propagation problems to guide implementa-tion of nonlinear, time-domain ground response analysis routines. Journal ofGeotechnical and Geoenvironmental Engineering 2007;133(11):1385–99.
[21] Lai CG, Rix GJ. Simultaneous inversion of rayleigh phase velocity andattenuation for nearsurface site characterization. Atlanta, GA: Georgia Insti-tute of Technology; 1998.
[22] Lin Lawrence I-Kuei. A concordance correlation coefficient to evaluatereproducibility. Biometrics 1989;45(1):255–68.
[23] Mazzoni S, McKenna F, Scott MH, Fenves GL. Open System for earthquakeengineering simulation user command-language. In: NEES, editor. Berkeley,CA; 2006.
[24] Menq Farn-Yuh. Dynamic properties of sandy and gravelly soils, civil andenvironmental engineering. Austin, TX: University of Texas at Austin; 2003[p. 364].
[25] Olson SM, Johnson CI. Analyzing liquefaction-induced lateral spreads usingstrength ratios. Journal of Geotechnical and Geoenvironmental Engineering2008;134(8):1035–49.
[26] Papadimitriou AG, Bouckovalas GD, Dafalias YF. Plasticity model for sandunder small and large cyclic strains. Journal of Geotechnical and Geoenvir-onmental Engineering 2001;127(11):973–83.
[27] Park D, Hashash YMA. Soil damping formulation in nonlinear time domainsite response analysis. Journal of Earthquake Engineering 2004;8(2):249–74.
[28] Park D, Hashash YMA. Evaluation of seismic site factors in the MississippiEmbayment. I. Estimation of dynamic properties. Soil Dynamics and Earth-quake Engineering 2005;25(2):133–44.
[29] Parra E. Numerical modeling of liquefaction and lateral ground deformationincluding cyclic mobility and dilation response in soil systems department ofcivil engineering. Troy, NY: Rensselaer Polytechnic Institute; 1996.
[30] Phillips C, Hashash YMA. Damping formulation for nonlinear 1D site responseanalyses. Soil Dynamics and Earthquake Engineering 2009;29(7):1143–58.
[31] Prevost JH. A simple plasticity theory for frictional cohesionless soils.International Journal of Soil Dynamics and Earthquake Engineering1985;4(1):9–17.
[32] Rauch AF, Martin II JR. EPOLLS model for predicting average displacements onlateral spreads. Journal of Geotechnical and Geoenvironmental Engineering2000;126(4):360–71.
[33] Rayleigh JWS, Lindsay RB. The theory of sound. New York: Dover; 1945.[34] Seed HB, Tokimatsu K, Harder LF, Chung RM. The influence of SPT procedures
in soil liquefaction resistance evaluations. Journal of the Geotechnical Engi-neering Division, American Society of Civil Engineers 1985;111(12):1425–45.
[35] Shamoto Yasuhiro, Zhang Jian-Min, Tokimatsu Kohji. New charts for predict-ing large residual post-liquefaction ground deformation. Soil Dynamics andEarthquake Engineering 1998;17:427–38.

C. Phillips et al. / Soil Dynamics and Earthquake Engineering 42 (2012) 161–176176
[36] Sharp Michael K, Dobry Ricardo, Tarek Abdoun AMASCE. Liquefactioncentrifuge modeling of sands of different permeability. Journal of Geotechni-cal and Geoenvironmental Engineering 2003;129(12):1083–91.
[37] Taboada V.M. Centrifuge modeling of earthquake-induced lateral spreadingin sand using laminar box. PhD. thesis. Troy, NY: Rensselaer PolytechnicInstitute; (1995).
[38] Taboada-Urtuzuastegui V, Dobry R. Centrifuge modeling of earthquake-induced lateral spreading in sand. Journal of Geotechnical and Geoenviron-mental Engineering 1998;124(12):1195–206.
[39] Yang Z. Numerical modeling of earthquake site response including dilationand liquefaction, civil and environmental engineering. New York: ColumbiaUniversity; 2000.
[40] Yang Z, Elgamal A. Influence of permeability on liquefaction-induced sheardeformation. Journal of Engineering Mechanics, ASCE 2002;128(7):720–9.
[41] Yang Z, Elgamal A, Parra E. A computational model for cyclic mobility and
associated shear deformation. Journal of Geotechnical and Geoenvironmental
Engineering 2003;129(12):1119–27.[42] Youd TL, Hansen CM, Bartlett SF. Revised multilinear regression equations for
prediction of lateral spread displacement. Journal of Geotechnical and
Geoenvironmental Engineering 2002;128(12):1007–17.[43] Youd TL, Perkins DM. Mapping liquefaction-induced ground failure potential.
Journal of the Geotechnical Engineering Division, American Society of Civil
Engineers 1987;104(GT4):433–46.[44] Zhang G, Robertson PK, Brachman RWI. Estimating liquefaction-induced lateral
displacements using the standard penetration test or cone penetration test.
Journal of Geotechnical and Geoenvironmental Engineering 2004;130(8):861–71.
Related Documents