-by Julius Augustine ABC 2012

Significance of significance testing
Jul 17, 2015
Welcome message from author
This document is posted to help you gain knowledge. Please leave a comment to let me know what you think about it! Share it to your friends and learn new things together.
Transcript

-by Julius Augustine
ABC 2012
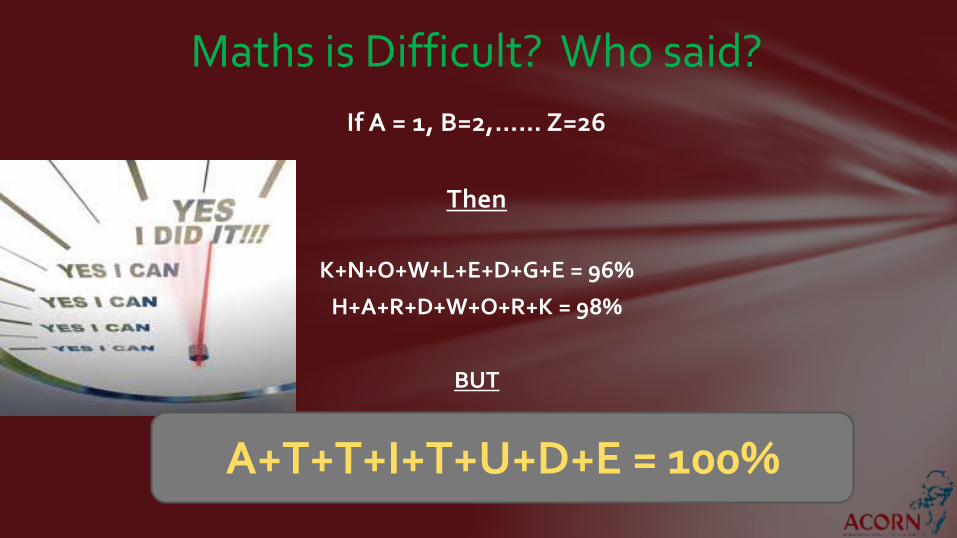
Maths is Difficult? Who said?
If A = 1, B=2,…… Z=26
Then
K+N+O+W+L+E+D+G+E = 96%
H+A+R+D+W+O+R+K = 98%
BUT
A+T+T+I+T+U+D+E = 100%

2Get and 2Give creates many problems
Multiply them by 2 and you get
4Get and 4Give… solves many problems doesn’t it?

First a Recap of your yester years

First there was the Universe or Population

The qualities or characteristics (e.g. awareness of brands, frequency of shopping, attitudes towards different banks etc.) of the population that we are interested in
Then we wanted to study the Parameters of the Universe / Population

So we took a Sample
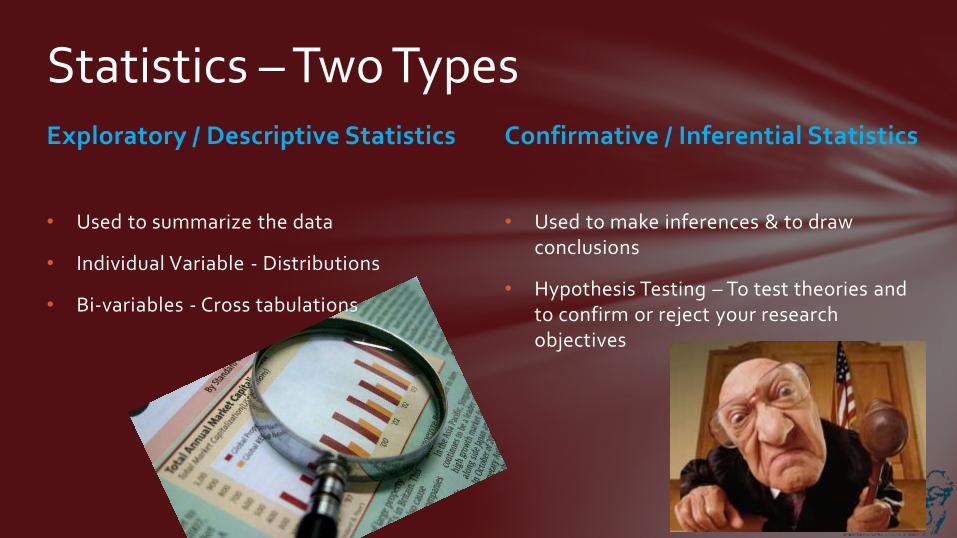
Confirmative / Inferential Statistics
• Used to make inferences & to draw conclusions
• Hypothesis Testing – To test theories and to confirm or reject your research objectives
Exploratory / Descriptive Statistics
• Used to summarize the data
• Individual Variable - Distributions
• Bi-variables - Cross tabulations
Statistics – Two Types

Descriptive Statistics
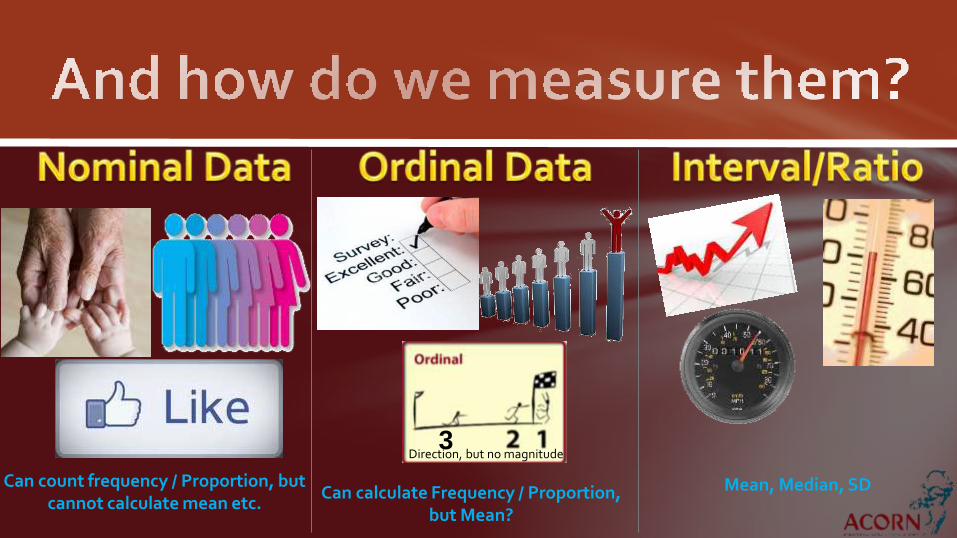
Can count frequency / Proportion, but cannot calculate mean etc.
3
Can calculate Frequency / Proportion, but Mean?
Direction, but no magnitude
Mean, Median, SD

So to Summarise the Statistic to be used
Nominal
Frequency&
Proportions
Ordinal
Frequency&
ProportionsSometimes Means
Interval/Ratio
Mean Median
Standard Deviation

Inferential Statistics

How do we infer? – Let’s enter the Courtroom
Researchers –>
Provide Motive, Forensic report (sig test)

Hypothesis: Innocent until proved guilty
Ho = No difference in means/proportions
H1 = There is enough (95% confident) evidence to say that the ‘difference’ was real and not due to sampling error
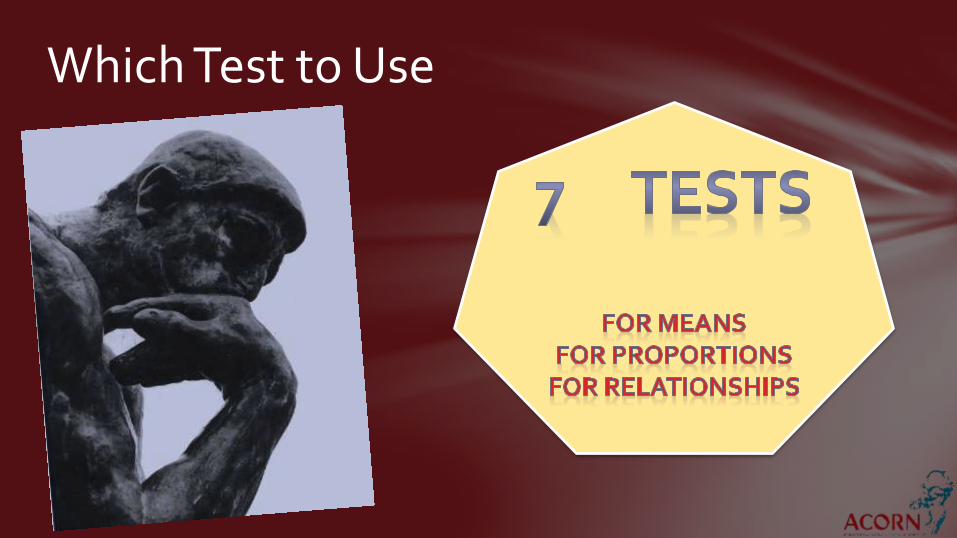
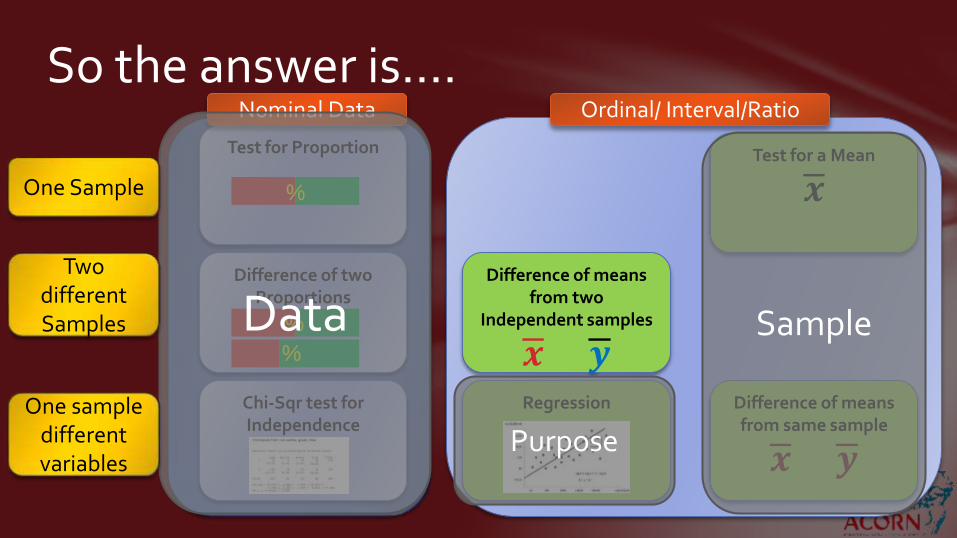
Which Test to Use
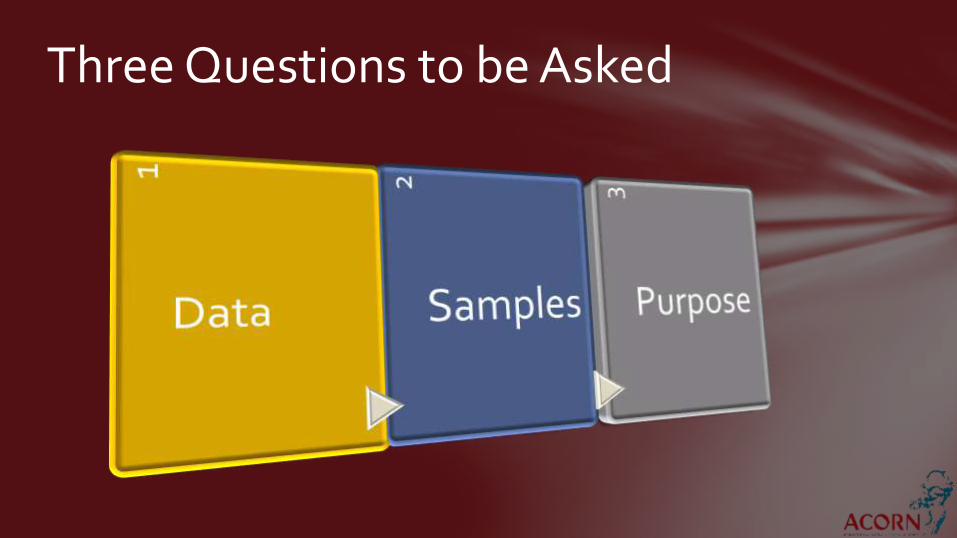
Three Questions to be Asked

Data
Test for Proportion
Difference of two Proportions
Chi-Sqr test for Independence
Test for a Mean
𝒙
Difference of means from two
Independent samples
𝒙 𝒚Difference of means from same sample
𝒙 𝒚
Regression
%
%
%
Nominal Data Interval/Ratio
Ordinal Data

Sample
One SampleTwo Independent
Samples
One Sample providingtwo measures
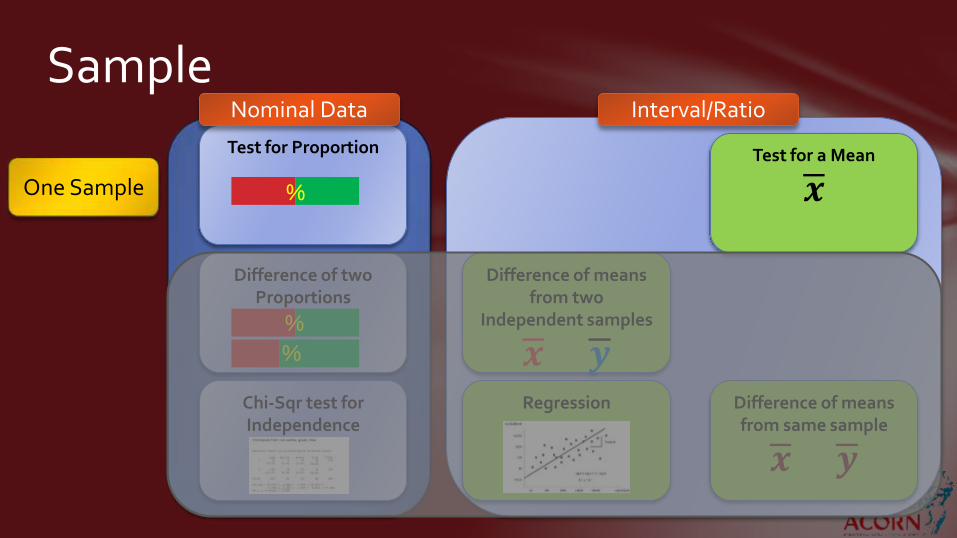
Sample
Test for Proportion
Difference of two Proportions
Chi-Sqr test for Independence
Test for a Mean
𝒙
Difference of means from two
Independent samples
𝒙 𝒚Difference of means from same sample
𝒙 𝒚
Regression
%
%
%
Nominal Data Interval/Ratio
One Sample
Sample
Test for Proportion
Difference of two Proportions
Chi-Sqr test for Independence
Test for a Mean
𝒙
Difference of means from two
Independent samples
𝒙 𝒚Difference of means from same sample
𝒙 𝒚
Regression
%
%
%
Nominal Data Interval/Ratio
Two independent
Samples
Sample
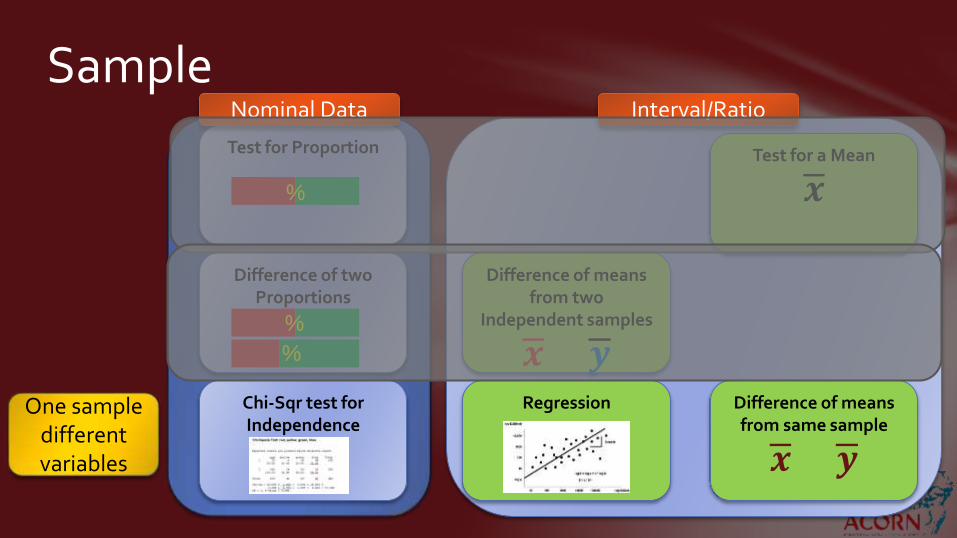
Test for Proportion
Difference of two Proportions
Chi-Sqr test for Independence
Test for a Mean
𝒙
Difference of means from two
Independent samples
𝒙 𝒚Difference of means from same sample
𝒙 𝒚
Regression
%
%
%
Nominal Data Interval/Ratio
One sample different variables
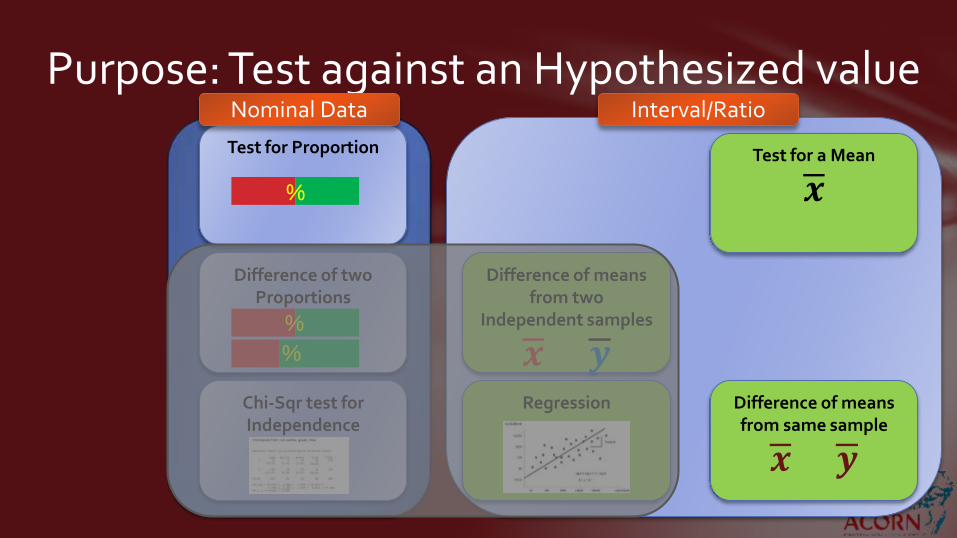
Purpose: Test against an Hypothesized value
Test for Proportion
Difference of two Proportions
Chi-Sqr test for Independence
Test for a Mean
𝒙
Difference of means from two
Independent samples
𝒙 𝒚Difference of means from same sample
𝒙 𝒚
Regression
%
%
%
Nominal Data Interval/Ratio

Purpose: Comparing two statistics
Test for Proportion
Difference of two Proportions
Chi-Sqr test for Independence
Test for a Mean
𝒙
Difference of means from two
Independent samples
𝒙 𝒚Difference of means from same sample
𝒙 𝒚
Regression
%
%
%
Nominal Data Interval/Ratio
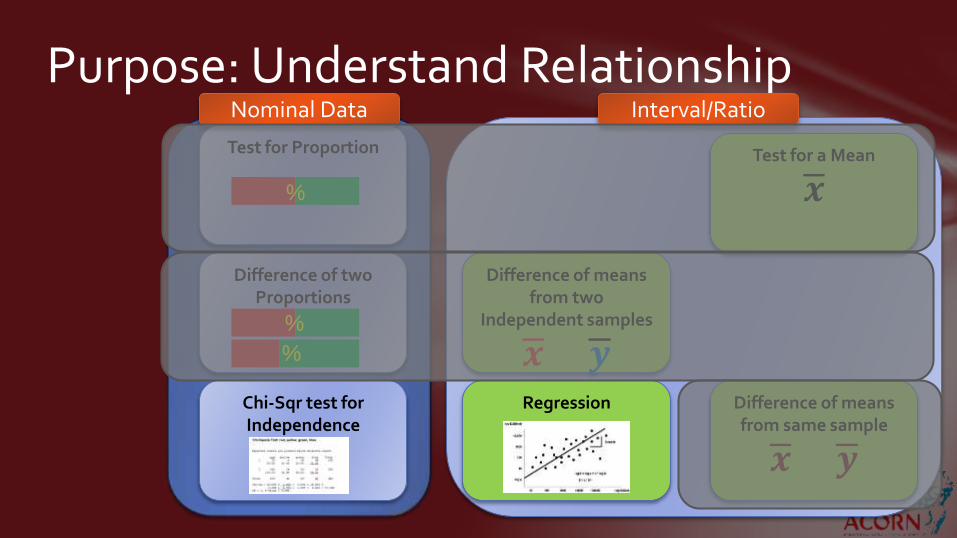
Purpose: Understand Relationship
Test for Proportion
Difference of two Proportions
Chi-Sqr test for Independence
Test for a Mean
𝒙
Difference of means from two
Independent samples
𝒙 𝒚Difference of means from same sample
𝒙 𝒚
Regression
%
%
%
Nominal Data Interval/Ratio
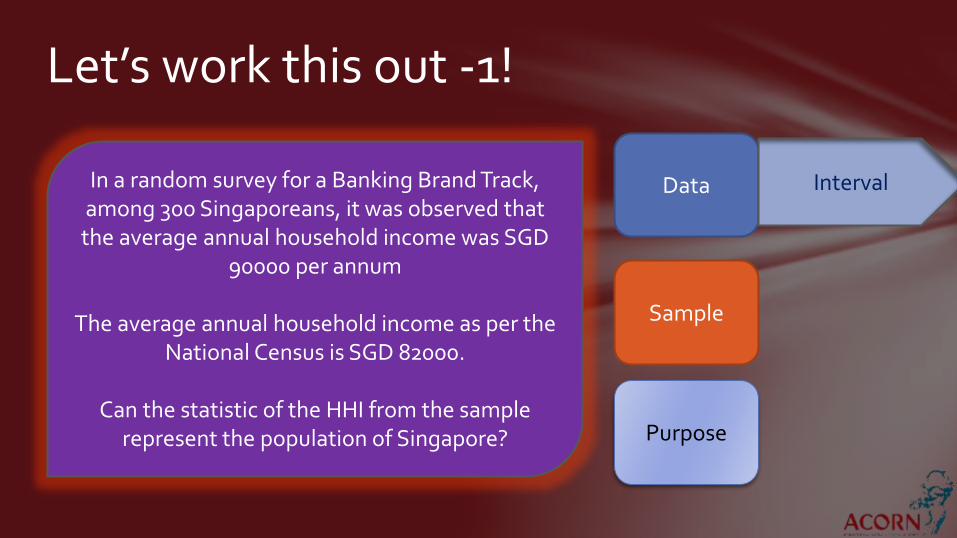
Let’s work this out -1!
In a random survey for a Banking Brand Track, among 300 Singaporeans, it was observed that the average annual household income was SGD
90000 per annum
The average annual household income as per the National Census is SGD 82000.
Can the statistic of the HHI from the sample represent the population of Singapore?
Data
Sample
Purpose
Interval

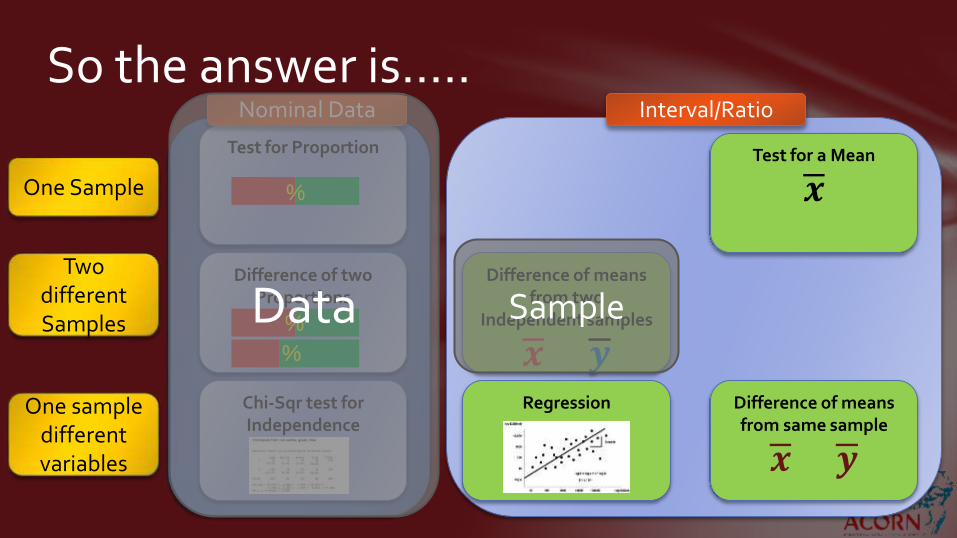
So the answer is…..
Test for Proportion
Difference of two Proportions
Chi-Sqr test for Independence
Test for a Mean
𝒙
Difference of means from two
Independent samples
𝒙 𝒚Difference of means from same sample
𝒙 𝒚
Regression
%
%
%
Nominal Data Interval/Ratio
Data
One Sample
Two different Samples
One sample different variables
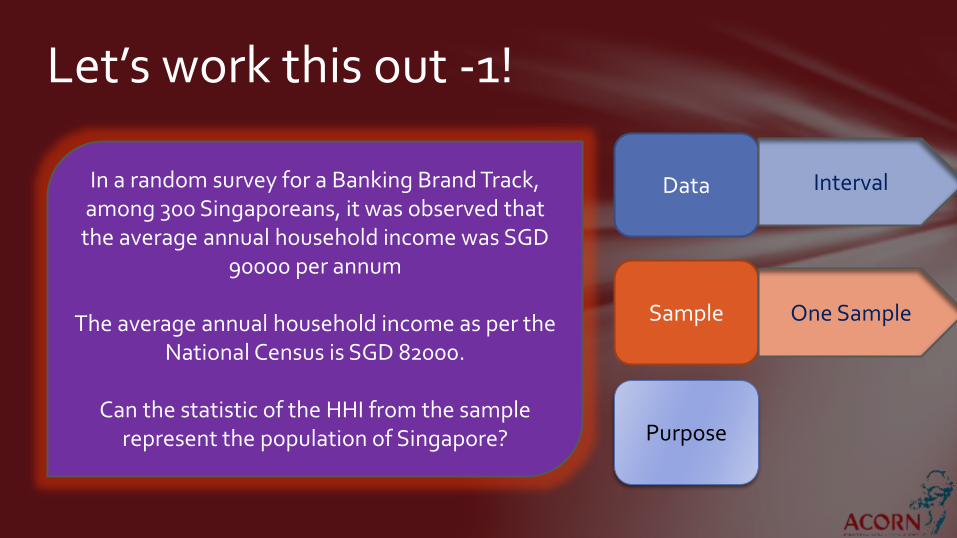
Let’s work this out -1!
In a random survey for a Banking Brand Track, among 300 Singaporeans, it was observed that the average annual household income was SGD
90000 per annum
The average annual household income as per the National Census is SGD 82000.
Can the statistic of the HHI from the sample represent the population of Singapore?
Data
Sample
Purpose
Interval
One Sample
So the answer is…..
Test for Proportion
Difference of two Proportions
Chi-Sqr test for Independence
Test for a Mean
𝒙
Difference of means from two
Independent samples
𝒙 𝒚Difference of means from same sample
𝒙 𝒚
Regression
%
%
%
Nominal Data Interval/Ratio
SampleData
One Sample
Two different Samples
One sample different variables

Let’s work this out -1!
In a random survey for a Banking Brand Track, among 300 Singaporeans, it was observed that the average annual household income was SGD
90000 per annum
The average annual household income as per the National Census is SGD 82000.
Can the statistic of the HHI from the sample represent the population of Singapore?
Data
Sample
Purpose
Interval
One Sample
Test for Mean

So the answer is…..
Test for Proportion
Difference of two Proportions
Chi-Sqr test for Independence
Test for a Mean
𝒙
Difference of means from two
Independent samples
𝒙 𝒚Difference of means from same sample
𝒙 𝒚
Regression
%
%
%
Nominal Data Interval/Ratio
SampleData
Purpose
One Sample
Two different Samples
One sample different variables
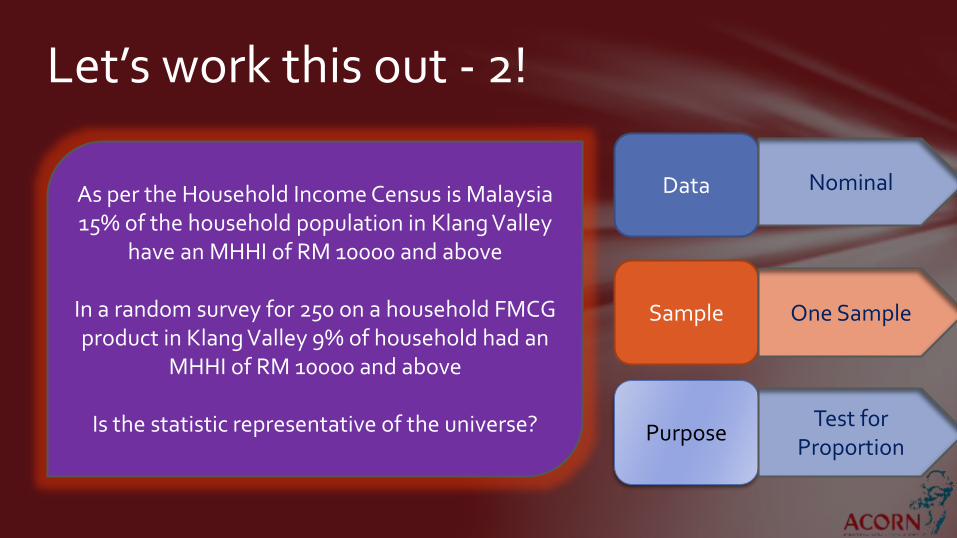
Let’s work this out - 2!
As per the Household Income Census is Malaysia 15% of the household population in Klang Valley
have an MHHI of RM 10000 and above
In a random survey for 250 on a household FMCG product in Klang Valley 9% of household had an
MHHI of RM 10000 and above
Is the statistic representative of the universe?
Data
Sample
Purpose
Nominal
One Sample
Test for Proportion

So the answer is….
Test for Proportion
Difference of two Proportions
Chi-Sqr test for Independence
Test for a Mean
𝒙
Difference of means from two
Independent samples
𝒙 𝒚Difference of means from same sample
𝒙 𝒚
Regression
%
%
%
Nominal Data Interval/Ratio
Sample Data
Purpose
One Sample
Two different Samples
One sample different variables
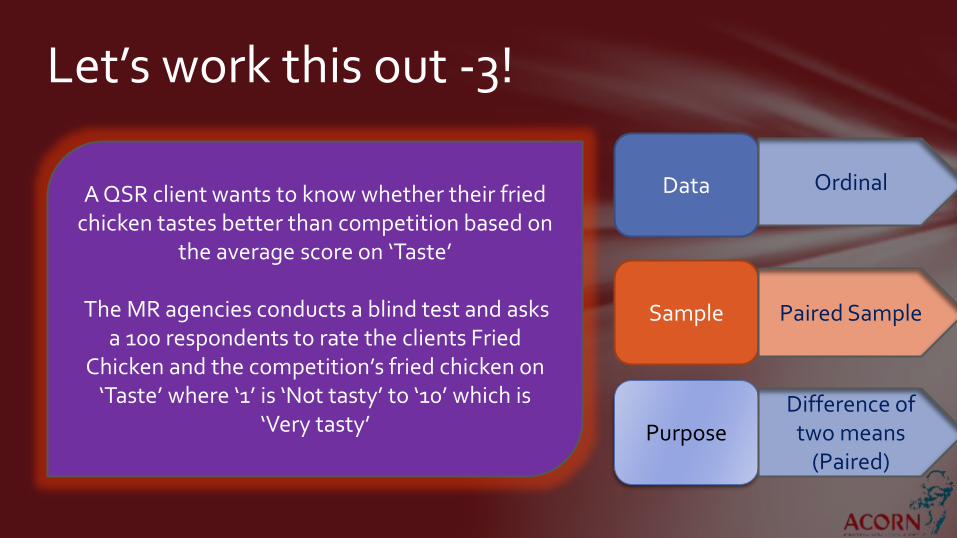
Let’s work this out -3!
A QSR client wants to know whether their fried chicken tastes better than competition based on
the average score on ‘Taste’
The MR agencies conducts a blind test and asks a 100 respondents to rate the clients Fried
Chicken and the competition’s fried chicken on ‘Taste’ where ‘1’ is ‘Not tasty’ to ‘10’ which is
‘Very tasty’
Data
Sample
Purpose
Ordinal
Paired Sample
Difference of two means
(Paired)

So the answer is….
Test for Proportion
Difference of two Proportions
Chi-Sqr test for Independence
Test for a Mean
𝒙
Difference of means from two
Independent samples
𝒙 𝒚Difference of means from same sample
𝒙 𝒚
Regression
%
%
%
Nominal Data Ordinal/Interval/Ratio
SampleData
Purpose
One Sample
Two different Samples
One sample different variables
Sample
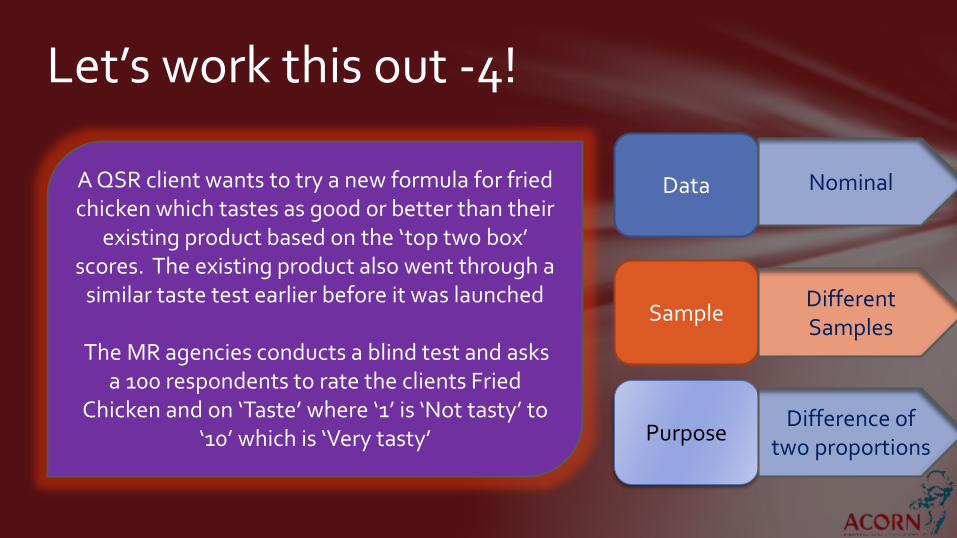
Let’s work this out -4!
A QSR client wants to try a new formula for fried chicken which tastes as good or better than their
existing product based on the ‘top two box’ scores. The existing product also went through a
similar taste test earlier before it was launched
The MR agencies conducts a blind test and asks a 100 respondents to rate the clients Fried
Chicken and on ‘Taste’ where ‘1’ is ‘Not tasty’ to ‘10’ which is ‘Very tasty’
Data
Sample
Purpose
Nominal
Different Samples
Difference of two proportions

So the answer is….
Test for Proportion
Difference of two Proportions
Chi-Sqr test for Independence
Test for a Mean
𝒙
Difference of means from two
Independent samples
𝒙 𝒚Difference of means from same sample
𝒙 𝒚
Regression
%
%
%
Nominal Data Interval/Ratio
Sample
Data
Purpose
One Sample
Two different Samples
One sample different variables

Let’s work this out -5!
A client wants to understand the effect of advertising on purchase intention among their
target segment
The MR agency looks at the mean score of PI intention scores where ‘1’ stands for ‘Definitely
not buy’ and ‘7’ stands for ‘Definitely buy’ for those who said they were ‘Aware’ of the ad v/s those who said they ‘Weren’t Aware’ of the ad
(based on a photopic show card)
Data
Sample
Purpose
Ordinal
Same Sample but mutually exclusive
(independent)
Difference of two means
So the answer is….
Test for Proportion
Difference of two Proportions
Chi-Sqr test for Independence
Test for a Mean
𝒙
Difference of means from two
Independent samples
𝒙 𝒚Difference of means from same sample
𝒙 𝒚
Regression
%
%
%
Nominal Data Ordinal/ Interval/Ratio
SampleData
Purpose
One Sample
Two different Samples
One sample different variables

Let’s work this out -6!
A client wants to understand the effect of age on purchase intention among their target segment
in a survey
i.e. Is there a relationship between age and purchase intention
PI measured on a 1 to 7 PI scale
Data
Sample
Purpose
Interval/Ordinal
Same Sample different variables
Relationship between Or/Int
variables

So the answer is….
Test for Proportion
Difference of two Proportions
Chi-Sqr test for Independence
Test for a Mean
𝒙
Difference of means from two
Independent samples
𝒙 𝒚Difference of means from same sample
𝒙 𝒚
Regression
%
%
%
Nominal Data Ordinal/ Interval/Ratio
Sample
Data Purpose
One Sample
Two different Samples
One sample different variables
Purpose

Let’s work this out -7!
A client wants to understand the effect of gender on purchase intention among their target
segment in a survey
i.e. Is there a relationship between gender and purchase intention
PI measured on a 1 to 7 PI scale
Data
Sample
Purpose
Nominal
Same Sample different variables
Relationship between 2
nominal variables

So the answer is….
Test for Proportion
Difference of two Proportions
Chi-Sqr test for Independence
Test for a Mean
𝒙
Difference of means from two
Independent samples
𝒙 𝒚Difference of means from same sample
𝒙 𝒚
Regression
%
%
%
Nominal Data Ordinal/ Interval/Ratio
Sample
Data
One Sample
Two different Samples
One sample different variables

Numerous other Tests

Where are these tests called?
Test for Proportion
Difference of two Proportions
Chi-Sqr test for Independence
Test for a Mean
𝒙
Difference of means from two
Independent samples
𝒙 𝒚Difference of means from same sample
𝒙 𝒚
Regression
%
%
%
Nominal Data Ordinal/ Interval/Ratio
One Sample
Two different Samples
One sample different variables
Z Test t-Test n<30Z-Test n≥30
t-Test n<30Z-Test n≥30
t-Test n<30Z-Test n≥30
Z Test

Let’s get Practical - 1
In a dipstick survey of 14 Males and 13 Females for a particular yoghurt, we need to check whether there is any difference by Gender in terms
of Purchase intention
PI measured on a scale of 7
Data
Sample
Purpose
Ordinal
Independent Samples
Difference between two
means
Difference of means from two
Independent samples
𝒙 𝒚
Null Hypothesis?
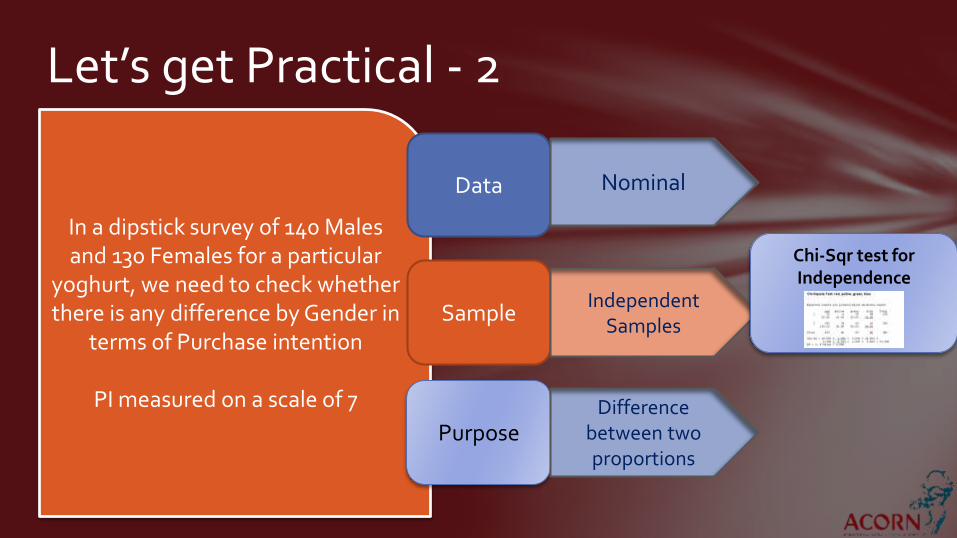
Let’s get Practical - 2
In a dipstick survey of 140 Males and 130 Females for a particular
yoghurt, we need to check whether there is any difference by Gender in
terms of Purchase intention
PI measured on a scale of 7
Data
Sample
Purpose
Nominal
Independent Samples
Difference between two proportions
Chi-Sqr test for Independence
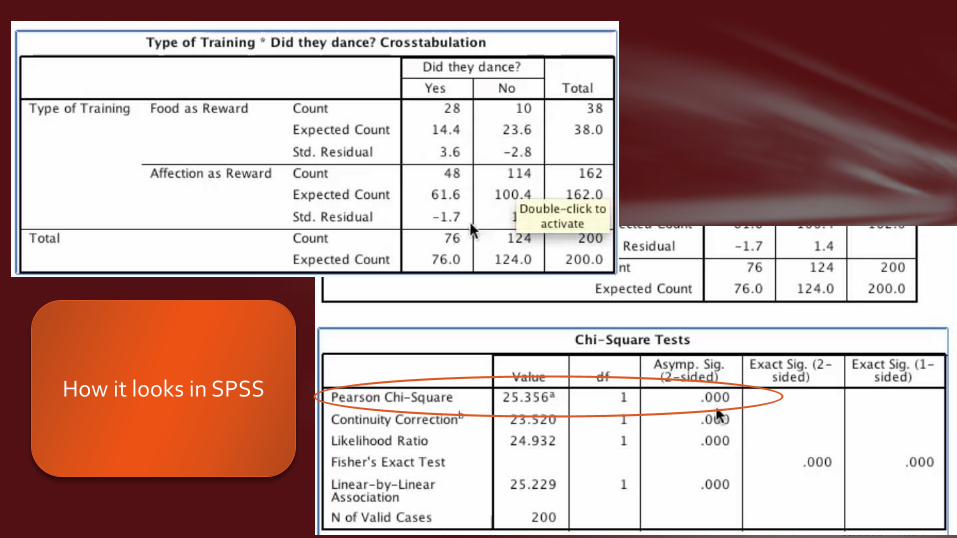
How it looks in SPSS
Let’s get Practical - 3
A sample of 201 children were subjected to a blind taste for UHT
Milk A and UHT Milk B. Their response on Likeablity of each
Pizza was measured monadicallyon a scale of 3
Data
Sample
Purpose
Ordinal
Same (Paired) Sample
Difference between two means (Paired
Sample)
Null Hypothesis?
Difference of means from same sample
𝒙 𝒚

Let’s get Practical - 4
A sample of 106 males in the age group of 18-45 were shown a car in a Car Clinic and asked whether they
would like to purchase the car. PI was measured on a 5 point scale.
Client suspected that older the male, the better their chance of
buying the car. Can the researcher validate this hypothesis?
Data
Sample
Purpose
Interval/Ordinal
Same (Paired) Sample
Finding out relationship between two variables (same
guys)
Null Hypothesis?
Regression
The one we very often use…
Now let’s do it…

The one we very often use is….
Difference of two Proportions
Difference of means from two
Independent samples
𝒙 𝒚%
%
Nominal Data Ordinal/ Interval/Ratio
One Sample
Two different Samples
One sample different variables
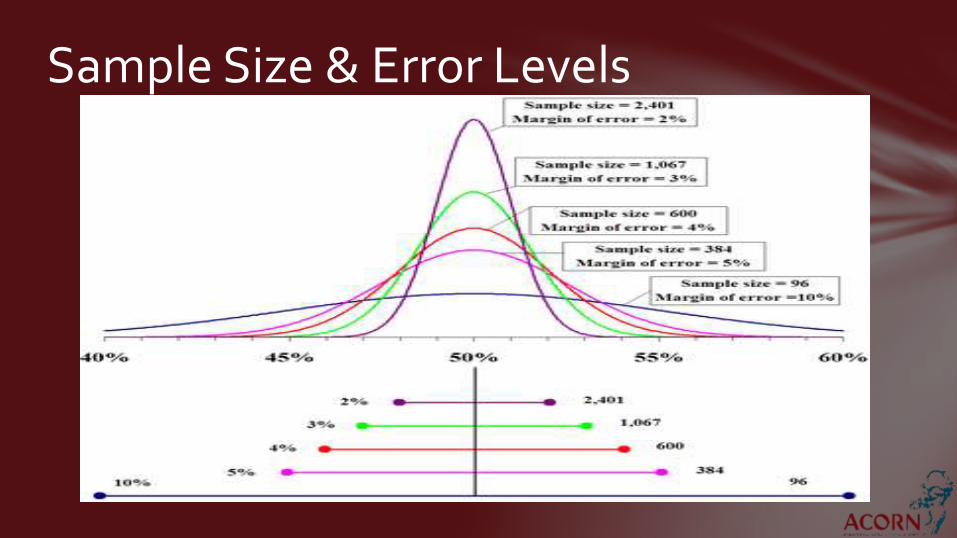
Sample Size & Error Levels


Exercise 1 – Brand Health Trend
Brand Health of Brand X Q1 -09 Q2 -09 Q3 -09 Q4 -09
Sample Size 250 276 236 280
% of Respondents
Brand Top of Mind Awareness 10 15 18 20
Brand Spontaneous Awareness 50 48 55 60
Brand Consideration 35 30 45 45
Most Often Used Brand 10 12 15 13

Exercise 2 – Taste Test
Taste Test Client Yoghurt ANearest Competitor
Yoghurt Client Yoghurt B
Sample Size 200 200 200
%
Appeal (Like+Like Very Much) 78 80 65
Liking (Like+Like Very Much) 75 78 68
Texture (Just Right) 65 70 58
Taste (Like+Like Very Much) 89 75 70
Intention to Buy (May Buy+Definitely Buy) 70 72 68
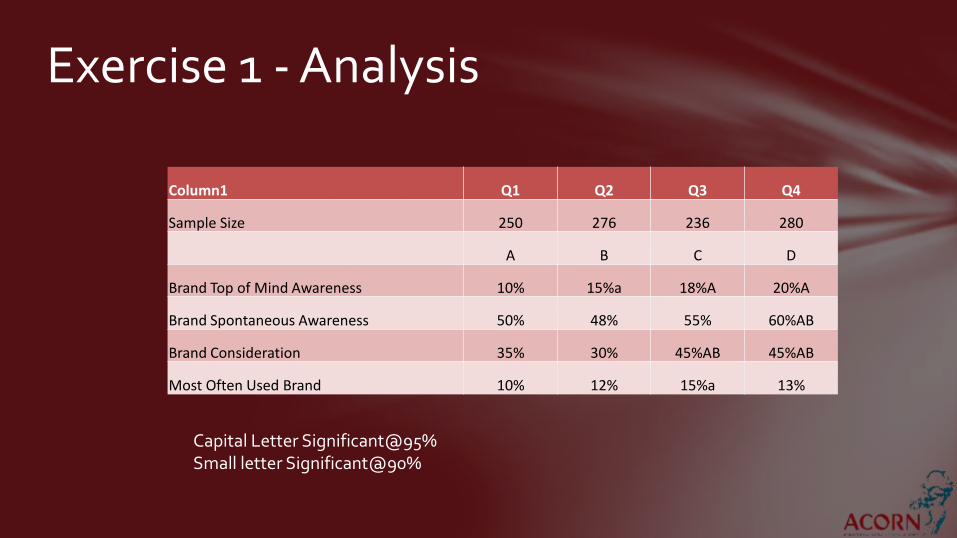
Exercise 1 - Analysis
Column1 Q1 Q2 Q3 Q4
Sample Size 250 276 236 280
A B C D
Brand Top of Mind Awareness 10% 15%a 18%A 20%A
Brand Spontaneous Awareness 50% 48% 55% 60%AB
Brand Consideration 35% 30% 45%AB 45%AB
Most Often Used Brand 10% 12% 15%a 13%
Capital Letter Significant@95%Small letter Significant@90%
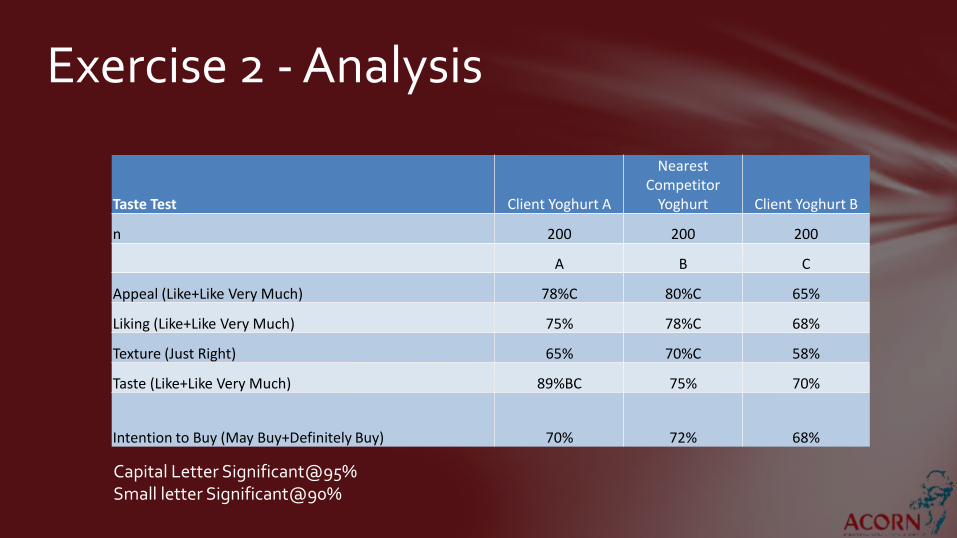
Exercise 2 - Analysis
Taste Test Client Yoghurt A
Nearest Competitor
Yoghurt Client Yoghurt B
n 200 200 200
A B C
Appeal (Like+Like Very Much) 78%C 80%C 65%
Liking (Like+Like Very Much) 75% 78%C 68%
Texture (Just Right) 65% 70%C 58%
Taste (Like+Like Very Much) 89%BC 75% 70%
Intention to Buy (May Buy+Definitely Buy) 70% 72% 68%
Capital Letter Significant@95%Small letter Significant@90%
Related Documents